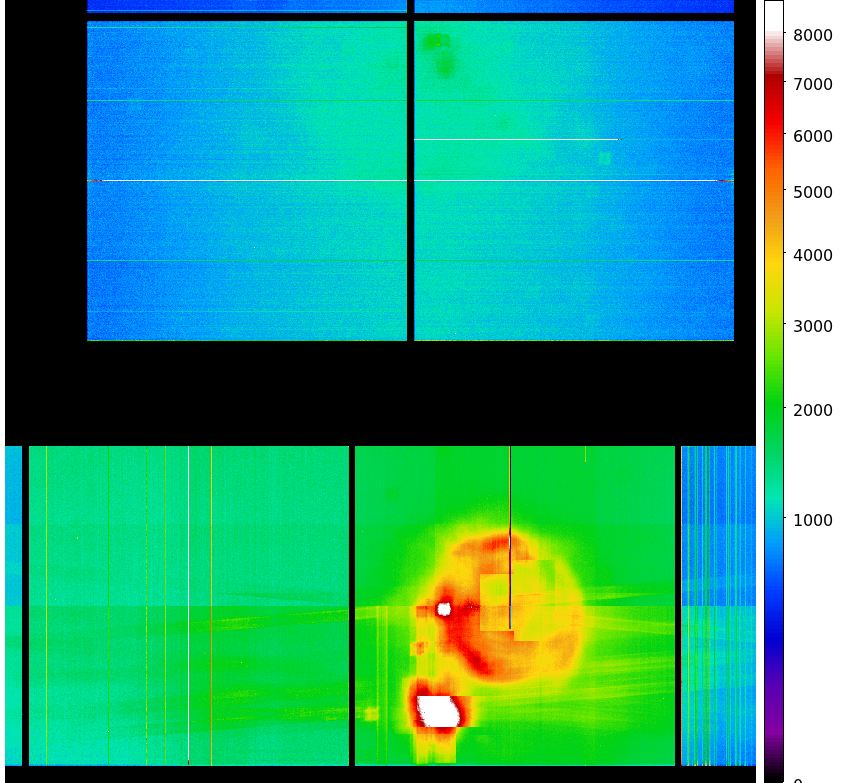
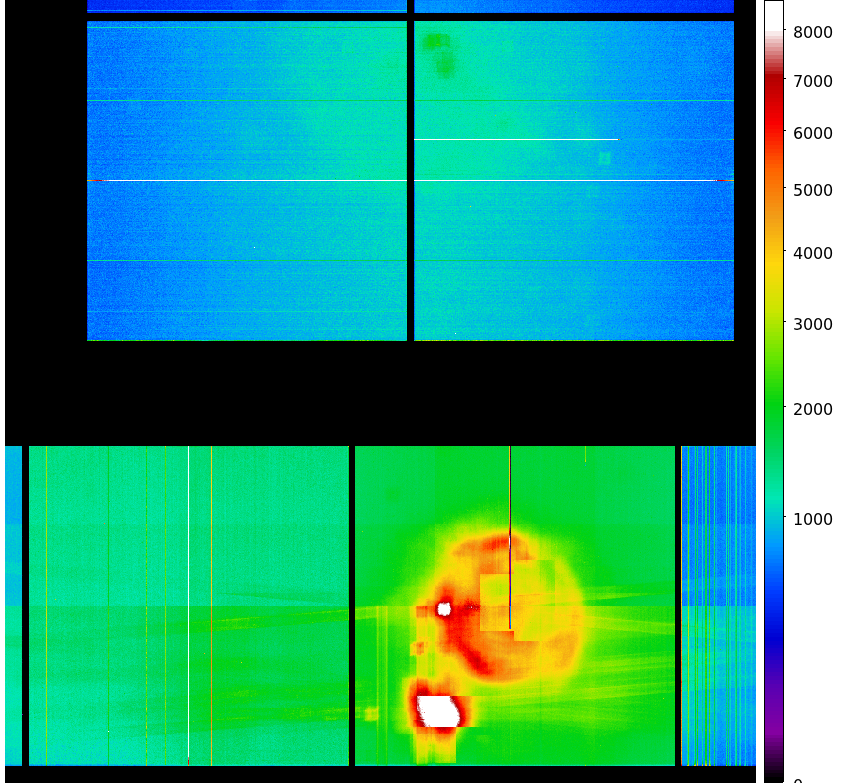
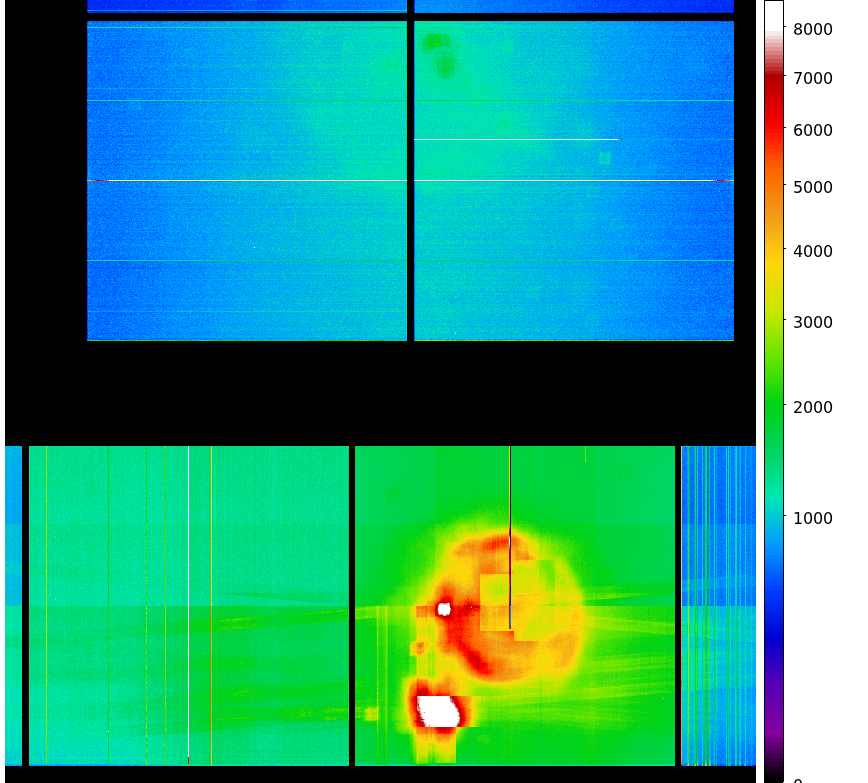
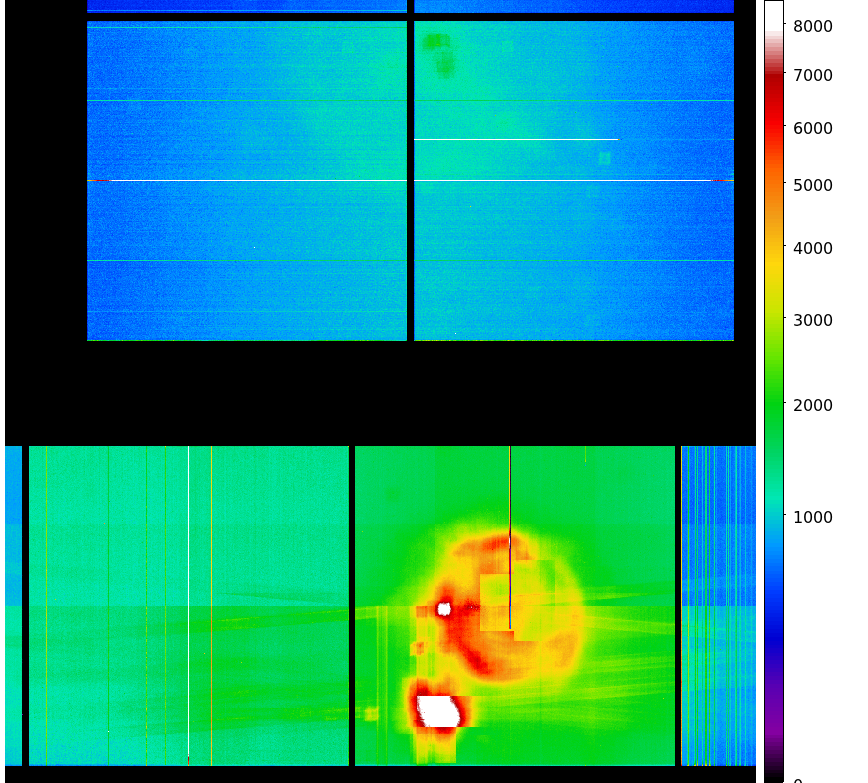
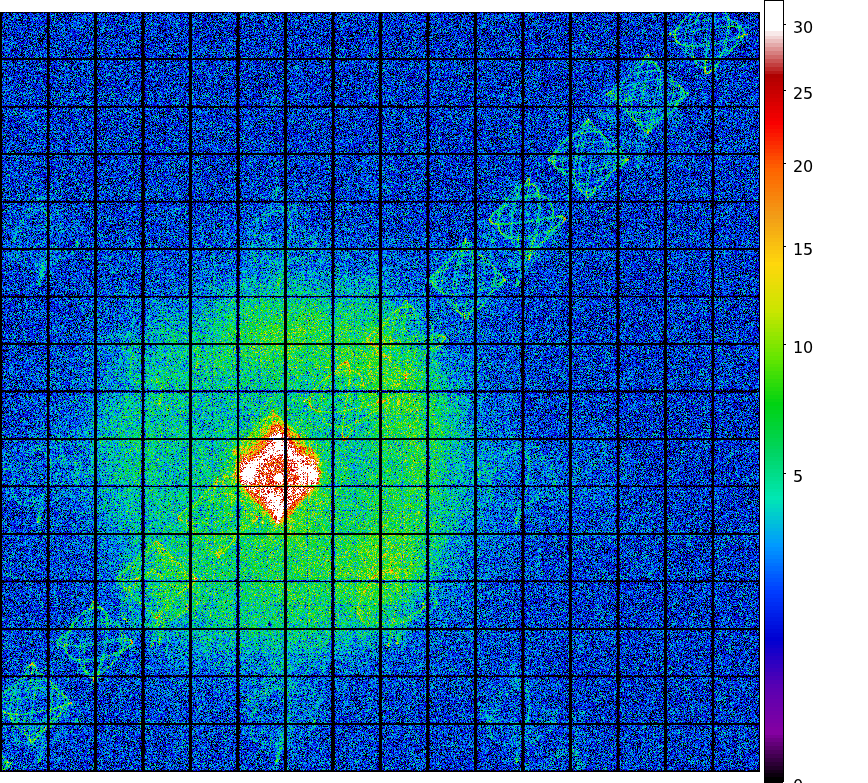
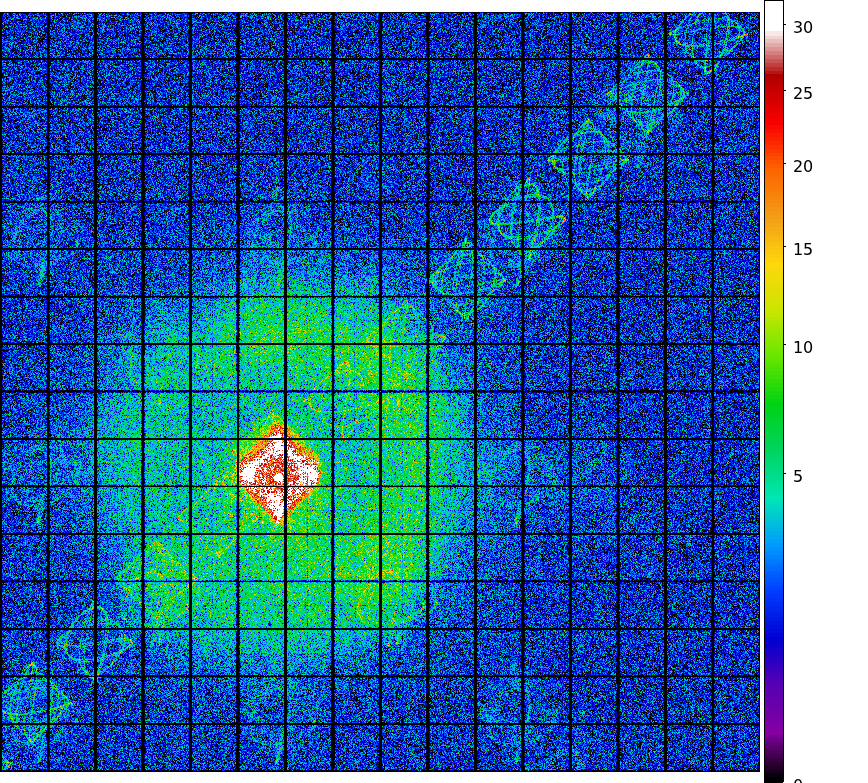
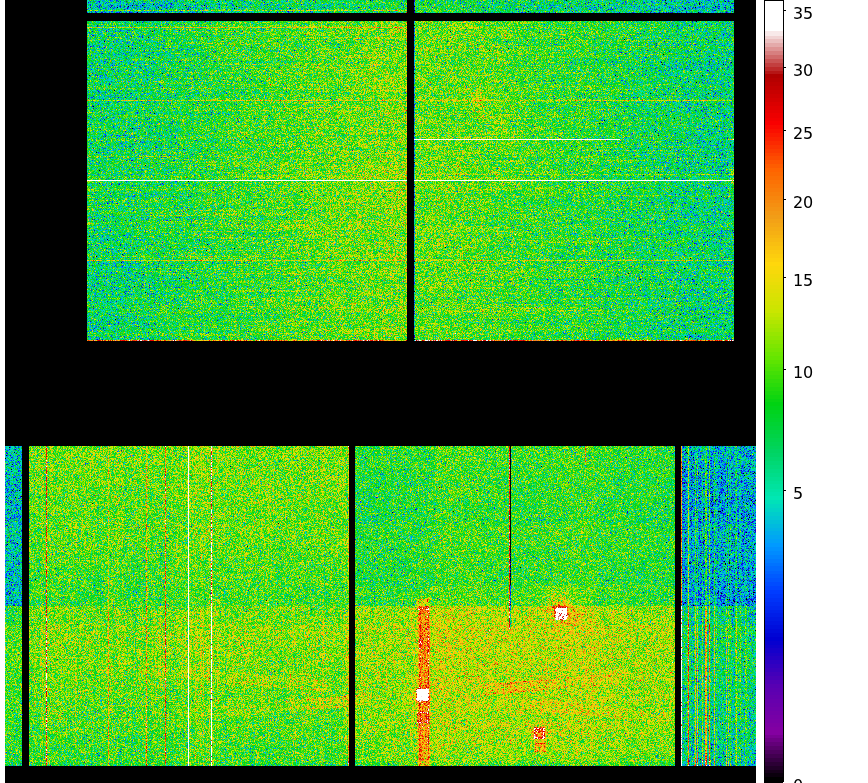
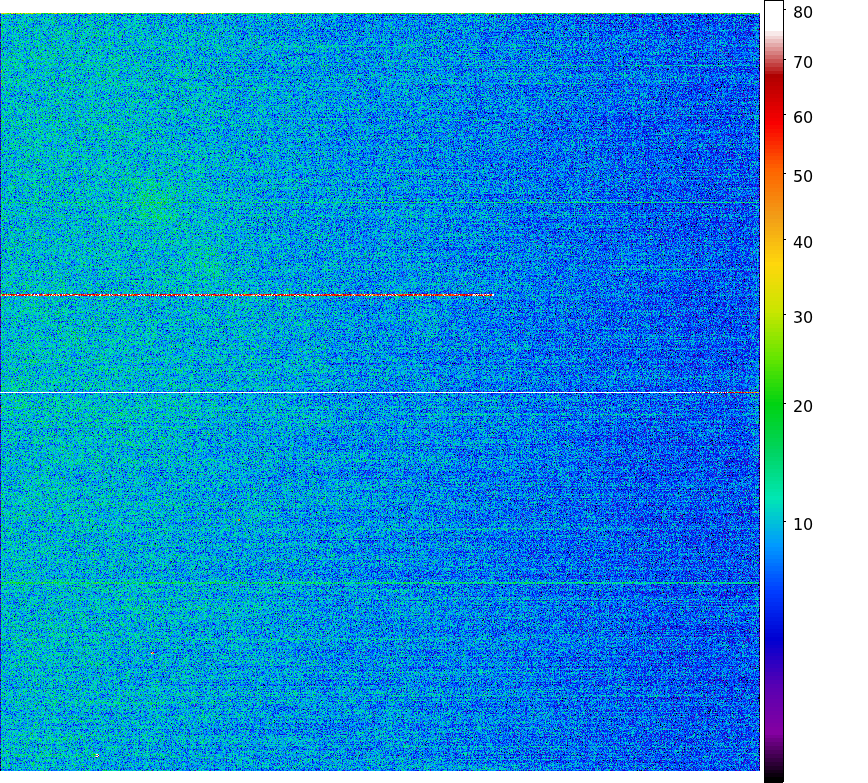
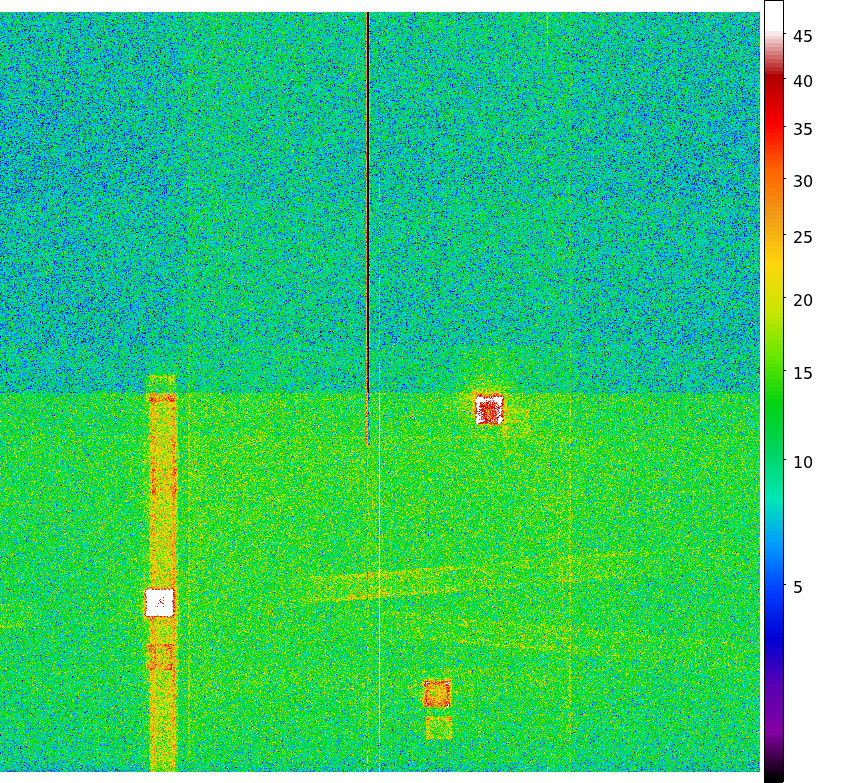
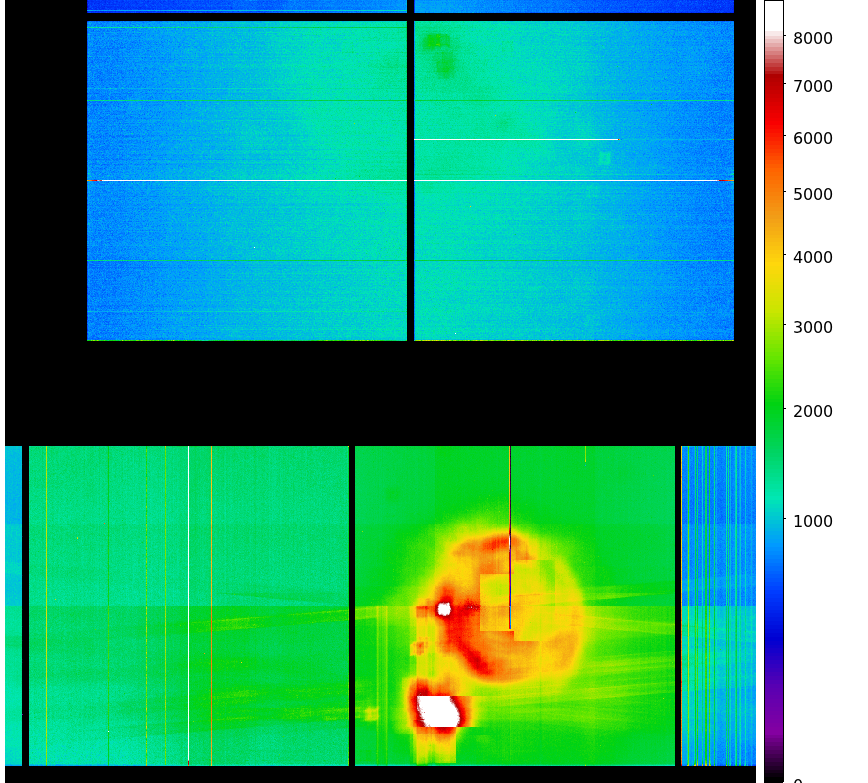
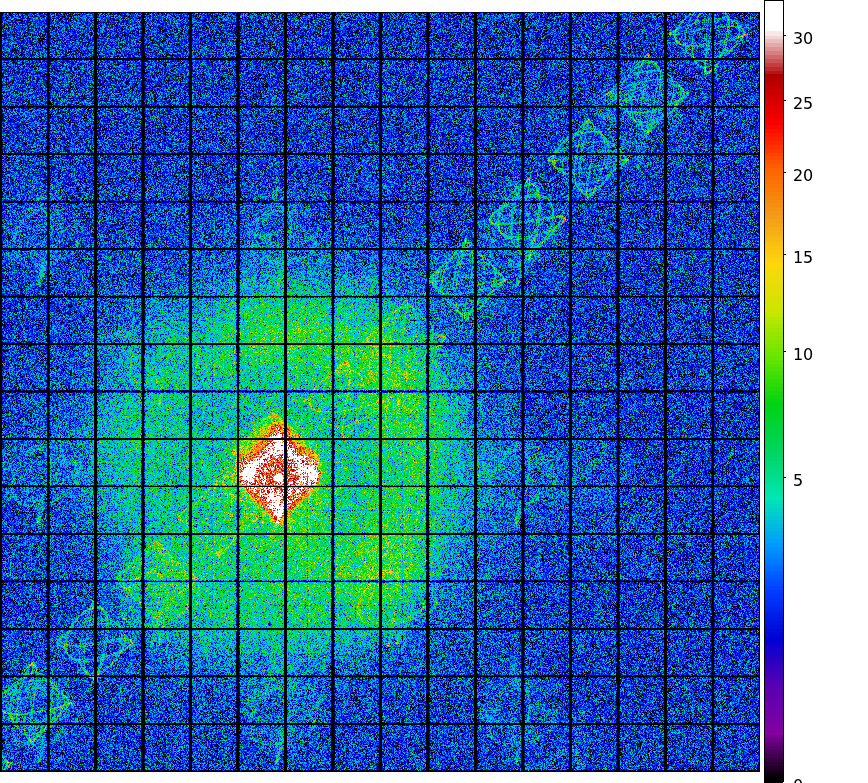
- ACIS DOSE registered-photon-map
The steps we took to compute the dose map are;
- Level 1 Event files for a specified month are obtained from archive.
- Image data including I2, I3, S2, S3 CCDs are extracted from all event files.
- All the extracted image data were merged to create a month long exposure map for the month.
- The exposure map is opened with ds9, and check a distribution of count rates against energy.
From this, estimate the upper threshold value. Any events beyond this upper threshold are
assumed erroneous events such as bad pixels.
- Using this upper threshold, the data is filtered, and create a cleaned exposure map for the month.
- The exposure map from each month from the Sep 1999 is added up to create a cumulative exposure
map for each month.
- Using fimgstatistic, we compute count rate statistics for each CCDs.
- For observations with high data drop rates (e.g., Crab nebula, Cas A), we corrected the
observations by adding events.
Note: Counts and RMS's of Cumulative maps are lower than the previous months. This is because we excluded
extreme outliers.
Please check more detail plots at Telemetered Photon Dose Trend page.
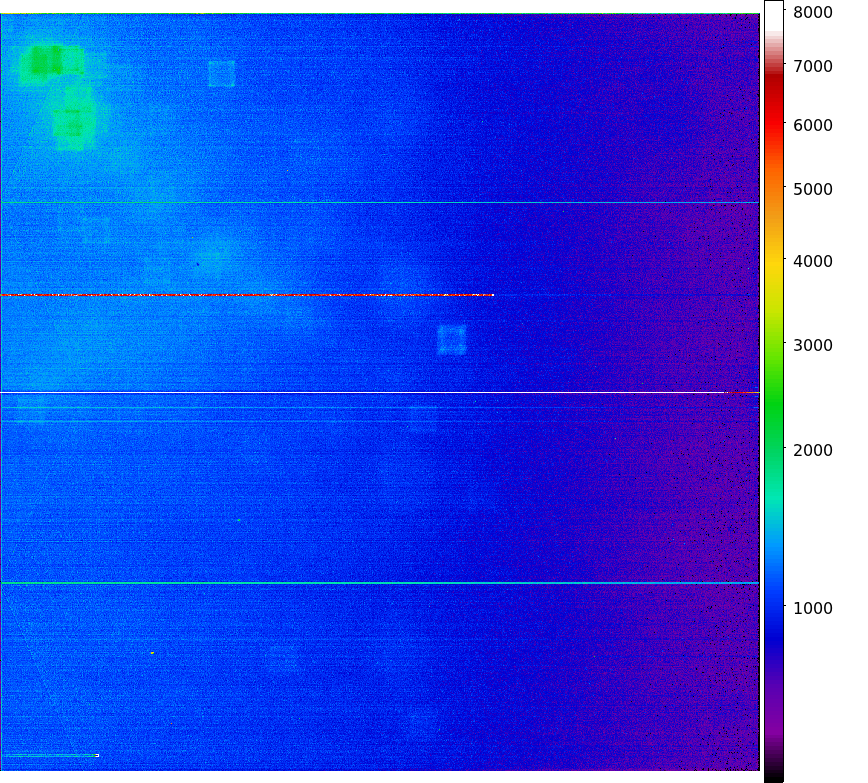
- OCT registered-photon-map in fits
Statistics:
# IMAGE     NPIX        MEAN           RMS              MIN     MAX
ACIS_oct08 6004901      7.601          11.44            0.0     620.0

 I2 node 0  262654      8.783039        3.544228        0.0      53.0
 I2 node 1  262654      9.371016        3.942193        0.0     237.0
 I2 node 2  262654      9.229095        3.600795        0.0      73.0
 I2 node 3  262654      9.063945        3.828630        0.0      62.0

 I3 node 0  262654      8.696564        3.505404        0.0      44.0
 I3 node 1  262654      9.363407        8.897332        0.0     202.0
 I3 node 2  262654      8.455702        3.365617        0.0      66.0
 I3 node 3  262654      8.446270        3.425137        0.0     148.0

 S2 node 0  262654      10.268627       3.629760        0.0     231.0
 S2 node 1  262654      10.513371       4.119386        0.0      77.0
 S2 node 2  262654      10.954469       4.131824        0.0     620.0
 S2 node 3  262654      10.533275       3.798765        0.0     612.0

 S3 node 0  262654      11.205848       6.939780        0.0     243.0
 S3 node 1  262654      11.249490       4.192224        0.0      69.0
 S3 node 2  262654      11.560183       4.952568        0.0      94.0
 S3 node 3  262654      10.368795       3.753092        0.0      51.0
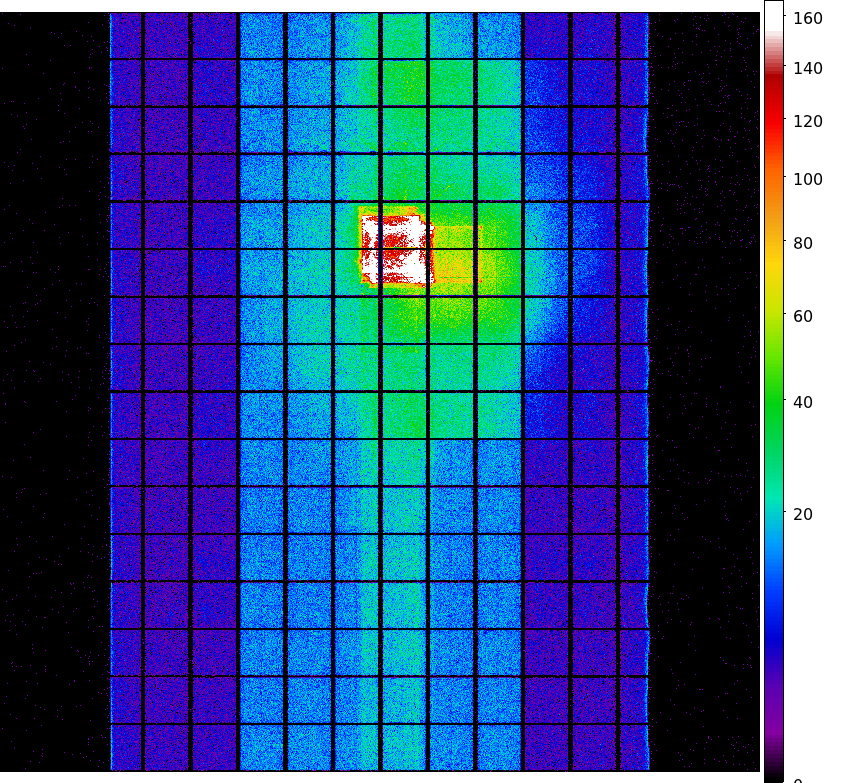
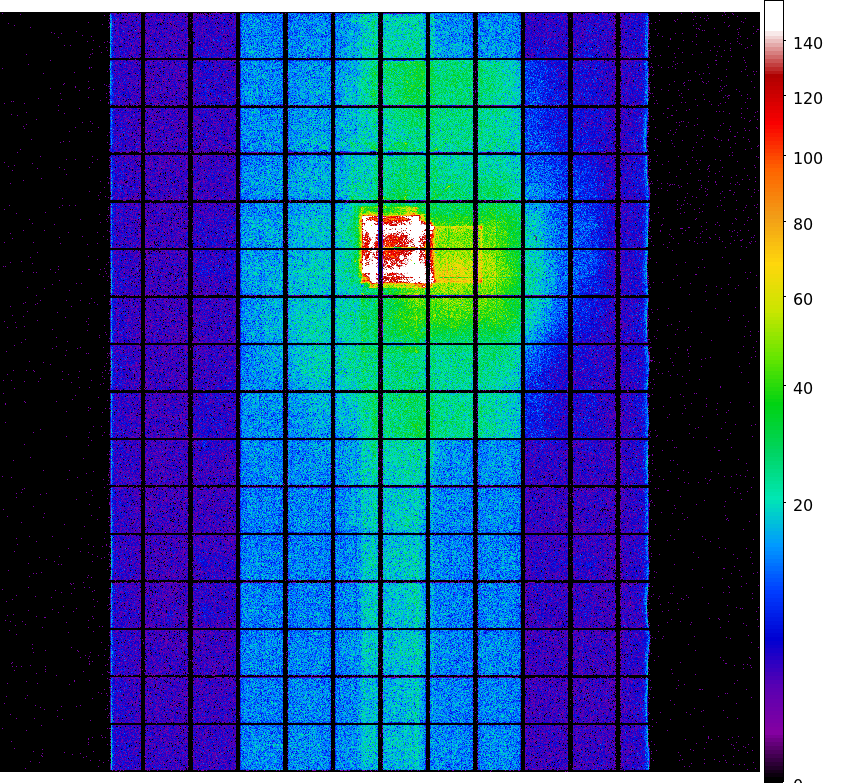
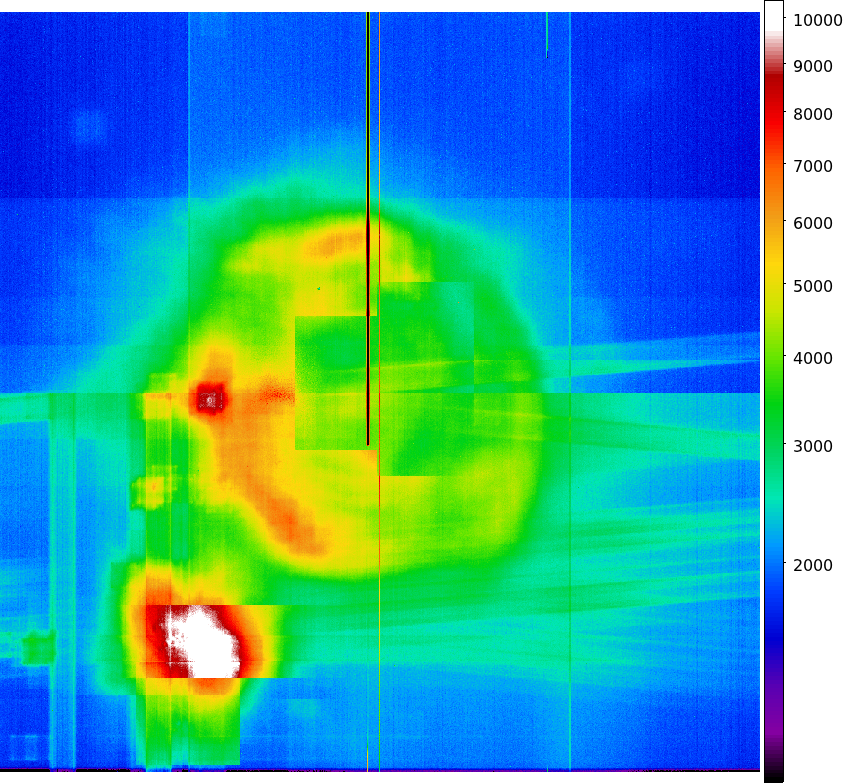
- Jul 1999 - Oct 2008 registered-photon-map in fits
Statistics:
 IMAGE        NPIX      MEAN          RMS              MIN    MAX
ACIS_total  6004901    1185.92          1624.72         0.0    72308.0

 I2 node 0  262654      921.525486      165.410117      0.0     4161.0
 I2 node 1  262654      974.599303      226.104639      0.0     15474.0
 I2 node 2  262654      989.284672      190.965450      0.0     8366.0
 I2 node 3  262654      990.850849      242.885651      0.0     27231.0

 I3 node 0  262654      1043.298495     253.074831      0.0     5535.0
 I3 node 1  262654      1082.757664     778.297035      0.0     20621.0
 I3 node 2  262654      962.705377      164.195629      0.0     4123.0
 I3 node 3  262654      951.001434      176.407771      0.0     17667.0

 S2 node 0  262654      1422.163649     185.347709      698.0   19766.0
 S2 node 1  262654      1508.656003     308.376884      721.0   7830.0
 S2 node 2  262654      1684.205090     315.595694      950.0   11114.0
 S2 node 3  262654      1628.271908     238.104423      928.0   21329.0

 S3 node 0  262654      2515.987665     1276.904267     1012.0  10911.0
 S3 node 1  262654      3727.777879     1783.431976     0.0     11817.0
 S3 node 2  262654      2727.801045     808.223079      906.0   6143.0
 S3 node 3  262654      2046.595670     329.881167      1066.0  8133.0
- OCT 2008 dose PNG image
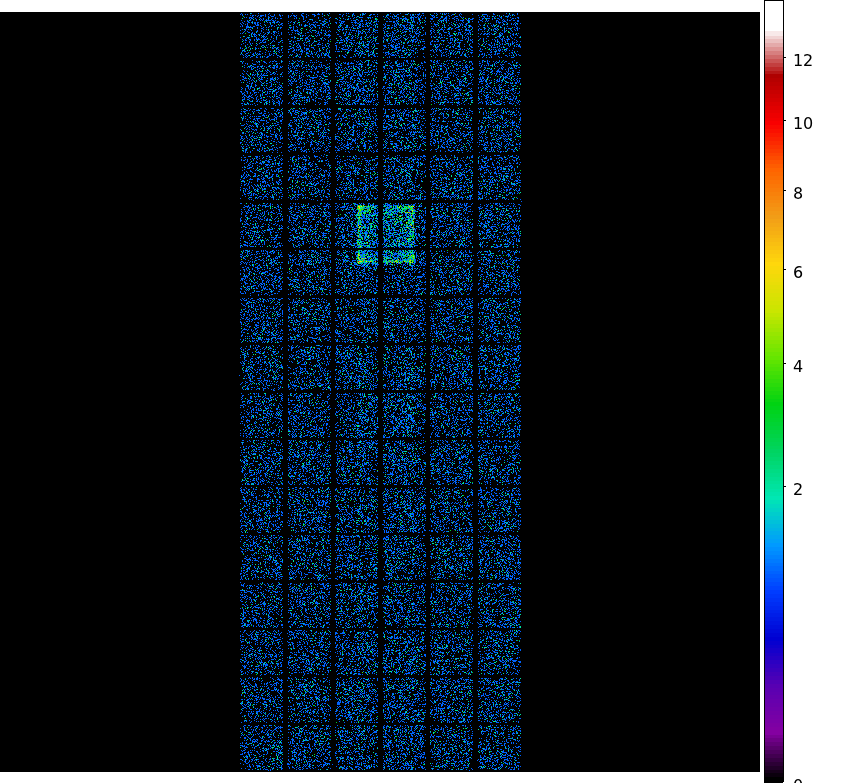
- OCT I3 dose PNG image
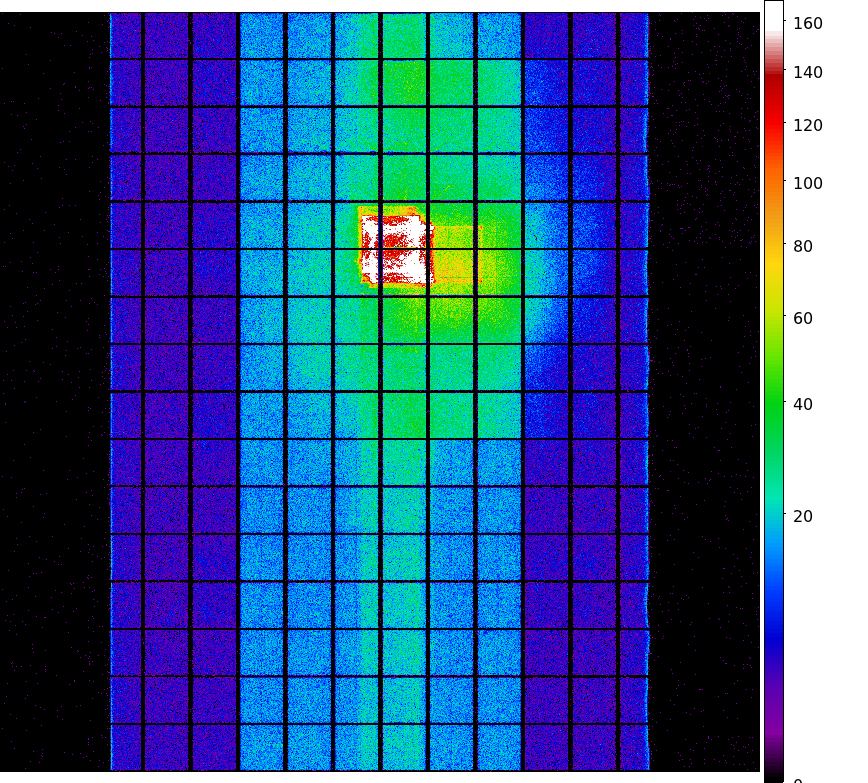
- OCT S3 dose PNG image
- TOTAL JUL 1999 - OCT 2008 dose PNG image
- TOTAL I3 dose PNG image
- TOTAL S3 dose PNG image
- Integrated Exposure Maps of Last 12 Months
|
|
|
|
| Jul 2008 |
Apr 2008 |
Jan 2008 |
Oct 2007 |
- The Mean Detrended CTI
We report CTIs with a refined data definition. CTIs were computed for the temperature
dependency corrected data.
Please see
CTI page
for detailed explanation.
CTI's are computed for Mn K alpha, and defined as slope/intercept x10^4 of row # vs ADU.
Data file here
- Focal Plane Temperature
       The Mean (max) FPT: -117.66 C    std dev: 1.49
               mean width:    0.26 days std dev: 0.16
We are using 10 period moving averages to show
trends of peak temperatures and peak widths.
Note, the gaps in the width plot are due to missing/corrupted data.

The following is a plot of focal plane temperature and sun angle, earth angle, and altitude.
- Bad Pixels
The plots below were generated with a new warm pixel finding script. Please see
Acis Bad Pixel Page
for details.
Front Side CCDs
Back Side CCD (CCD5)
-
Acis Count Rate Plot
This monitors the ACIS count Rate vs. EPHIN count Rate.
No sources or CTI observations are removed. For daily updates see:
Ephin/Acis Info
- Science instrument background rates
This page shows scientific instrument background data based on Acis
observations. A source region file is generated using get_srcregions
and then the input event file is filtered using the regions in that file
to remove the sources.
| Name | Low (keV) | High(KeV) | Description |
|---|
| SSoft | 0.00 | 0.50 | Super soft photons |
|---|
| Soft | 0.50 | 1.00 | Soft photons |
|---|
| Med | 1.00 | 3.00 | Moderate energy photons |
|---|
| Hard | 3.00 | 5.00 | Hard Photons |
|---|
| Harder | 5.00 | 10.00 | Very Hard photons |
|---|
| Hardest | 10.00 | | Beyond 10 keV |
|---|
The following three plots show trends of SIB from year 2000.
CCDs shown here are CCD3, CCD5, and CCD7. Fitted lines are linear fit after eliminating extreme
outliers. For >10 keV plots, 2 lines are fit. One is with a 13 keV filter, and
another without.
CCD 3
CCD 5
CCD 7


)
)
)
)
)
)
)
)
)
)
)
)
)
)
)
)
)
)
)
)
)
)
)
)
)
)
)
)
)
)
)
)
)
)
)
)
)