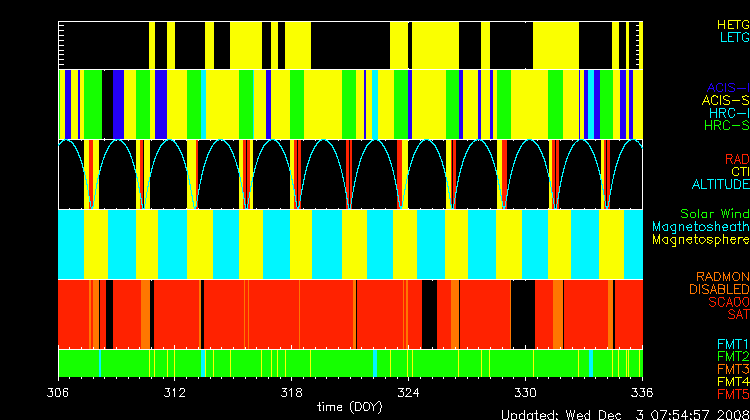

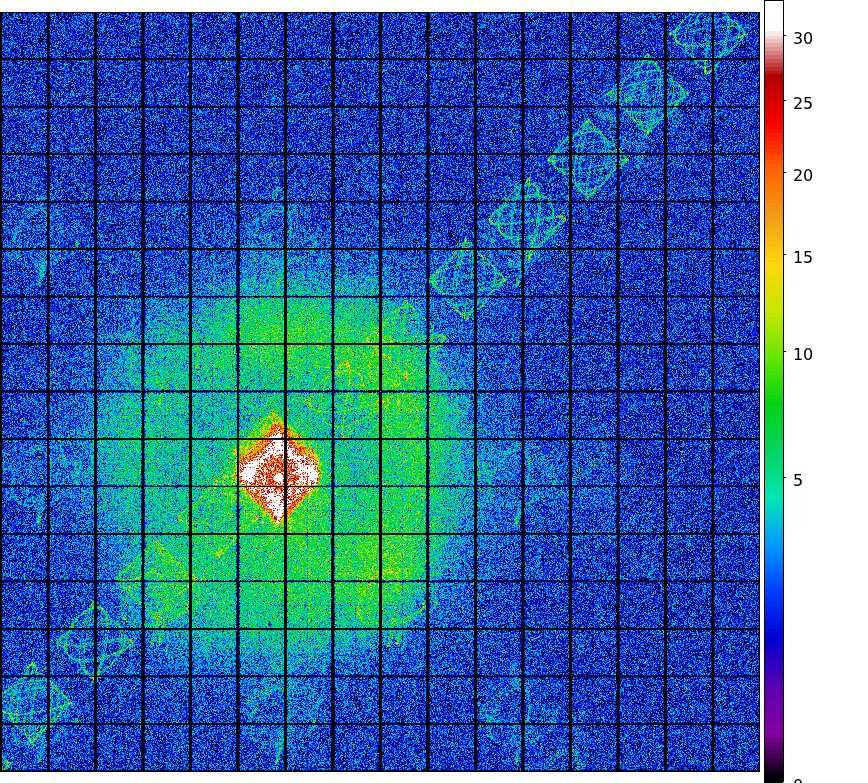
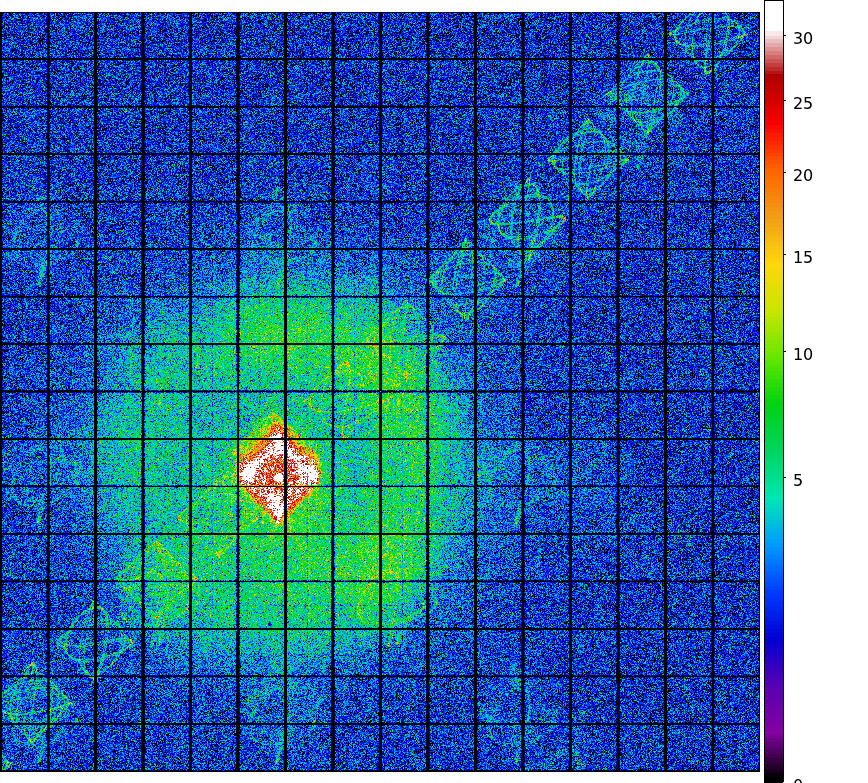
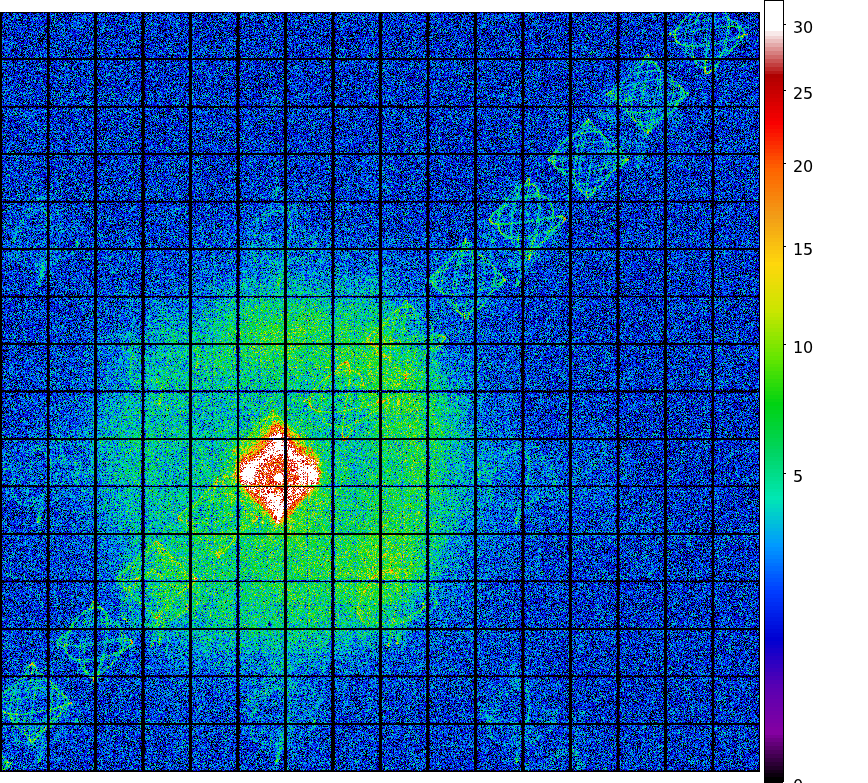
The steps we took to compute the dose map are;
Please check more detail plots at Telemetered Photon Dose Trend page.
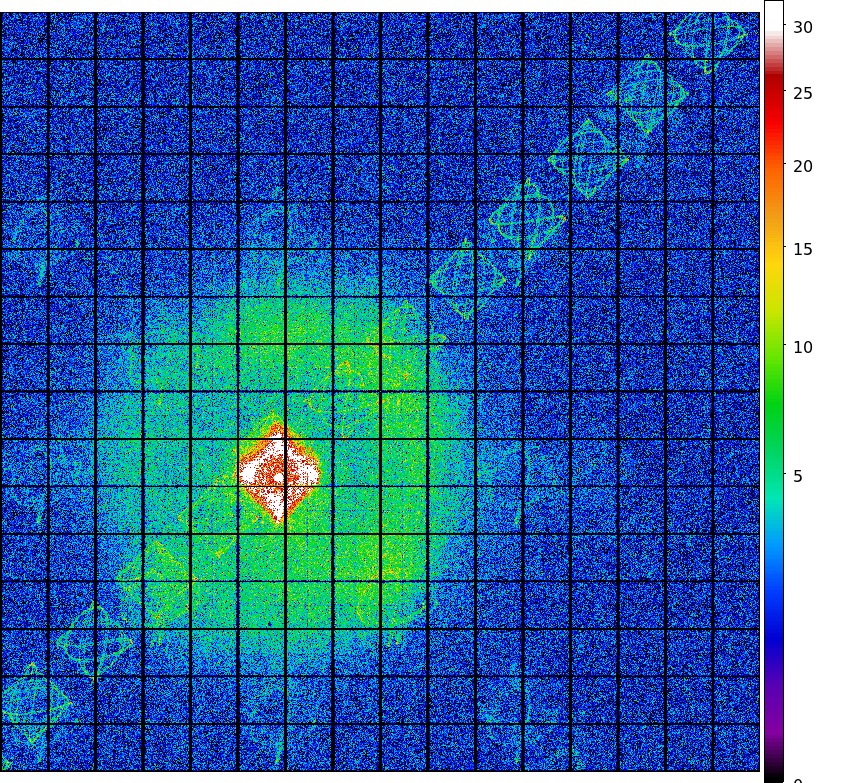
Statistics:
# IMAGE     NPIX        MEAN           RMS              MIN     MAX
ACIS_nov08 6004901      9.129          12.66            0.0     826.0

 I2 node 0  262654      7.533611        3.203536        0.0      32.0
 I2 node 1  262654      8.030657        3.521326        0.0     176.0
 I2 node 2  262654      7.962688        3.269163        0.0      37.0
 I2 node 3  262654      7.907738        3.454434        0.0      44.0

 I3 node 0  262654      7.663861        3.201097        0.0      37.0
 I3 node 1  262654      8.153996        7.598823        0.0     182.0
 I3 node 2  262654      7.459794        3.088459        0.0      55.0
 I3 node 3  262654      7.426491        3.130643        0.0     113.0

 I2 node 0  262654      13.714805       4.904197        0.0     169.0
 I2 node 1  262654      13.910399       5.635959        0.0      98.0
 I2 node 2  262654      14.527191       5.379210        0.0     114.0
 I2 node 3  262654      13.733786       5.053378        0.0     826.0

 I3 node 0  262654      18.018375       11.582354       1.0     334.0
 I3 node 1  262654      18.547942       6.661727        0.0     104.0
 I3 node 2  262654      18.347595       6.205826        0.0      55.0
 I3 node 3  262654      17.164212       6.021551        0.0      85.0
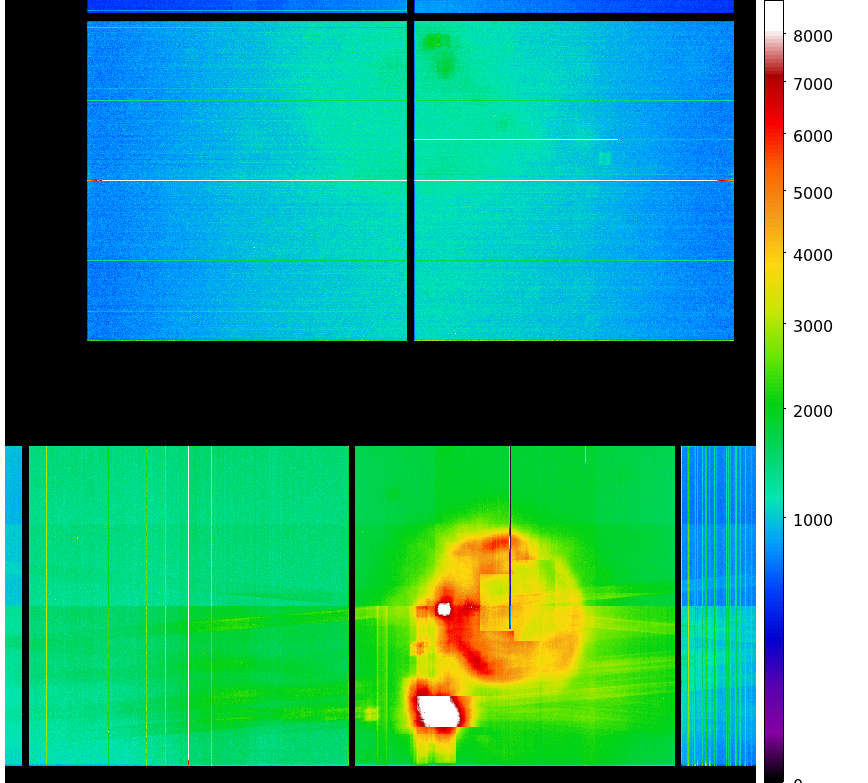
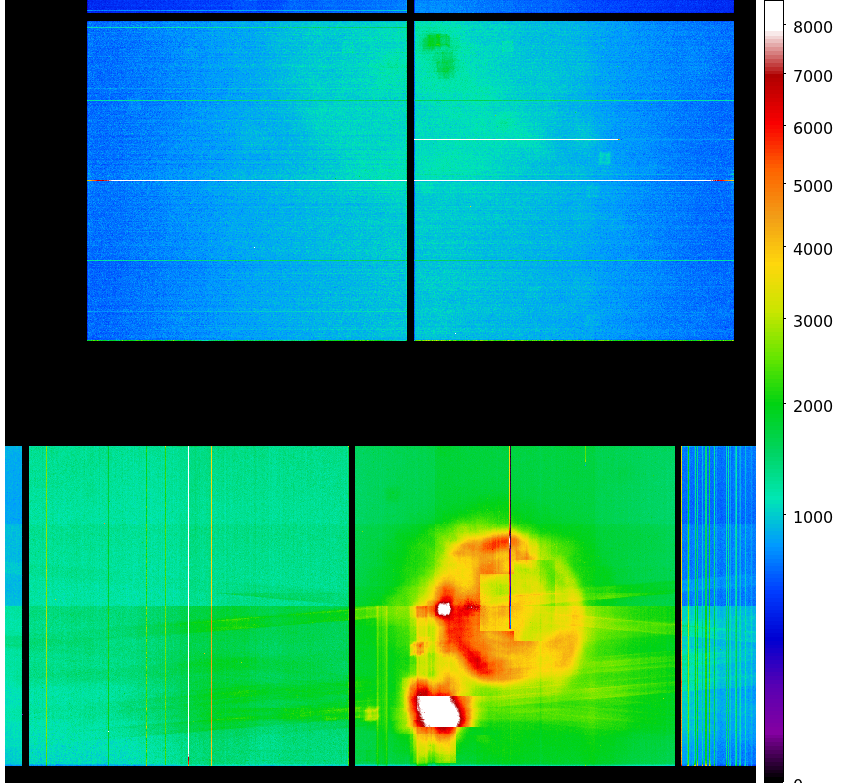
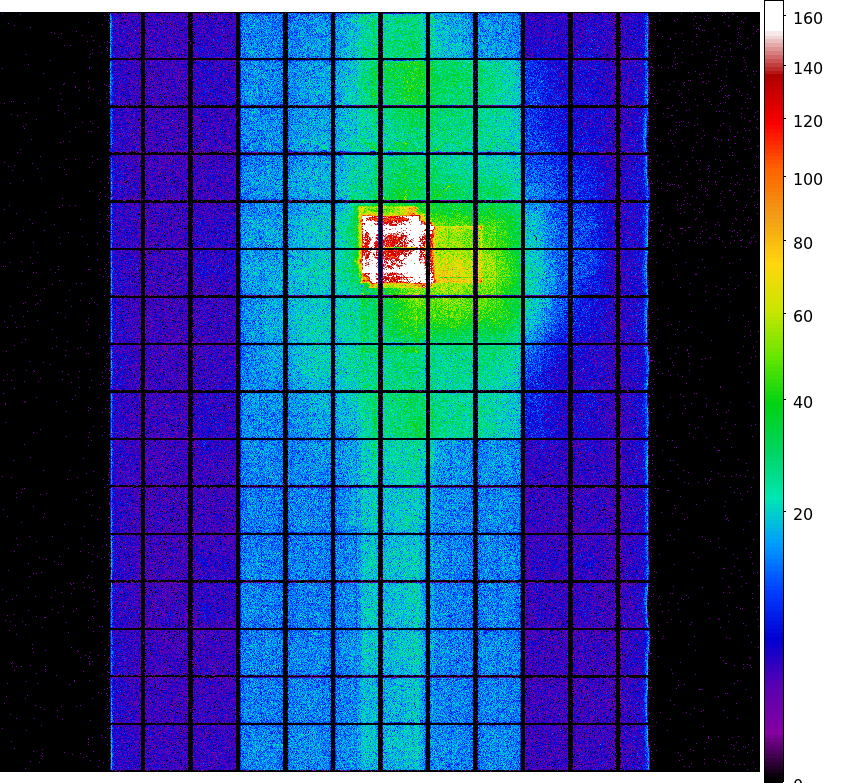
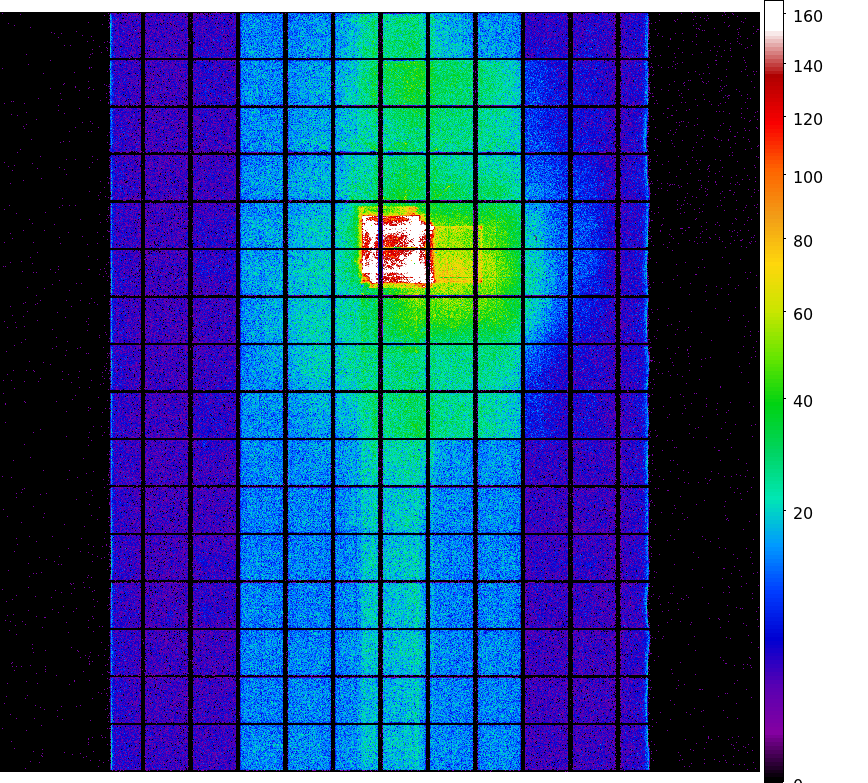
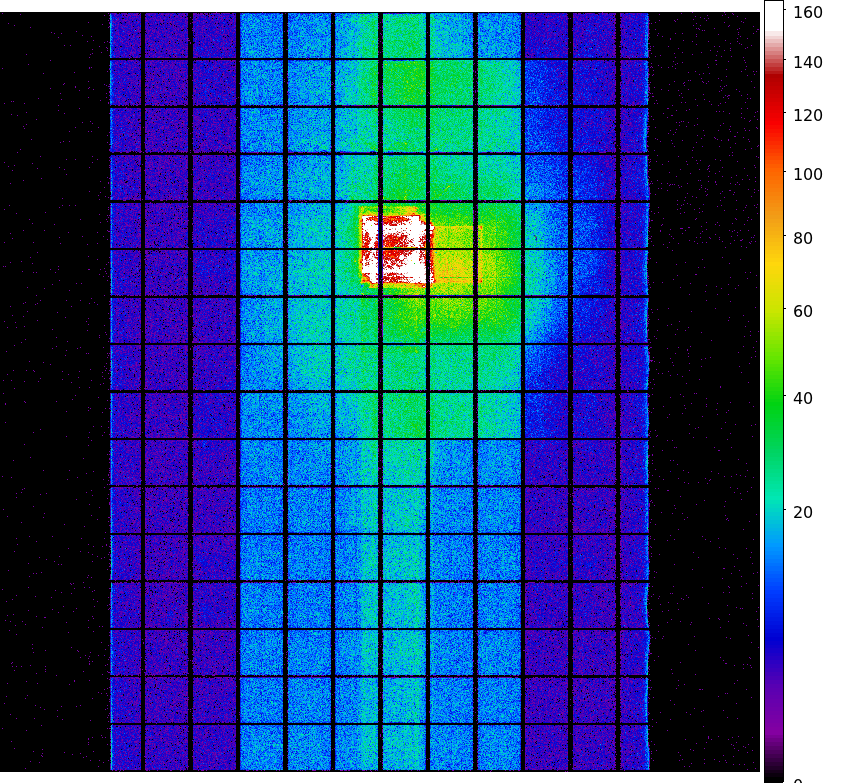
Statistics:
 IMAGE        NPIX      MEAN          RMS              MIN    MAX
ACIS_total  6004901    1202.65          1645.70         0.0    73242.0

 I2 node 0  262654      929.059097      166.867604      0.0     4193.0
 I2 node 1  262654      982.629960      228.039823      0.0     15650.0
 I2 node 2  262654      997.247360      192.397576      0.0     8371.0
 I2 node 3  262654      998.758588      244.650123      0.0     27238.0

 I3 node 0  262654      1050.962356     254.396910      0.0     5554.0
 I3 node 1  262654      1090.911659     785.268128      0.0     20797.0
 I3 node 2  262654      970.165171      165.487077      0.0     4166.0
 I3 node 3  262654      958.427925      177.781943      0.0     17780.0

 I2 node 0  262654      1435.878454     187.391333      707.0   19783.0
 I2 node 1  262654      1522.566402     311.689135      735.0   7924.0
 I2 node 2  262654      1698.732280     317.927392      957.0   11228.0
 I2 node 3  262654      1642.005695     239.141397      937.0   21685.0

 I3 node 0  262654      2534.006039     1280.150949     1025.0  10931.0
 I3 node 1  262654      3746.325821     1786.510391     0.0     11842.0
 I3 node 2  262654      2746.148641     811.364748      910.0   6194.0
 I3 node 3  262654      2063.759882     332.889709      1082.0  8178.0
|
|
|
|
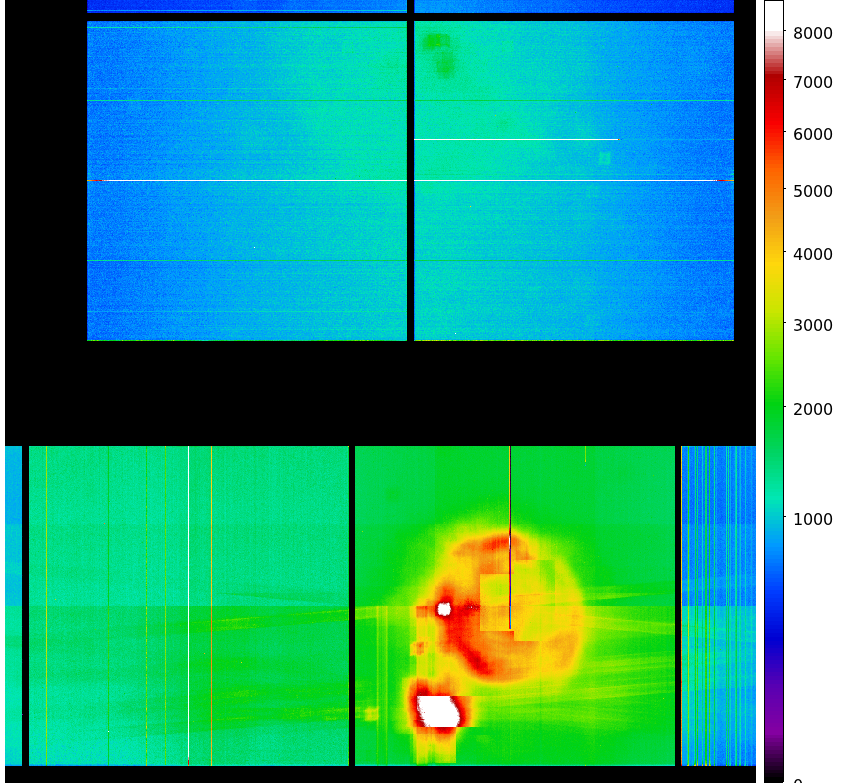
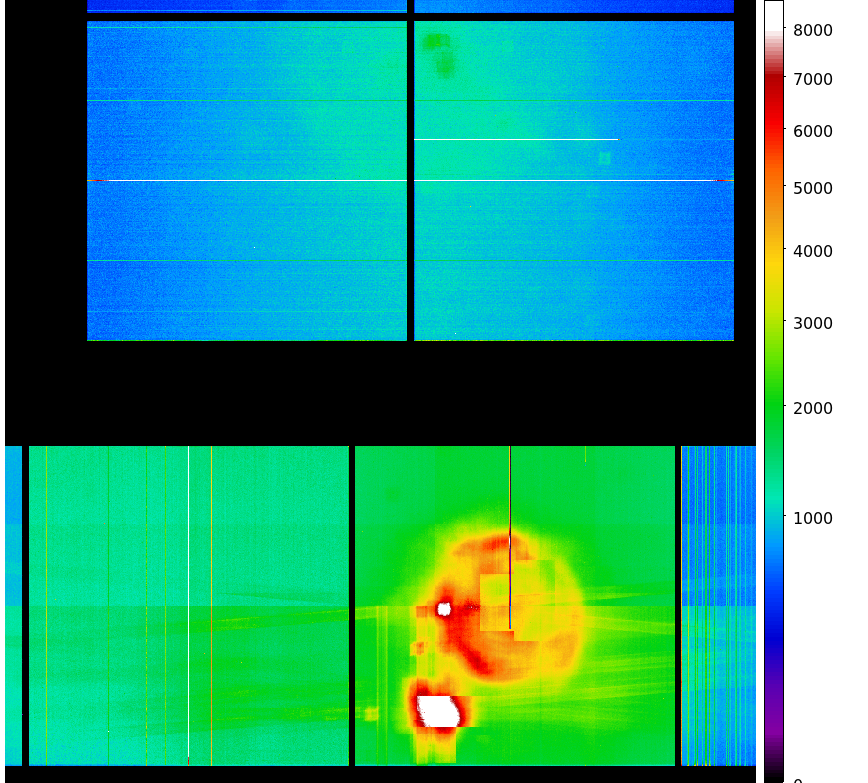
| Aug 2008 | May 2008 | Feb 2008 | Nov 2007 |
|---|
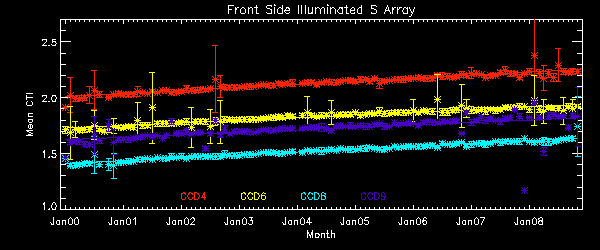
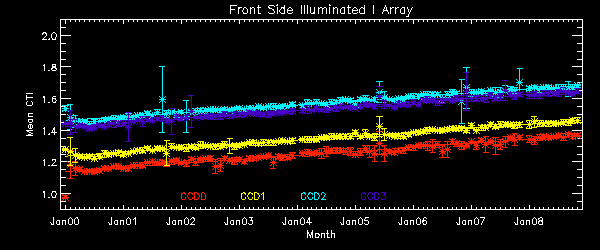
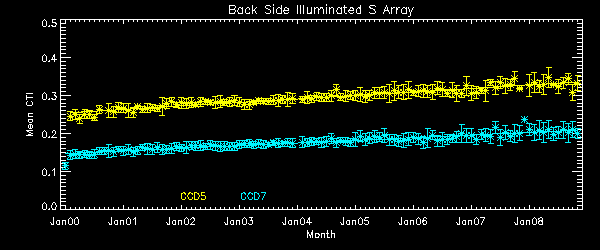
We report CTIs with a refined data definition. CTIs were computed for the temperature
dependency corrected data.
Please see
CTI page
for detailed explanation.
CTI's are computed for Mn K alpha, and defined as slope/intercept x10^4 of row # vs ADU.
Data file here
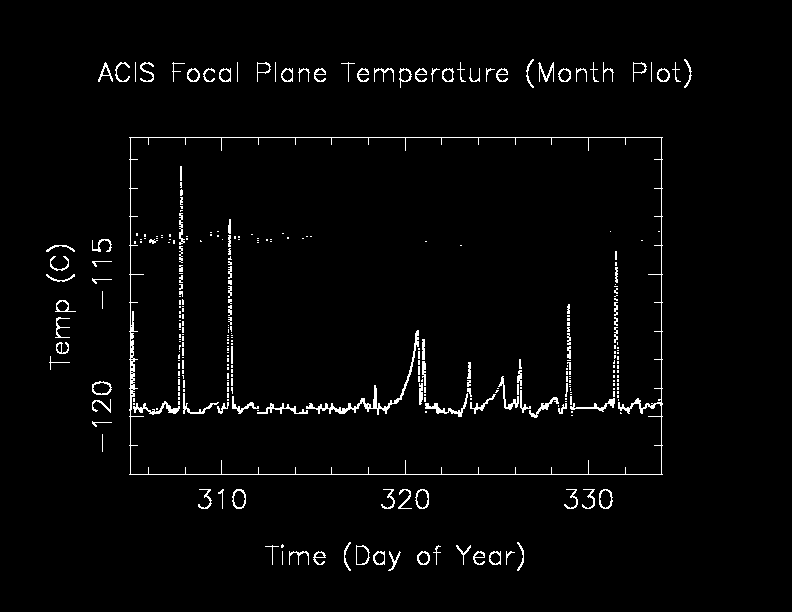
       The Mean (max) FPT: -116.53 C    std dev: 2.38
               mean width:    0.32 days std dev: 0.22

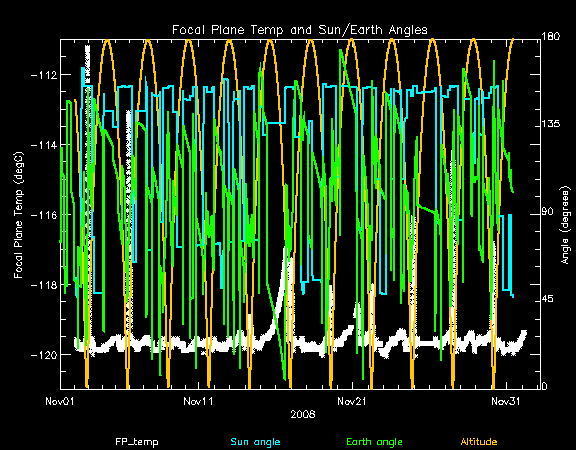
The following is a plot of focal plane temperature and sun angle, earth angle, and altitude.
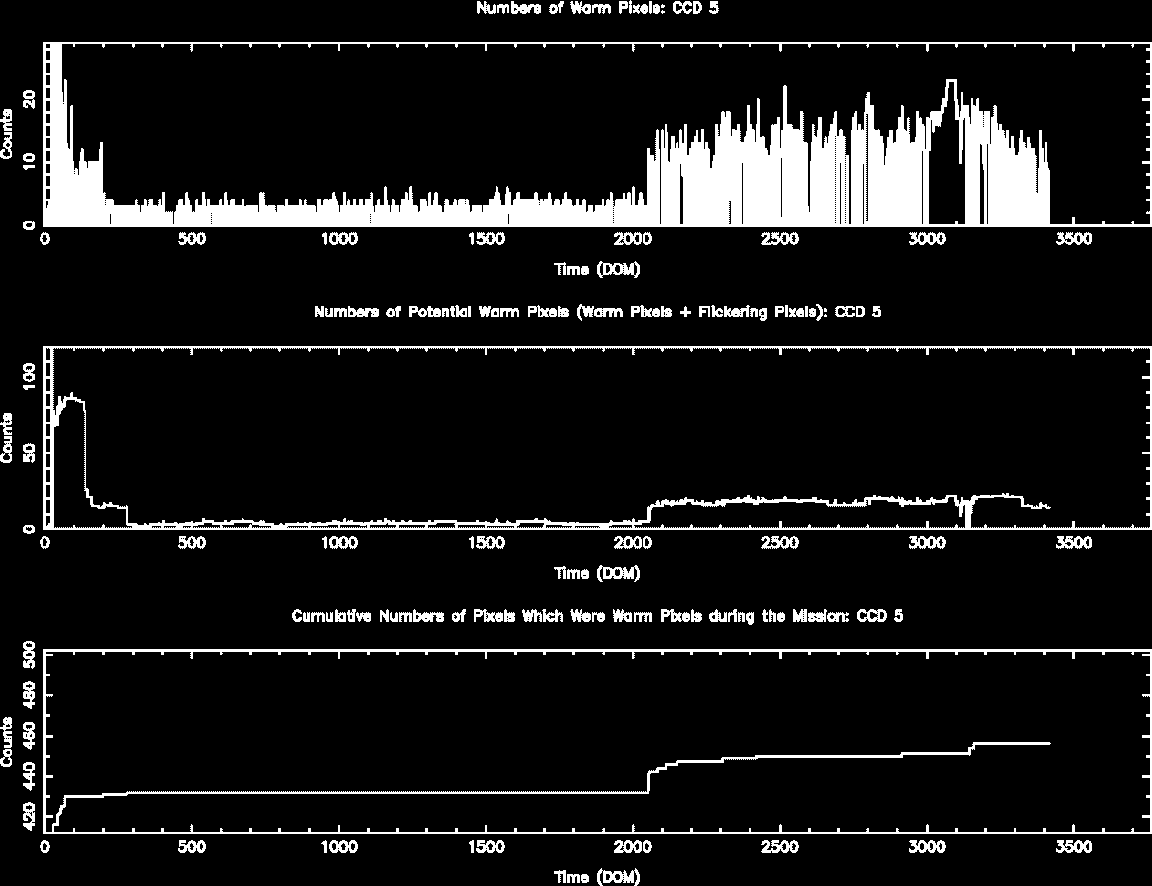
The plots below were generated with a new warm pixel finding script. Please see Acis Bad Pixel Page for details.
Front Side CCDs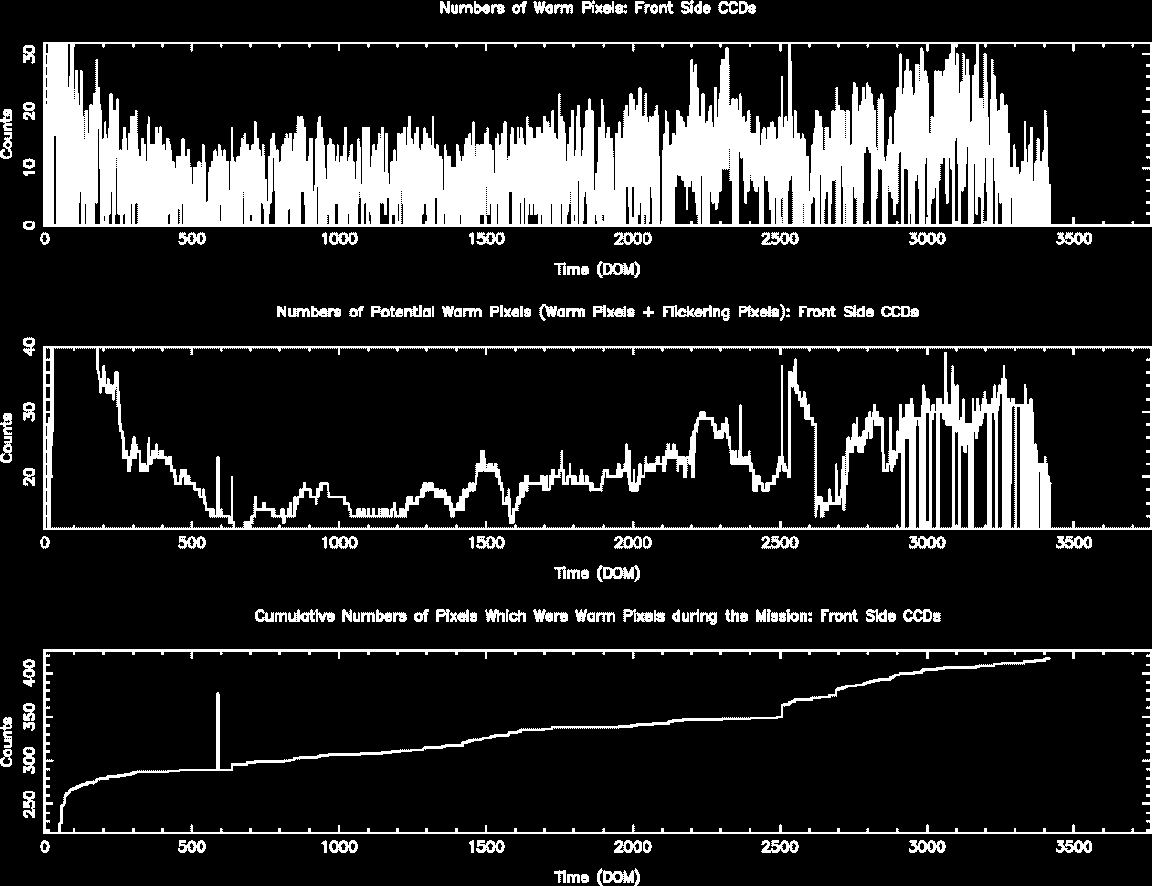
Back Side CCD (CCD5)
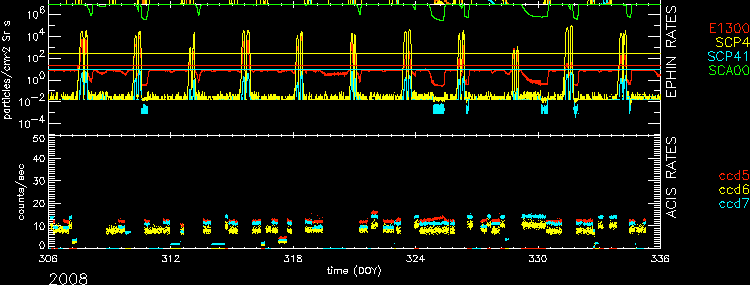
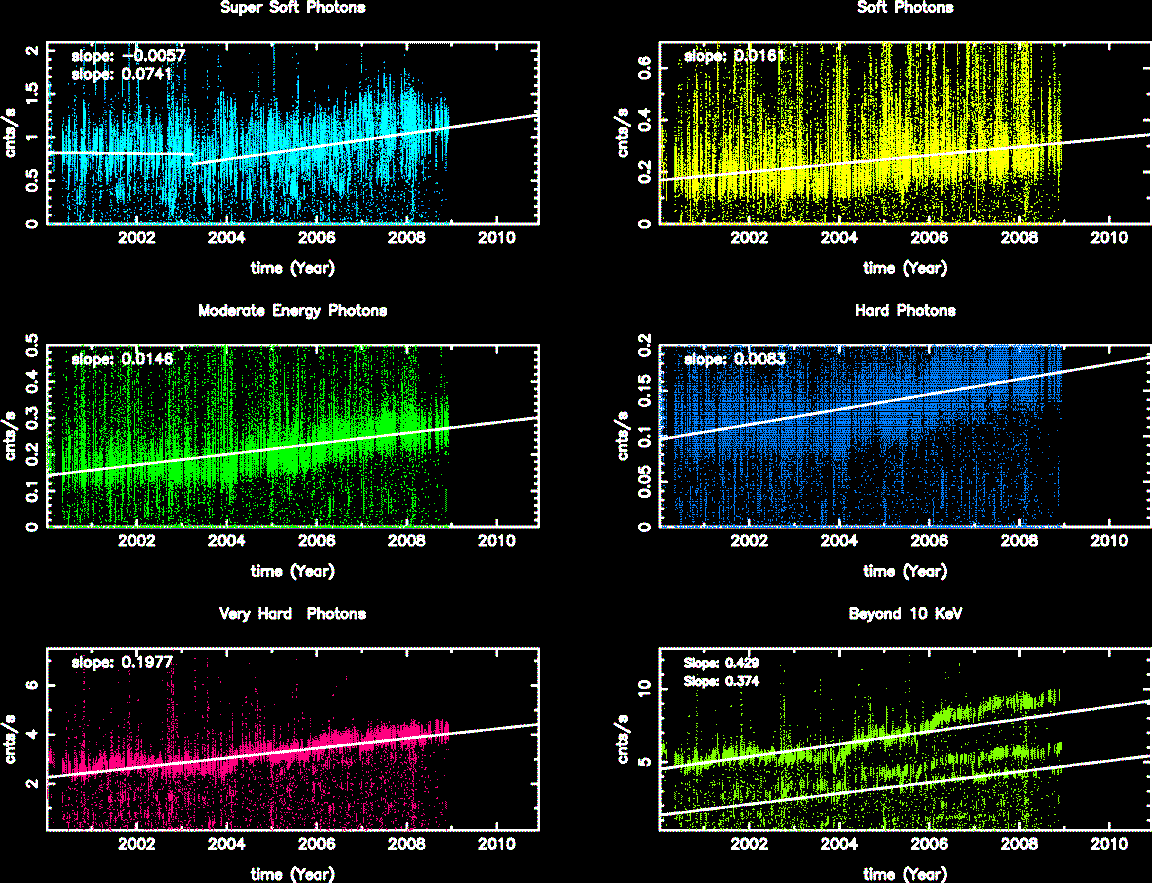
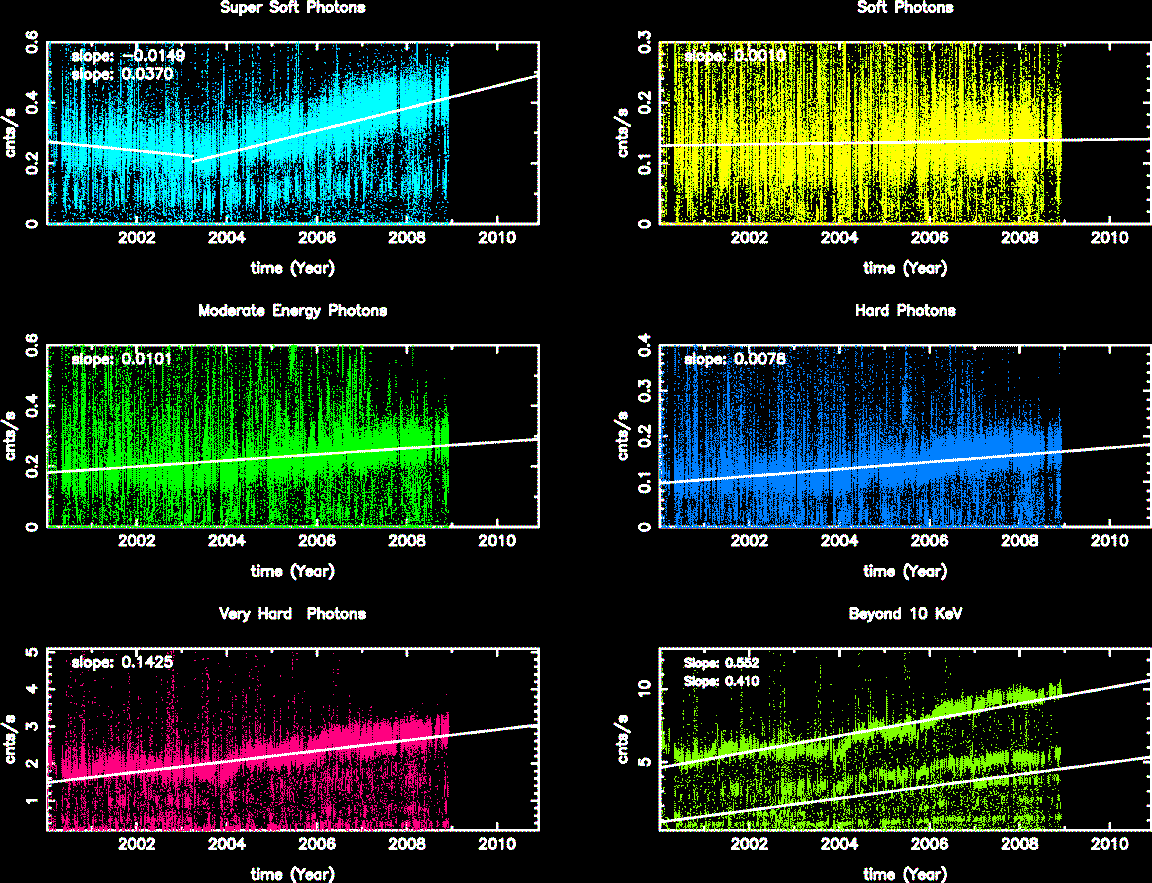
| Name | Low (keV) | High(KeV) | Description |
|---|---|---|---|
| SSoft | 0.00 | 0.50 | Super soft photons |
| Soft | 0.50 | 1.00 | Soft photons |
| Med | 1.00 | 3.00 | Moderate energy photons |
| Hard | 3.00 | 5.00 | Hard Photons |
| Harder | 5.00 | 10.00 | Very Hard photons |
| Hardest | 10.00 | Beyond 10 keV |
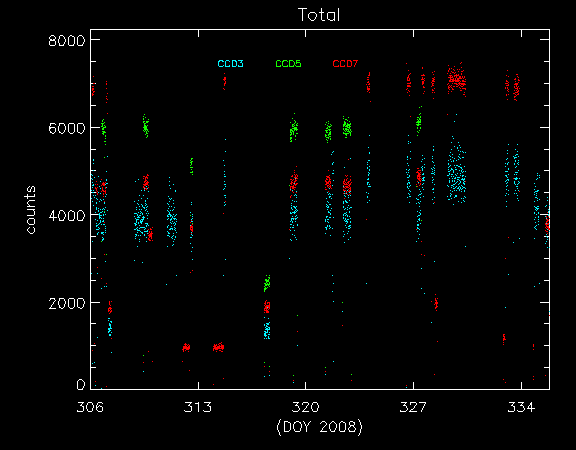
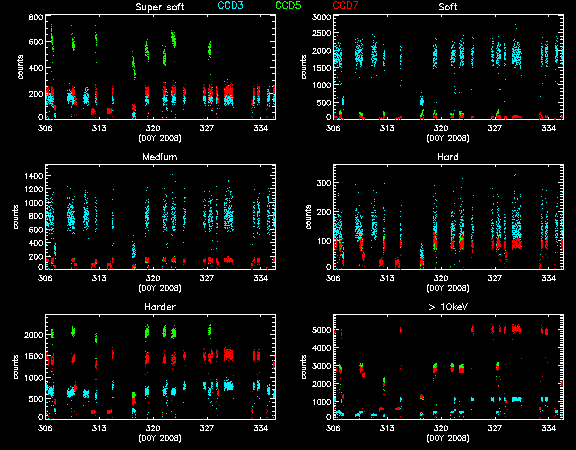
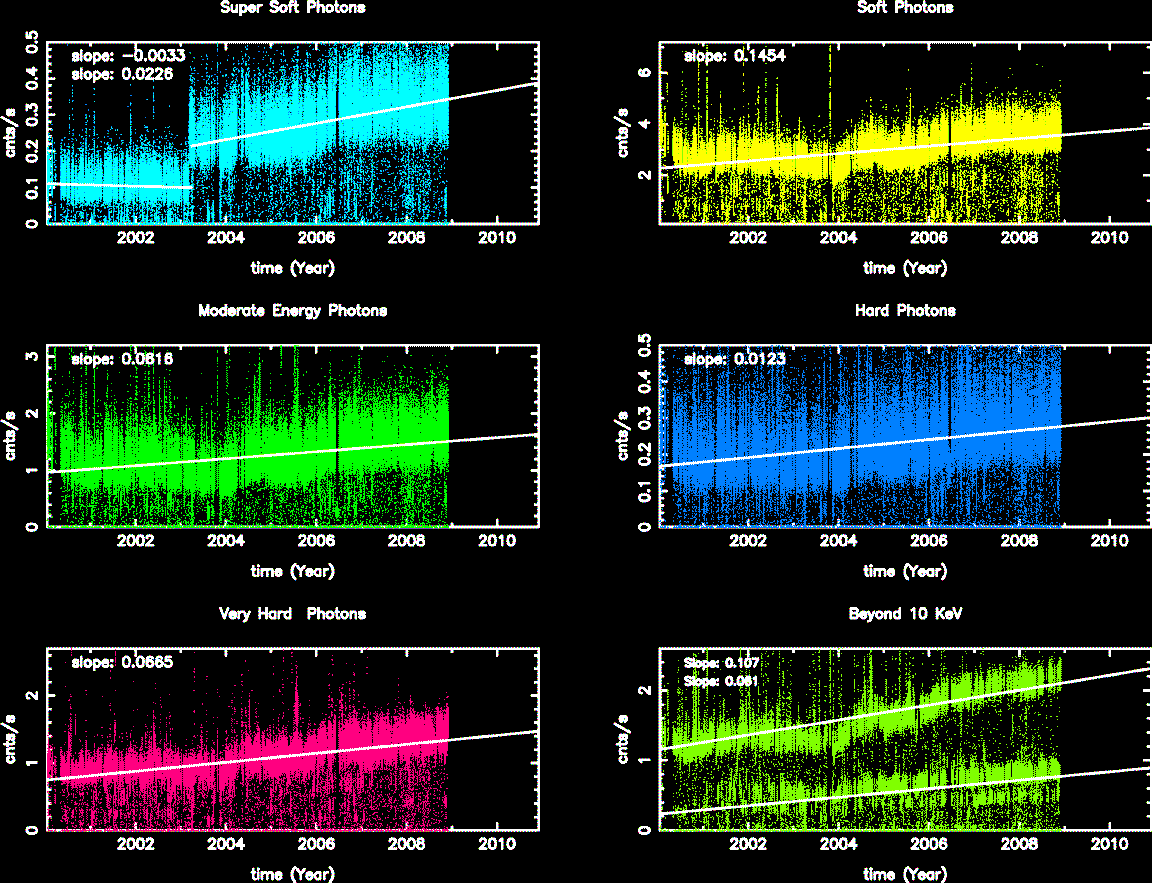
The following three plots show trends of SIB from year 2000. CCDs shown here are CCD3, CCD5, and CCD7. Fitted lines are linear fit after eliminating extreme outliers. For >10 keV plots, 2 lines are fit. One is with a 13 keV filter, and another without.
We collected data from acis histogram mode data, and created trend plots of peak portions and peak widths against time (DOM). The peaks were estimated by fitting a simple Gaussian on three peaks (Al, Ti, and Mn), and the widths were estimated by a width at the half max from the peak.
All histogram data are taken under TIMED and GRADED_HIST mode, SIM position is at an external calibration source position, the focal temperature is around -119.7 C, and parameter settings in aciselec, acistemp are set to about same for all.
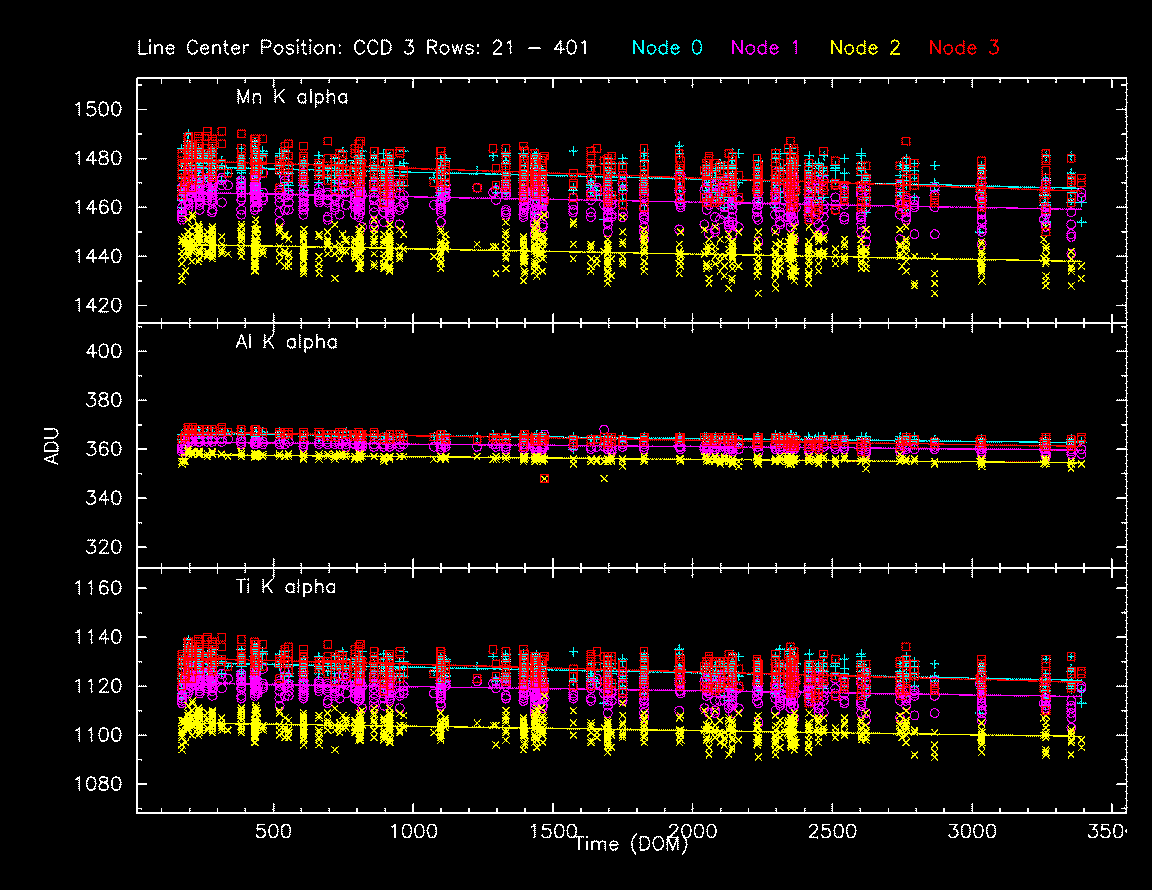
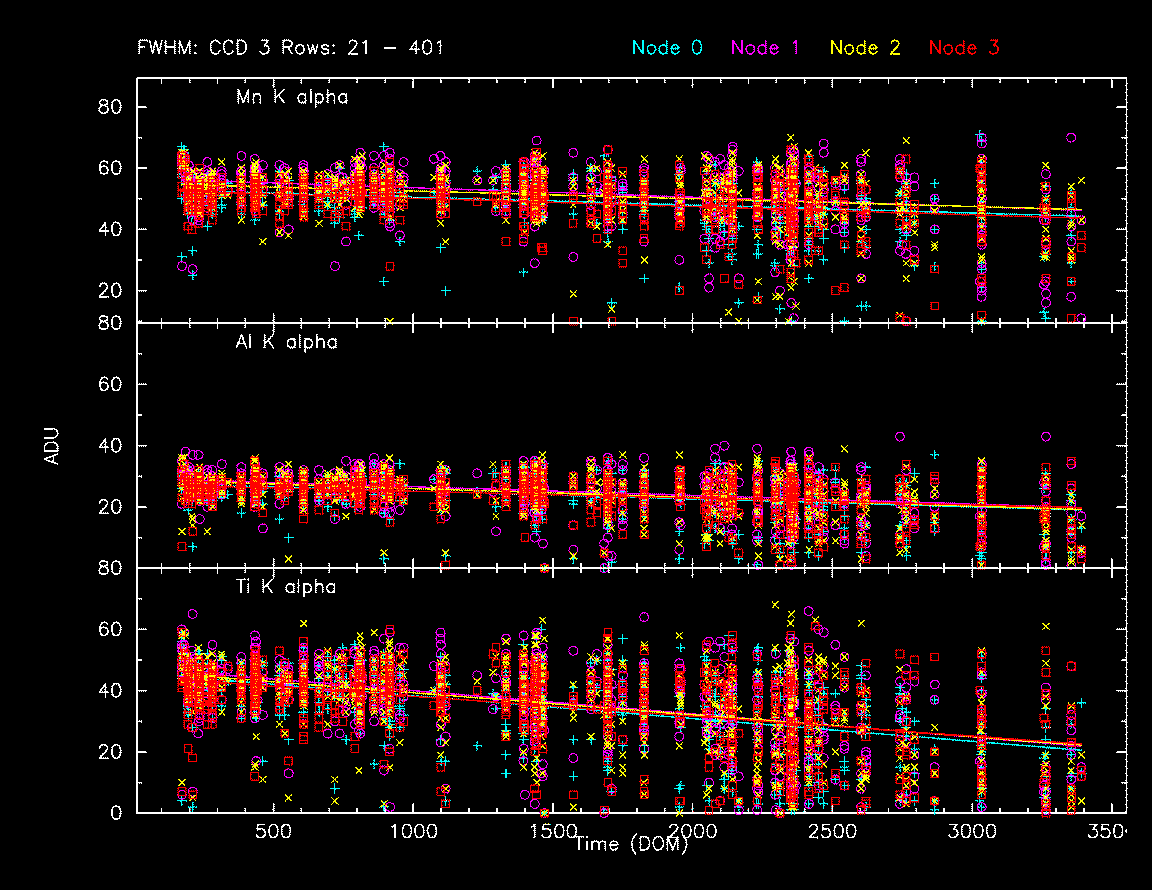
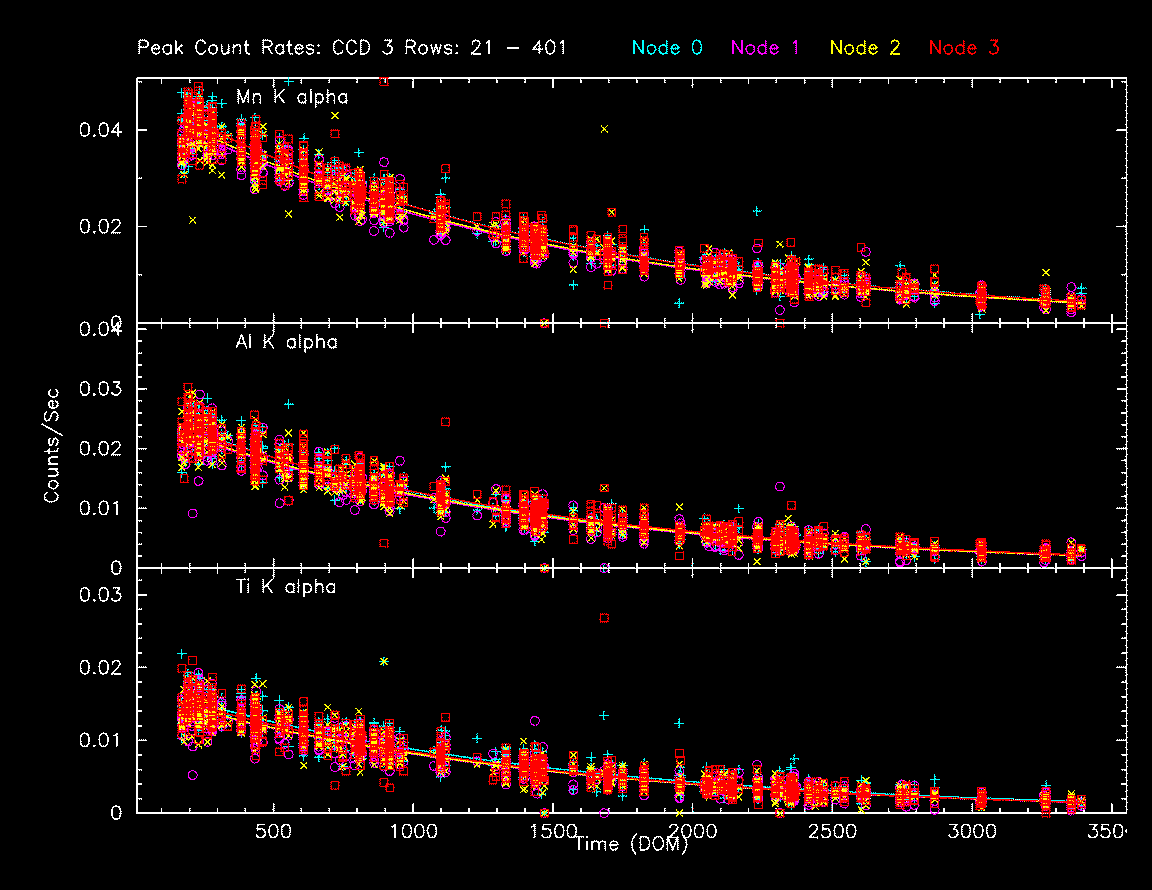
        IMAGE                NPIX      MEAN    STDDEV      MIN       MAX
HRCI_11_2008.fits          16777216   0.033    0.184       0.0       5.0
        IMAGE                NPIX      MEAN    STDDEV      MIN       MAX
HRCI_09_1999_11_2008.fits  16777216   2.694    3.607       0.0       290.0
        IMAGE                NPIX      MEAN    STDDEV      MIN       MAX
HRCS_11_2008.fits          16777216   0.296    0.174       0.0       4.0
        IMAGE                NPIX     MEAN      STDDEV      MIN      MAX
HRCS_09_1999_11_2008.fits  16777216  9.360      17.587      0.0      1553.0
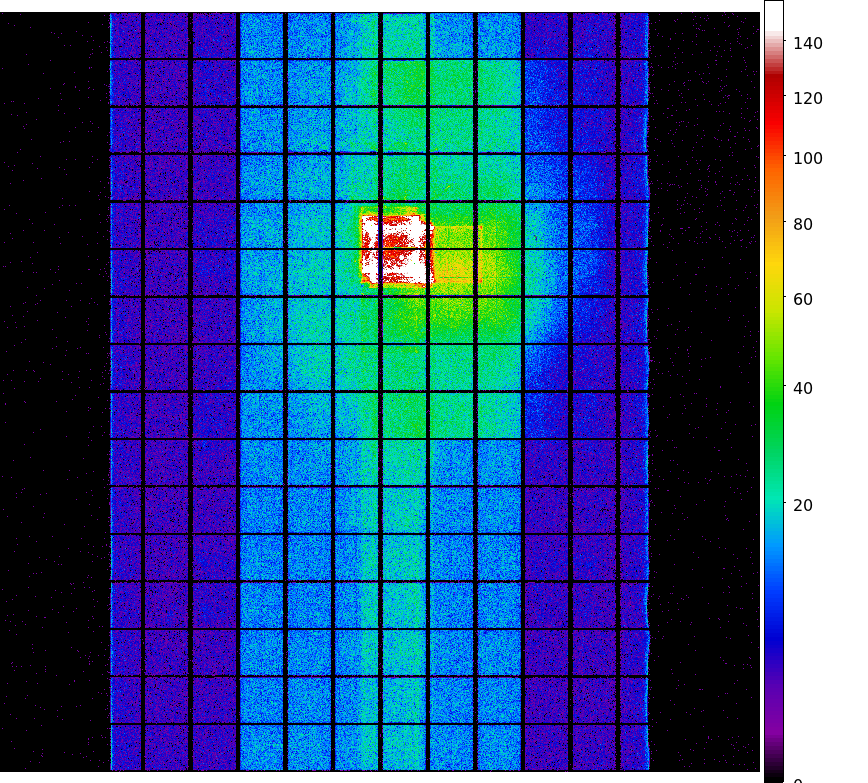
We display a max dose trend plot corrected for events that "pile-up" in the center of the taps due to bad position information.

|
|
|
|
| Aug 2008 | May 2008 | Feb 2008 | Nov 2007 |
|---|
|
|
|
|
| Aug 2008 | May 2008 | Feb 2008 | Nov 2007 |
|---|

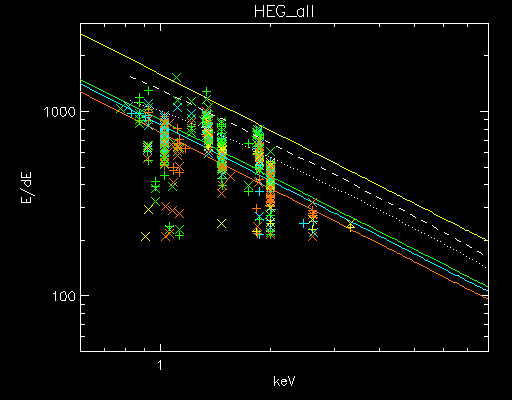
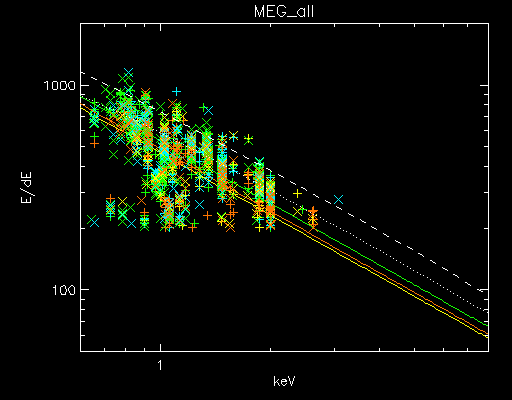
| Plot symbol indicates dispersion arm: | Color indicates observation date: |
Minus side = cross (x) |
2002-2004 blue 2005-2006 yellow 2007-2008 orange |
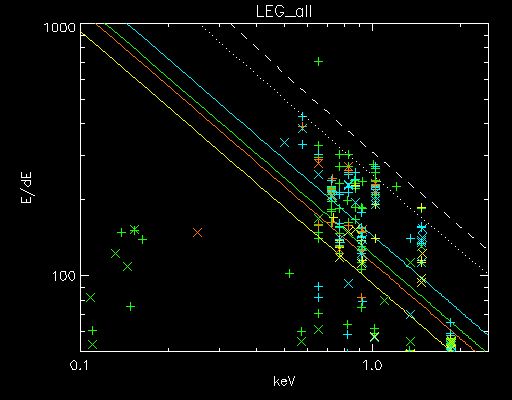
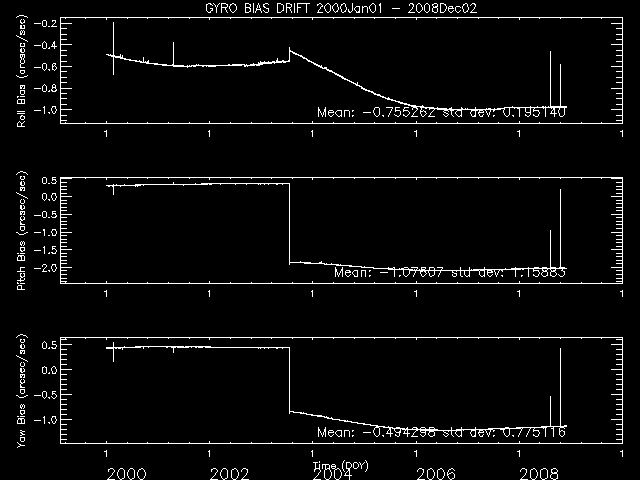
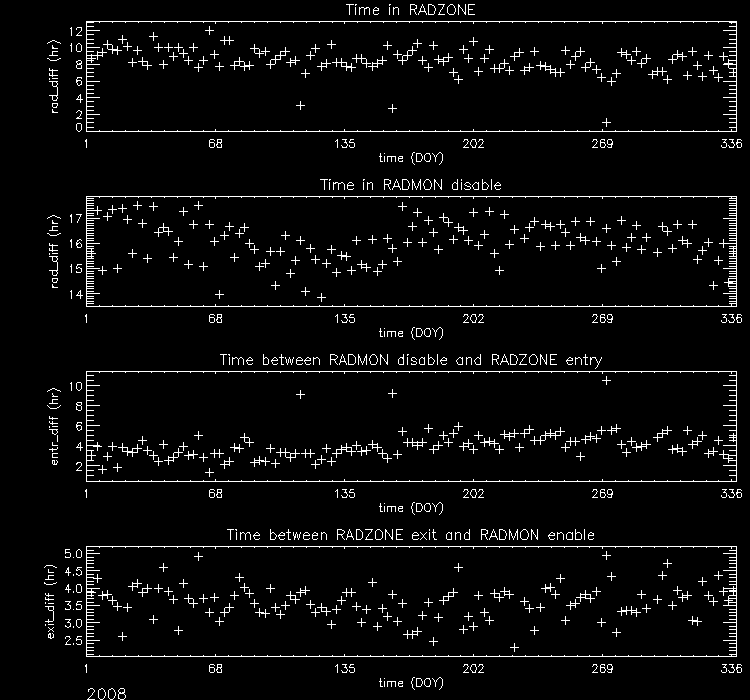
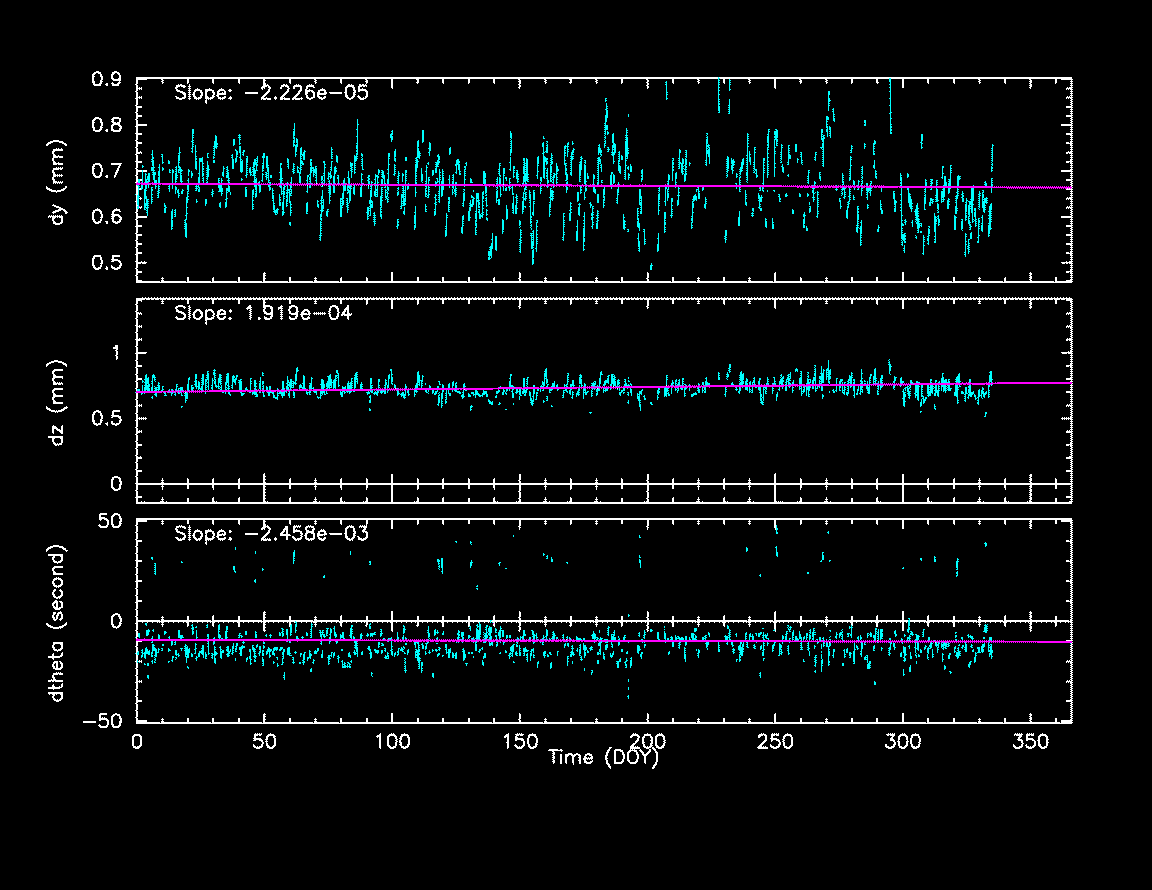
SIM Shift and Twist Trend The following plots show trends of SIM shifts (dy and dz) and twist (dtheta). All quantities are directly taken from pcaf*_asol1.fits files. The units are mm for dy and dz, and degree for dtheta. We fit three lines separated before and after (Days of Mission)= 1400 (May 21, 2003), and 2700 (Jan 11, 2006). The unit of slopes are mm per day or degree per day.
The sudden shift around DOM = 1400 and 2700 are due to fid light drift (see a memo by Aldcroft
fiducial light drift). On the dtheta plot, two tracks
are clearly observed. The track around 0.01 is due to HRC-I, and all others are clustered around -0.002.
For more detail, please see
SIM Shift and Twist Trend page
| ACIS Electronics A | ||||||
|---|---|---|---|---|---|---|
| MSID | MEAN | RMS | DELTA/YR | DELTA/YR/YR | UNITS | DESCRIPTION |
| 1DE28AVO | 28.61 | 0.25 | -2.531e+00 | -1.226e+01 | V | DEA +28V INPUT A |
| 1DP28AVO | 28.63 | 0.24 | -2.512e+00 | -1.165e+01 | V | DPA +28V INPUT A |
| OBA Cone Gradient | ||||||
|---|---|---|---|---|---|---|
| MSID | MEAN | RMS | DELTA/YR | DELTA/YR/YR | UNITS | DESCRIPTION |
| HCONEGRD39 | 2.22 | 3.168e-02 | -2.992e-01 | 1.782e+00 | K | RT50-RT51: OBA Cone Panel |
| HRC Temperature | ||||||
|---|---|---|---|---|---|---|
| MSID | MEAN | RMS | DELTA/YR | DELTA/YR/YR | UNITS | DESCRIPTION |
| 2CEAHVPT | 299.76 | 2.55 | -1.821e+01 | -3.995e+02 | K | CEA RADIATOR TEMPERATURE AT CENTER |
| 2CHTRPZT | 295.98 | 2.42 | -1.699e+01 | -3.738e+02 | K | CENTRAL ELECTRONICS BOX TEMP |
| 2DTSTATT | 292.64 | 2.25 | -1.399e+01 | -3.707e+02 | K | DETECTOR HOUSING TEMP 1 |
| 2FHTRMZT | 294.33 | 2.18 | -1.150e+01 | -3.170e+02 | K | FRONT END ELECTRONICS BOX TEMPERATURE |
| 2UVLSPXT | 289.13 | 3.07 | -2.042e+01 | -4.199e+02 | K | UV LIGHT SHIELD NEXT TO SNOUT TEMP |
| PCAD Temperature | ||||||
|---|---|---|---|---|---|---|
| MSID | MEAN | RMS | DELTA/YR | DELTA/YR/YR | UNITS | DESCRIPTION |
| AACCCDPT | 253.52 | 0.17 | 2.198e-01 | -9.659e-01 | K | AC CCD TEMP (PRI) |
| AAOTASMT | 291.39 | 0.49 | -3.015e-01 | -1.106e+01 | K | AC OPT TEL ASSY SECONDARY MIRROR TEMP |
| AAOTH2MT | 291.80 | 0.55 | -1.010e-01 | -1.373e+01 | K | AC OPT TEL ASSY SECONDARY MIRROR TEMP (HRMA) |
| SIM Temperature | ||||||
|---|---|---|---|---|---|---|
| MSID | MEAN | RMS | DELTA/YR | DELTA/YR/YR | UNITS | DESCRIPTION |
| BOXTEMP | 290.53 | 2.30 | -1.247e+01 | -1.407e-12 | K | SEA box temperature |
| FAMTRTEMP | 281.89 | 3.33 | -1.755e+01 | 2.541e-12 | K | FA motor temperature |
| FLEXATEMP | 278.08 | 3.01 | -1.430e+01 | 7.994e-13 | K | Flexure A temperature (3FAFLAAT) |
| PSUTEMP | 318.87 | 1.95 | -1.241e+01 | 1.136e-12 | (3FAPSAT) | SEA power supply temperature |
| Spacecraft Main Temperature | ||||||
|---|---|---|---|---|---|---|
| MSID | MEAN | RMS | DELTA/YR | DELTA/YR/YR | UNITS | DESCRIPTION |
| TAPE1PST | 312.81 | 0.30 | -1.023e+00 | -7.482e+00 | K | PEA-1 POWER SUPPLY TEMP |
| TCYLAFT3 | 263.50 | 1.18 | 1.050e+00 | -1.808e+02 | K | CNT CYL TEMP:16-IN FWD OF SC-TS FIT-3 |
| TEP_BPAN | 268.32 | 1.03 | -3.736e-01 | -1.598e+02 | K | BATT PNL TEMP OPPOSITE TEP_PPAN |
| TSAMYT | 320.02 | 1.13 | 1.474e+01 | -2.118e+00 | K | -Y WING SOLAR ARRAY TEMP |
| TSAPYT | 319.53 | 1.11 | 1.489e+01 | -9.461e+00 | K | +Y WING SOLAR ARRAY TEMP |
| OBA Heater | ||||||
|---|---|---|---|---|---|---|
| MSID | MEAN | RMS | DELTA/YR | DELTA/YR/YR | UNITS | DESCRIPTION |
| OOBTHR02 | 283.85 | 9.747e-02 | -4.146e-02 | -6.040e+00 | K | RT 25: HRMA STRUT |
| OOBTHR14 | 285.14 | 0.56 | -8.534e-01 | -3.759e+01 | K | RT 37: OBA CONE |
| OOBTHR22 | 285.60 | 1.11 | -2.148e+00 | -8.292e+01 | K | RT 44: OBA CONE |
| OOBTHR64 | 787.00 | 0.000e+00 | 0.000e+00 | 0.000e+00 | CNT | IP INTERNAL CALIBRATION OBA CH. 63 |
| 
|

| Year | Month | |||||||||||
|---|---|---|---|---|---|---|---|---|---|---|---|---|
| 1999 | Jul | Aug | Sep | Oct | Nov | Dec | ||||||
| 2000 | Jan | Feb | Mar | Apr | May | Jun | Jul | Aug | Sep | Oct | Nov | Dec |
| 2001 | Jan | Feb | Mar | Apr | May | Jun | Jul | Aug | Sep | Oct | Nov | Dec |
| 2002 | Jan | Feb | Mar | Apr | May | Jun | Jul | Aug | Sep | Oct | Nov | Dec |
| 2003 | Jan | Feb | Mar | Apr | May | Jun | Jul | Aug | Sep | Oct | Nov | Dec |
| 2004 | Jan | Feb | Mar | Apr | May | Jun | Jul | Aug | Sep | Oct | Nov | Dec |
| 2005 | Jan | Feb | Mar | Apr | May | Jun | Jul | Aug | Sep | Oct | Nov | Dec |
| 2006 | Jan | Feb | Mar | Apr | May | Jun | Jul | Aug | Sep | Oct | Nov | Dec |
| 2007 | Jan | Feb | Mar | Apr | May | Jun | Jul | Aug | Sep | Oct | Nov | Dec |
| 2008 | Jan | Feb | Mar | Apr | May | Jun | Jul | Aug | Sep | Oct | ||