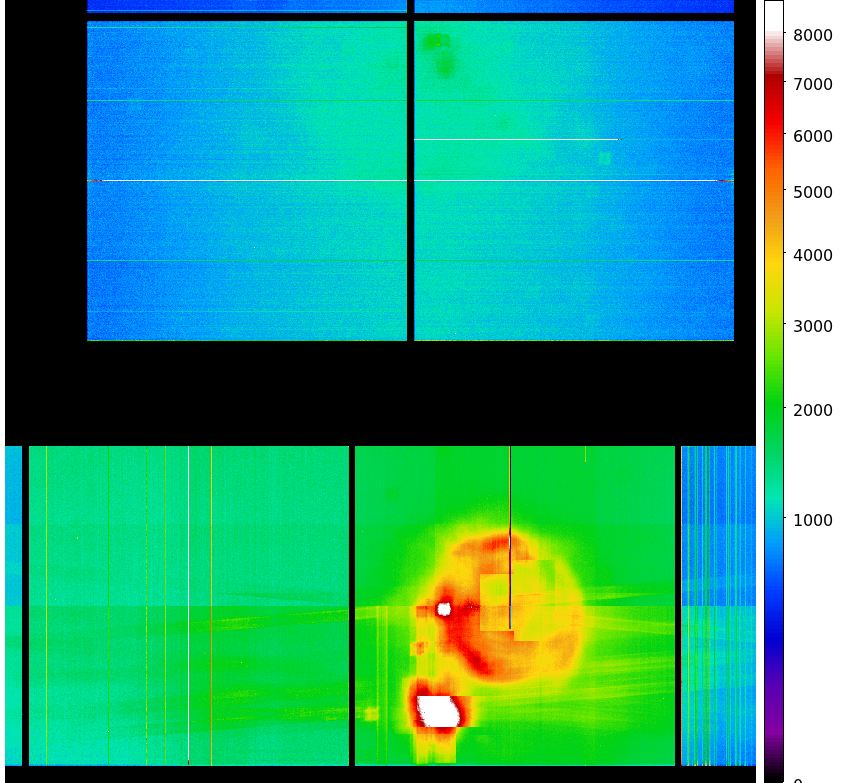
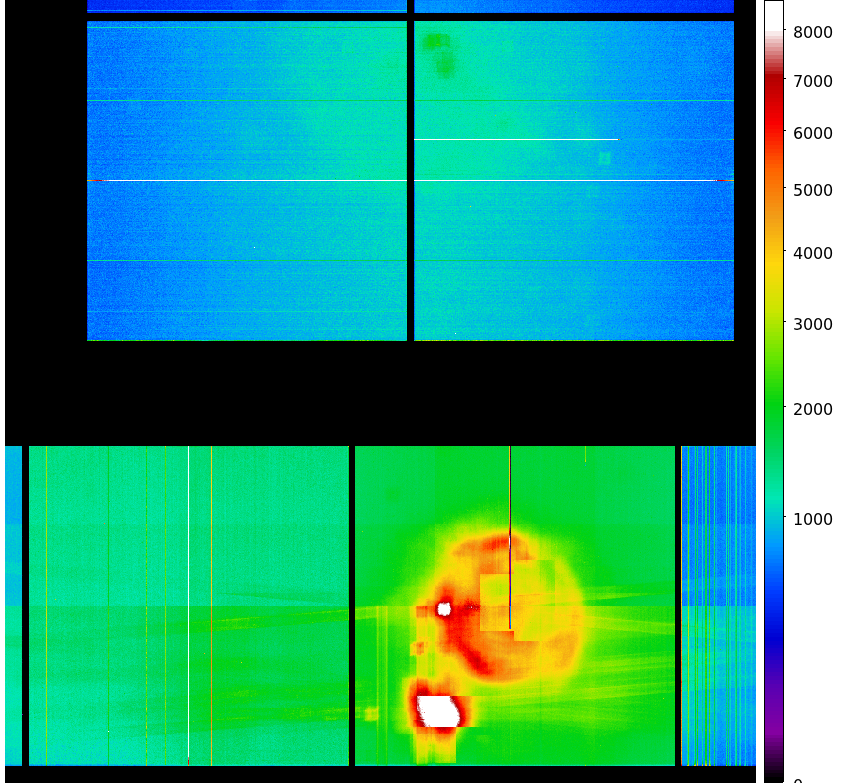
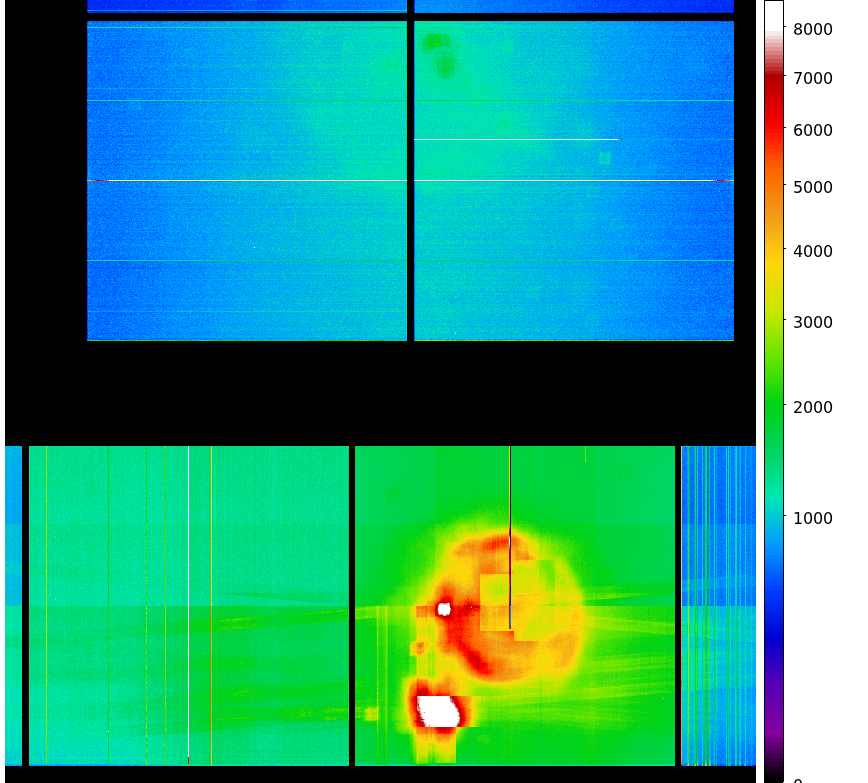
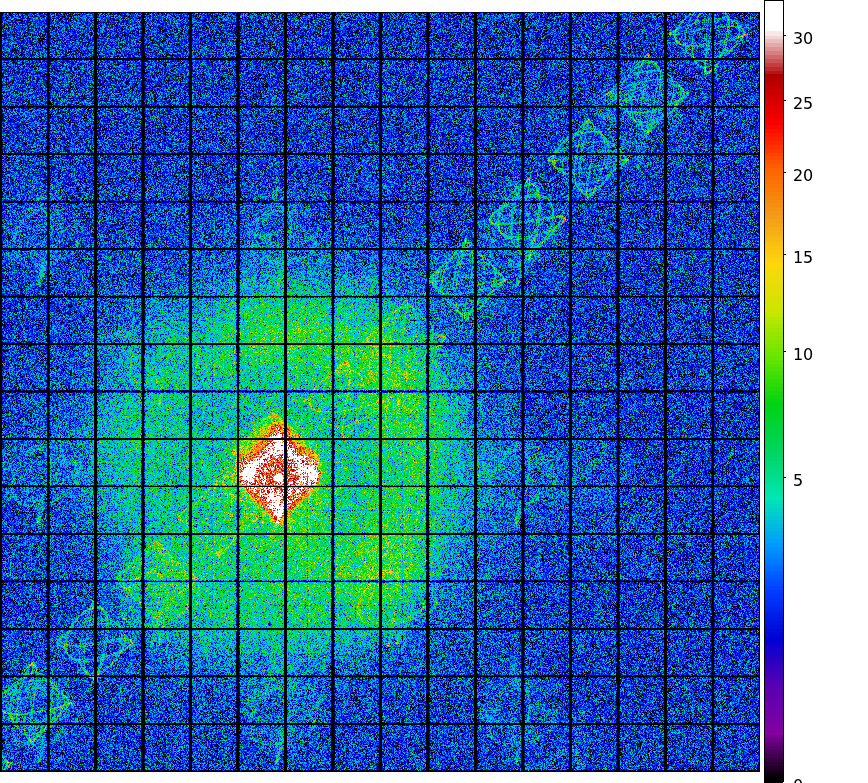
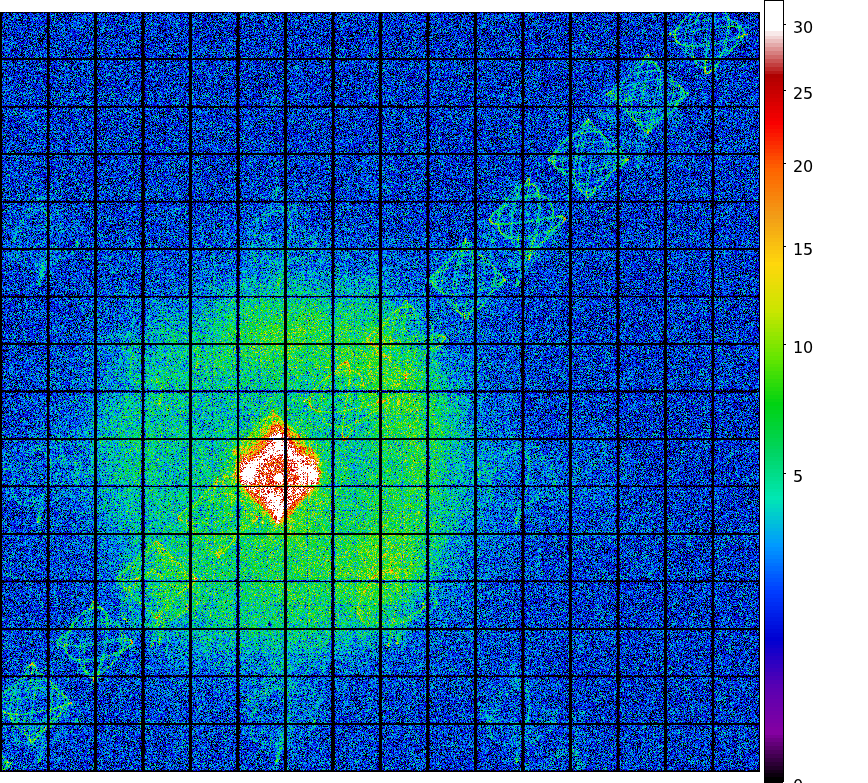
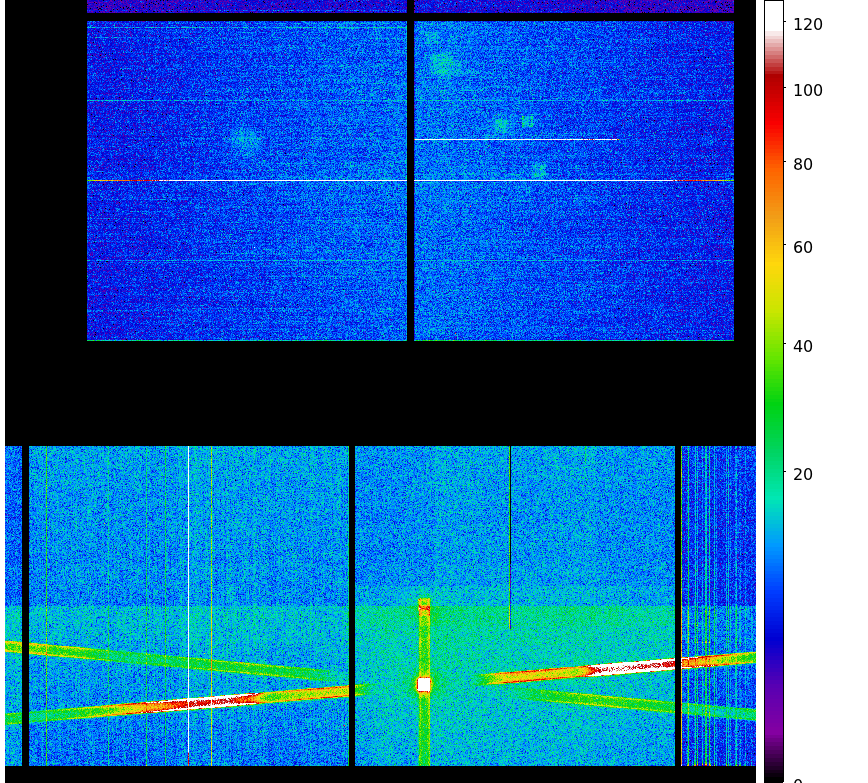
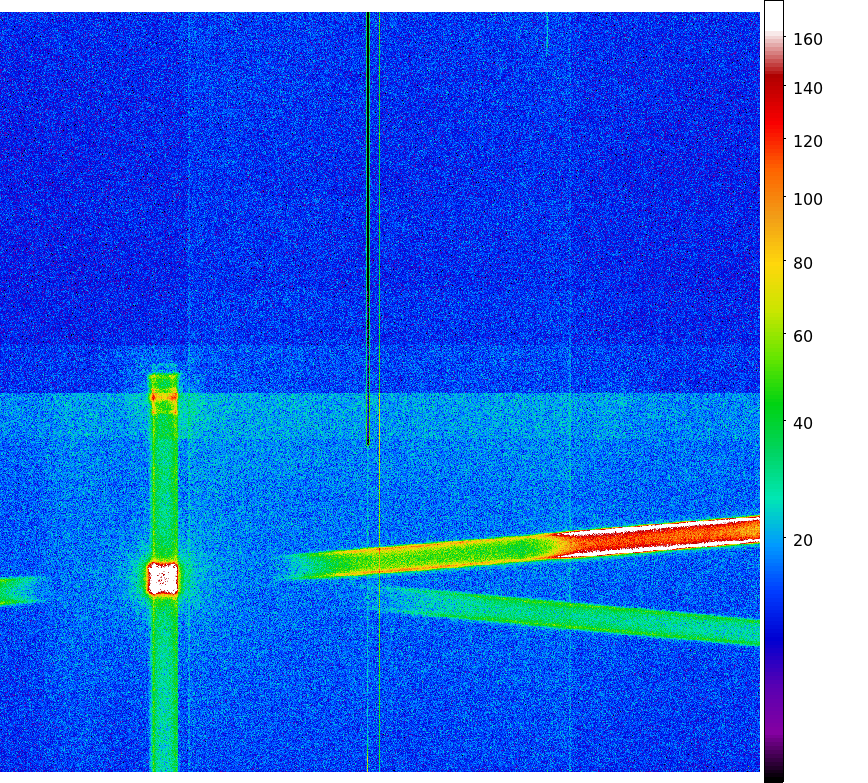
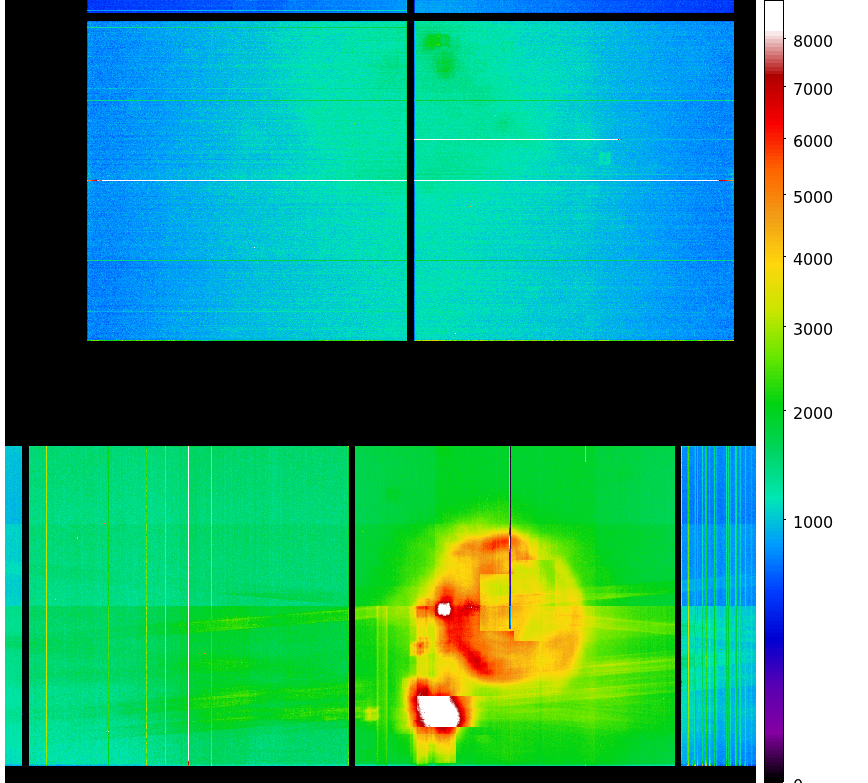
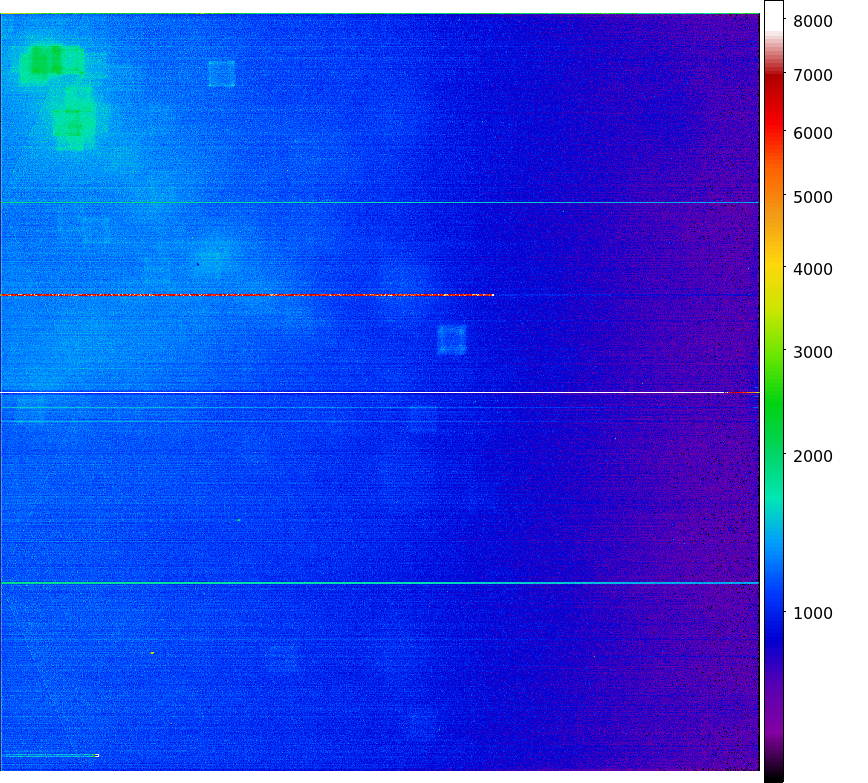
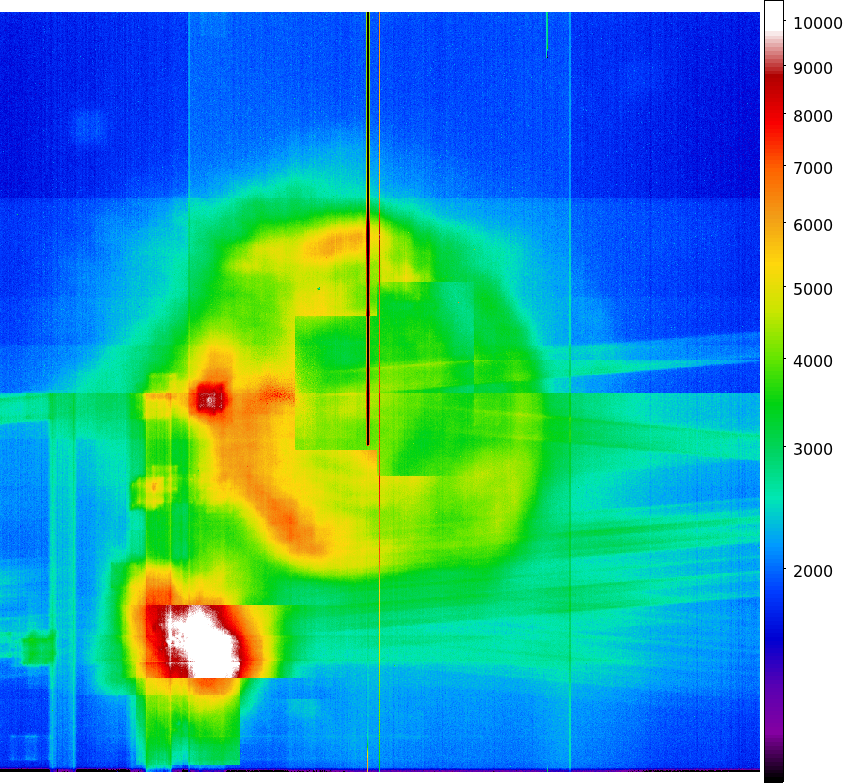
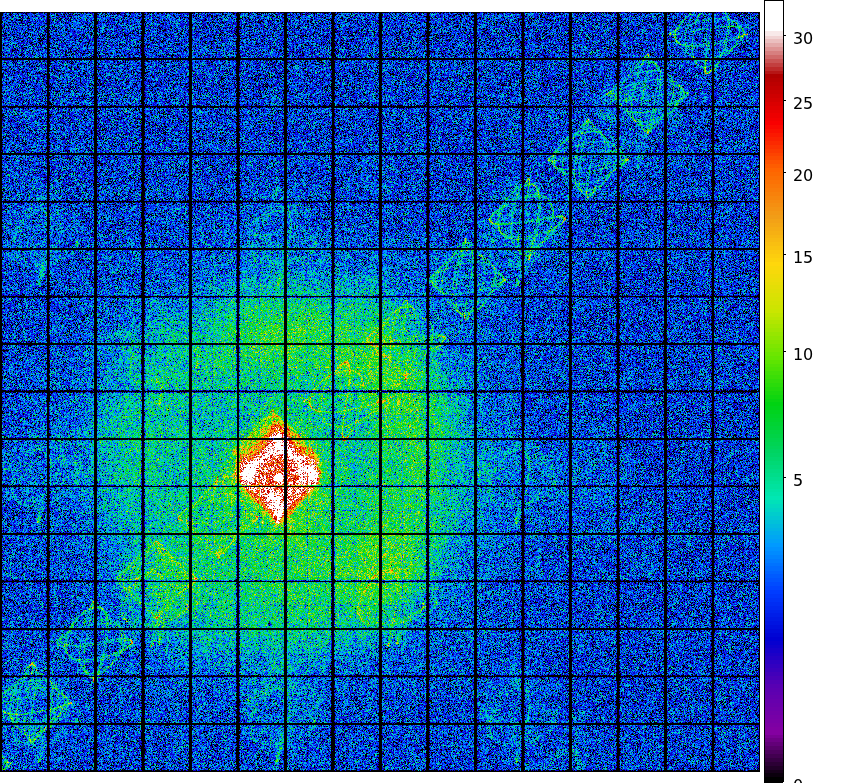
The steps we took to compute the dose map are;
Please check more detail plots at Telemetered Photon Dose Trend page.
Statistics:
# IMAGE     NPIX        MEAN           RMS              MIN     MAX
ACIS_jan09 6004901      9.132          14.69            0.0     744.0

 I2 node 0  262654      7.277817        3.155586        0.0      39.0
 I2 node 1  262654      7.801025        3.536021        0.0     294.0
 I2 node 2  262654      7.742908        3.289845        0.0      54.0
 I2 node 3  262654      7.545724        3.393373        0.0     150.0

 I3 node 0  262654      8.062775        3.472225        0.0      43.0
 I3 node 1  262654      8.588287        8.130503        0.0     204.0
 I3 node 2  262654      7.738711        3.238853        0.0      60.0
 I3 node 3  262654      7.676586        3.264439        0.0     113.0

 I2 node 0  262654      13.420929       7.497614        0.0     315.0
 I2 node 1  262654      14.907843       14.364397       0.0     206.0
 I2 node 2  262654      16.832460       19.997550       0.0     262.0
 I2 node 3  262654      13.865425       9.110147        0.0     744.0

 I3 node 0  262654      16.643264       16.010118       0.0     287.0
 I3 node 1  262654      15.140799       6.734980        0.0     112.0
 I3 node 2  262654      16.481771       11.528508       0.0     223.0
 I3 node 3  262654      18.419635       24.967049       0.0     283.0
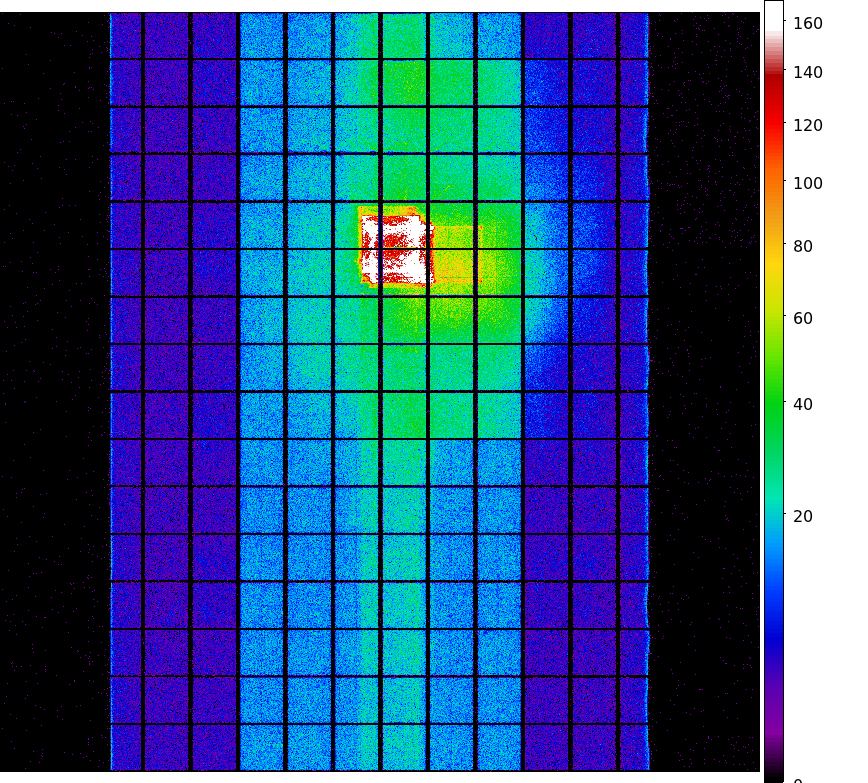
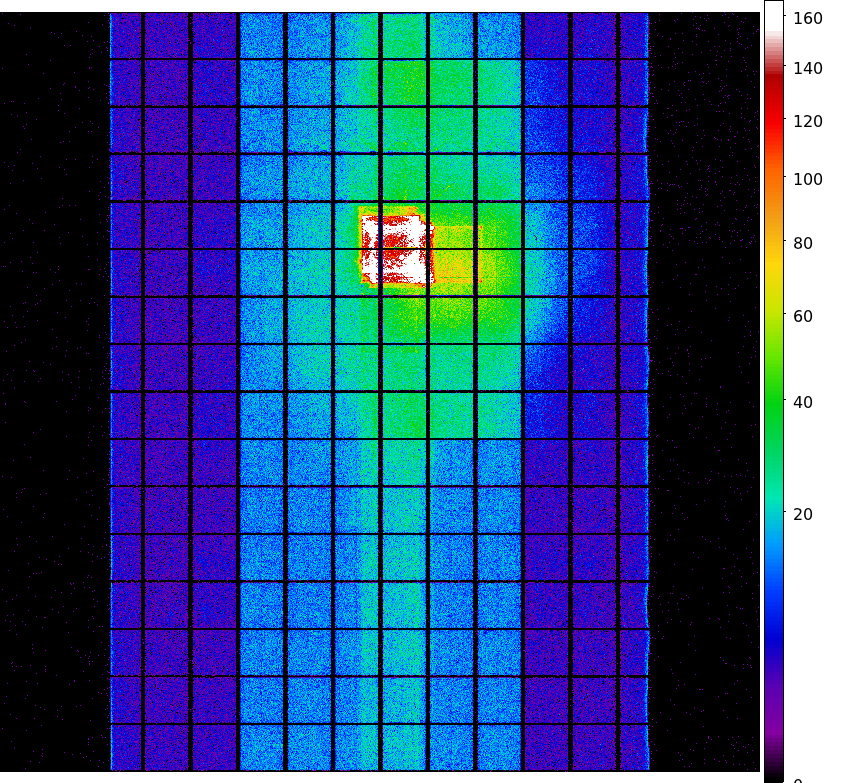
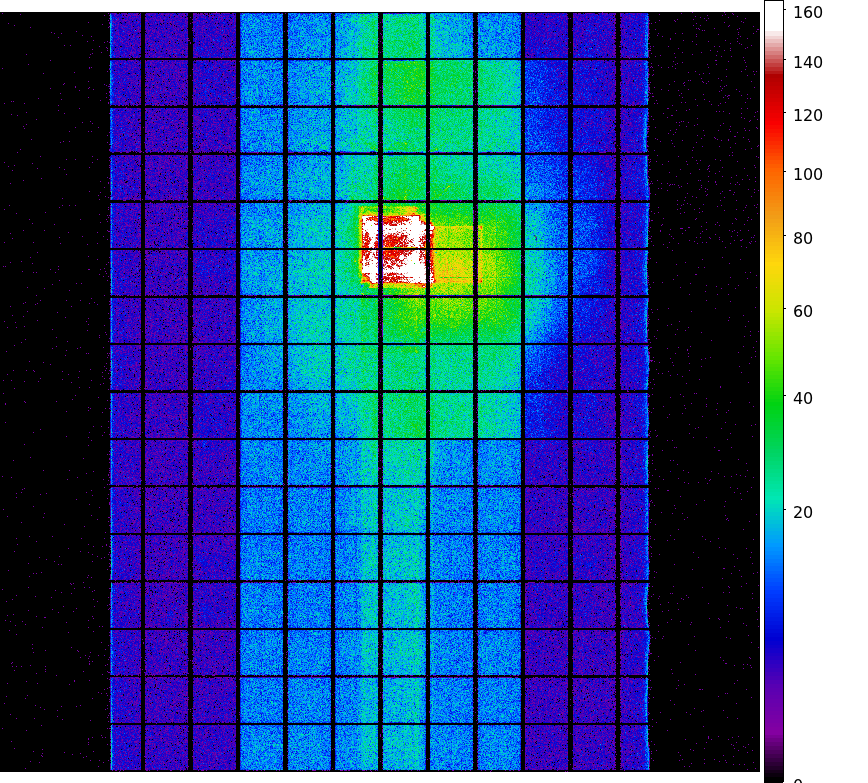
Statistics:
 IMAGE        NPIX      MEAN          RMS              MIN    MAX
ACIS_total  6004901    12.19.8          1667.15         0.0    74273.0

 I2 node 0  262654      942.680035      169.722054      0.0     4270.0
 I2 node 1  262654      997.215239      231.906785      0.0     16115.0
 I2 node 2  262654      1011.657784     195.300339      0.0     8397.0
 I2 node 3  262654      1012.833911     248.108655      0.0     27253.0

 I3 node 0  262654      1065.584601     257.568556      0.0     5595.0
 I3 node 1  262654      1106.573177     799.393884      0.0     21183.0
 I3 node 2  262654      984.276425      168.263742      0.0     4260.0
 I3 node 3  262654      972.410721      180.705618      0.0     18015.0

 I2 node 0  262654      1462.051586     192.006717      716.0   19806.0
 I2 node 1  262654      1550.775272     320.318192      747.0   8091.0
 I2 node 2  262654      1729.576846     328.423696      969.0   11460.0
 I2 node 3  262654      1669.186321     244.907089      955.0   22400.0

 I3 node 0  262654      2565.913373     1294.332634     1040.0  10978.0
 I3 node 1  262654      3775.875665     1791.265060     0.0     11874.0
 I3 node 2  262654      2777.130925     817.436885      924.0   6281.0
 I3 node 3  262654      2095.908598     346.700972      1099.0  8246.0

|
|
|
|
| Oct 2008 | Jul 2008 | Apr 2008 | Jan 2008 |
|---|
We report CTIs with a refined data definition. CTIs were computed for the temperature
dependency corrected data.
Please see
CTI page
for detailed explanation.
CTI's are computed for Mn K alpha, and defined as slope/intercept x10^4 of row # vs ADU.
Data file here
       The Mean (max) FPT: -116.06 C    std dev: 3.74
               mean width:    0.46 days std dev: 0.36
The following is a plot of focal plane temperature and sun angle, earth angle, and altitude.
The plots below were generated with a new warm pixel finding script. Please see Acis Bad Pixel Page for details.
Front Side CCDs
Back Side CCD (CCD5)
| Name | Low (keV) | High(KeV) | Description |
|---|---|---|---|
| SSoft | 0.00 | 0.50 | Super soft photons |
| Soft | 0.50 | 1.00 | Soft photons |
| Med | 1.00 | 3.00 | Moderate energy photons |
| Hard | 3.00 | 5.00 | Hard Photons |
| Harder | 5.00 | 10.00 | Very Hard photons |
| Hardest | 10.00 | Beyond 10 keV |
IMAGE NPIX MEAN STDDEV MIN MAX
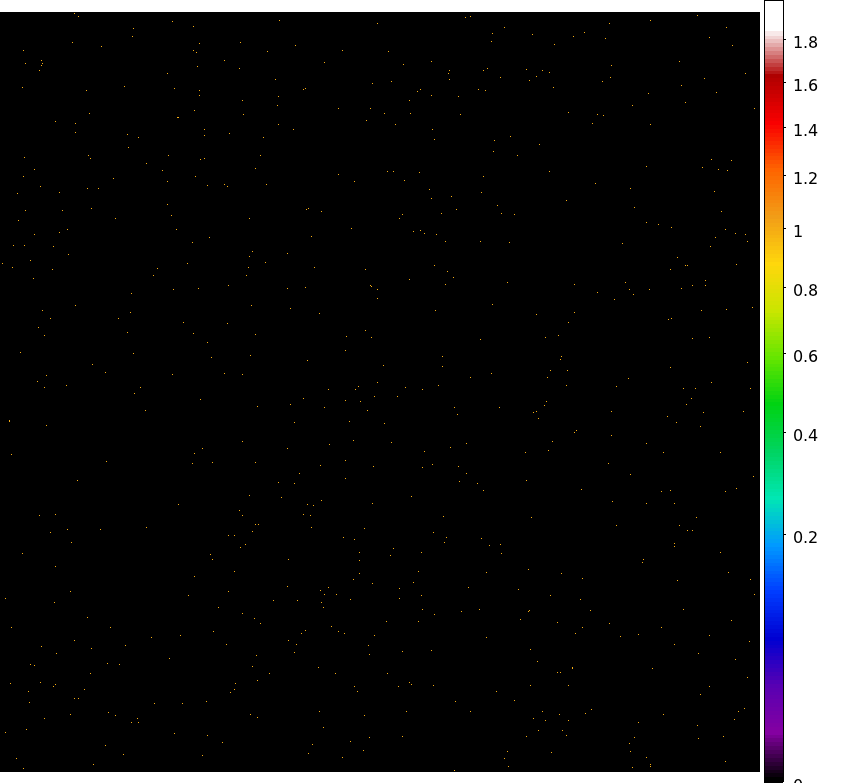
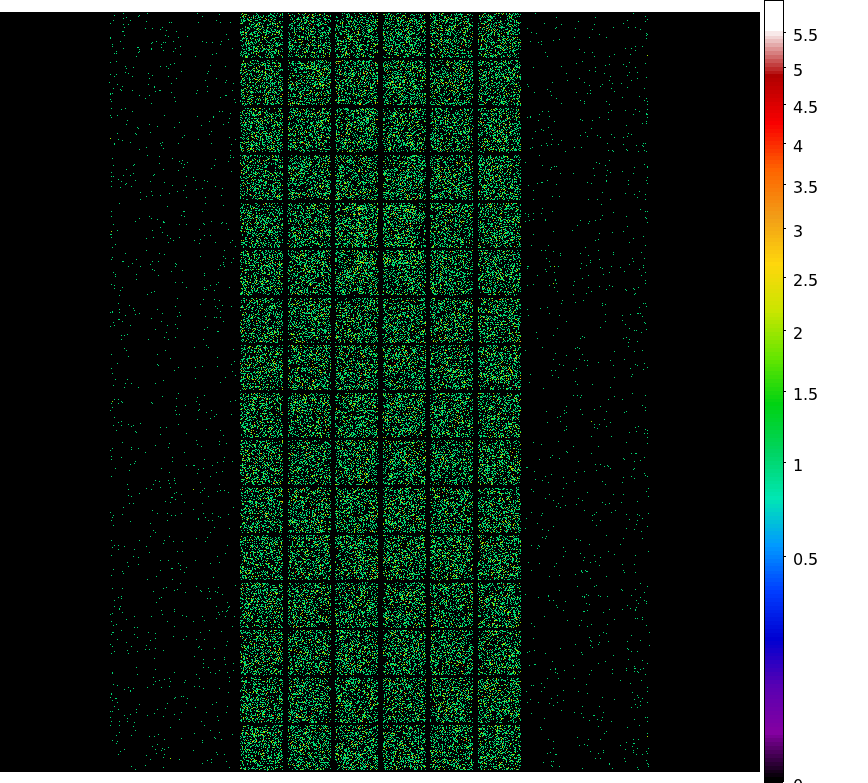
HRCI_01_2009.fits 16777216 0.012 0.034 0.0 2.0
        IMAGE                NPIX      MEAN    STDDEV      MIN       MAX
HRCI_09_1999_01_2009.fits  16777216   2.7234   3.620       0.0       290.0
        IMAGE                NPIX      MEAN    STDDEV      MIN       MAX
HRCS_01_2009.fits          16777216   0.012    0.382       0.0       6.0
        IMAGE                NPIX     MEAN      STDDEV      MIN      MAX
HRCS_09_1999_01_2009.fits  16777216  9.422      17.746      0.0      1553.0
We display a max dose trend plot corrected for events that "pile-up" in the center of the taps due to bad position information.
|

|
|

|
| Oct 2008 | Jul 2008 | Apr 2008 | Jan 2008 |
|---|
|
|

|
|
| Oct 2008 | Jul 2008 | Apr 2008 | Jan 2008 |
|---|

| id_num | id_string | good | marginal | bad | number | mag_i_avg (mag) | mag_i_min (mag) | mag_i_max (mag) |
| 1 | ACIS-1 | 100.000 | 0.000 | 0.000 | 337 | Inf | 6.049 | Inf |
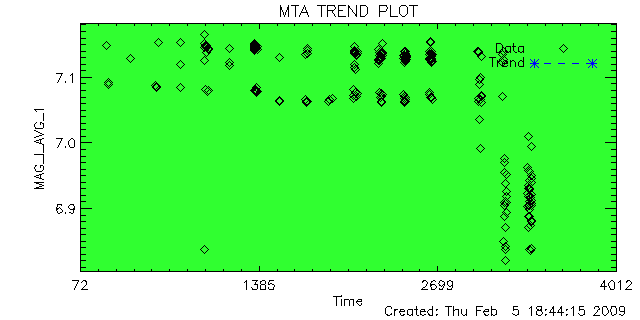
| 2 | ACIS-2 | 99.627 | 0.000 | 0.373 | 536 | 6.993 | 4.536 | 7.416 |
| 3 | ACIS-3 | 100.000 | 0.000 | 0.000 | 16 | 7.258 | 6.593 | 7.383 |
| 4 | ACIS-4 | 99.479 | 0.000 | 0.521 | 576 | 7.073 | 5.698 | 7.671 |
| 5 | ACIS-5 | 99.462 | 0.000 | 0.538 | 744 | 7.096 | 5.137 | 7.615 |
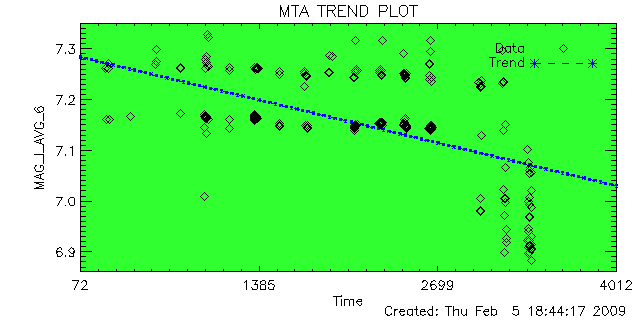
| 6 | ACIS-6 | 100.000 | 0.000 | 0.000 | 302 | 7.161 | 5.675 | 7.544 |
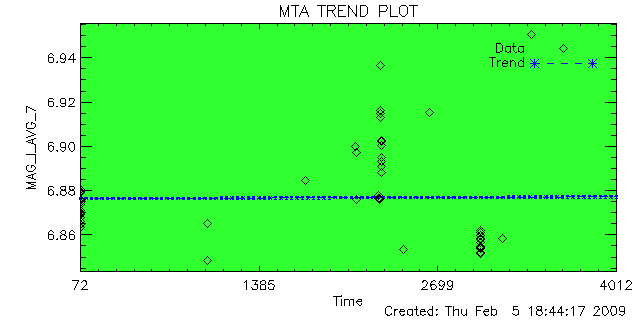
| 7 | HRC-I-1 | 100.000 | 0.000 | 0.000 | 57 | 6.879 | 4.936 | 6.964 |
| 8 | HRC-I-2 | 100.000 | 0.000 | 0.000 | 48 | 6.917 | 6.721 | 7.119 |
| 9 | HRC-I-3 | 100.000 | 0.000 | 0.000 | 60 | 6.969 | 6.723 | 7.259 |
| 10 | HRC-I-4 | 90.909 | 0.000 | 9.091 | 33 | 6.896 | 6.527 | 6.975 |
| 11 | HRC-S-1 | 97.436 | 0.000 | 2.564 | 39 | 6.893 | 5.807 | 7.189 |
| 12 | HRC-S-2 | 96.774 | 0.000 | 3.226 | 31 | 6.909 | 6.156 | 8.385 |
| 13 | HRC-S-3 | 96.774 | 0.000 | 3.226 | 31 | 6.916 | 5.958 | 8.232 |
| 14 | HRC-S-4 | 100.000 | 0.000 | 0.000 | 24 | 6.884 | 5.739 | 8.060 |
No valid fit data points found during the period
No valid fit data points found during the period
| EPHIN Temperatures and Voltage | ||||||
|---|---|---|---|---|---|---|
| Previous Quarter | ||||||
| MSID | MEAN | RMS | DELTA/YR | DELTA/YR/YR | UNITS | DESCRIPTION |
| 5EPHINT | 314.54 | 3.45 | 9.658e+00 | -1.010e+02 | K | EPHIN TEMP |
| HKEBOXTEMP | 319.13 | 3.54 | 8.432e+00 | -1.031e+02 | K | EPHIN HOUSEKEEPING EBOX: TEMPERATURE (5EHSE300) |
| HKN6V | -5.99 | 9.834e-03 | -3.740e-02 | -9.355e-02 | V | HK -6 Volts Rail - Voltage |
| TEIO | 311.05 | 18.47 | 4.528e+00 | -7.883e+01 | K | EPHIN ELECTRONICS HOUSING TEMP |
| TEPHIN | 314.45 | 3.75 | 9.239e+00 | -1.047e+02 | K | EPHIN SENSOR HOUSING TEMP |
| MUPS | ||||||
|---|---|---|---|---|---|---|
| Previous Quarter | ||||||
| MSID | MEAN | RMS | DELTA/YR | DELTA/YR/YR | UNITS | DESCRIPTION |
| AOTHRST2 | 6.535e+03 | 4.867e+03 | -5.413e+04 | -1.583e+05 | - | ACCUMULATED THRUSTER ON-TIME COUNTS (RCS2 OR MUPS2) |
| PM1THV1T | 329.54 | 6.95 | 7.864e+00 | -2.183e+02 | K | MUPS 1 THRUSTER VALVE 01 TEMP |
| PM1THV2T | 331.29 | 5.65 | 6.489e+00 | -2.232e+02 | K | MUPS 1 THRUSTER VALVE 02 TEMP |
| PFTANKIP | 1.963e+03 | 14.10 | -1.356e+00 | -2.763e+02 | PSIA | FUEL TANK INLET PRESSURE |
| PFTANKOP | 1.936e+03 | 14.33 | -9.027e-01 | -2.785e+02 | PSIA | FUEL TANK OUTLET PRESSURE |
| PHETANKP | 629.62 | 0.000e+00 | 0.000e+00 | 0.000e+00 | PSIA | HE TANK PRESSURE |
| PXTANKIP | 1.900e+03 | 4.51 | 3.513e+00 | 6.059e+01 | PSIA | OX TANK INLET PRESSURE |
| PXTANKOP | 1.912e+03 | 4.80 | 2.812e+00 | 1.037e+02 | PSIA | OX TANK OUTLET PRESSURE |
| SIM Temperature | ||||||
|---|---|---|---|---|---|---|
| Previous Quarter | ||||||
| MSID | MEAN | RMS | DELTA/YR | DELTA/YR/YR | UNITS | DESCRIPTION |
| BOXTEMP | 289.67 | 2.48 | 3.660e+00 | 2.509e-14 | K | SEA box temperature |
| FAMTRTEMP | 280.77 | 3.71 | 6.163e+00 | 3.455e-14 | K | FA motor temperature |
| PSUTEMP | 317.90 | 2.00 | 2.297e+00 | -3.634e-13 | (3FAPSAT) | SEA power supply temperature |
| 3FAMTRAT | 8.67 | 3.58 | -2.041e+01 | -2.359e-02 | C | SEA-A FOCUS DRIVE MOTOR TEMP |
| 3FASEAAT | 16.88 | 2.90 | -1.449e+01 | -3.048e-02 | C | SEA-A BOX TEMP |
| SIM Electronics | ||||||
|---|---|---|---|---|---|---|
| Previous Quarter | ||||||
| MSID | MEAN | RMS | DELTA/YR | DELTA/YR/YR | UNITS | DESCRIPTION |
| AGRNDADC | 1.723e-04 | 3.448e-04 | -5.347e-05 | -5.672e-02 | V | Analog ground A/D convert reading |
| FATABADC | 4.99 | 6.497e-04 | -6.846e-04 | -7.365e-02 | Converter | FA Tab Position Sensor A/D |
| N15VADC | -15.01 | 4.311e-04 | 1.681e-04 | -2.619e-02 | Reading | -15V Power Supply A/D Converter |
| P15VADC | 14.96 | 6.599e-04 | -9.817e-04 | -1.027e-01 | Reading | +5V Power Supply A/D Converter |
| P5VADC | 4.95 | 4.019e-03 | -8.164e-03 | -2.354e-02 | Reading | +5V Power Supply A/D Converter |
| TSCTABADC | 4.99 | 1.100e-03 | -1.102e-03 | -1.043e-01 | converter | TSC Tab Position Sensor A/D |
| Spacecraft Main Temperature | ||||||
|---|---|---|---|---|---|---|
| Previous Quarter | ||||||
| MSID | MEAN | RMS | DELTA/YR | DELTA/YR/YR | UNITS | DESCRIPTION |
| TASPRWC | 265.54 | 1.27 | 5.221e-01 | 2.016e+01 | K | AFT SHEAR PANEL TEMP:RWA CRNR COMP |
| TCM_CTU | 286.54 | 2.58 | 7.054e-01 | -4.174e+01 | K | CTU TEMP |
| TEP_PSU2 | 265.14 | 1.43 | -1.128e-01 | 2.676e+01 | K | PSU-2 TEMP |
| TFSPCMP | 265.73 | 1.81 | 8.490e-01 | -7.477e+00 | K | FWD SHEAR PANEL TEMP: +Z CCDM COMP |
| 
|
| Year | Month | |||||||||||
|---|---|---|---|---|---|---|---|---|---|---|---|---|
| 1999 | Jul | Aug | Sep | Oct | Nov | Dec | ||||||
| 2000 | Jan | Feb | Mar | Apr | May | Jun | Jul | Aug | Sep | Oct | Nov | Dec |
| 2001 | Jan | Feb | Mar | Apr | May | Jun | Jul | Aug | Sep | Oct | Nov | Dec |
| 2002 | Jan | Feb | Mar | Apr | May | Jun | Jul | Aug | Sep | Oct | Nov | Dec |
| 2003 | Jan | Feb | Mar | Apr | May | Jun | Jul | Aug | Sep | Oct | Nov | Dec |
| 2004 | Jan | Feb | Mar | Apr | May | Jun | Jul | Aug | Sep | Oct | Nov | Dec |
| 2005 | Jan | Feb | Mar | Apr | May | Jun | Jul | Aug | Sep | Oct | Nov | Dec |
| 2006 | Jan | Feb | Mar | Apr | May | Jun | Jul | Aug | Sep | Oct | Nov | Dec |
| 2007 | Jan | Feb | Mar | Apr | May | Jun | Jul | Aug | Sep | Oct | Nov | Dec |
| 2008 | Jan | Feb | Mar | Apr | May | Jun | Jul | Aug | Sep | Oct | Nov | Dec |
)
)
)
)
)
)
)
)
)
)
)
)
)
)
)
)
)
)
)
)
)
)
)
)
)
)
)
)
)
)
)
)
)
)
)
)
)
)
)
)
)
)