The steps we took to compute the dose map are;
Please check more detail plots at Telemetered Photon Dose Trend page.
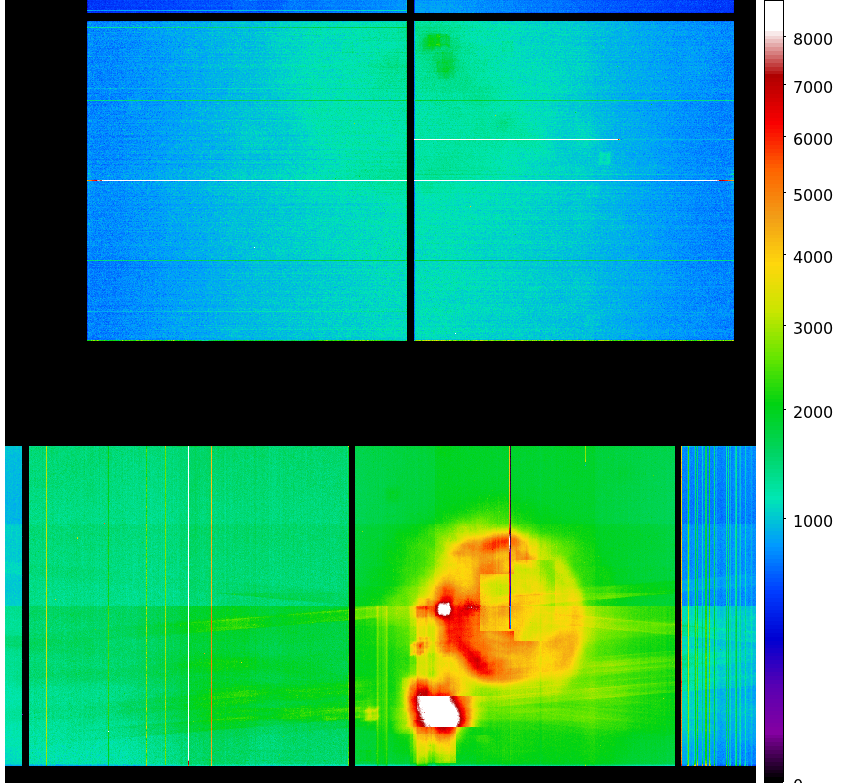
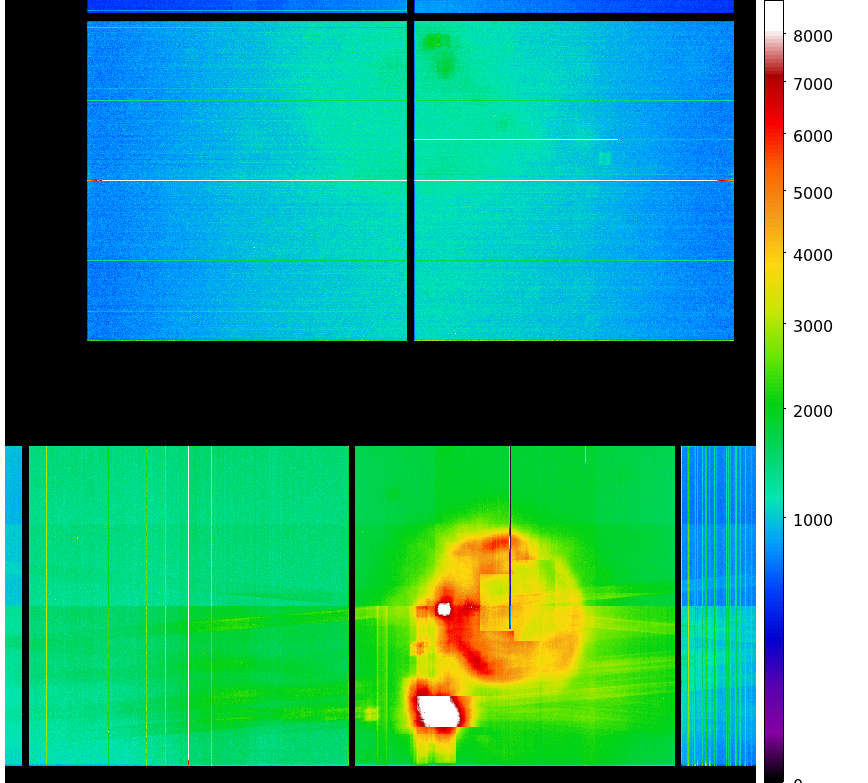
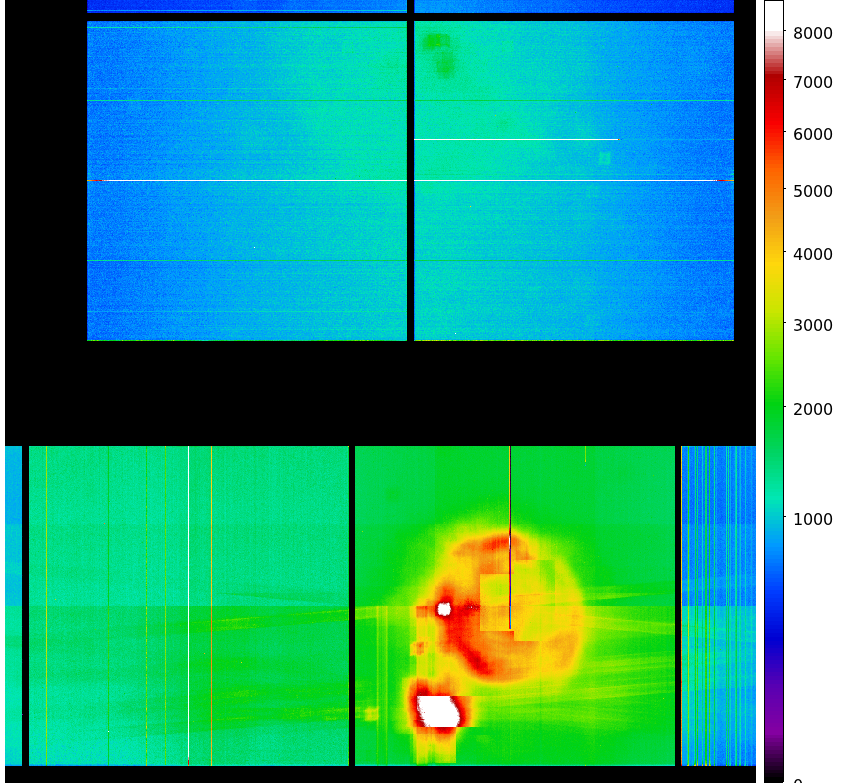
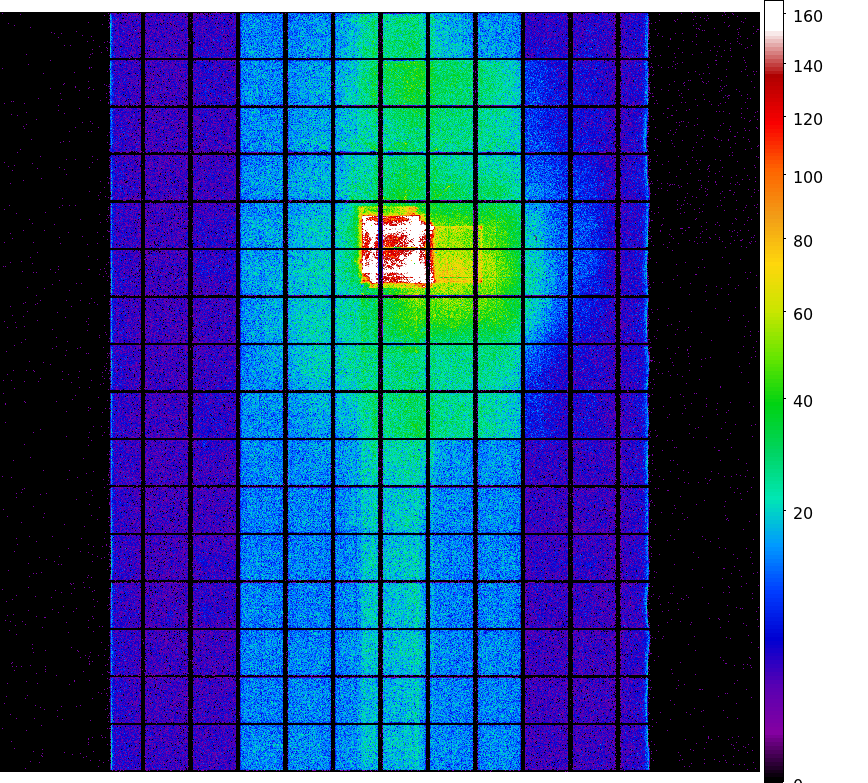
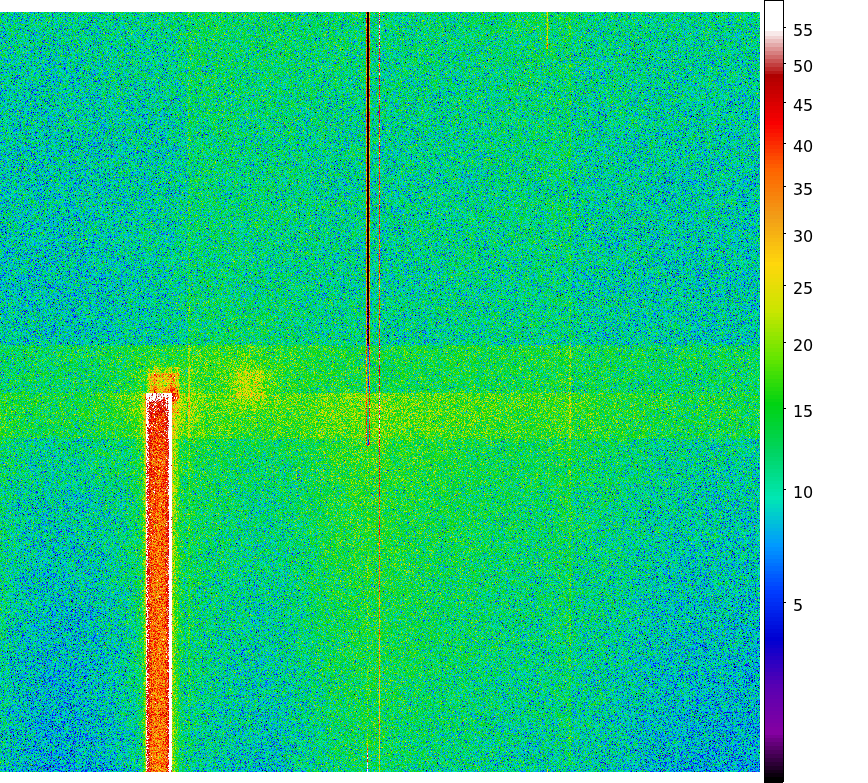
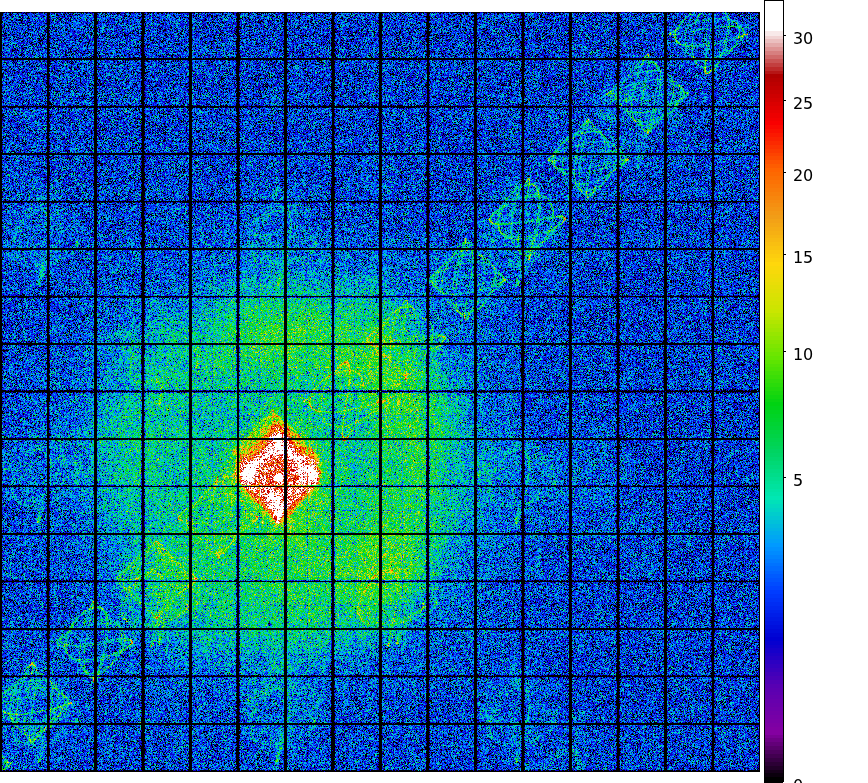
Statistics:
# IMAGE     NPIX        MEAN           RMS              MIN     MAX
ACIS_feb09 6004901      8.300          12.72            0.0     665.0

 I2 node 0  262654      9.628666        3.857325        0.0      50.0
 I2 node 1  262654      10.361185       4.408091        0.0     265.0
 I2 node 2  262654      10.181511       3.962278        0.0      57.0
 I2 node 3  262654      9.975927        4.164862        0.0      94.0

 I3 node 0  262654      10.416062       3.966410        0.0      53.0
 I3 node 1  262654      10.940823       10.846187       0.0     270.0
 I3 node 2  262654      9.846904        3.801582        0.0      86.0
 I3 node 3  262654      9.832130        3.902414        0.0     173.0

 S2 node 0  262654      9.866192        3.846989        0.0     303.0
 S2 node 1  262654      10.212547       4.324828        0.0      73.0
 S2 node 2  262654      11.005396       4.038586        0.0      96.0
 S2 node 3  262654      11.191559       3.887319        0.0     586.0

 S3 node 0  262654      13.494167       10.506552       0.0     140.0
 S3 node 1  262654      12.550160       4.473683        0.0      71.0
 S3 node 2  262654      12.406480       3.872232        0.0      44.0
 S3 node 3  262654      10.700070       3.539288        0.0      49.0
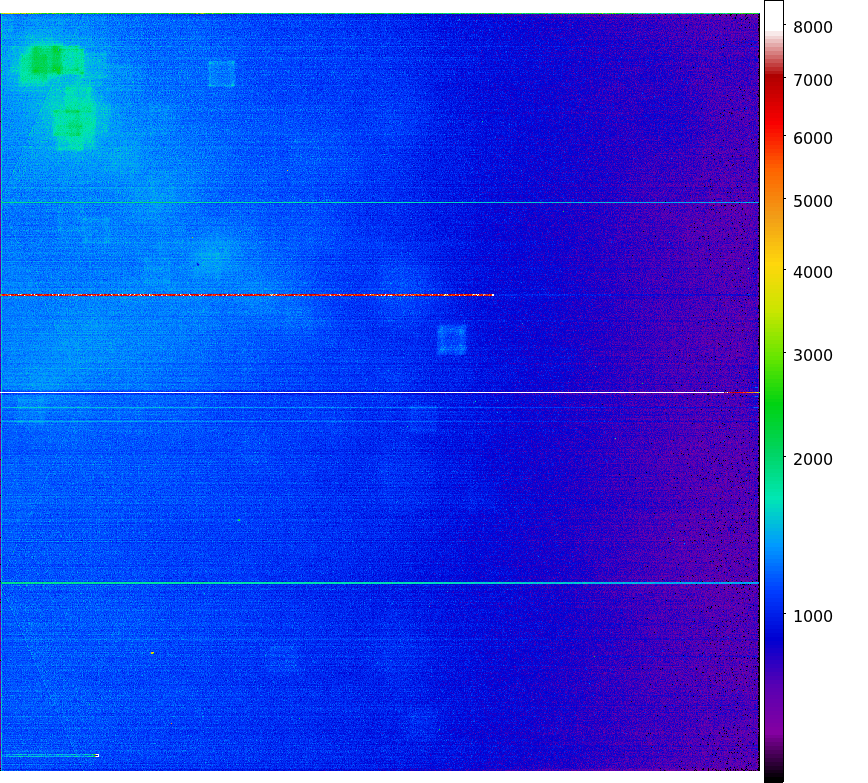
Statistics:
 IMAGE        NPIX      MEAN          RMS              MIN    MAX
ACIS_total  6004901    1228.14          1678.06         0.0    74872.0

 I2 node 0  262654      10.940823       10.846187       0.0     270.0
 I2 node 1  262654      1007.576424     234.761550      0.0     16380.0
 I2 node 2  262654      1021.839294     197.450252      0.0     8410.0
 I2 node 3  262654      1022.809838     250.631606      0.0     27267.0

 I3 node 0  262654      1076.000663     259.579186      0.0     5634.0
 I3 node 1  262654      1117.514000     809.653702      0.0     21453.0
 I3 node 2  262654      994.123330      170.258379      0.0     4313.0
 I3 node 3  262654      982.242851      182.844031      0.0     18167.0

 S2 node 0  262654      1471.917777     193.495955      721.0   19811.0
 S2 node 1  262654      1560.987819     322.525054      753.0   8152.0
 S2 node 2  262654      1740.582242     329.549160      977.0   11556.0
 S2 node 3  262654      1680.377881     245.576528      964.0   22672.0

 S3 node 0  262654      2579.407541     1299.956287     1049.0  10994.0
 S3 node 1  262654      3788.425825     1792.127755     0.0     11888.0
 S3 node 2  262654      2789.537404     818.380245      932.0   6315.0
 S3 node 3  262654      2106.608668     347.295265      1105.0  8277.0
|
|
|
|
| Nov 2008 | Aug 2008 | May 2008 | Feb 2008 |
|---|
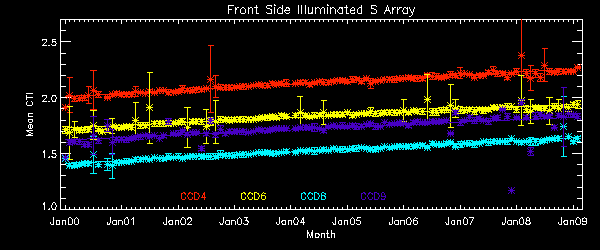
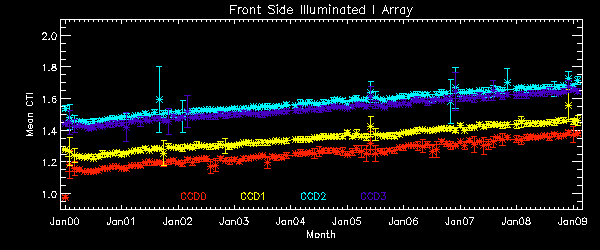
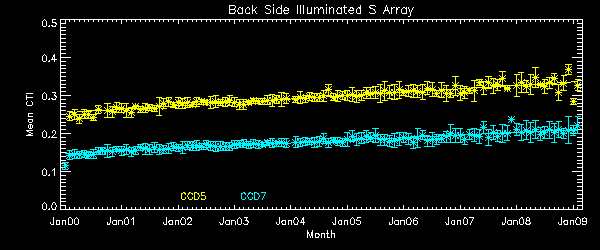
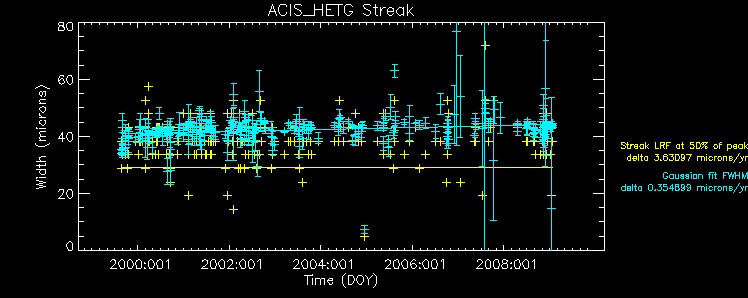
We report CTIs with a refined data definition. CTIs were computed for the temperature
dependency corrected data.
Please see
CTI page
for detailed explanation.
CTI's are computed for Mn K alpha, and defined as slope/intercept x10^4 of row # vs ADU.
Data file here
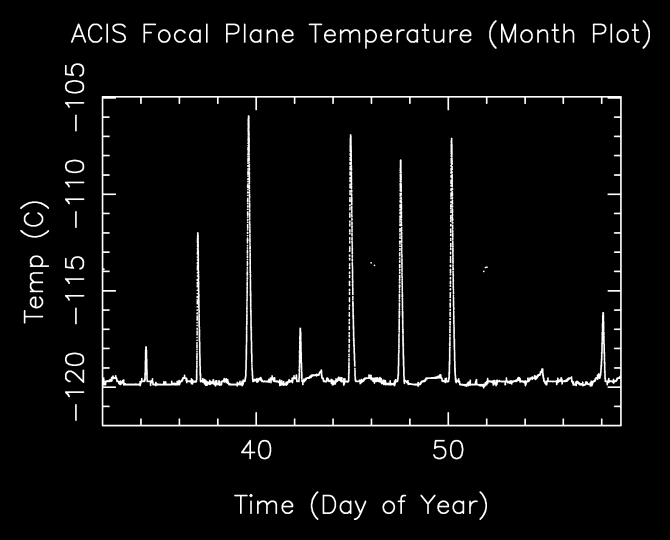
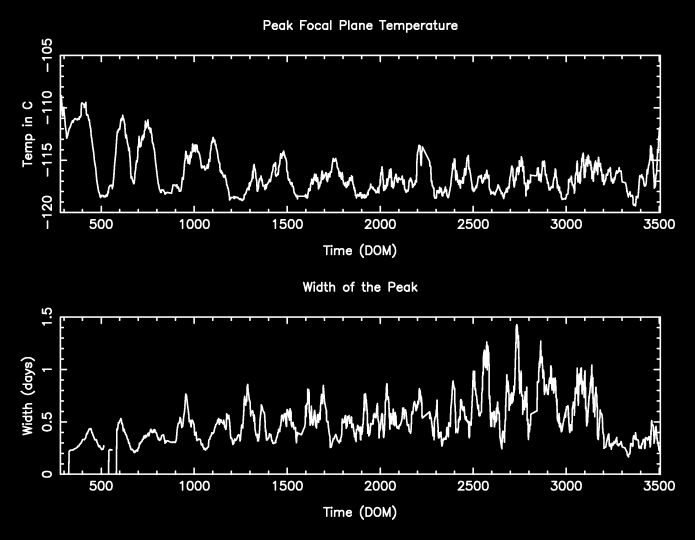
       The Mean (max) FPT: -112.86 C    std dev: 4.89
               mean width:    0.22 days std dev: 0.12
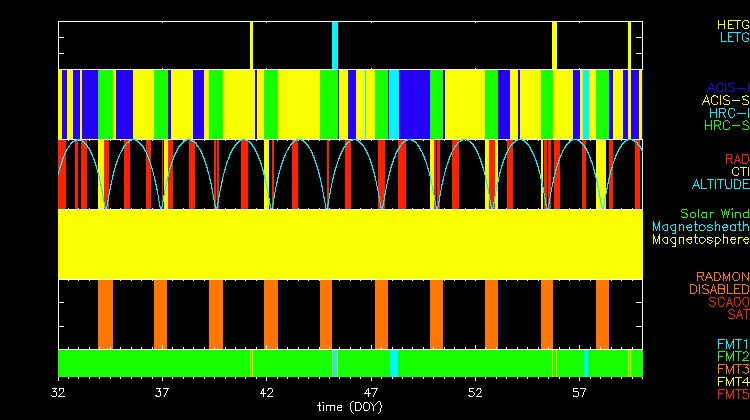
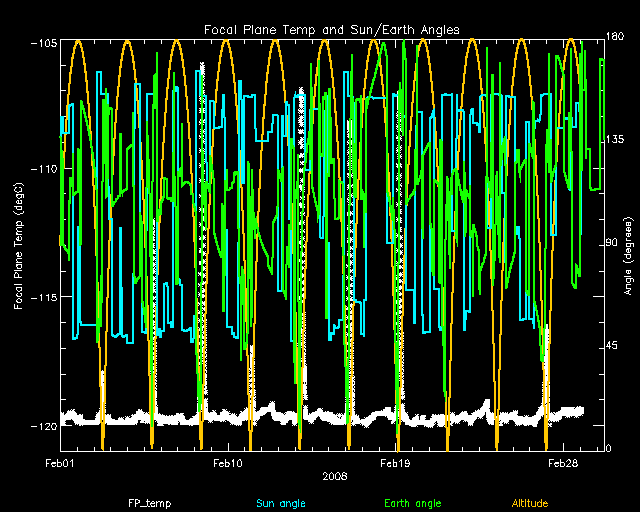
The following is a plot of focal plane temperature and sun angle, earth angle, and altitude.
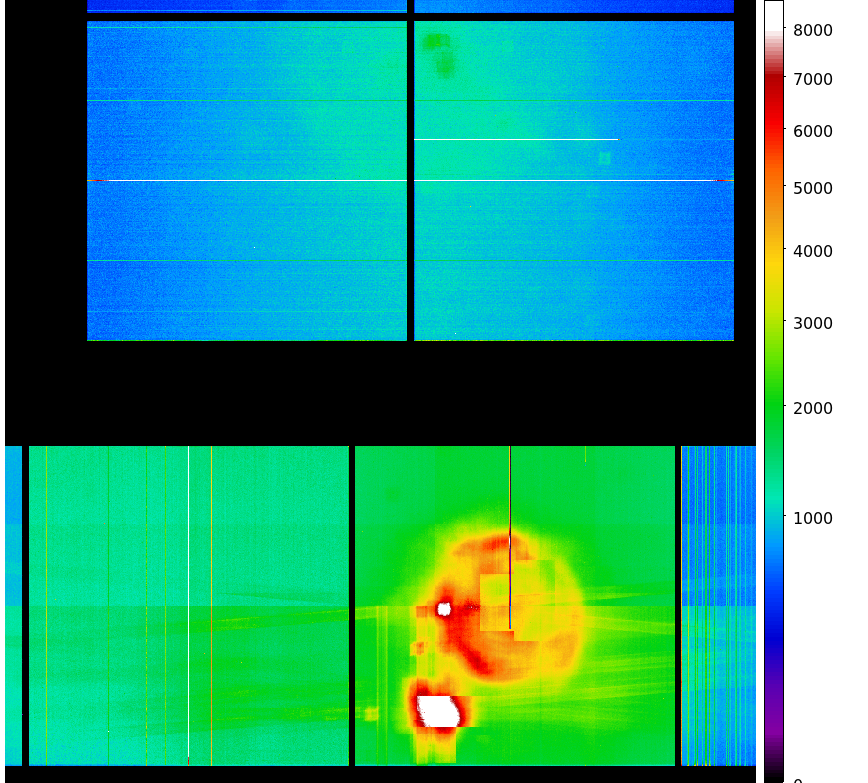
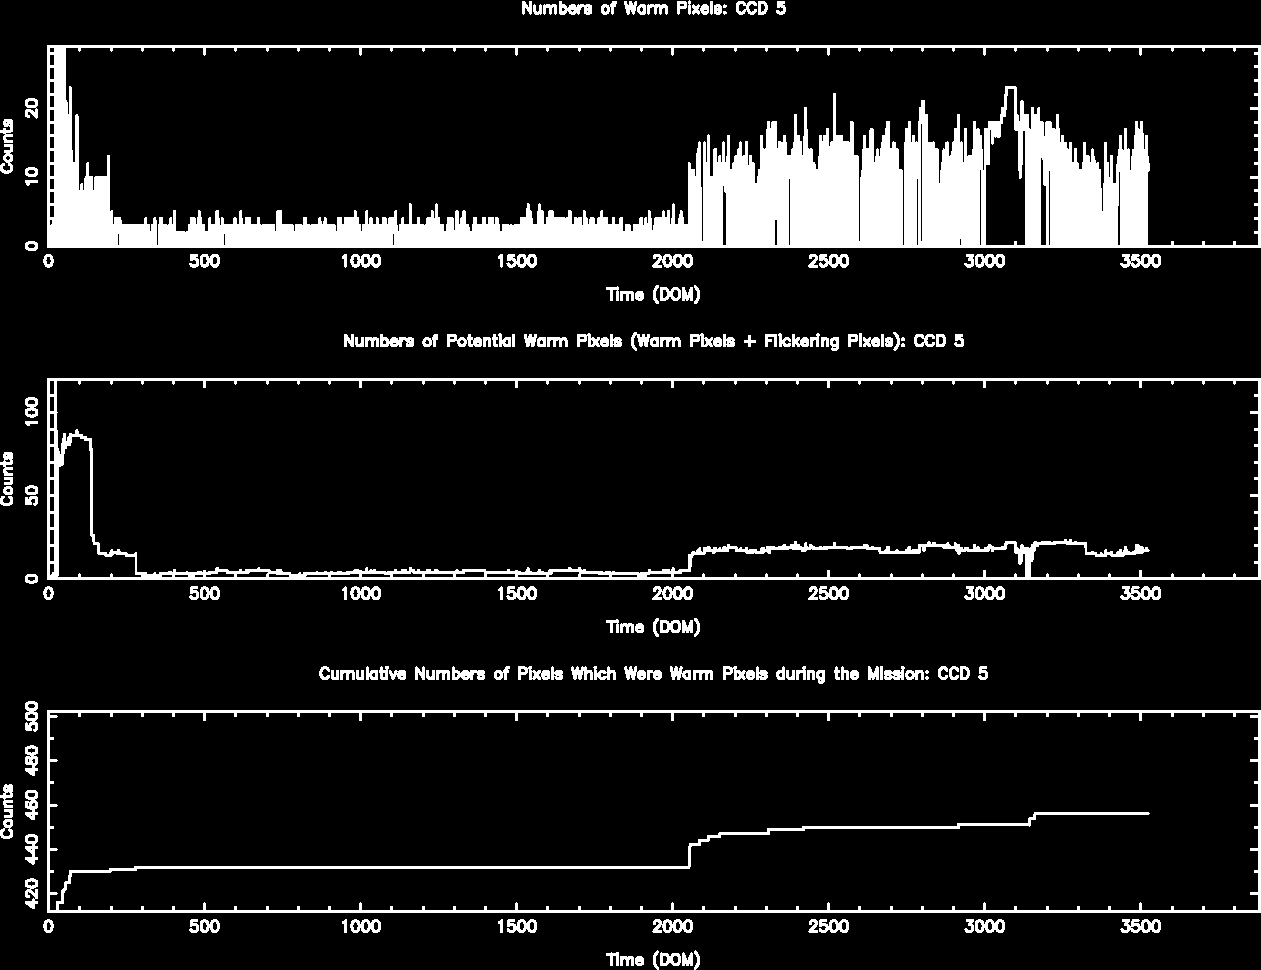
The plots below were generated with a new warm pixel finding script. Please see Acis Bad Pixel Page for details.
Front Side CCDs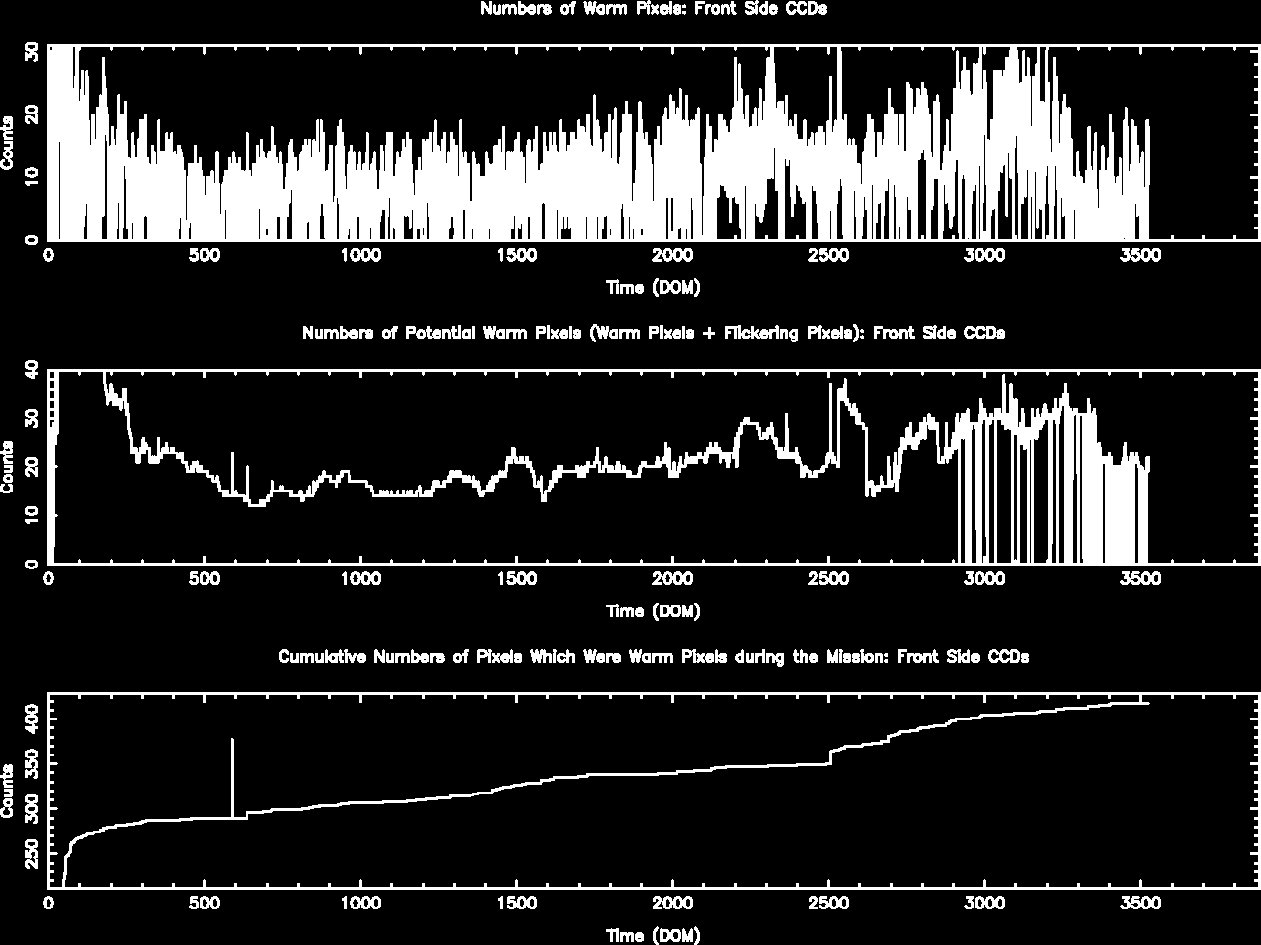
Back Side CCD (CCD5)
| Name | Low (keV) | High(KeV) | Description |
|---|---|---|---|
| SSoft | 0.00 | 0.50 | Super soft photons |
| Soft | 0.50 | 1.00 | Soft photons |
| Med | 1.00 | 3.00 | Moderate energy photons |
| Hard | 3.00 | 5.00 | Hard Photons |
| Harder | 5.00 | 10.00 | Very Hard photons |
| Hardest | 10.00 | Beyond 10 keV |
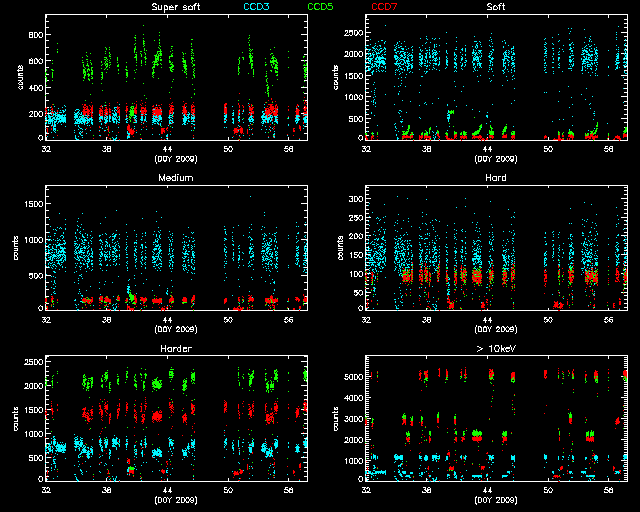
IMAGE NPIX MEAN STDDEV MIN MAX
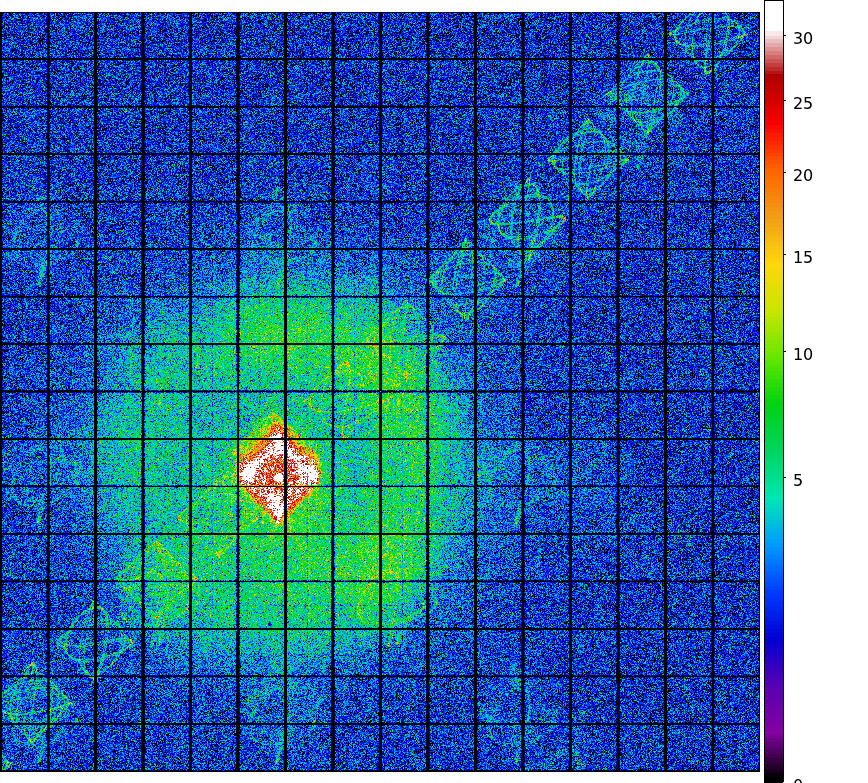
HRCI_02_2009.fits 16777216 0.028 0.170 0.0 4.0
IMAGE NPIX MEAN STDDEV MIN MAX
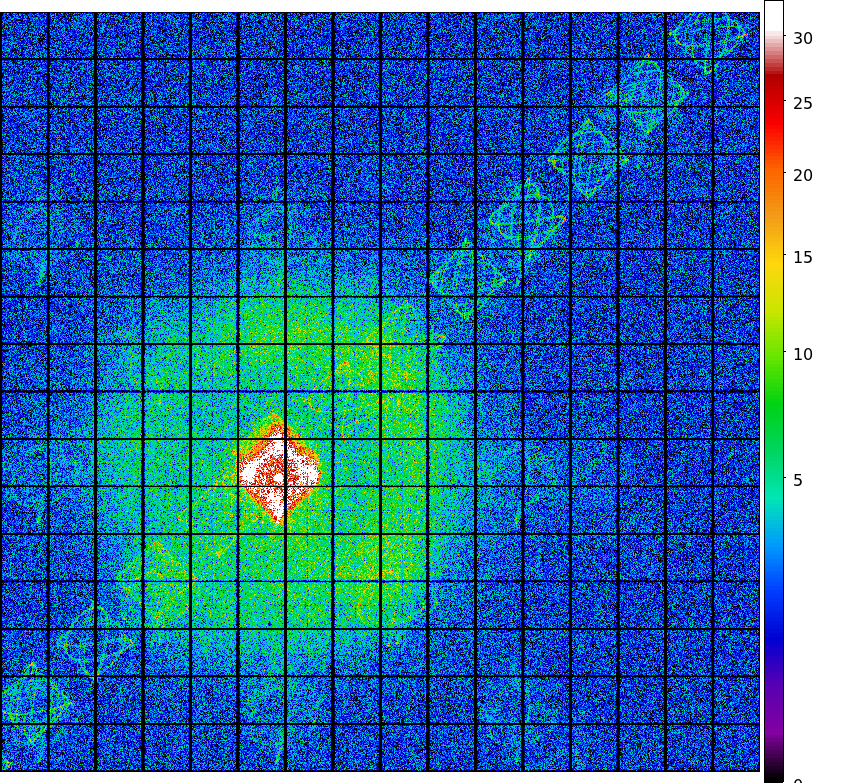
HRCI_09_1999_02_2009.fits 16777216 2.753 3.631 0.0 290.0
IMAGE NPIX MEAN STDDEV MIN MAX
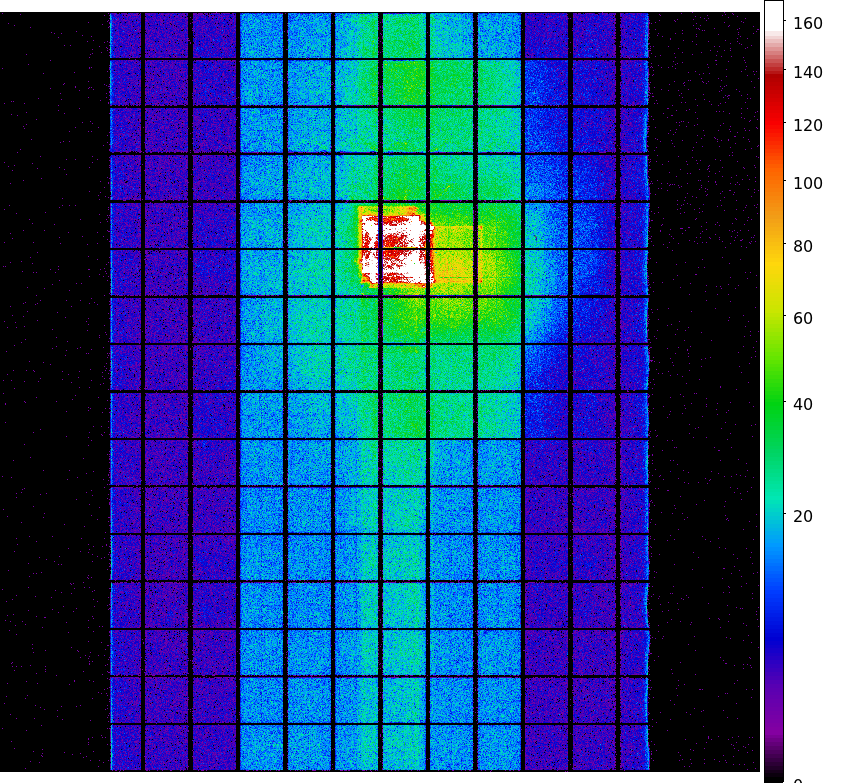
HRCS_02_2009.fits 16777216 0.012 0.110 0.0 4.0
        IMAGE                NPIX     MEAN      STDDEV      MIN      MAX
HRCS_09_1999_02_2009.fits  16777216  9.534      17.758      0.0      1553.0
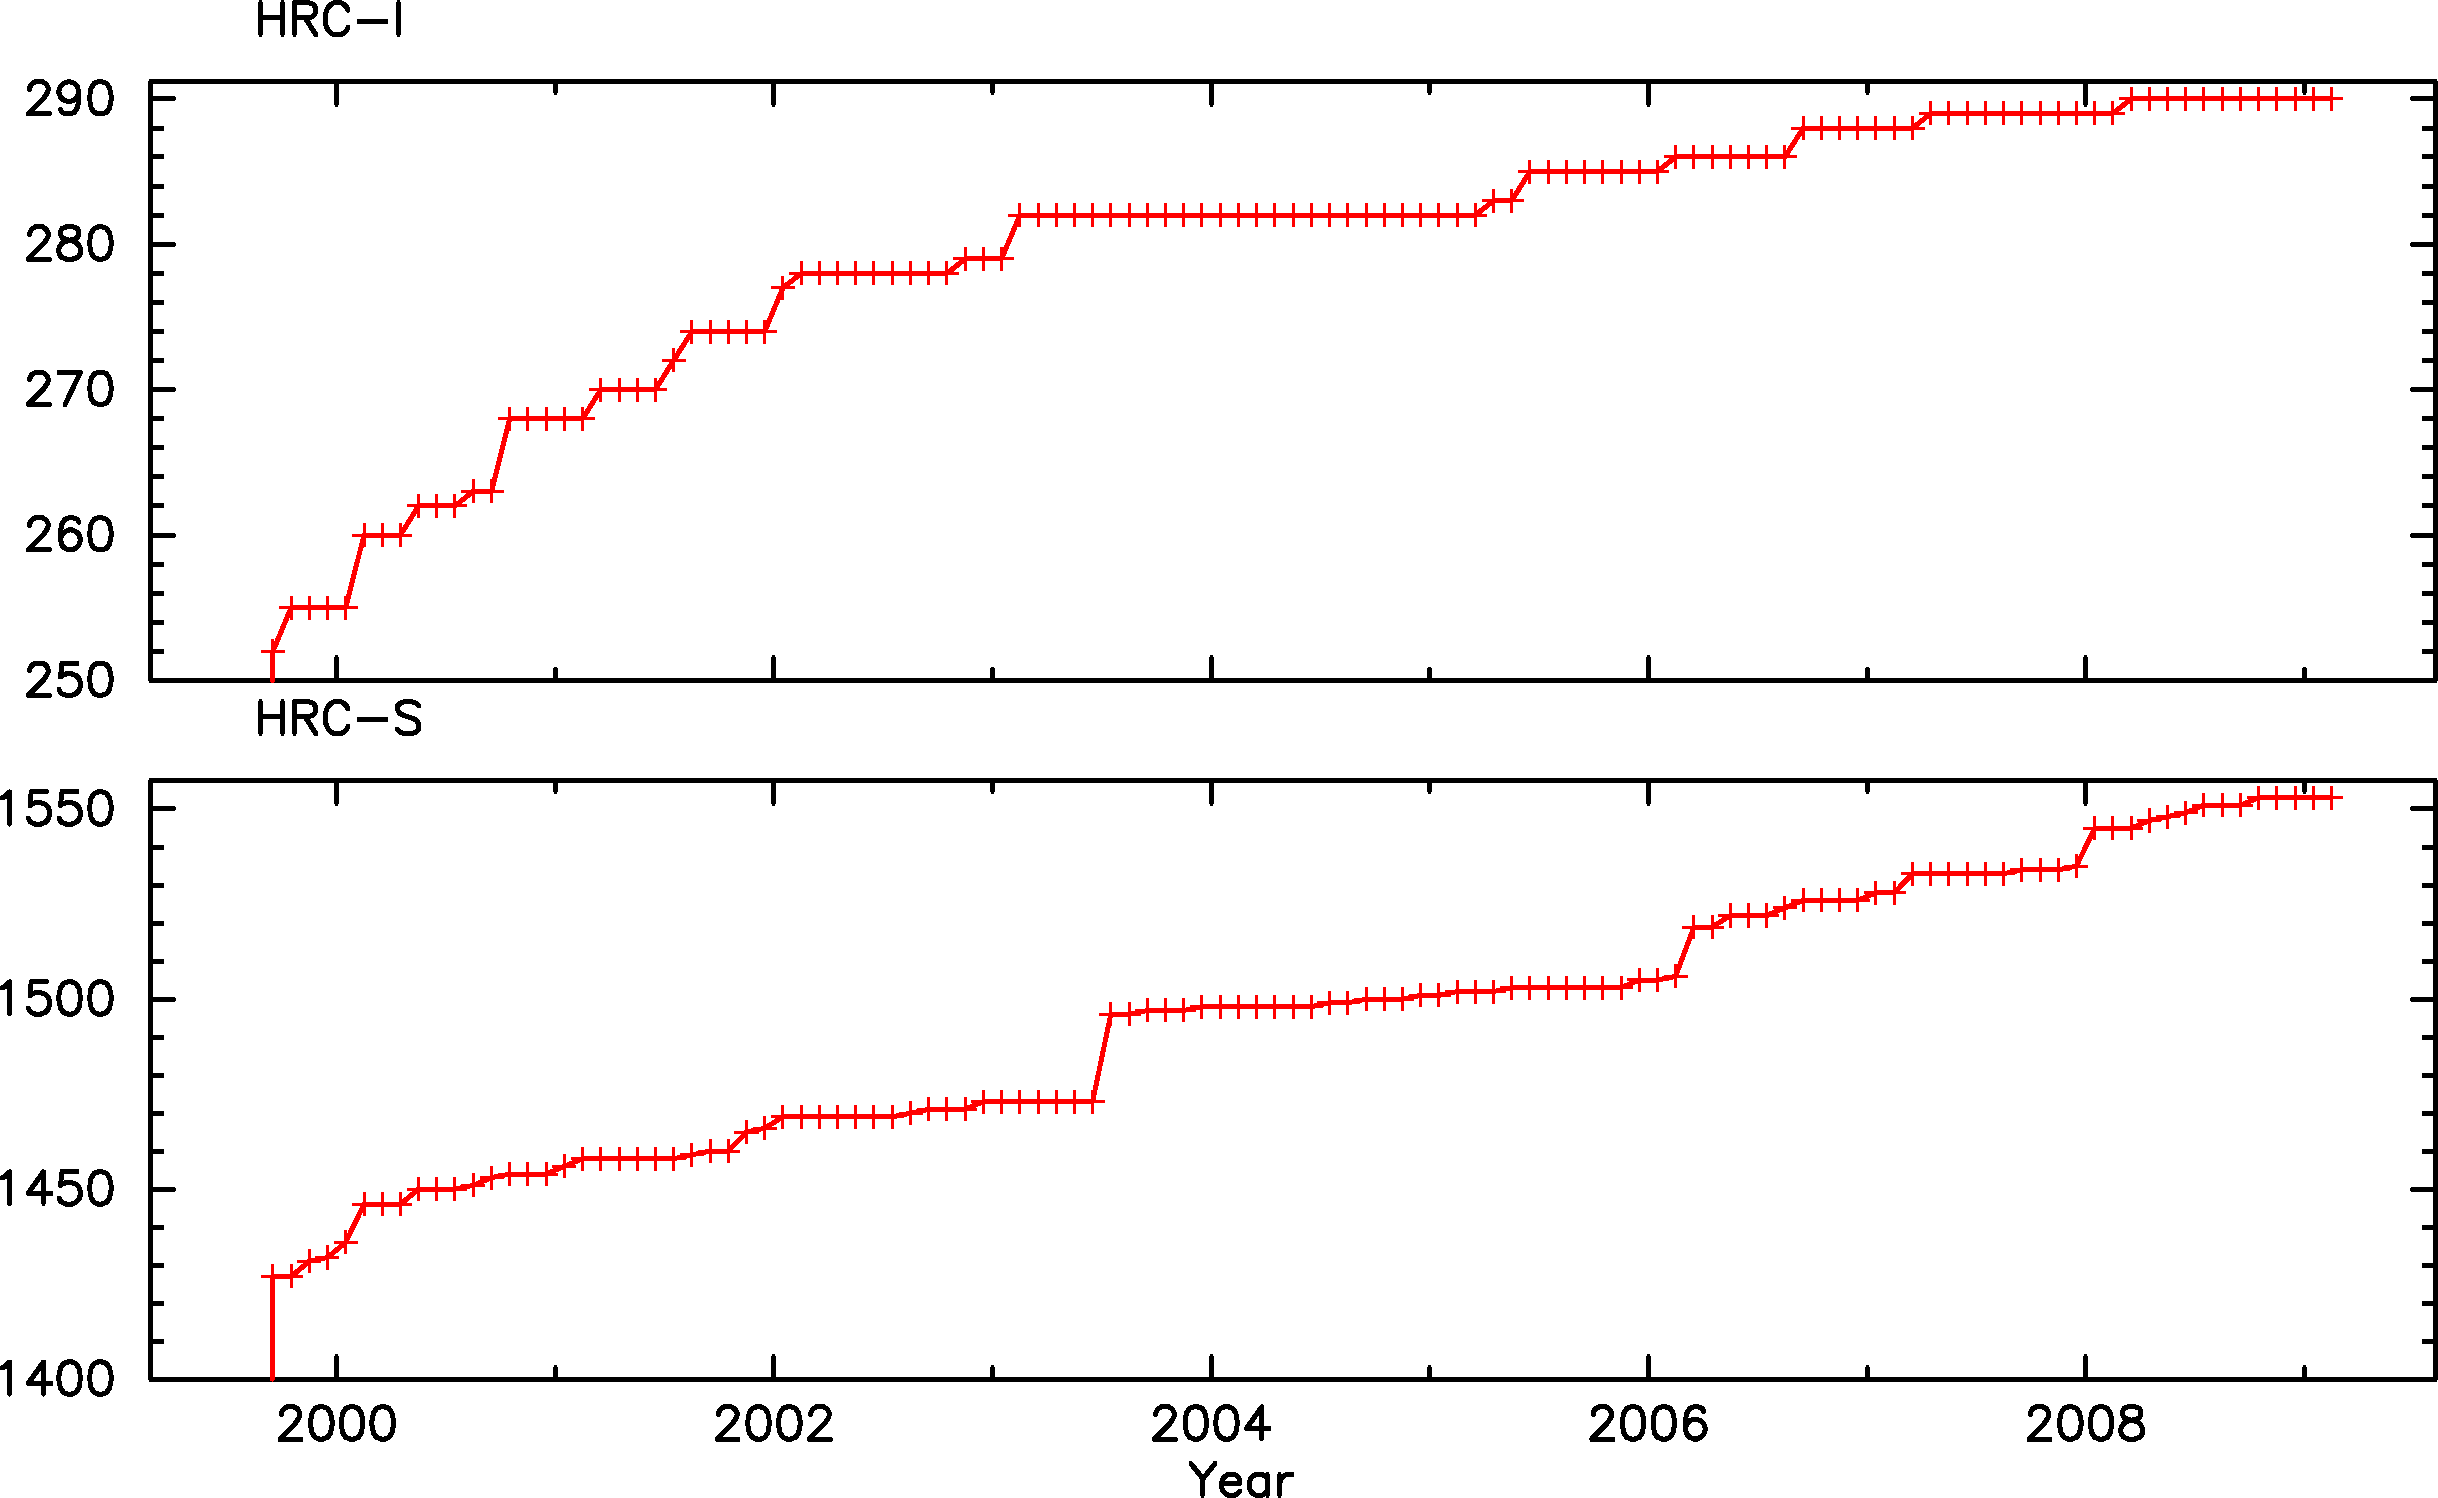
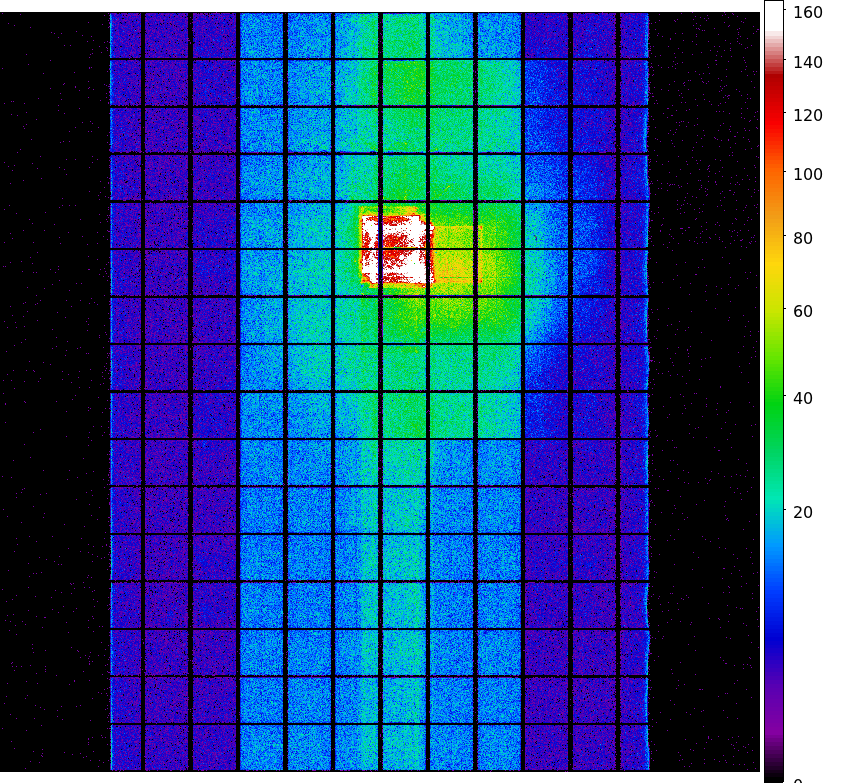
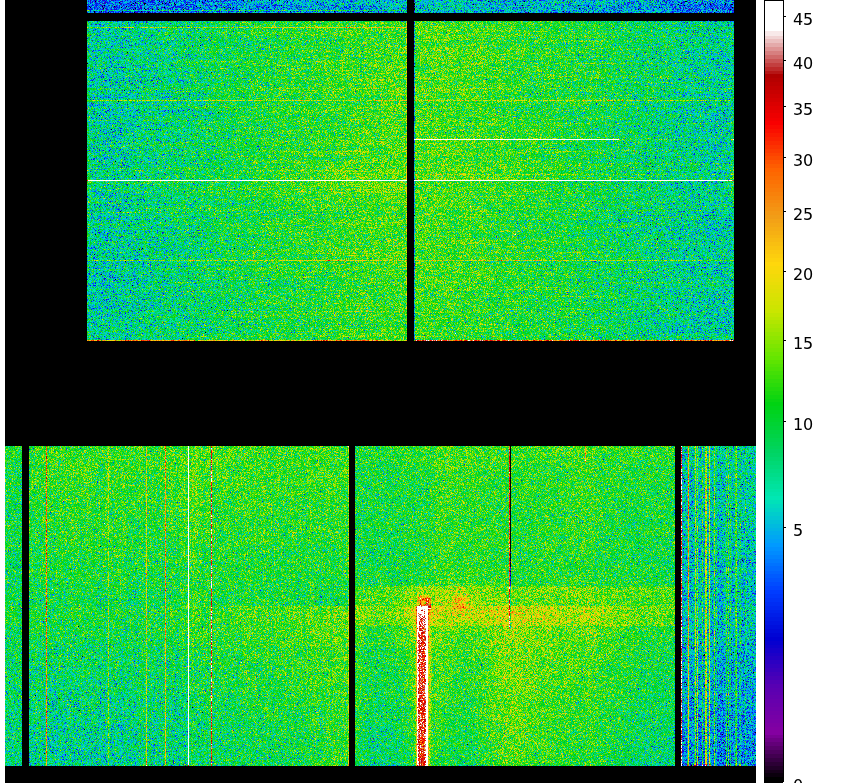
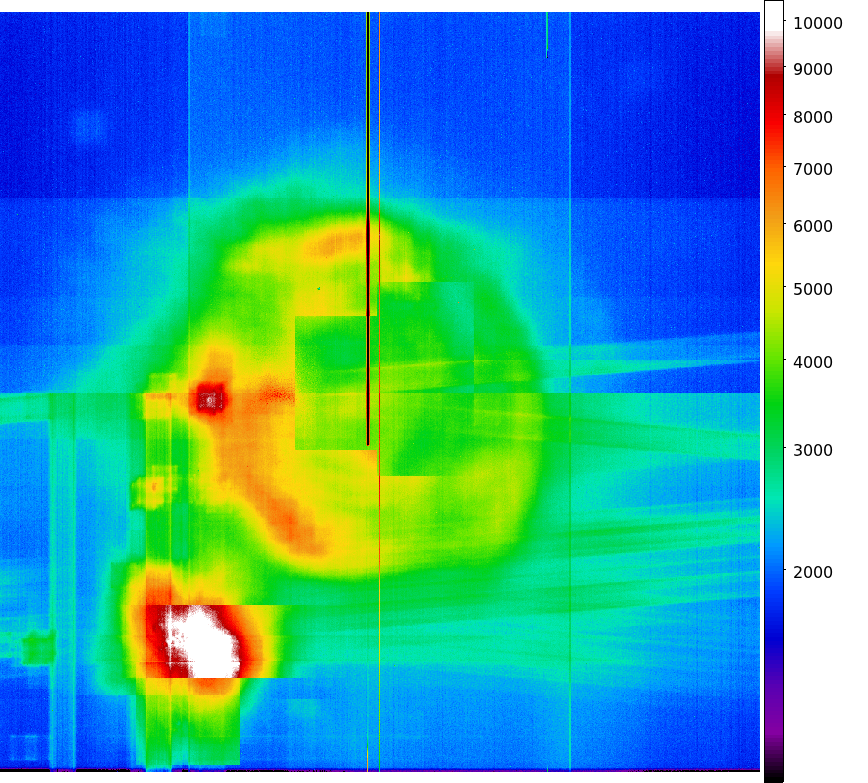
We display a max dose trend plot corrected for events that "pile-up" in the center of the taps due to bad position information.
|

|
|

|
| Nov 2008 | Aug 2008 | May 2008 | Feb 2008 |
|---|
|

|
|
|
| Nov 2008 | Aug 2008 | May 2008 | Feb 2008 |
|---|

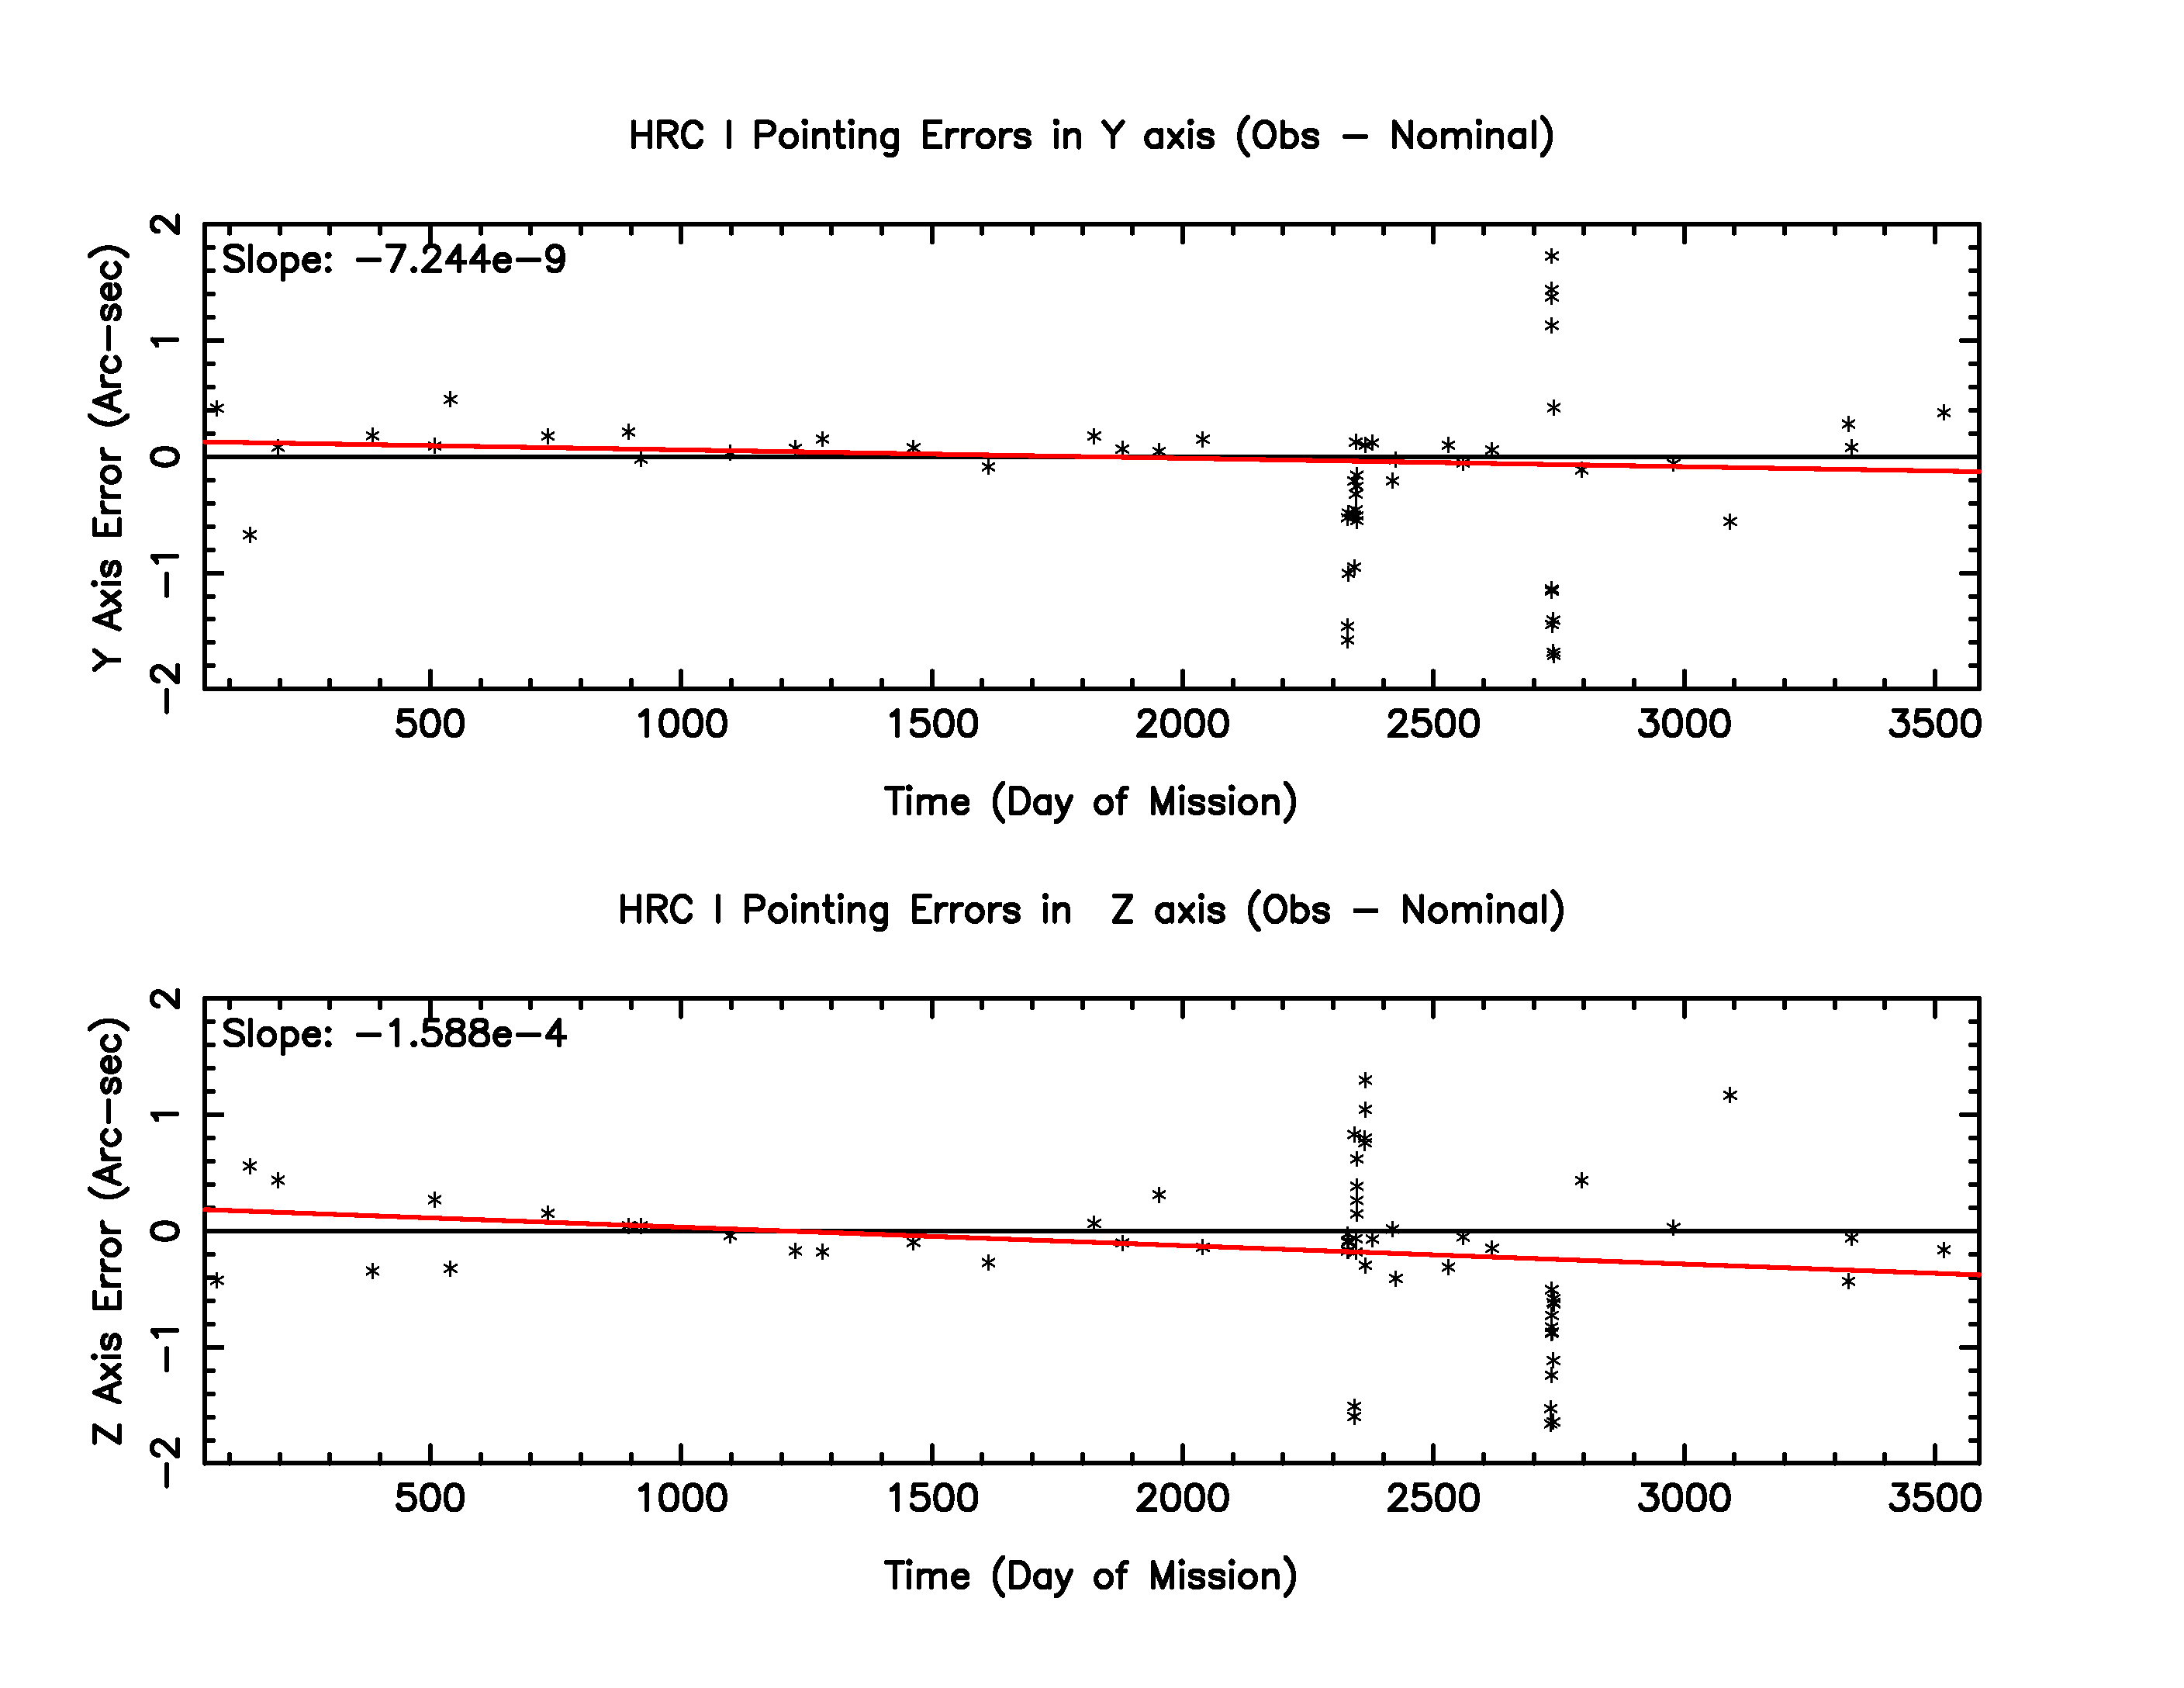
Gyro Bias Drift
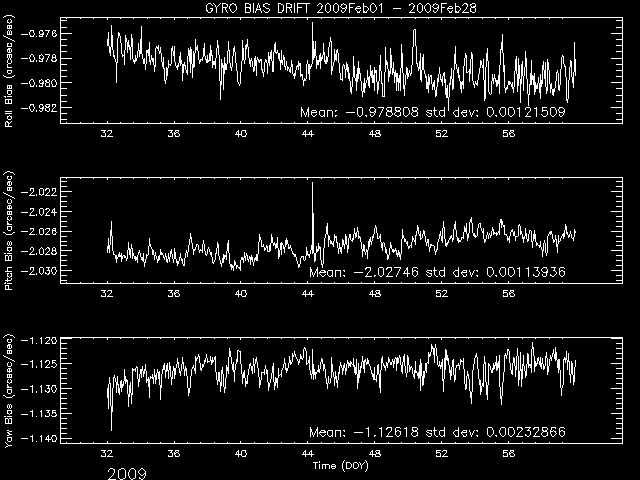
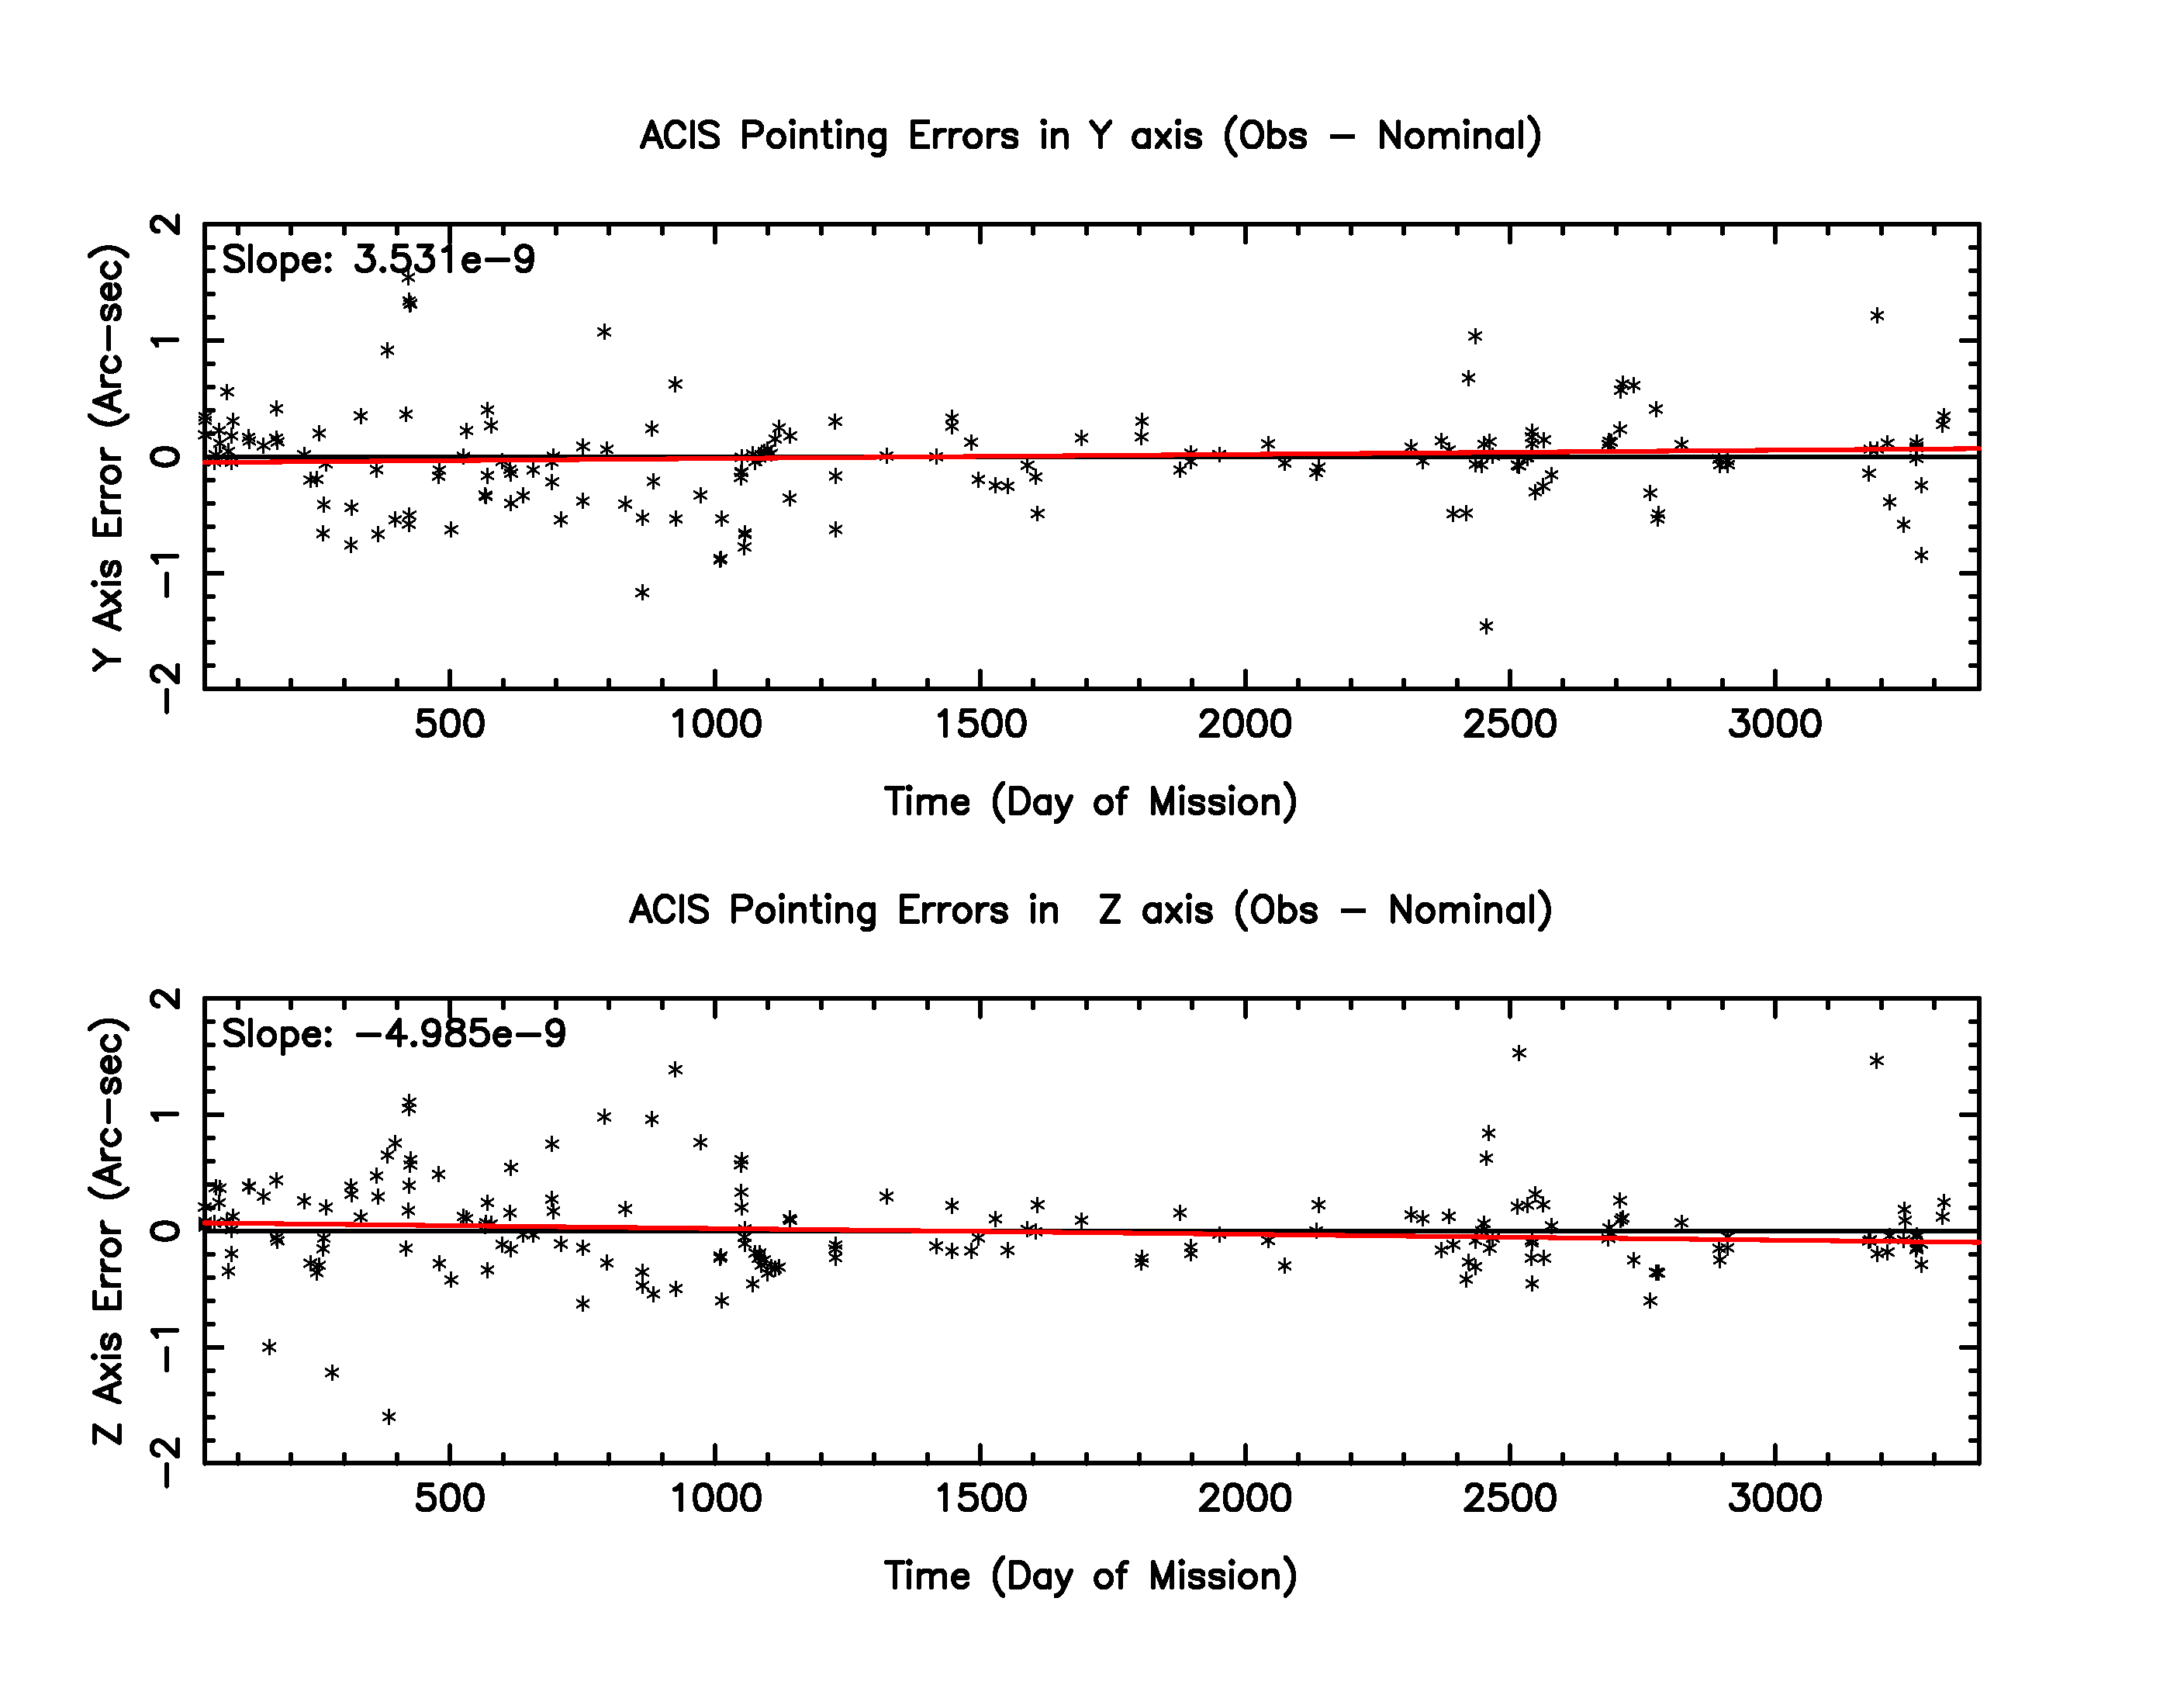
The large dispersion around DOM ~ 2400 (Jan 2005) are all due to none grating Capella observations. Many observations are off-axis observations (e.g., obsid 6558).

| ACIS Temperatures - Daily Maximums | ||||||
|---|---|---|---|---|---|---|
| MSID | MEAN | RMS | DELTA/YR | DELTA/YR/YR | UNITS | DESCRIPTION |
| 1PDEAAT | 307.69 | 7.68 | -9.327e-01 | 6.284e-02 | K | PSMC DEA PS A TEMP |
| 1PIN1AT | 293.59 | 6.79 | -6.827e-01 | 4.078e-02 | K | PSMC TEMP 1A |
| HRMA Computed Averages - Daily Maximums | ||||||
| OBAAVG | 284.45 | 0.71 | 2.561e-01 | 7.503e-03 | K | OBA/TFTE TEMP |
| EPHIN Temperatures - Daily Maximums | ||||||
| TEIO | 311.44 | 16.70 | 1.910e+00 | 1.374e+00 | K | EPHIN ELECTRONICS HOUSING TEMP |
| TEPHIN | 308.07 | 7.38 | 3.011e+00 | -1.760e-01 | K | EPHIN SENSOR HOUSING TEMP |
| SIM Temperatures - Daily Maximums | ||||||
| 3TRMTRAT | 8.53 | 17.60 | 1.249e+00 | 3.915e-02 | TEMP | SEA A TRANSLATION DRIVE MOTOR |
| S/C Main Temperatures - Daily Maximums | ||||||
| TCYLFMZM | 296.09 | 22.59 | 5.151e-01 | -2.800e+00 | K | CNT CYL TEMP:-Z SIDE UNDER LAE-1 |
| TCYLFMZP | 298.82 | 21.55 | 4.699e-01 | -2.601e+00 | K | CNT CYL TEMP:-Z SIDE UNDER LAE-2 |
| S/C Ancillary Temperatures - Daily Maximums | ||||||
| TFSSBKT1 | 325.86 | 19.19 | 1.465e+00 | -2.490e+00 | K | FSS BRACKET-1 TEMP (+Y) |
| TFSSBKT2 | 322.05 | 23.11 | 8.127e-01 | -2.828e+00 | K | FSS BRACKET-2 TEMP (+Y) |
| TSCTSF1 | 288.92 | 3.53 | 9.108e-01 | -1.264e-01 | K | SC-TS FITTING -1 TEMP |
| TSCTSF6 | 288.47 | 3.90 | 1.011e+00 | -1.524e-01 | K | SC-TS FITTING -6 TEMP |
| MUPS - Daily Maximums | ||||||
| PM1THV1T | 329.28 | 10.19 | 2.379e+00 | -2.937e+00 | K | MUPS 1 THRUSTER VALVE 01 TEMP |
| PLINE02T | 307.53 | 10.03 | 1.713e+00 | 2.434e-01 | K | PROP LINE TEMP 02 |
| PLINE03T | 309.26 | 10.25 | 1.125e+00 | 7.051e-01 | K | PROP LINE TEMP 03 |
| PLINE04T | 297.51 | 9.44 | -1.419e-01 | 5.304e-01 | K | PROP LINE TEMP 04 |
| Previous Quarter | ||||||
| MSID | MEAN | RMS | DELTA/YR | DELTA/YR/YR | UNITS | DESCRIPTION |
| PM1THV1T | 329.54 | 6.95 | 7.864e+00 | -2.183e+02 | K | MUPS 1 THRUSTER VALVE 01 TEMP |
| PM1THV2T | 331.29 | 5.65 | 6.489e+00 | -2.232e+02 | K | MUPS 1 THRUSTER VALVE 02 TEMP |
| PM2THV1T | 327.30 | 9.63 | 5.454e+00 | -3.054e+02 | K | MUPS 2 THRUSTER VALVE 01 TEMP |
| PM2THV2T | 328.28 | 8.38 | 5.232e+00 | -2.372e+02 | K | MUPS 2 THRUSTER VALVE 02 TEMP |
| Previous Quarter | ||||||
| MSID | MEAN | RMS | DELTA/YR | DELTA/YR/YR | UNITS | DESCRIPTION |
| TCYLAFT1 | 295.03 | 3.55 | -1.440e+01 | 4.383e+02 | K | CNT CYL TEMP:16-IN FWD OF SC-TS FIT-1 |
| TCYLAFT2 | 276.63 | 1.96 | -7.228e+00 | 1.773e+02 | K | CNT CYL TEMP:16-IN FWD OF SC-TS FIT-2 |
| TCYLAFT3 | 264.01 | 1.61 | -3.785e+00 | 7.313e+01 | K | CNT CYL TEMP:16-IN FWD OF SC-TS FIT-3 |
| TCYLAFT4 | 267.52 | 2.04 | -6.176e+00 | 1.324e+02 | K | CNT CYL TEMP:16-IN FWD OF SC-TS FIT-4 |
| TCYLAFT5 | 280.16 | 3.23 | -1.369e+01 | 3.221e+02 | K | CNT CYL TEMP:16-IN FWD OF SC-TS FIT-5 |
| TCYLAFT6 | 294.75 | 3.90 | -1.615e+01 | 4.562e+02 | K | CNT CYL TEMP:16-IN FWD OF SC-TS FIT-6 |
| Previous Quarter | ||||||
| MSID | MEAN | RMS | DELTA/YR | DELTA/YR/YR | UNITS | DESCRIPTION |
| TFSSBKT1 | 325.92 | 19.20 | -2.488e+01 | 1.179e+03 | K | FSS BRACKET-1 TEMP (+Y) |
| TFSSBKT2 | 319.55 | 25.68 | -3.159e+01 | 1.576e+03 | K | FSS BRACKET-2 TEMP (+Y) |
| TRSPMTPC | 289.29 | 5.02 | -1.997e+01 | 5.385e+02 | K | RAD SHR PNL TEMP:TTWN MUPS AND PCAD |
| TSCTSF1 | 292.59 | 2.40 | -8.601e+00 | 2.424e+02 | K | SC-TS FITTING -1 TEMP |
| Previous Quarter | ||||||
| MSID | MEAN | RMS | DELTA/YR | DELTA/YR/YR | UNITS | DESCRIPTION |
| 4RT585T | 289.86 | 0.22 | -7.127e-01 | 2.287e+01 | K | RT 585 - STRUT TEMP |
| 4RT590T | 289.43 | 0.96 | -2.897e+00 | 9.426e+01 | K | RT 590 - STRUT TEMP |
| 
|
| Year | Month | ||||||||||||
|---|---|---|---|---|---|---|---|---|---|---|---|---|---|
| 1999 | Jul | Aug | Sep | Oct | Nov | Dec | |||||||
| 2000 | Jan | Feb | Mar | Apr | May | Jun | Jul | Aug | Sep | Oct | Nov | Dec | |
| 2001 | Jan | Feb | Mar | Apr | May | Jun | Jul | Aug | Sep | Oct | Nov | Dec | |
| 2002 | Jan | Feb | Mar | Apr | May | Jun | Jul | Aug | Sep | Oct | Nov | Dec | |
| 2003 | Jan | Feb | Mar | Apr | May | Jun | Jul | Aug | Sep | Oct | Nov | Dec | |
| 2004 | Jan | Feb | Mar | Apr | May | Jun | Jul | Aug | Sep | Oct | Nov | Dec | |
| 2005 | Jan | Feb | Mar | Apr | May | Jun | Jul | Aug | Sep | Oct | Nov | Dec | |
| 2006 | Jan | Feb | Mar | Apr | May | Jun | Jul | Aug | Sep | Oct | Nov | Dec | |
| 2007 | Jan | Feb | Mar | Apr | May | Jun | Jul | Aug | Sep | Oct | Nov | Dec | |
| 2008 | Jan | Feb | Mar | Apr | May | Jun | Jul | Aug | Sep | Oct | Nov | Dec | |
| 2009 | Jan | ||||||||||||
)
)
)
)
)
)
)
)
)
)
)
)
)
)
)
)
)
)
)
)
)
)
)
)
)
)
)
)
)
)
)
)