- M&TA MONTHLY REPORT -
June 2009
OUTLINE
- Configuration
- ACIS
- Dose
- CTI
- Focal Plane Temperature
- Bad Pixels
- Background
- HRC - Dose
- Gratings - Focus
- SIM
- PCAD
- ACA Trending
- Fid light drift
- Gyro bias drift
- Radiation Zone Timing
- Trending
- Critical Trends
- Quarterly Trends
- Spacecraft Motions
TOP
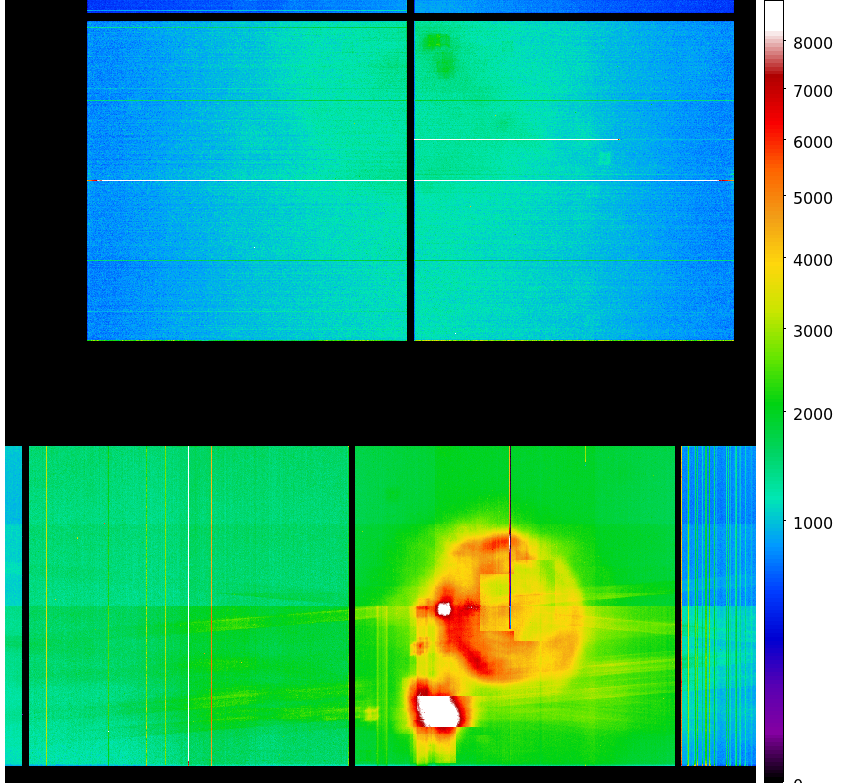
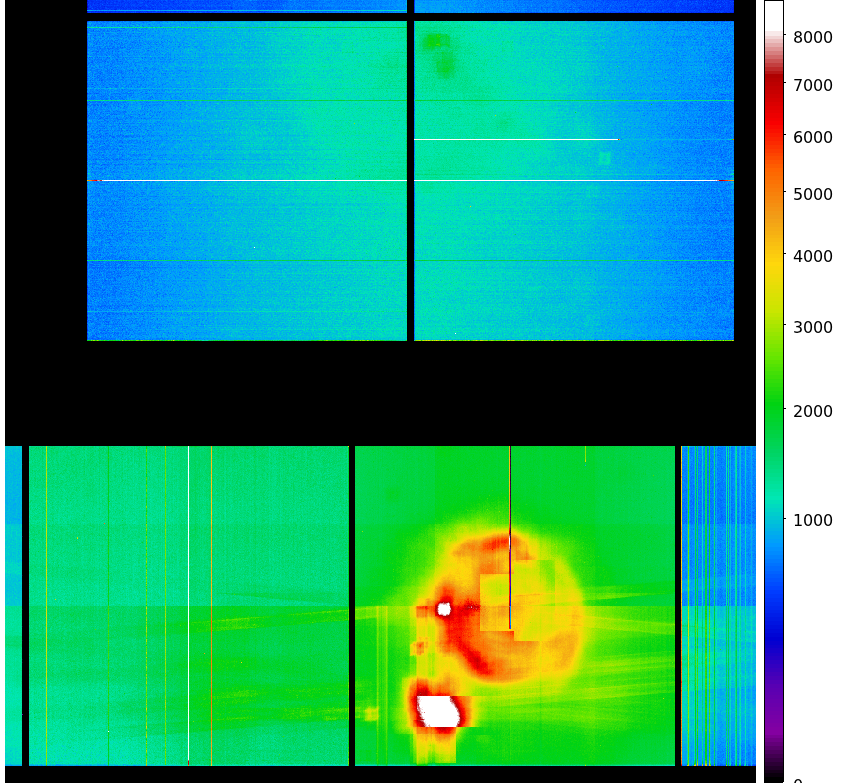
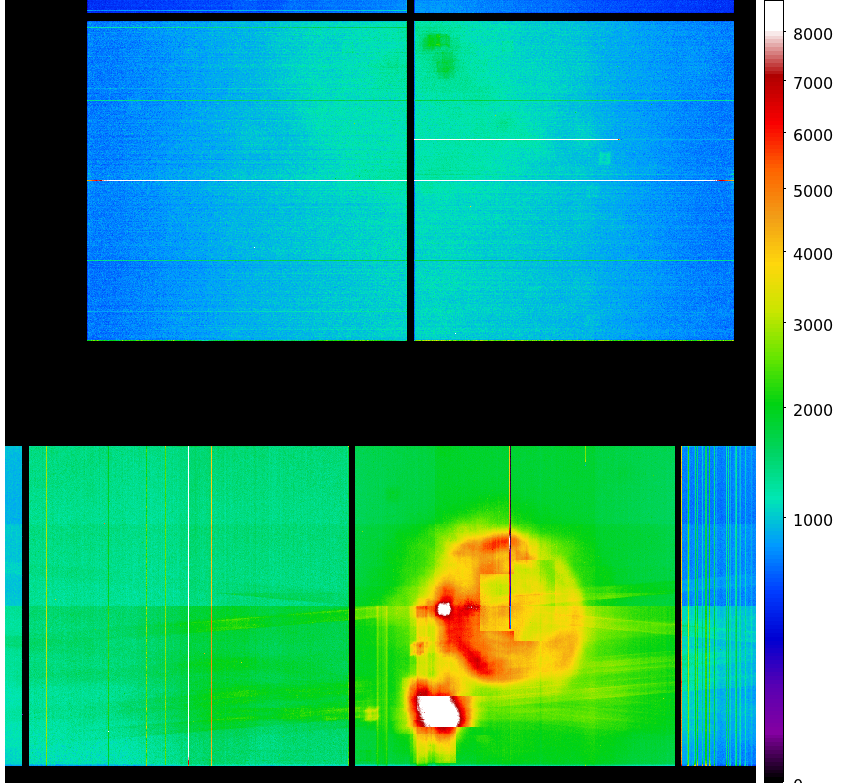
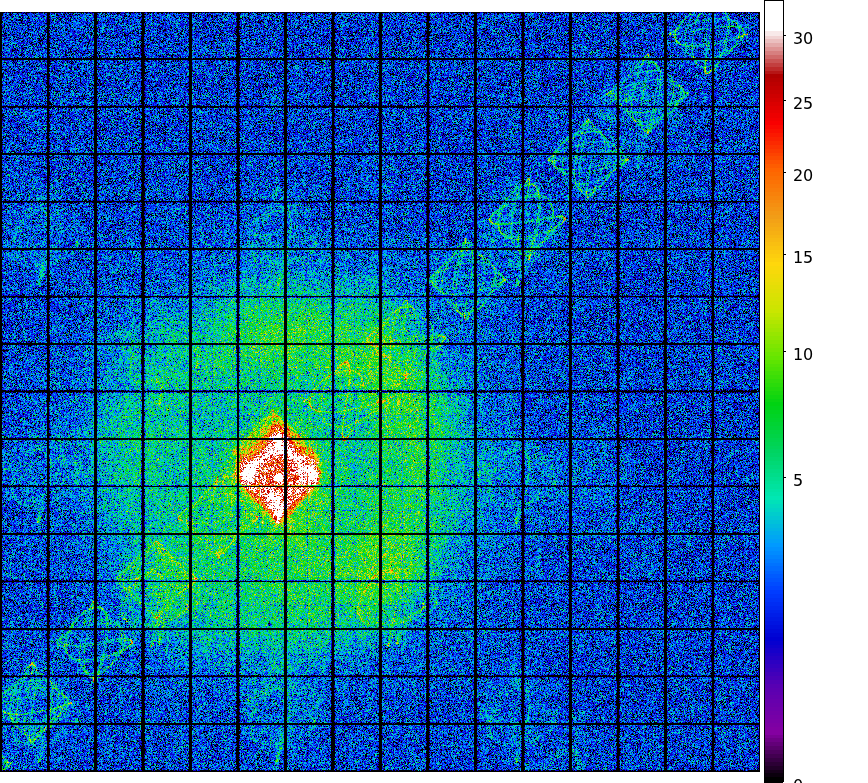
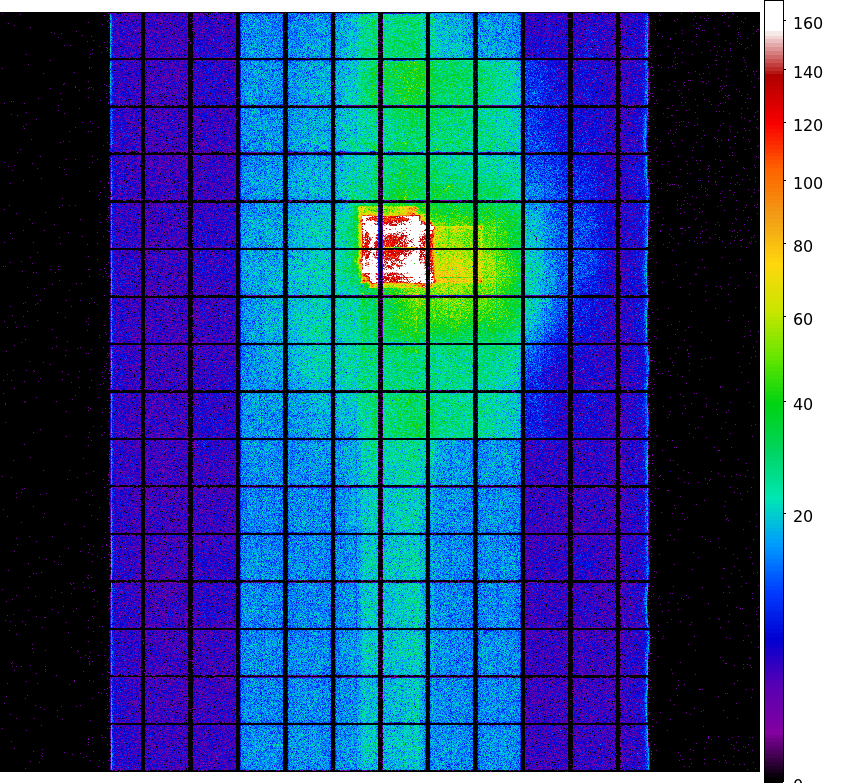
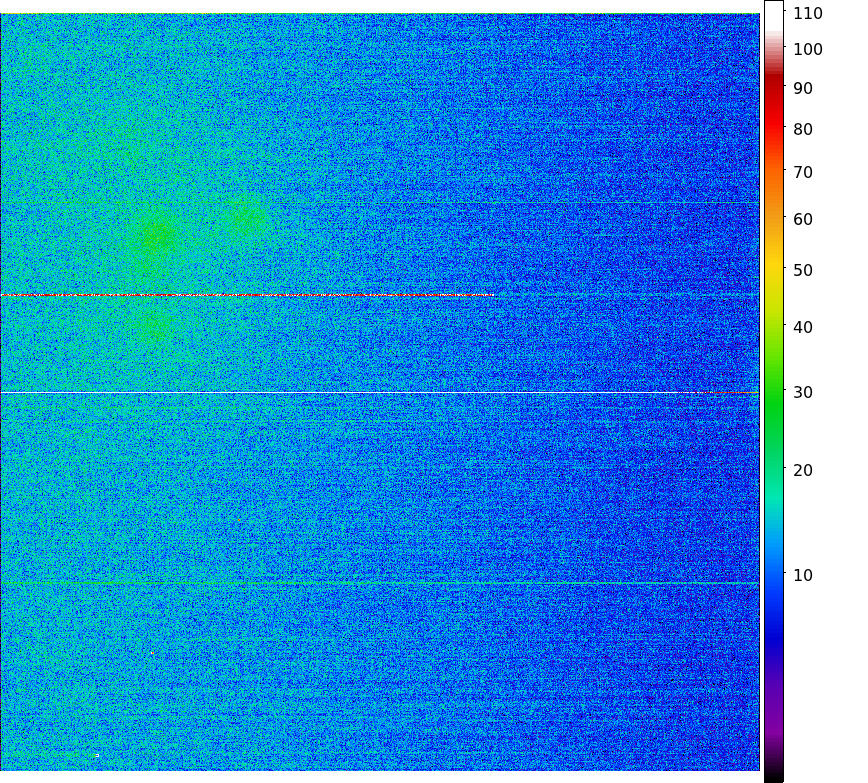
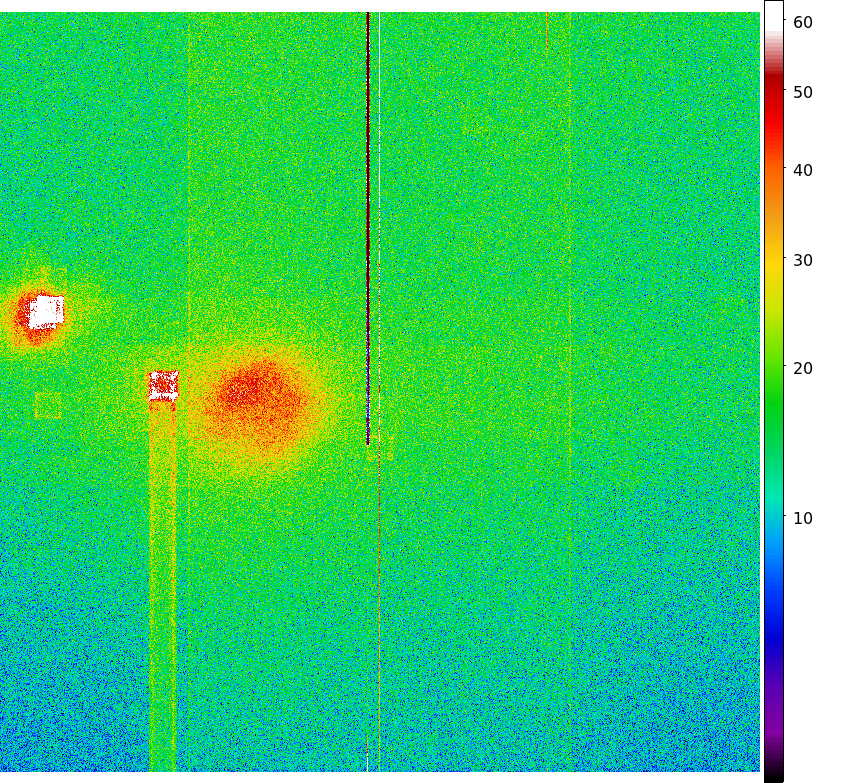
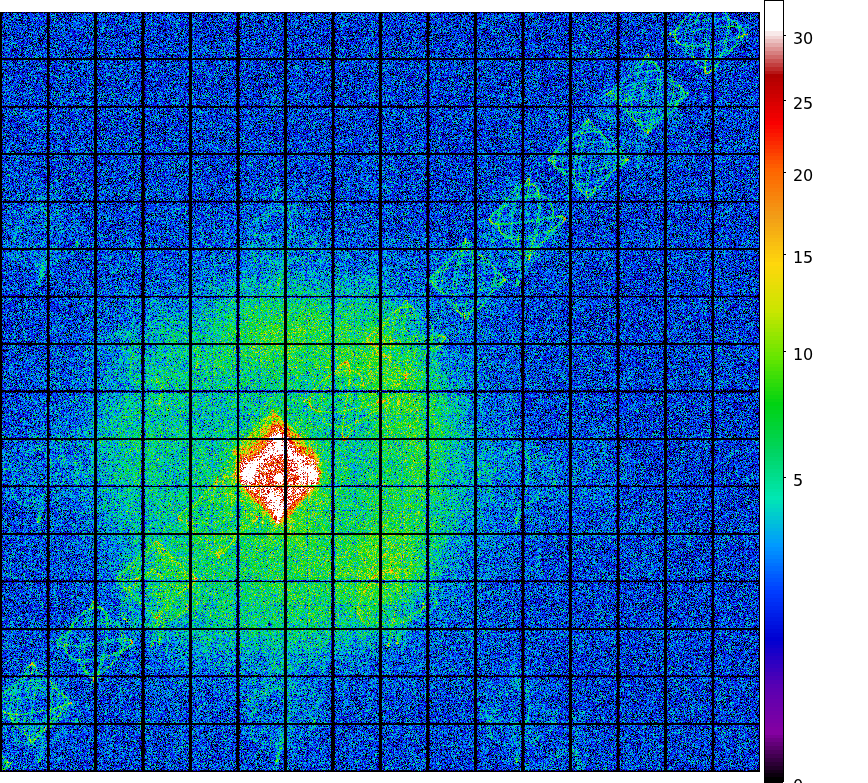
- ACIS DOSE registered-photon-map
The steps we took to compute the dose map are;
- Level 1 Event files for a specified month are obtained from archive.
- Image data including I2, I3, S2, S3 CCDs are extracted from all event files.
- All the extracted image data were merged to create a month long exposure map for the month.
- The exposure map is opened with ds9, and check a distribution of count rates against energy.
From this, estimate the upper threshold value. Any events beyond this upper threshold are
assumed erroneous events such as bad pixels.
- Using this upper threshold, the data is filtered, and create a cleaned exposure map for the month.
- The exposure map from each month from the Sep 1999 is added up to create a cumulative exposure
map for each month.
- Using fimgstatistic, we compute count rate statistics for each CCDs.
- For observations with high data drop rates (e.g., Crab nebula, Cas A), we corrected the
observations by adding events.
Note: Counts and RMS's of Cumulative maps are lower than the previous months. This is because we excluded
extreme outliers.
Please check more detail plots at
Telemetered Photon Dose Trend page.
- JUNE registered-photon-map in fits
Statistics:
# IMAGE     NPIX        MEAN           RMS              MIN     MAX
ACIS_jun09 6004901      10.540         16.457           0.0     1026.0

 I2 node 0  262654      10.062168       3.951100        0.0      77.0
 I2 node 1  262654      10.613901       4.443614        0.0     237.0
 I2 node 2  262654      10.448563       4.023197        0.0      72.0
 I2 node 3  262654      10.326621       4.306952        0.0      60.0

 I3 node 0  262654      12.111898       4.671745        0.0      58.0
 I3 node 1  262654      13.389786       12.924336       0.0     287.0
 I3 node 2  262654      11.562442       4.269114        0.0      81.0
 I3 node 3  262654      11.402336       4.285255        0.0     211.0

 I2 node 0  262654      15.599012       6.313366        0.0     1001.0
 I2 node 1  262654      16.314644       6.636445        0.0     134.0
 I2 node 2  262654      16.768237       6.150170        0.0     173.0
 I2 node 3  262654      16.346422       5.511583        0.0     694.0

 I3 node 0  262654      16.041839       8.600331        0.0     180.0
 I3 node 1  262654      17.740764       7.622563        0.0      90.0
 I3 node 2  262654      15.048491       4.533052        0.0     618.0
 I3 node 3  262654      13.323350       4.055749        0.0     129.0
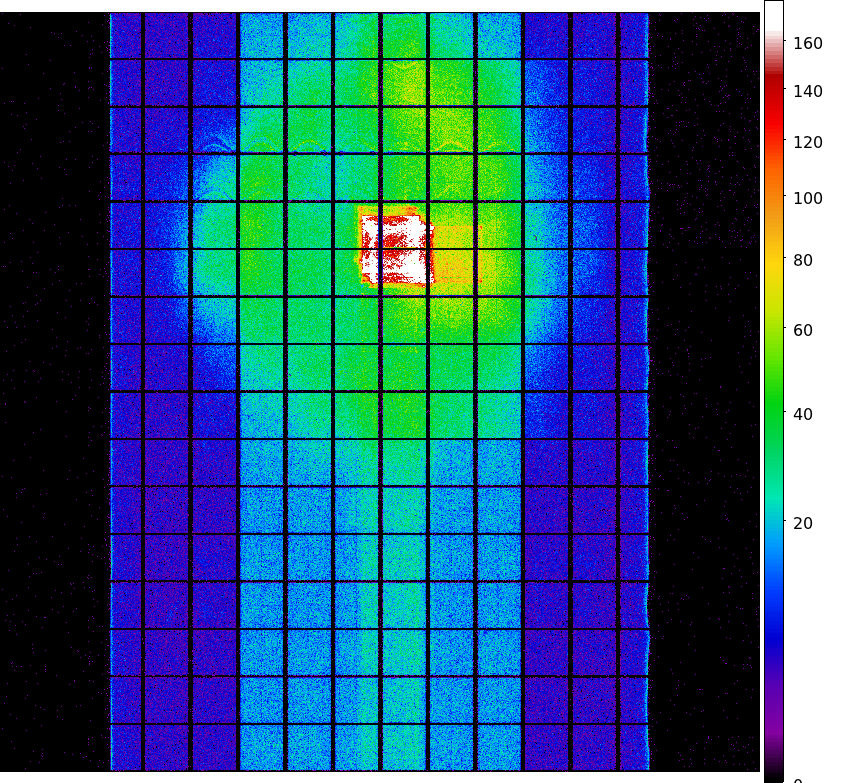
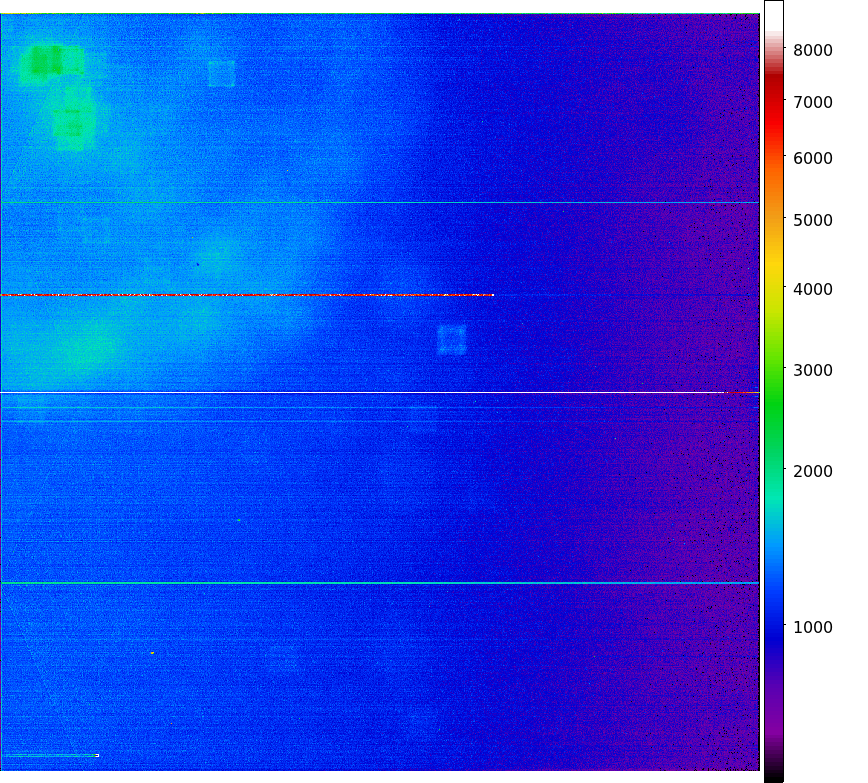
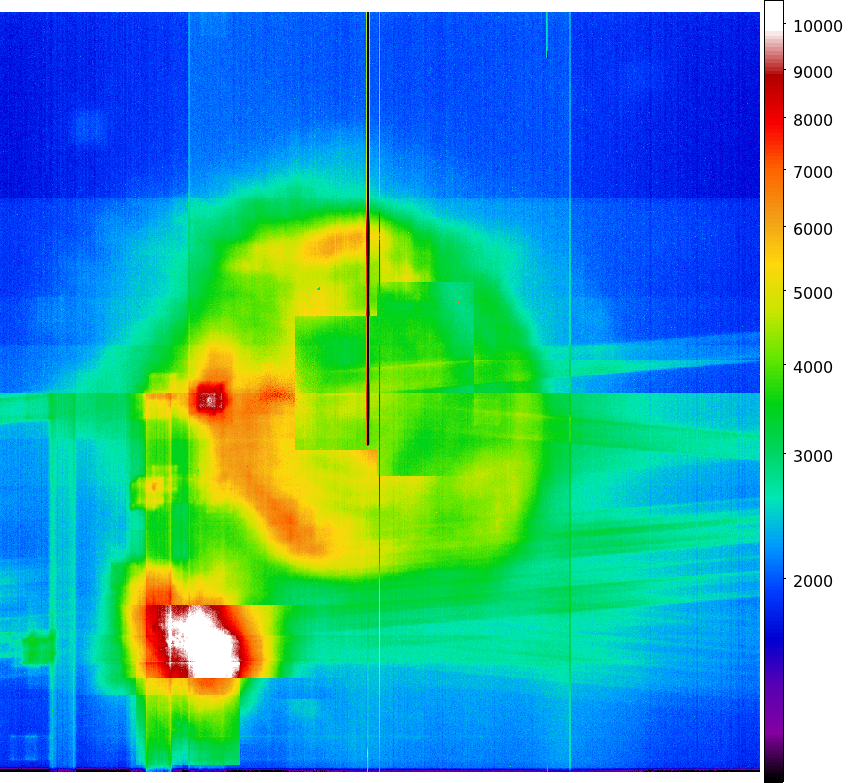
- Jul 1999 - Jun 2009
registered-photon-map in fits
Statistics:
 IMAGE        NPIX      MEAN          RMS              MIN    MAX
ACIS_total  6004901    1276.61          1732.36         0.0    77609.0

 I2 node 0  262654      993.504852      180.645607      0.0     4596.0
 I2 node 1  262654      1053.273093     248.404580      0.0     17543.0
 I2 node 2  262654      1091.828026     235.641739      0.0     8531.0
 I2 node 3  262654      1090.591975     279.027708      0.0     27366.0

 I3 node 0  262654      1154.332702     287.094085      0.0     5812.0
 I3 node 1  262654      1211.479446     867.626036      0.0     22613.0
 I3 node 2  262654      1041.921515     182.175823      0.0     4578.0
 I3 node 3  262654      1027.095241     192.495069      0.0     18996.0

 I2 node 0  262654      1527.051015     201.687670      757.0   19863.0
 I2 node 1  262654      1622.618390     336.585351      780.0   8530.0
 I2 node 2  262654      1803.766410     338.475829      1029.0  12106.0
 I2 node 3  262654      1739.821319     249.019749      995.0   24133.0

 I3 node 0  262654      2648.375567     1312.774714     1083.0  11073.0
 I3 node 1  262654      3865.236597     1801.529529     0.0     11964.0
 I3 node 2  262654      2864.059593     825.674782      982.0   6521.0
 I3 node 3  262654      2170.845339     354.463738      1145.0  8418.0
- JUNE 2009 dose PNG image
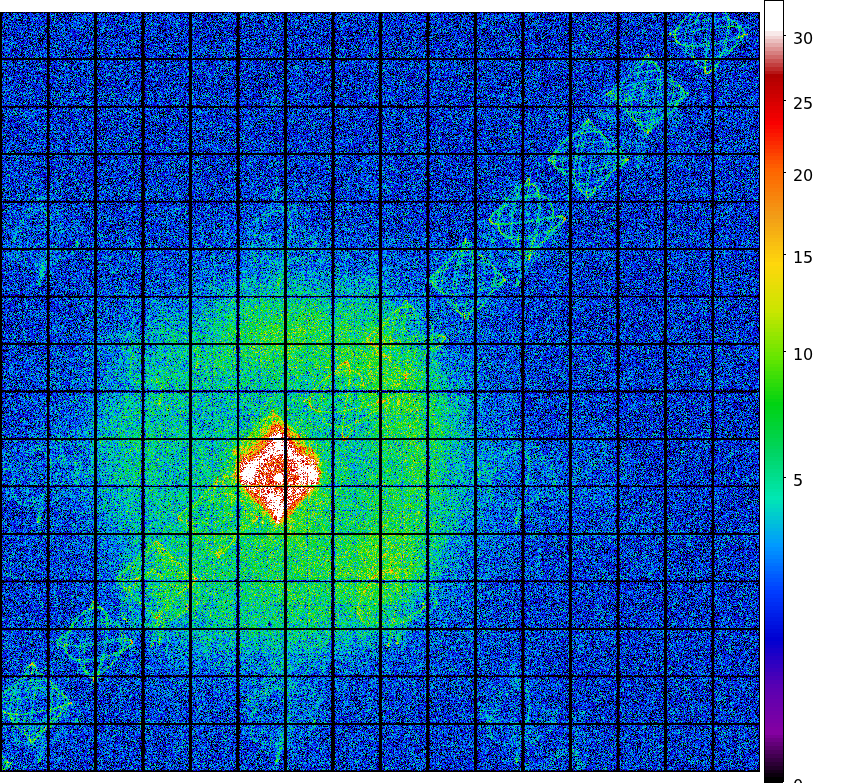
- JUNE I3 dose PNG image
- JUNE S3 dose PNG image
- TOTAL JUL 1999 - JUNE 2009 dose PNG image
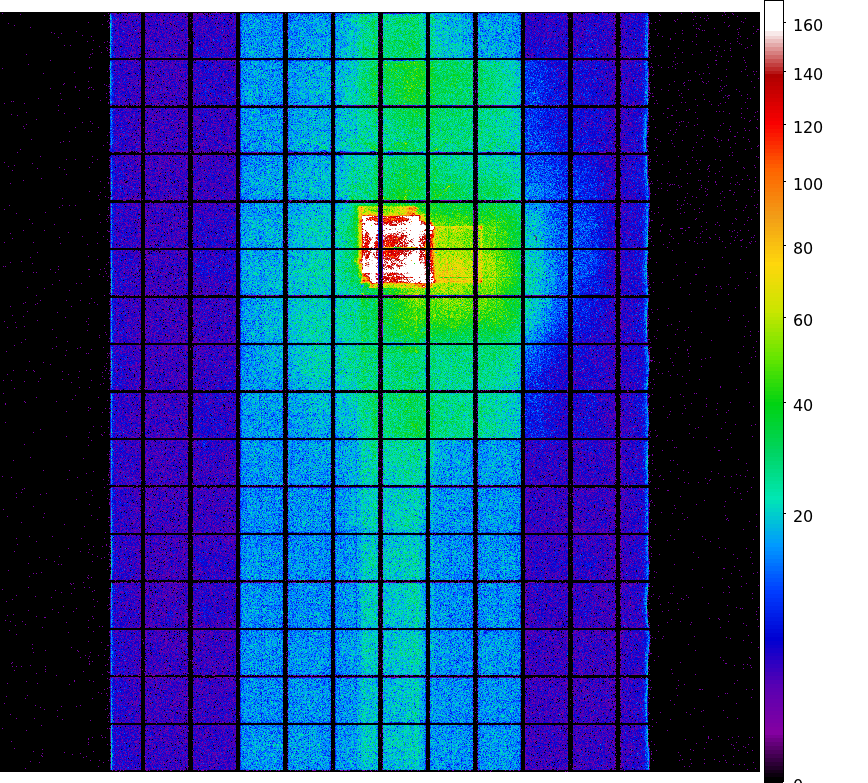
- TOTAL I3 dose PNG image
- TOTAL S3 dose PNG image
- Integrated Exposure Maps of Last 12 Months
|

|
|
|
| Mar 2009 |
Dec 2008 |
Sep 2008 |
Jun 2008 |
- The Mean Detrended CTI
We report CTIs with a refined data definition. CTIs were computed for the temperature
dependency corrected data.
Please see
CTI page
for detailed explanation.
CTI's are computed for Mn K alpha, and defined as slope/intercept x10^4 of row # vs ADU.
Data file here
- Focal Plane Temperature
       The Mean (max) FPT: -116.17 C    std dev: 2.44
               mean width:    0.57 days std dev: 0.40
We are using 10 period moving averages to show
trends of peak temperatures and peak widths.
Note, the gaps in the width plot are due to missing/corrupted data.
The following is a plot of focal plane temperature and sun angle, earth angle, and altitude.
- Bad Pixels
The plots below were generated with a new warm pixel finding script. Please see
Acis Bad Pixel Page
for details.
Front Side CCDs
Back Side CCD (CCD5)
-
Acis Count Rate Plot
This monitors the ACIS count Rate vs. EPHIN count Rate.
No sources or CTI observations are removed. For daily updates see:
Ephin/Acis Info
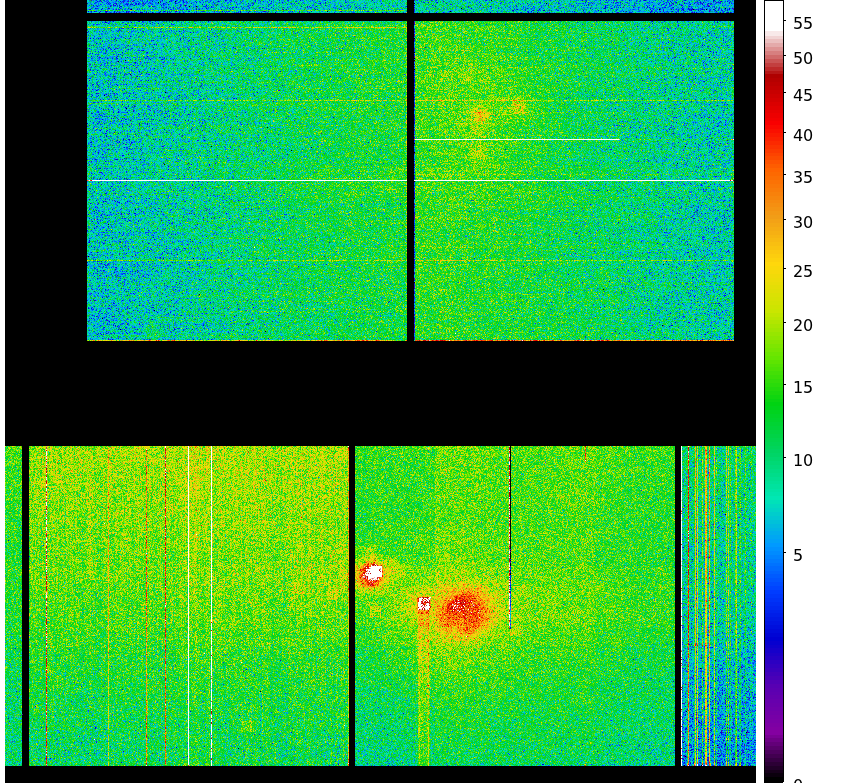
- Science instrument background rates
This page shows scientific instrument background data based on Acis
observations. A source region file is generated using get_srcregions
and then the input event file is filtered using the regions in that file
to remove the sources.
| Name | Low (keV) | High(KeV) | Description |
|---|
| SSoft | 0.00 | 0.50 | Super soft photons |
|---|
| Soft | 0.50 | 1.00 | Soft photons |
|---|
| Med | 1.00 | 3.00 | Moderate energy photons |
|---|
| Hard | 3.00 | 5.00 | Hard Photons |
|---|
| Harder | 5.00 | 10.00 | Very Hard photons |
|---|
| Hardest | 10.00 | | Beyond 10 keV |
|---|
HRC
Gratings
- Focus
We plot the width of the zero order streak of ACIS/HETG observations and
the width of the zero order image for HRC/LETG observations of point sources.
No significant defocusing trend is seen at this time. See
Gratings Focus
pages.
TOP
PCAD
Fid Light Drift
Fid light positions on ACA drift with time. The drift trends of Fid light 2 with
ACIS-I and ACIS-S configurations are shown below.
The top panel shows Fid light 2 drift in ACENT I (app. along with -Y axis), and the
bottom panel shows that in ACENT J (app. along with Z axis). The unit is a pixel, and
one pixel is approximately 0.5 arcsec. The slope listed at the top right corner is
the change in a position per year (arcsec/yr). The vertical line on DOM = 1411 (September 1, 2003)
indicates a transition date of use of IRU-1 to IRU-2.
See also Tom Aldcroft's updated page:
https://cxc.cfa.harvard.edu/mta/ASPECT/fid_drift
Fid 2 (ACIS-I)
Fid 2 (ACIS-S)
Fid 8 (HRC-I)
Fid 12 (HRC-S)
Gyro Bias Drift
TOP
Radiation Zone Timing
Plotted below are radiation zone timing plots based on the following definitions of radiation zone:
RADZONE - Ephin levels (in any of the E1300,P4GM,P41GM channels) are more than 1/3 of RADMON safing thresholds.
RADMON - Radmon is disabled for radiation zone (as commanded based on OFLS model, for comparison with actual radiation levels).
PERIGEE - Time of closest earth approach (for comparison).
Jun 2009 Timing Plots
Entire Mission Timing Plots
TOP
Critical Trends
Quarterly Trends
| ACIS Electronics A |
|---|
| MSID | MEAN | RMS | DELTA/YR | DELTA/YR/YR | UNITS | DESCRIPTION |
| 1DPP0AVO |
5.27 |
2.631e-02 |
1.003e-02 |
-5.654e-02 |
V |
DPA +5V ANALOG A |
ACIS Electronics A Envelope Trends
| ACIS Electronics B |
|---|
| MSID | MEAN | RMS | DELTA/YR | DELTA/YR/YR | UNITS | DESCRIPTION |
| 1DPP0BVO |
5.25 |
3.535e-02 |
9.056e-02 |
-1.510e+00 |
V |
DPA +5V ANALOG B |
| ACIS Temperature |
|---|
| MSID | MEAN | RMS | DELTA/YR | DELTA/YR/YR | UNITS | DESCRIPTION |
| 1DEAMZT |
284.42 |
4.09 |
8.137e+00 |
-3.112e+02 |
K |
DEA -Z PANEL TEMP |
| 1DPAMYT |
285.81 |
4.82 |
7.375e+00 |
-2.810e+02 |
K |
DPA -Y PANEL TEMP |
| 1DPAMZT |
288.98 |
4.53 |
7.990e+00 |
-2.954e+02 |
K |
DPA -Z PANEL TEMP |
| 1PIN1AT |
292.38 |
7.55 |
-1.744e+01 |
8.673e+02 |
K |
PSMC TEMP 1A |
ACIS Temperature Envelope Trends
| Ephin Temperature/Voltage |
|---|
| MSID | MEAN | RMS | DELTA/YR | DELTA/YR/YR | UNITS | DESCRIPTION |
| 5EIOT |
342.56 |
17.06 |
-3.553e+01 |
1.265e+03 |
K |
EIO TEMP |
| 5EPHINT |
313.85 |
4.33 |
-1.391e+01 |
4.337e+02 |
K |
EPHIN TEMP |
| HKEBOXTEMP |
318.55 |
4.54 |
-1.540e+01 |
4.792e+02 |
K |
EPHIN HOUSEKEEPING EBOX: TEMPERATURE (5EHSE300) |
| TEIO |
315.63 |
19.49 |
-4.153e+01 |
1.443e+03 |
K |
EPHIN ELECTRONICS HOUSING TEMP |
| TEPHIN |
314.10 |
4.71 |
-1.601e+01 |
4.889e+02 |
K |
EPHIN SENSOR HOUSING TEMP |
Ephin Temperature Envelope Trends
| EPS Battery |
|---|
| MSID | MEAN | RMS | DELTA/YR | DELTA/YR/YR | UNITS | DESCRIPTION |
| EOEB1CIC |
6.960e-03 |
1.935e-02 |
-3.210e-03 |
-9.650e-02 |
EB1CI) |
BATTERY 1 CHARGE CURRENT - COUNTS ( |
| EOEB3CIC |
6.687e-03 |
1.860e-02 |
-3.004e-03 |
-9.104e-02 |
EB3CI) |
BATTERY 3 CHARGE CURRENT - COUNTS ( |
EPS Battery Envelope Trends
| HRMA Heaters |
|---|
| MSID | MEAN | RMS | DELTA/YR | DELTA/YR/YR | UNITS | DESCRIPTION |
| OHRTHR20 |
294.33 |
9.315e-03 |
-1.257e-02 |
9.519e-01 |
K |
RT 135: RRCA MOUNT |
| OHRTHR38 |
288.95 |
0.40 |
-6.111e-01 |
3.888e+01 |
K |
RT 120: HRMA AFT COLLIMATOR OUTER CYLINDER |
OBA Heaters Envelope Trends
| SIM Temperature |
|---|
| MSID | MEAN | RMS | DELTA/YR | DELTA/YR/YR | UNITS | DESCRIPTION |
| 3FLCABPT |
281.28 |
3.34 |
-1.783e+00 |
-1.166e-13 |
K |
FLCA BASEPLATE (+X) |
| 3TSMXCET |
218.70 |
25.32 |
-5.442e-01 |
-1.050e-13 |
K |
-X TURTLE SHELL NR HRC CEA |
| 3TSMXSPT |
258.52 |
22.73 |
1.217e+01 |
5.270e-13 |
K |
-X TURTLE SHELL NR ACIS SS |
| 3TSPZDET |
264.55 |
8.15 |
9.992e+00 |
-4.948e-12 |
K |
+Z TURTLE SHELL NR ACIS DEA |
| 3TSPZSPT |
268.79 |
7.05 |
-1.091e+00 |
-3.763e-13 |
K |
+Z TURTLE SHELL NR ACIS SS |
SIM Temperature Envelope Trends
Spacecraft Motions
Reaction Wheel Rotations
TOP
Previous Months


)
)
)
)
)
)
)
)
)
)
)
)
)
)
)
)
)
)
)
)
)
)
)
)
)
)
)
)
)
)
)
)
)
)
)
)