- M&TA MONTHLY REPORT -
March 2009
OUTLINE
- Configuration
- ACIS
- Dose
- CTI
- Focal Plane Temperature
- Bad Pixels
- Background
- Rejected Events
- HRC - Dose
- Gratings - Focus
- PCAD
- ACA Trending
- Gyro bias drift
- Radiation Zone Timing
- Trending
- Critical Trends
- Quarterly Trends
- Spacecraft Motions
Configuration/Radiation Overview for March 2009
TOP
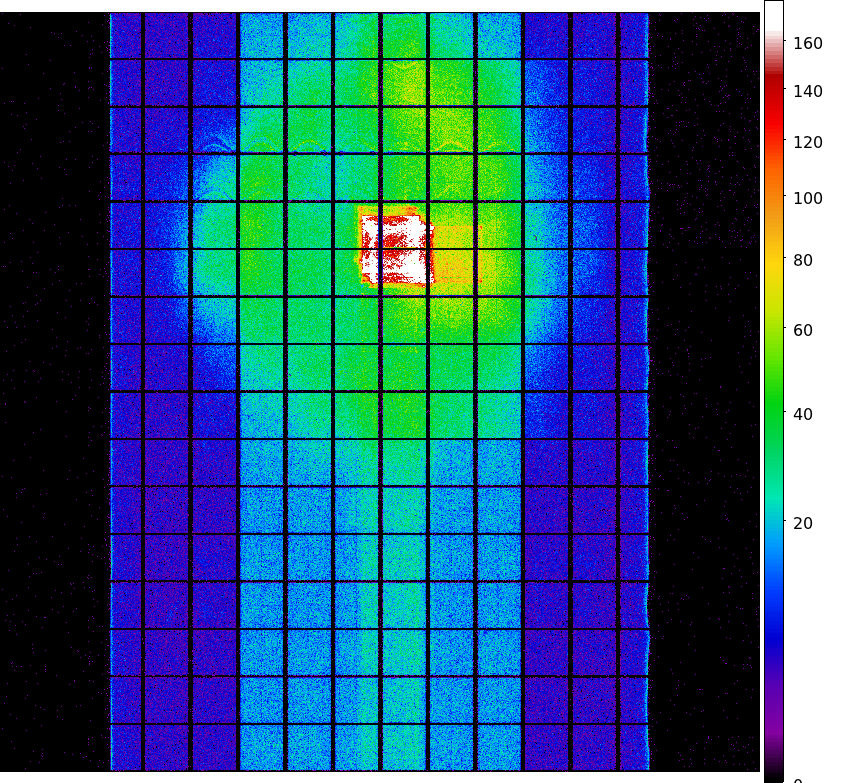
ACIS
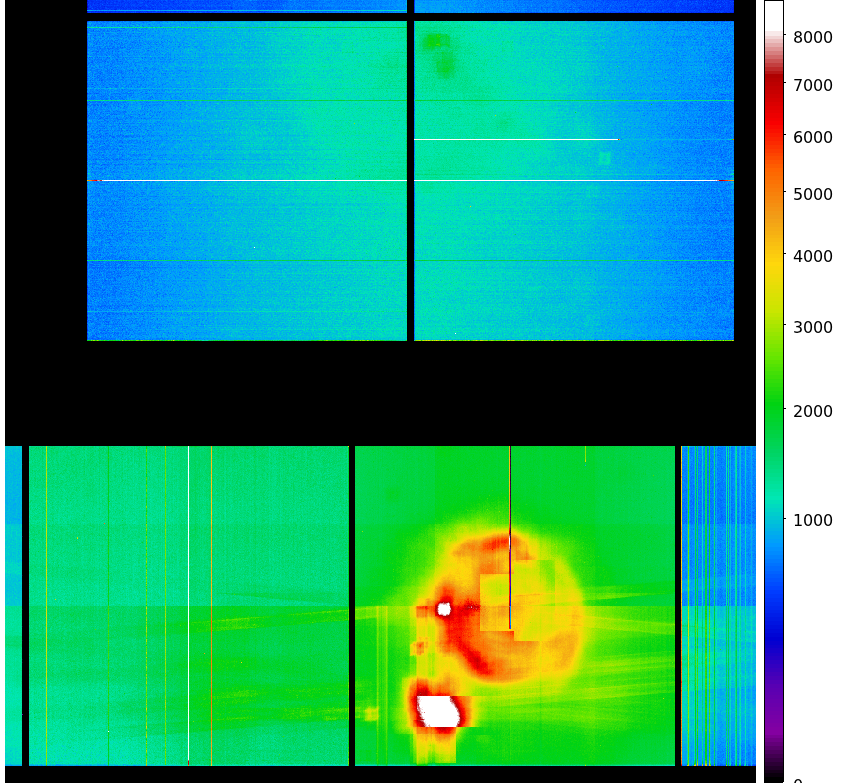
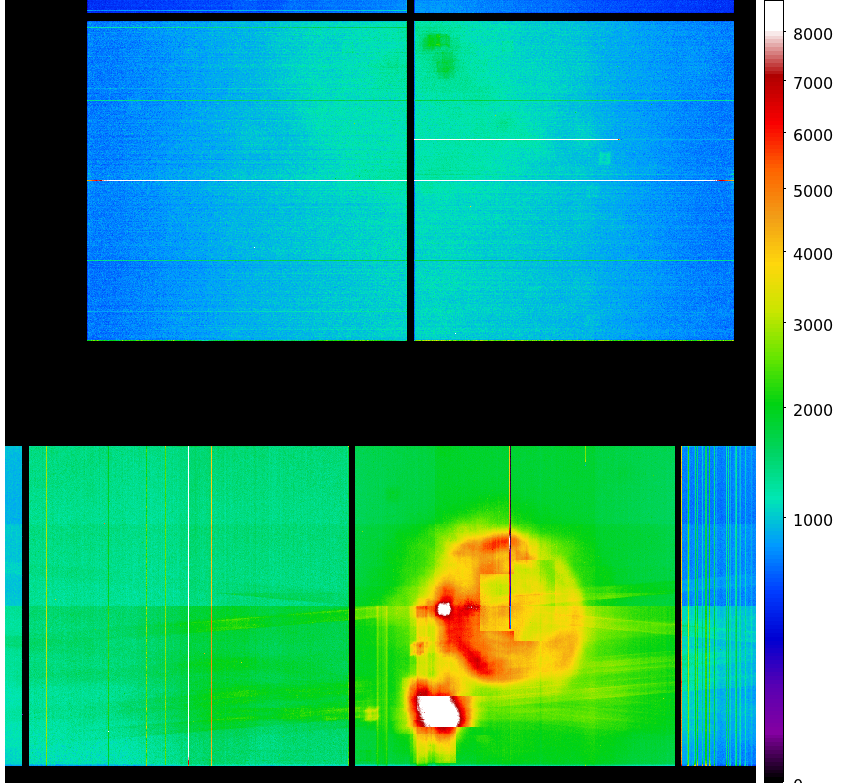
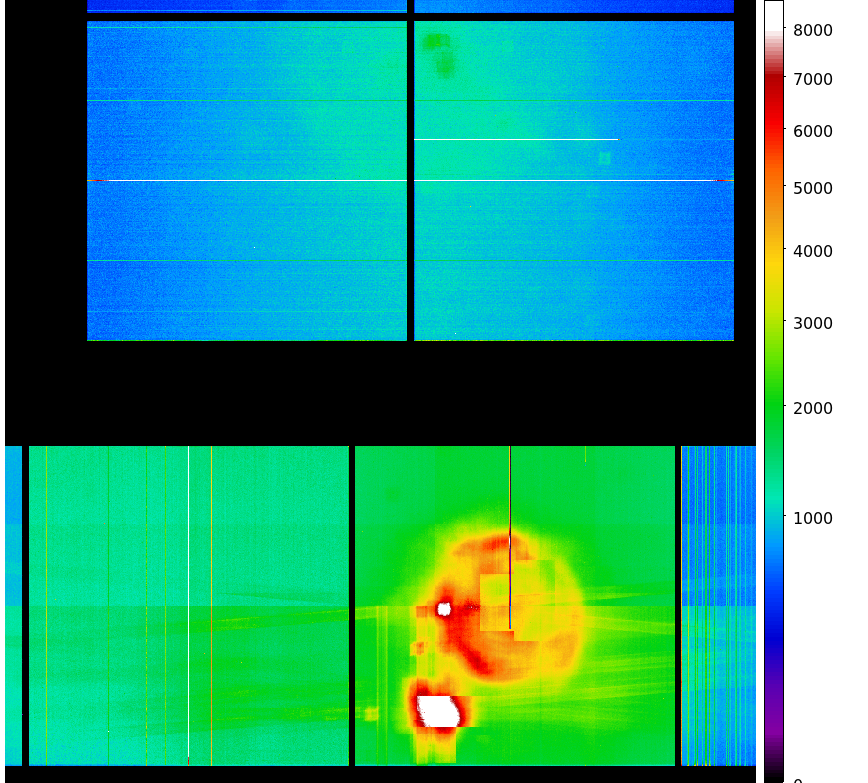
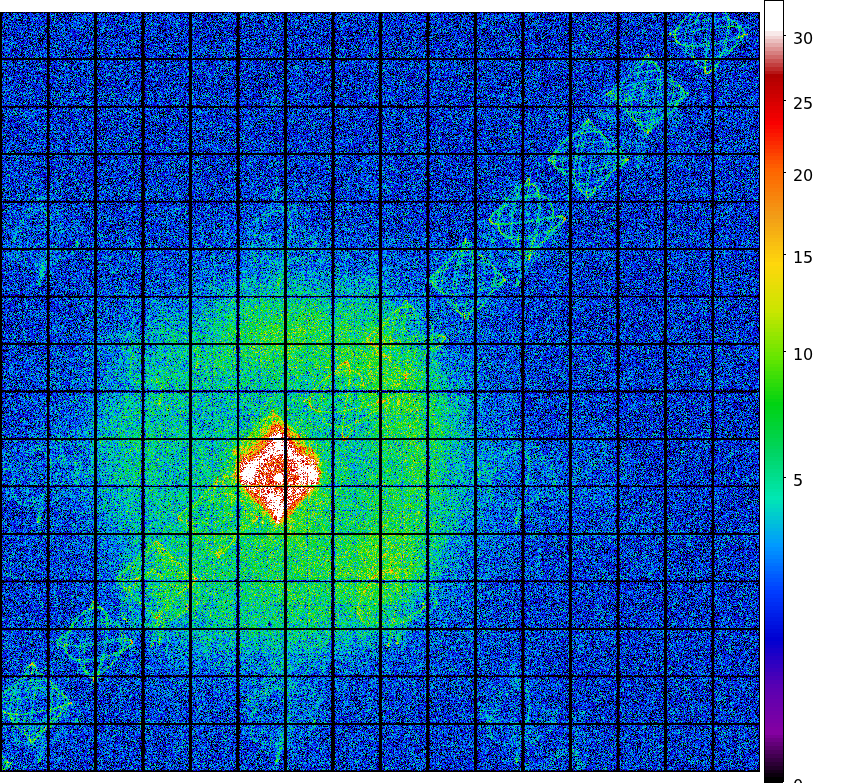
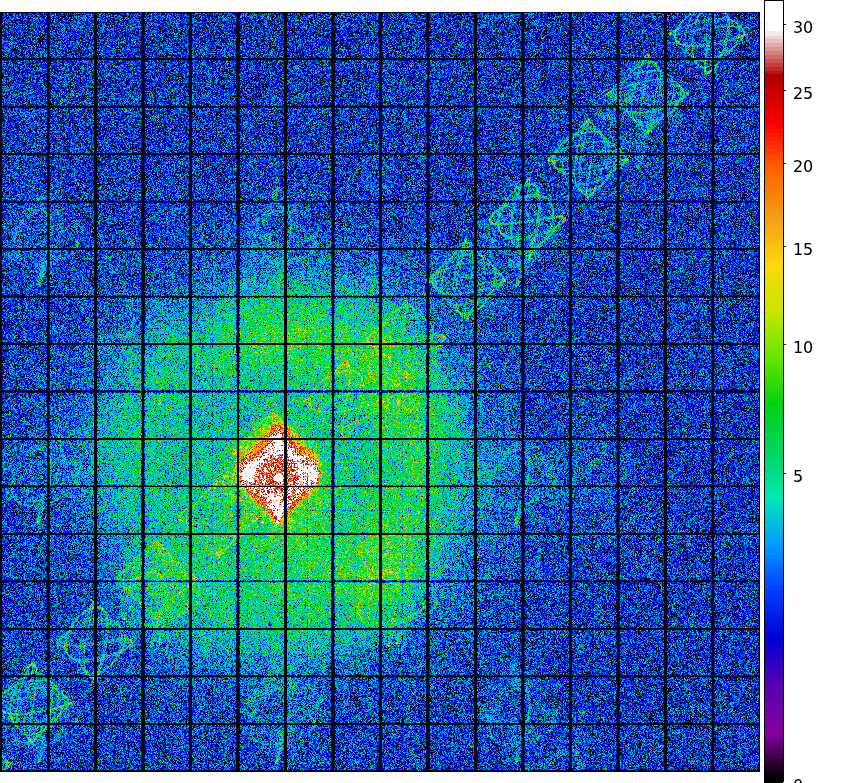
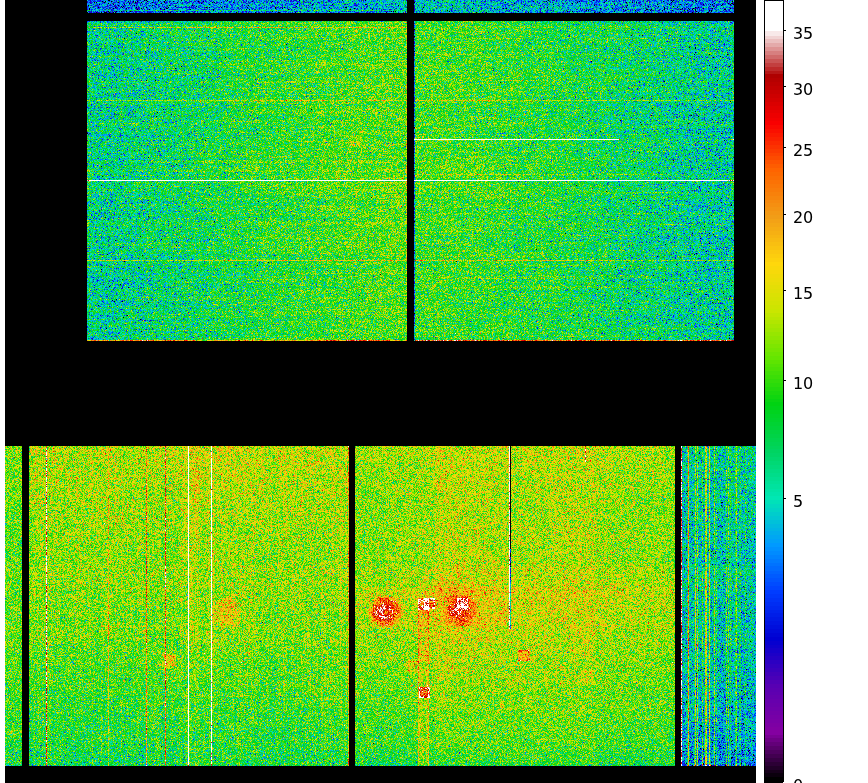
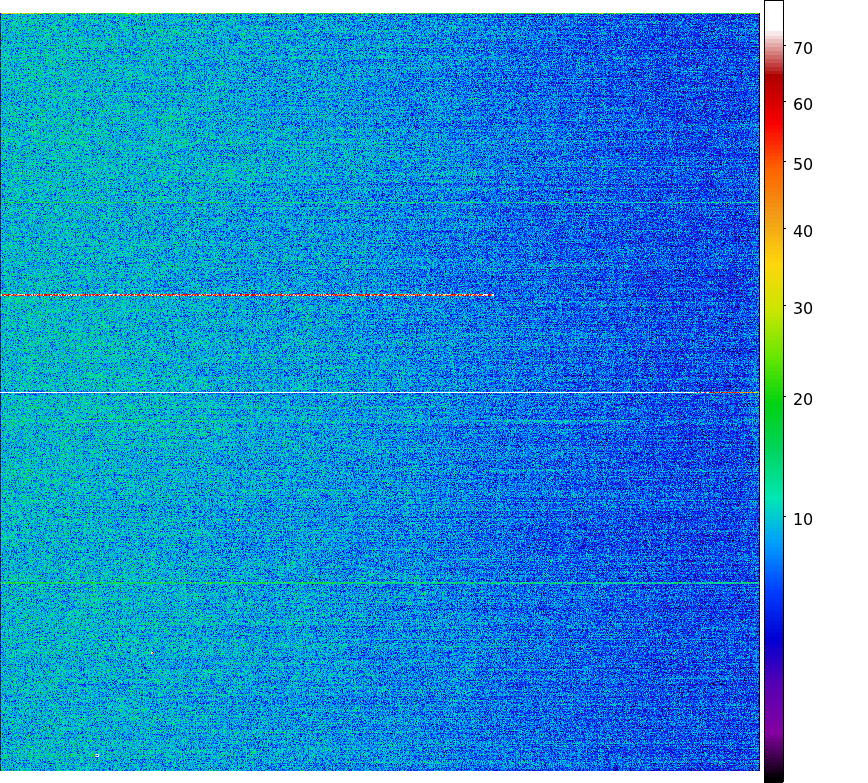
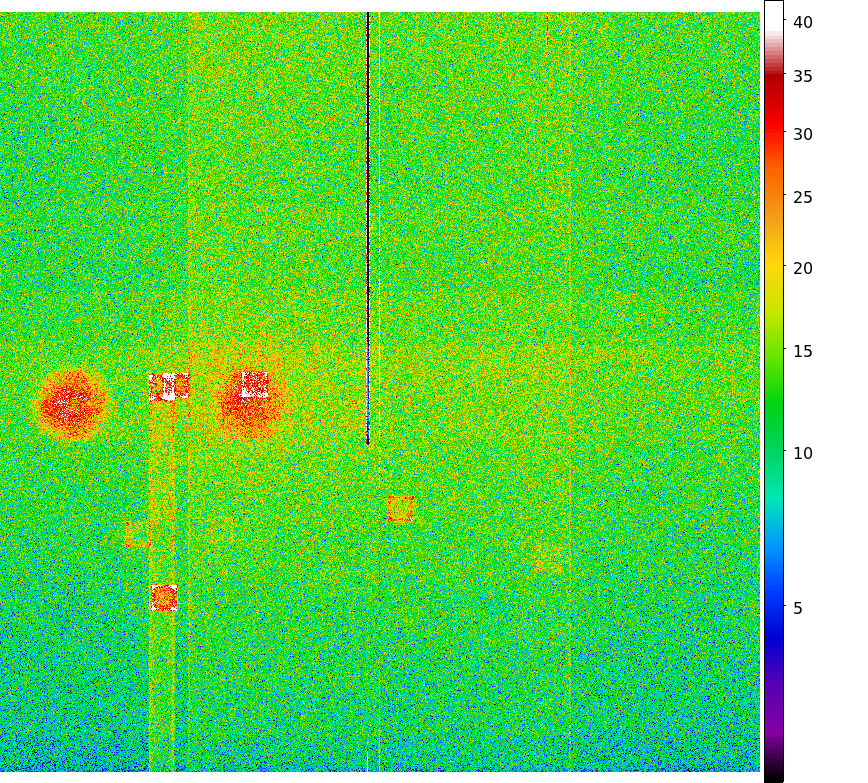
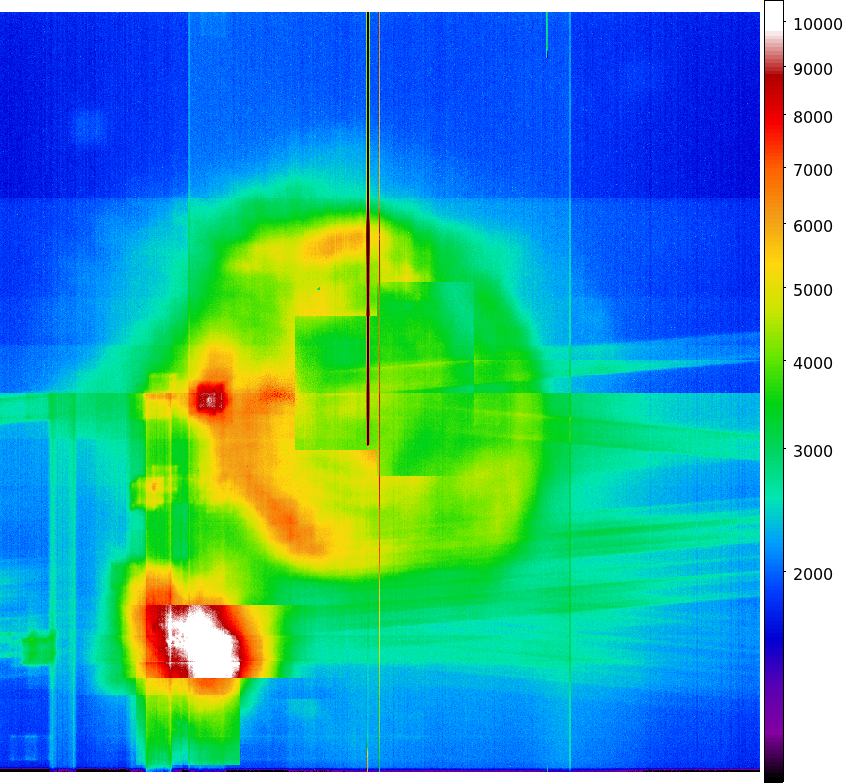
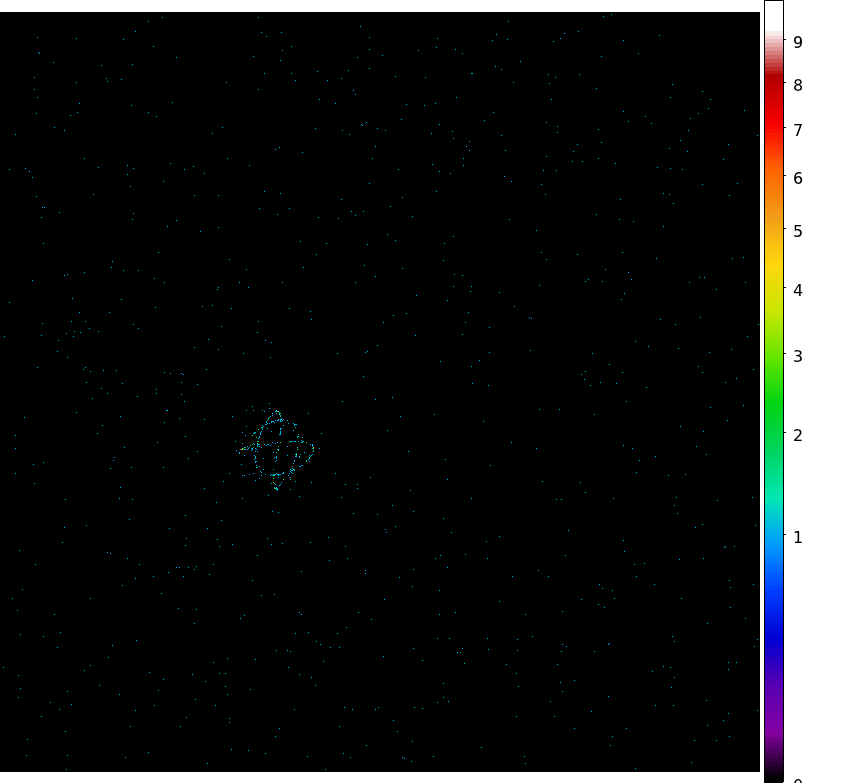
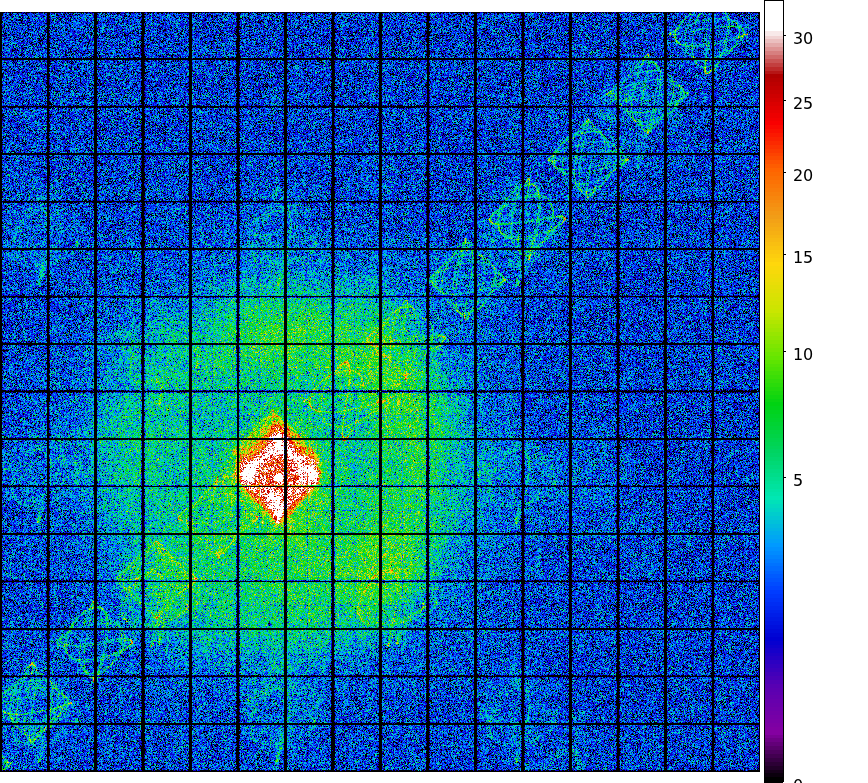
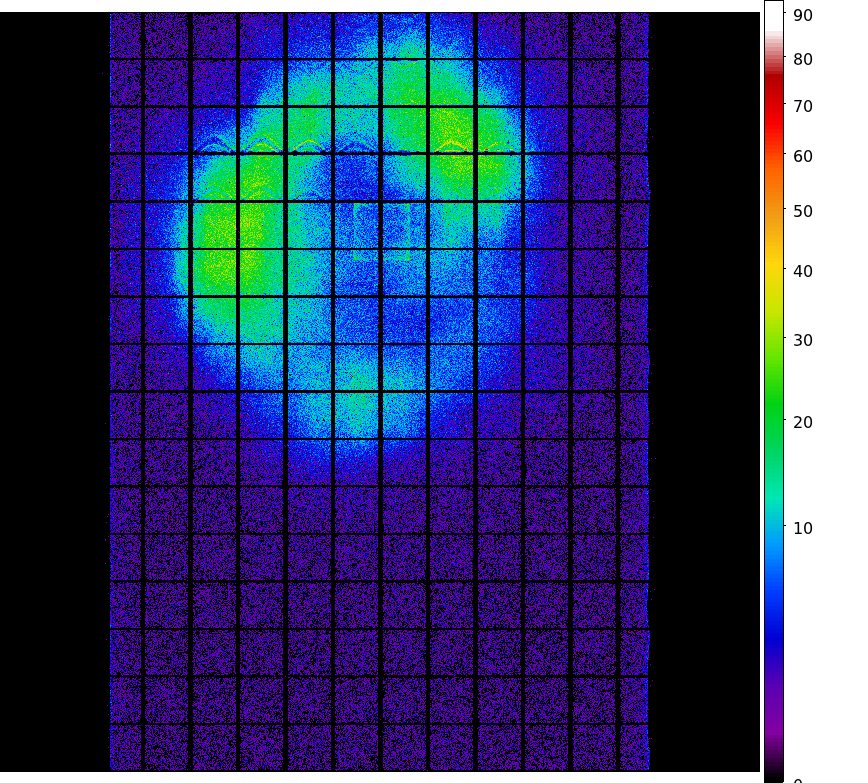
- ACIS DOSE registered-photon-map
The steps we took to compute the dose map are;
- Level 1 Event files for a specified month are obtained from archive.
- Image data including I2, I3, S2, S3 CCDs are extracted from all event files.
- All the extracted image data were merged to create a month long exposure map for the month.
- The exposure map is opened with ds9, and check a distribution of count rates against energy.
From this, estimate the upper threshold value. Any events beyond this upper threshold are
assumed erroneous events such as bad pixels.
- Using this upper threshold, the data is filtered, and create a cleaned exposure map for the month.
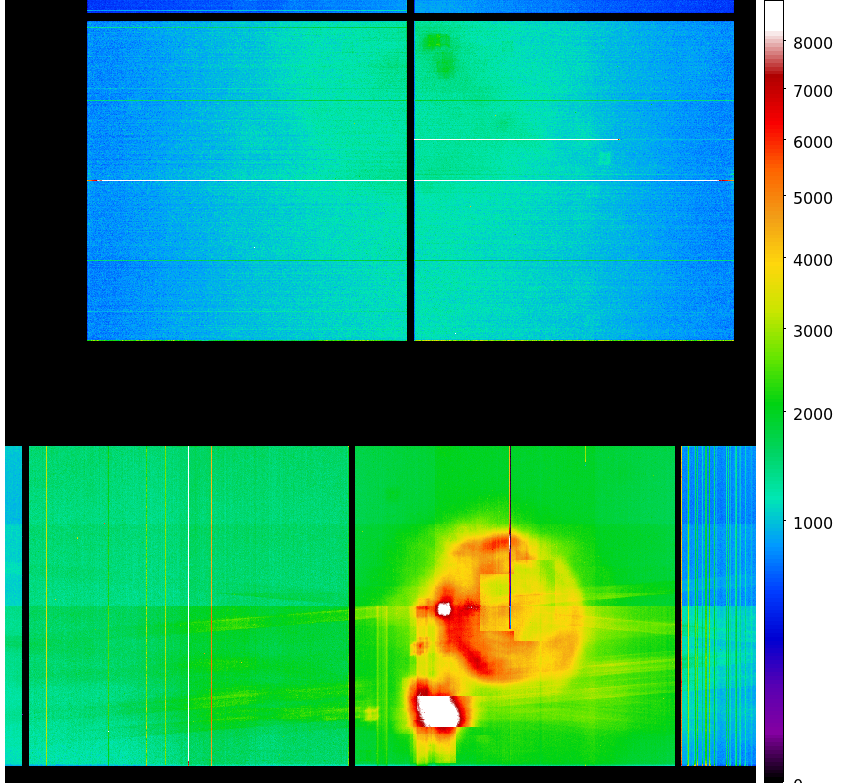
- The exposure map from each month from the Sep 1999 is added up to create a cumulative exposure
map for each month.
- Using fimgstatistic, we compute count rate statistics for each CCDs.
- For observations with high data drop rates (e.g., Crab nebula, Cas A), we corrected the
observations by adding events.
Note: Counts and RMS's of Cumulative maps are lower than the previous months. This is because we excluded
extreme outliers.
Please check more detail plots at Telemetered Photon Dose Trend page.
- MAR registered-photon-map in fits
Statistics:
# IMAGE     NPIX        MEAN           RMS              MIN     MAX
ACIS_mar09 6004901      8.021          12.00            0.0     707.0

 I2 node 0  262654      8.323936        3.479444        0.0      54.0
 I2 node 1  262654      8.864878        3.933064        0.0     307.0
 I2 node 2  262654      8.720539        3.553127        0.0      47.0
 I2 node 3  262654      8.552234        3.740525        0.0      50.0

 I3 node 0  262654      8.256441        3.470495        0.0      46.0
 I3 node 1  262654      8.788334        9.062122        0.0     230.0
 I3 node 2  262654      8.072502        3.335395        0.0      62.0
 I3 node 3  262654      8.059811        3.395845        0.0     134.0

 I2 node 0  262654      11.530178       4.339202        0.0     364.0
 I2 node 1  262654      11.892737       4.843755        0.0      88.0
 I2 node 2  262654      12.352114       4.592746        0.0     118.0
 I2 node 3  262654      11.840391       4.344664        0.0     707.0

 I3 node 0  262654      12.907441       5.230000        0.0     105.0
 I3 node 1  262654      14.012523       5.226427        0.0      87.0
 I3 node 2  262654      13.268903       3.997264        0.0      49.0
 I3 node 3  262654      12.139558       3.755607        0.0      95.0
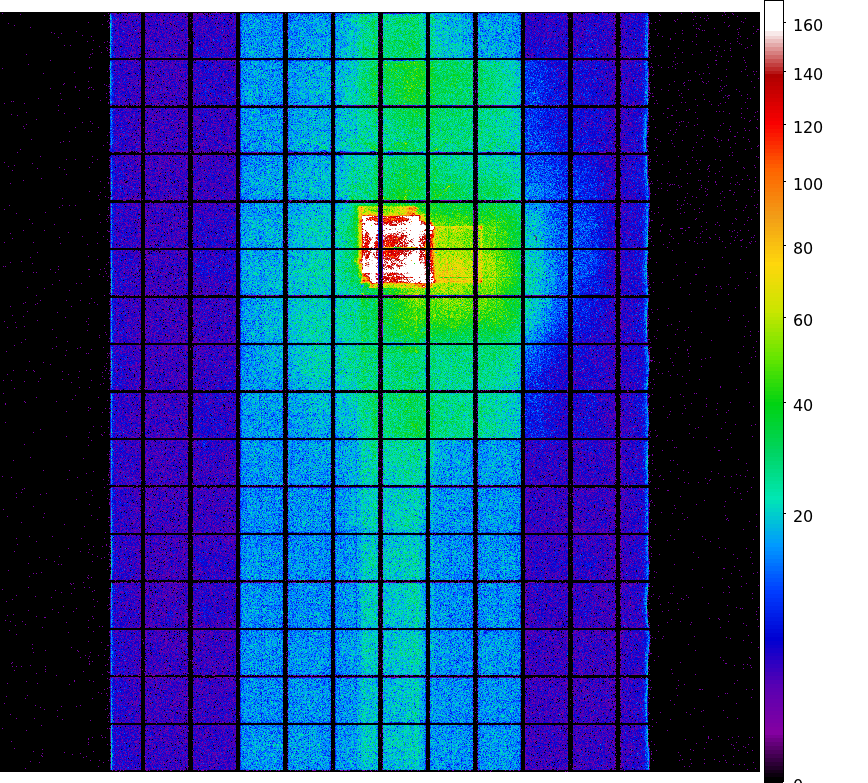
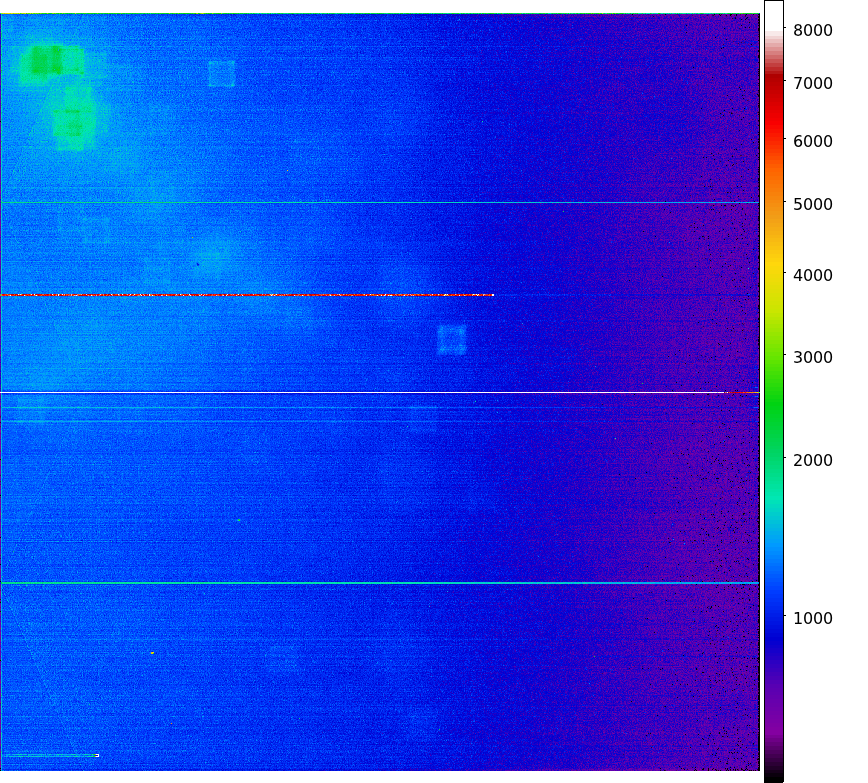
- Jul 1999 - Mar 2009 registered-photon-map in fits
Statistics:
 IMAGE        NPIX      MEAN          RMS              MIN    MAX
ACIS_total  6004901    1236.16          1688.62         0.0    75465.0

 I2 node 0  262654      960.632637      173.625668      0.0     4374.0
 I2 node 1  262654      1016.441302     237.189889      0.0     16687.0
 I2 node 2  262654      1030.559833     199.251743      0.0     8420.0
 I2 node 3  262654      1031.362072     252.774415      0.0     27277.0

 I3 node 0  262654      1084.257103     261.264537      0.0     5663.0
 I3 node 1  262654      1126.302334     818.145877      0.0     21683.0
 I3 node 2  262654      1002.195832     171.862208      0.0     4359.0
 I3 node 3  262654      990.302662      184.564694      0.0     18301.0

 I2 node 0  262654      1483.447955     195.328349      725.0   19823.0
 I2 node 1  262654      1572.880556     325.062524      758.0   8232.0
 I2 node 2  262654      1752.934356     330.563132      980.0   11674.0
 I2 node 3  262654      1692.218272     245.473620      969.0   23008.0

 I3 node 0  262654      2592.314982     1301.013306     1058.0  11011.0
 I3 node 1  262654      3802.438348     1793.261186     0.0     11900.0
 I3 node 2  262654      2802.806307     818.921191      946.0   6352.0
 I3 node 3  262654      2118.748226     347.378122      1113.0  8300.0
- MAR 2009 dose PNG image
- MAR I3 dose PNG image
- MAR S3 dose PNG image
- TOTAL JUL 1999 - MAR 2009 dose PNG image
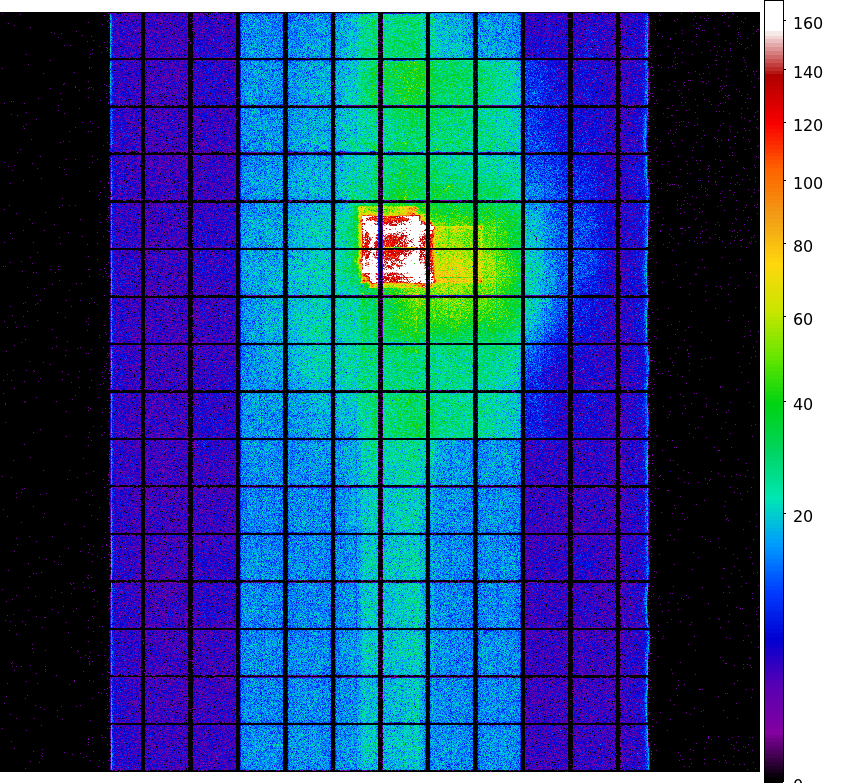
- TOTAL I3 dose PNG image
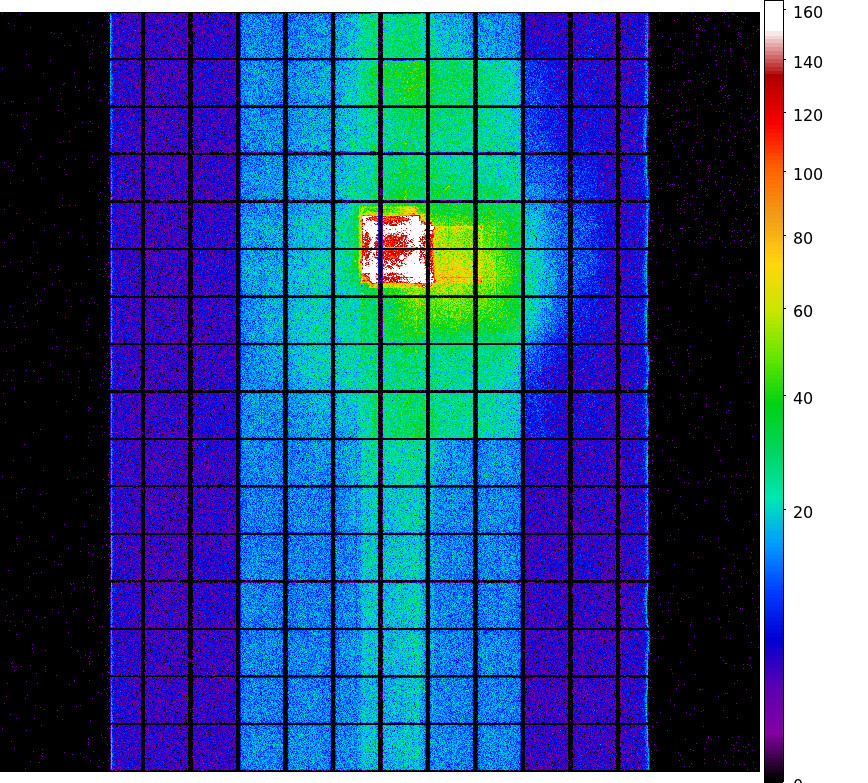
- TOTAL S3 dose PNG image
Integrated Exposure Maps of Last 12 Months

|
|
|
|
| Dec 2008 |
Sep 2008 |
Jun 2008 |
Mar 2008 |
The Mean Detrended CTI
We report CTIs with a refined data definition. CTIs were computed for the temperature
dependency corrected data.
Please see
CTI page
for detailed explanation.
CTI's are computed for Mn K alpha, and defined as slope/intercept x10^4 of row # vs ADU.
Data file here
 Focal Plane Temperature
       The Mean (max) FPT: -110.27 C    std dev: 5.06
               mean width:    0.48 days std dev: 0.40
We are using 10 period moving averages to show
trends of peak temperatures and peak widths.
Note, the gaps in the width plot are due to missing/corrupted data.
The following is a plot of focal plane temperature and sun angle, earth angle, and altitude.
Bad Pixels
The plots below were generated with a new warm pixel finding script. Please see
Acis Bad Pixel Page
for details.
Front Side CCDs
Back Side CCD (CCD5)
Acis Count Rate Plot
This monitors the ACIS count Rate vs. EPHIN count Rate.
No sources or CTI observations are removed. For daily updates see:
Ephin/Acis Info

Science instrument background rates
This page shows scientific instrument background data based on Acis
observations. A source region file is generated using get_srcregions
and then the input event file is filtered using the regions in that file
to remove the sources.
| Name | Low (keV) | High(KeV) | Description |
|---|
| SSoft | 0.00 | 0.50 | Super soft photons |
|---|
| Soft | 0.50 | 1.00 | Soft photons |
|---|
| Med | 1.00 | 3.00 | Moderate energy photons |
|---|
| Hard | 3.00 | 5.00 | Hard Photons |
|---|
| Harder | 5.00 | 10.00 | Very Hard photons |
|---|
| Hardest | 10.00 | | Beyond 10 keV |
|---|
ACIS Rejected Events
The links below are plots of stat1 quantities, showing on-board rejected
events. The average EVTSENT,
DROP_AMP, DROP_POS, DROP_GRD, THR_PIX, and maximum BERR_SUM obtained from
L1 acis*stat1.fits files are plotted
for each observation. CTI observations are plotted separately from regular
science observations.
Column definitions:
- EVTSENT - number of events sent in data record
- DROP_AMP - number of discarded events due to corrected amplitude
- DROP_POS - number of discarded events due to CCD position
- DROP_GRD - number of discarded events due to grade code
- THR_PIX - number of pixels above respective threshold level
- BERR_SUM - number of pixel bias errors so far in science run
Note the half-life janline of the CTI source is clearly evidenced in the steady
janline of EVTSENT.
CCD3 CTI Observations
CCD7 Science Observations
CCD7 CTI Observations
CCD7 Science Observations
TOP
HRC
Gratings
- Focus
We plot the width of the zero order streak of ACIS/HETG observations and
the width of the zero order image for HRC/LETG observations of point sources.
No significant defocusing trend is seen at this time. See
Gratings Focus
pages.
Spacecraft Motions
Reaction Wheel Rotations
TOP
Previous Months


)
)
)
)
)
)
)
)
)
)
)
)
)
)
)
)
)
)
)
)
)
)
)
)
)
)
)
)
)
)
)
)
)
)
)
)
)
)
)