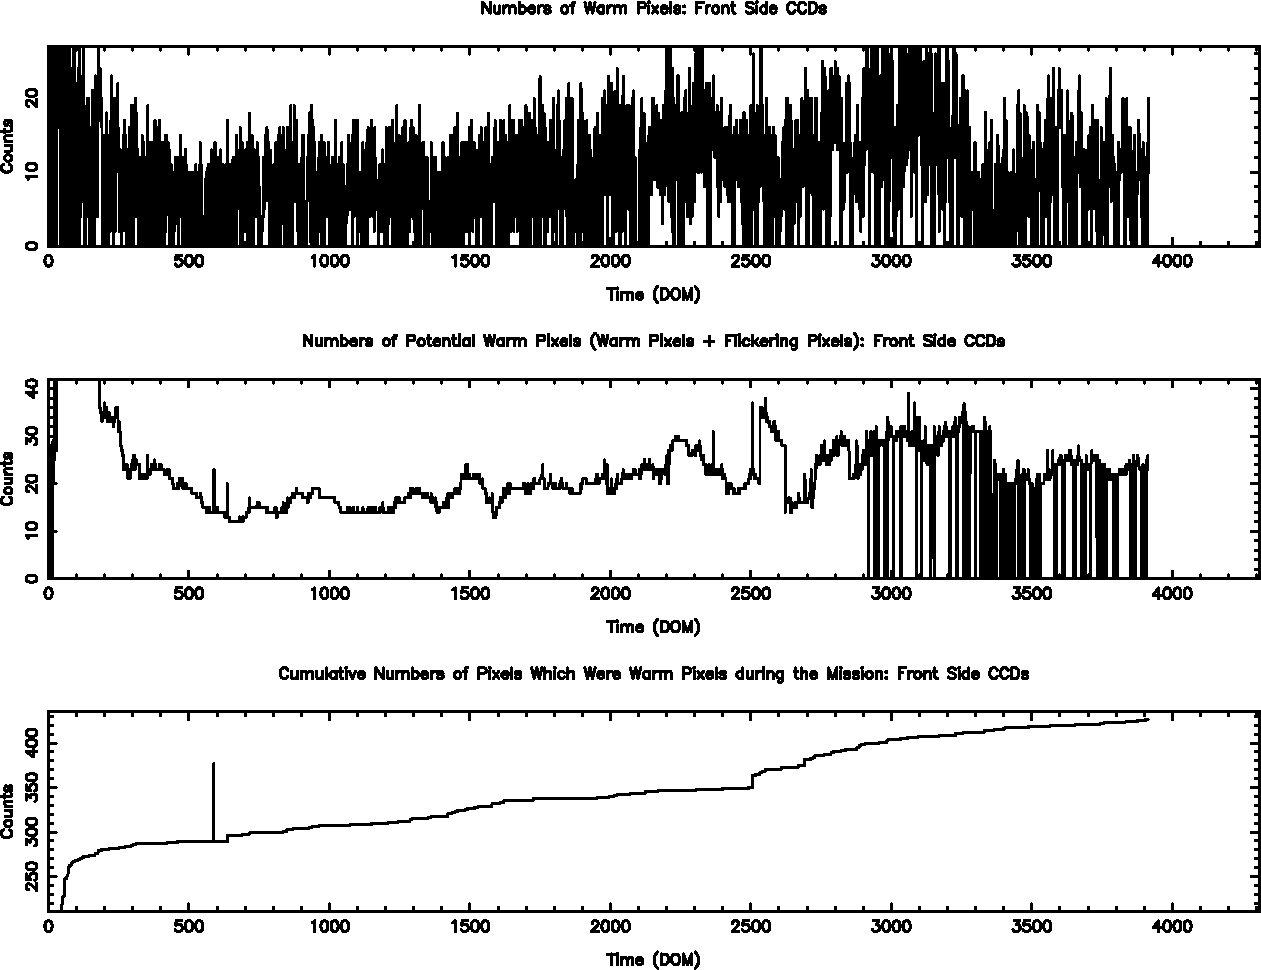
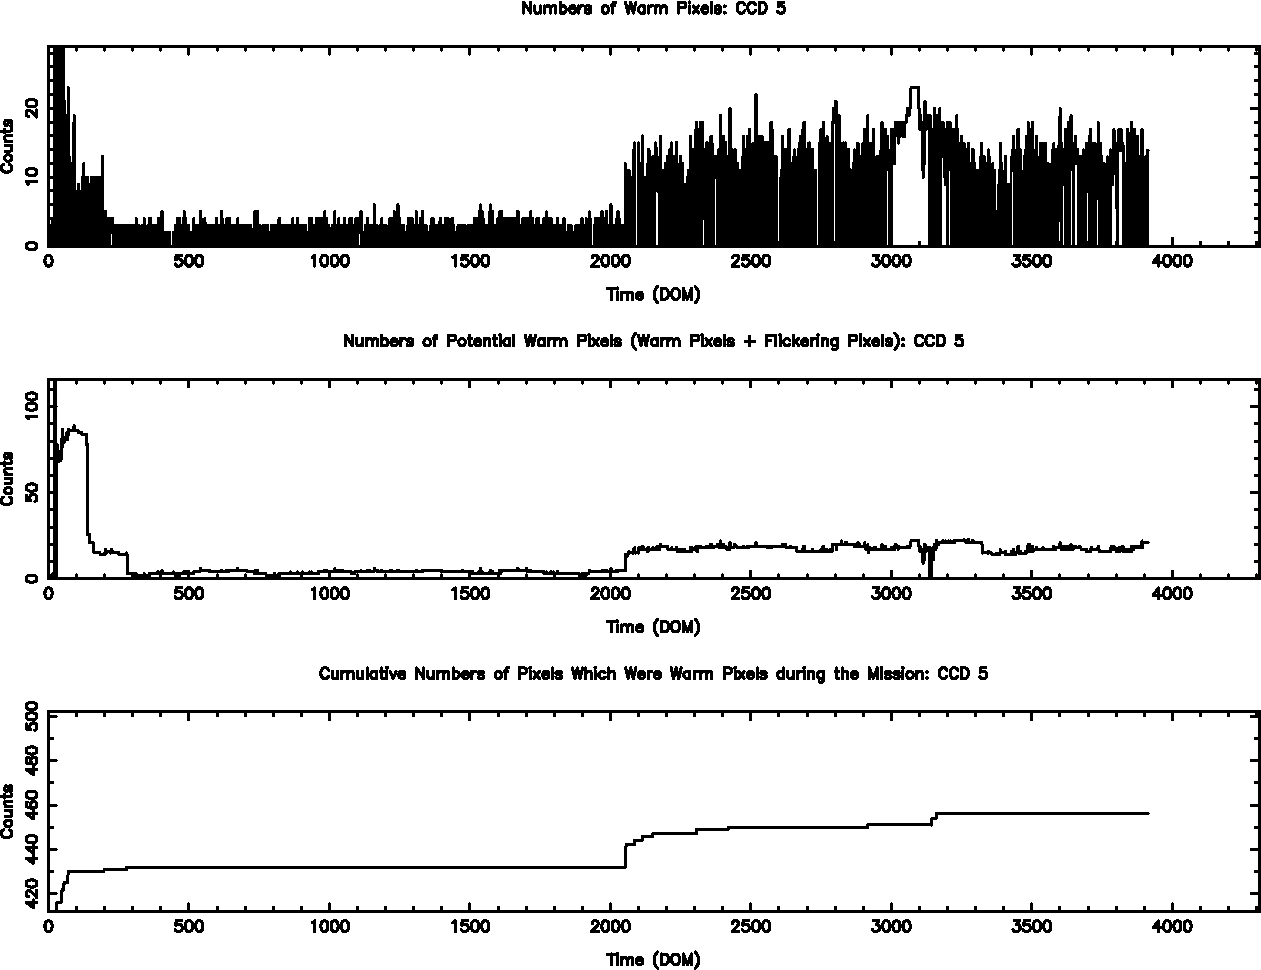
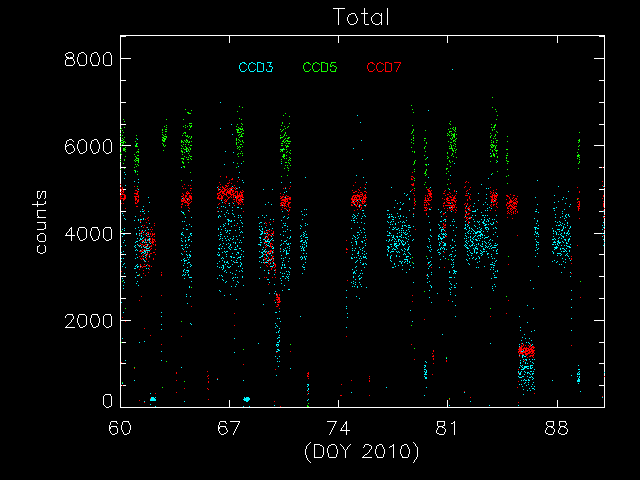
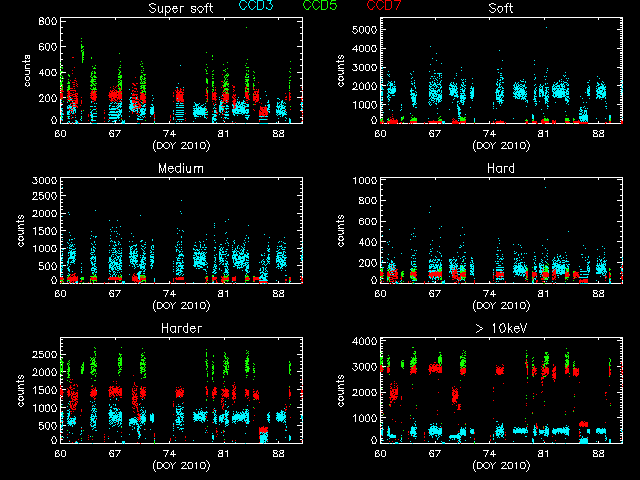
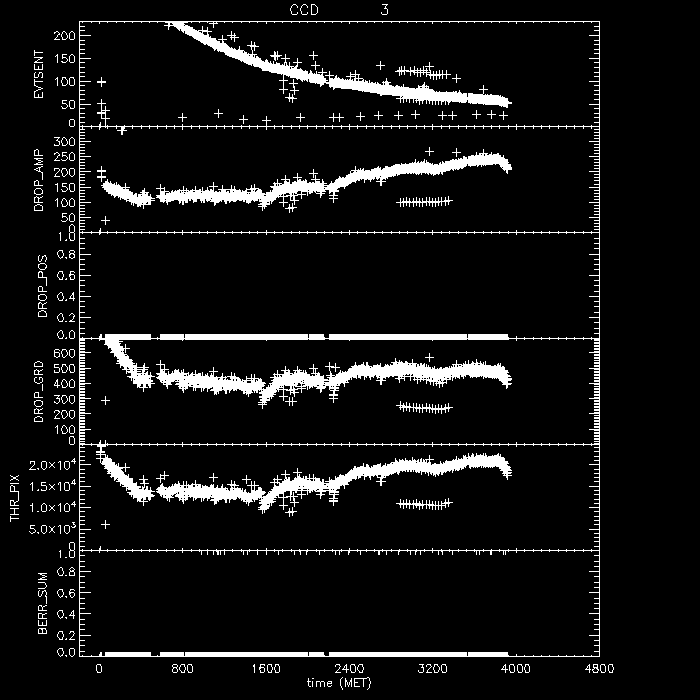
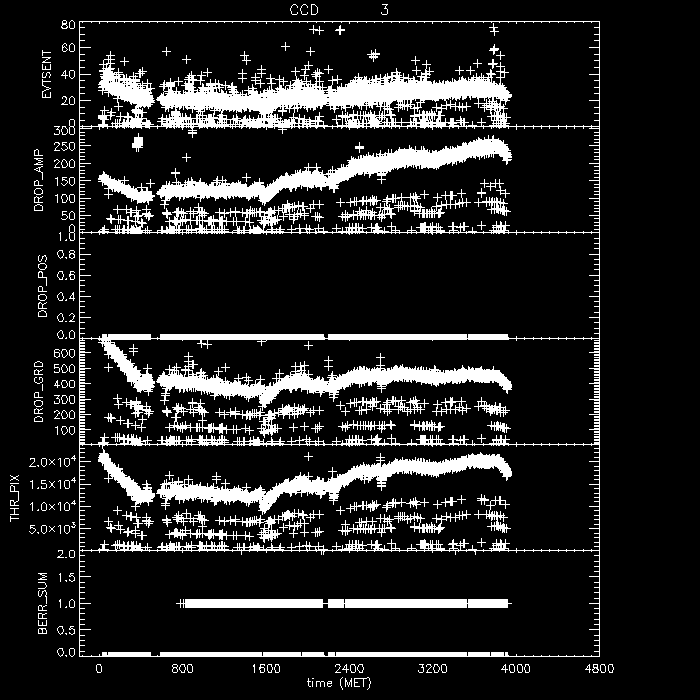
ACIS
ACIS DOSE Registered-Photon-Map
The steps we took to compute the dose map are;
- Level 1 Event files for a specified month are obtained from archive.
- Image data including I2, I3, S2, S3 CCDs are extracted from all event files.
- All the extracted image data were merged to create a month long exposure map for the month.
- The exposure map is opened with ds9, and check a distribution of count rates against energy. From this, estimate the upper threshold value. Any events beyond this upper threshold are assumed erroneous events such as bad pixels.
- Using this upper threshold, the data is filtered, and create a cleaned exposure map for the month.
- The exposure map from each month from the Sep 1999 is added up to create a cumulative exposure map for each month.
- Using fimgstatistic, we compute count rate statistics for each CCDs.
- For observations with high data drop rates (e.g., Crab nebula, Cas A), we corrected the observations by adding events.
-
Note: Counts and RMS's of Cumulative maps are lower than the previous months.
This is because we excluded extreme outliers.
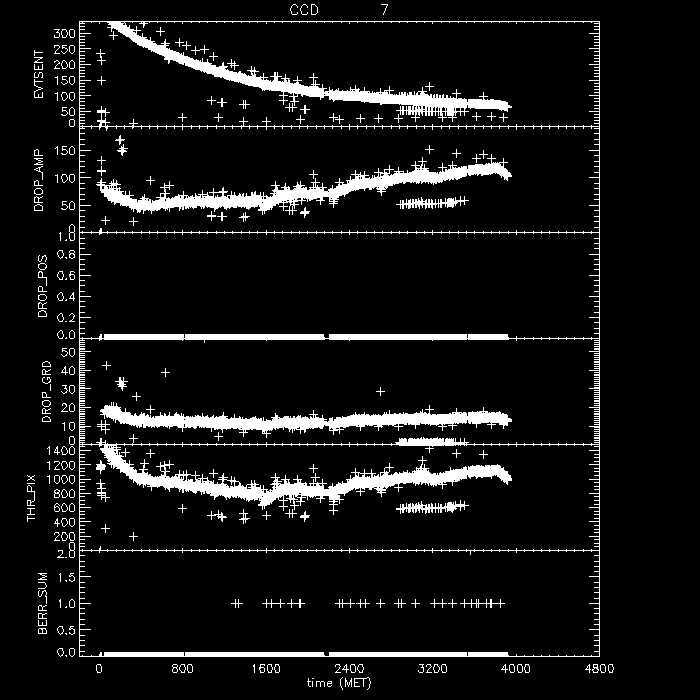
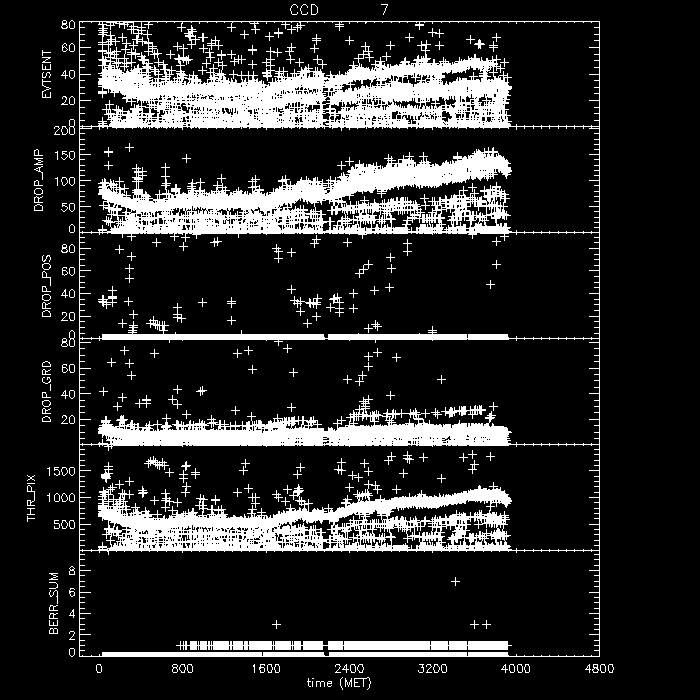
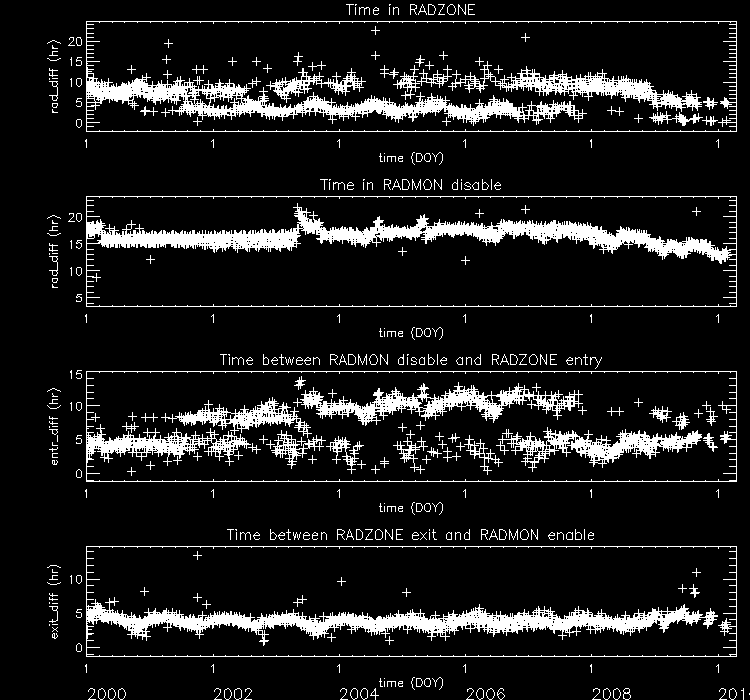
Please check more detail plots at Telemetered Photon Dose Trend page.
)
)
)
Statistics:
# IMAGE     NPIX        MEAN           RMS              MIN     MAX
ACIS_mar10 6004901      10.644         18.781           0.0     13413

 I2 node 0  262654      11.623119       4.291749        0.0      76.0
 I2 node 1  262654      13.039330       6.479634        0.0     336.0
 I2 node 2  262654      12.091198       4.398658        0.0      91.0
 I2 node 3  262654      11.798204       4.589748        0.0      75.0

 I3 node 0  262654      11.495319       4.229780        0.0      59.0
 I3 node 1  262654      12.317799       12.205491       0.0     304.0
 I3 node 2  262654      11.526925       4.101680        0.0     158.0
 I3 node 3  262654      13.136490       28.059431       0.0     9247.0

 S2 node 0  262654      13.913507       12.211772       0.0     5719.0
 S2 node 1  262654      15.473249       5.808744        1.0     115.0
 S2 node 2  262654      16.730702       19.637584       1.0     9102.0
 S2 node 3  262654      16.091532       8.556732        1.0     929.0

 S3 node 0  262654      15.203615       9.302606        0.0     165.0
 S3 node 1  262654      17.380925       10.783266       0.0     2615.0
 S3 node 2  262654      16.502095       5.666400        1.0      66.0
 S3 node 3  262654      14.611364       5.216289        1.0      63.0
)
)
)
Statistics:
 IMAGE        NPIX      MEAN          RMS              MIN    MAX
ACIS_total  6004901    1364.77          1841.68         0.0    82953.0

 I2 node 0  262654      1111.606480     210.817473      0.0     5244.0
 I2 node 1  262654      1171.480077     281.186120      0.0     20687.0
 I2 node 2  262654      1209.405987     263.777075      0.0     8679.0
 I2 node 3  262654      1204.869451     307.002219      0.0     27496.0

 I3 node 0  262654      1266.492579     311.635951      0.0     6064.0
 I3 node 1  262654      1327.848816     971.305517      0.0     25212.0
 I3 node 2  262654      1147.484239     203.844174      0.0     5193.0
 I3 node 3  262654      1135.205318     218.985369      0.0     20670.0

 S2 node 0  262654      1647.625548     222.812040      827.0   19958.0
 S2 node 1  262654      1751.670880     367.329485      861.0   9409.0
 S2 node 2  262654      1942.657878     362.384105      1113.0  13354.0
 S2 node 3  262654      1870.416792     258.067764      1085.0  27267.0

 S3 node 0  262654      2798.009532     1337.321868     1156.0  11299.0
 S3 node 1  262654      4044.881310     1826.861206     0.0     12118.0
 S3 node 2  262654      3033.752145     854.469090      1077.0  7591.0
 S3 node 3  262654      2312.385675     373.359526      1233.0  8792.0
)
|
)
|
)
|
)
|
| Dec 2009 | Sep 2009 | Jun 2009 | Mar 2009 |
|---|
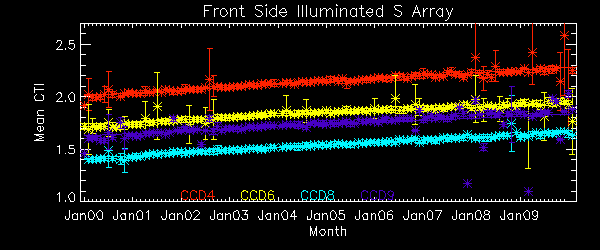
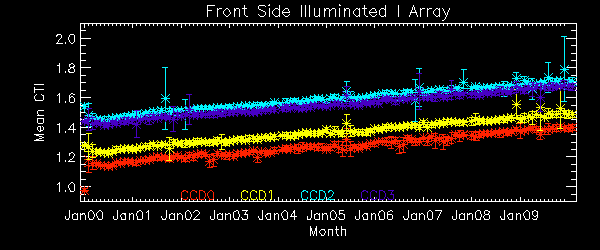
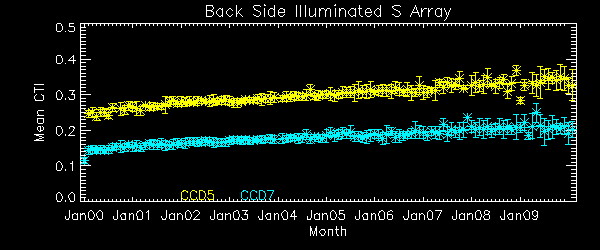
The Mean Detrended CTI
We report CTIs with a refined data definition. CTIs were computed for the temperature dependency corrected data. Please see CTI page for detailed explanation. CTI's are computed for Mn K alpha, and defined as slope/intercept x10^4 of row # vs ADU. Data file: here
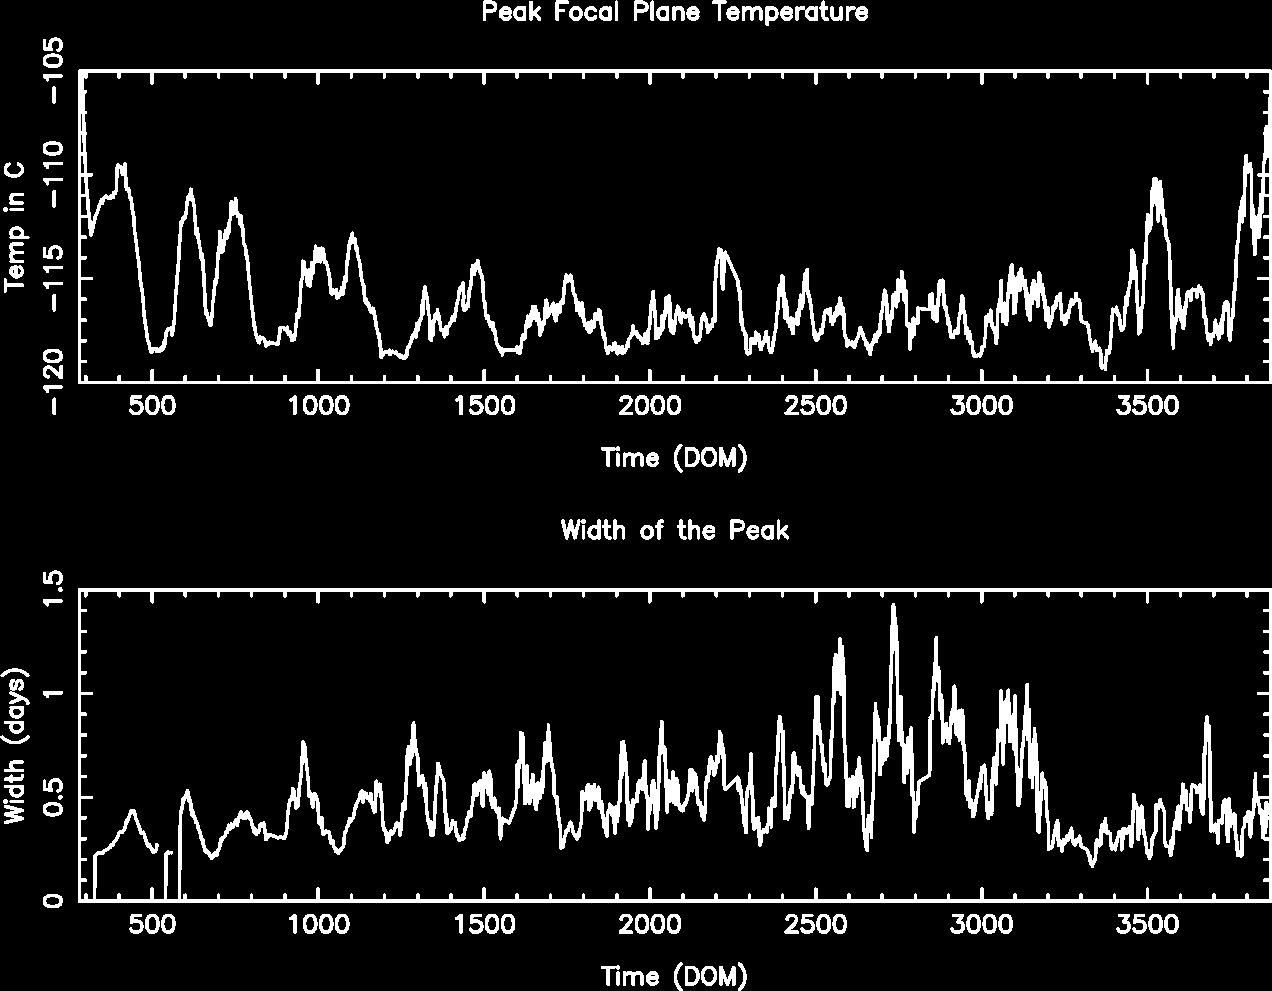
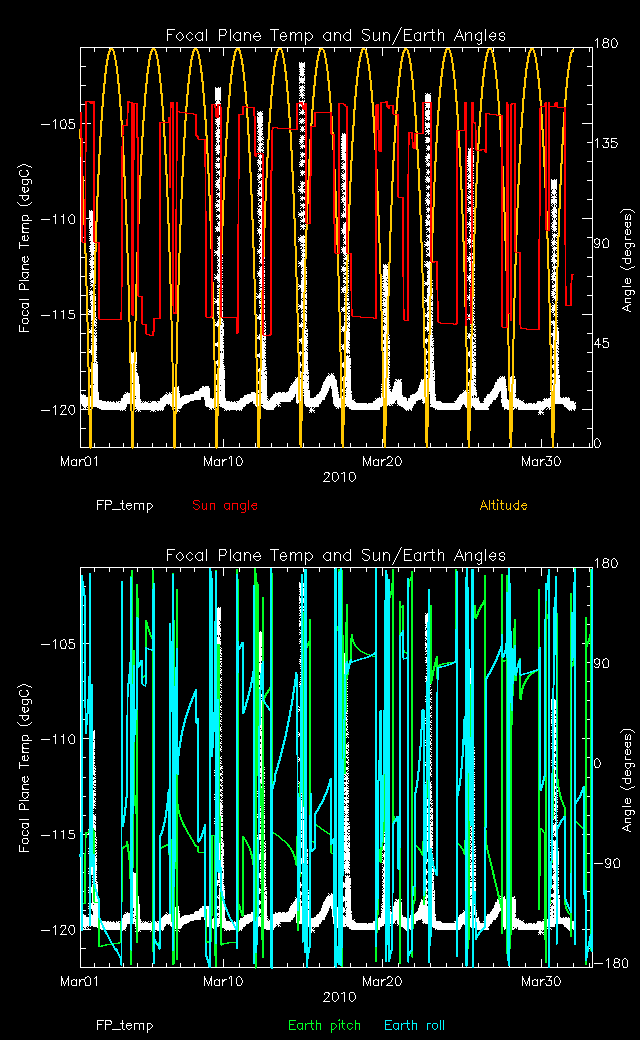
Focal Plane Temperature
March 2010 Focal Temperature
)
)
)
)
)
)
)
)
)
)
)
)

)
)
)
)
)
)
)
)
)
)
)
)
)
)
)
)
)
)
)
)
)
)
)
)
)
)
)
)
)
)
)
)
)
)
)
)