ACIS
ACIS DOSE Registered-Photon-Map
The steps we took to compute the dose map are;
- Level 1 Event files for a specified month are obtained from archive.
- Image data including I2, I3, S2, S3 CCDs are extracted from all event files.
- All the extracted image data were merged to create a month long exposure map for the month.
- The exposure map is opened with ds9, and check a distribution of count rates against energy. From this, estimate the upper threshold value. Any events beyond this upper threshold are assumed erroneous events such as bad pixels.
- Using this upper threshold, the data is filtered, and create a cleaned exposure map for the month.
- The exposure map from each month from the Sep 1999 is added up to create a cumulative exposure map for each month.
- Using fimgstatistic, we compute count rate statistics for each CCDs.
- For observations with high data drop rates (e.g., Crab nebula, Cas A), we corrected the observations by adding events.
-
Note: Counts and RMS's of Cumulative maps are lower than the previous months.
This is because we excluded extreme outliers.
Please check more detail plots at Telemetered Photon Dose Trend page.
)
)
)
Statistics:
# IMAGE     NPIX        MEAN           RMS              MIN     MAX
ACIS_dec10 6004901      7.75           11.46            0.0     541

 I2 node 0  262654      7.474712        3.256861        0.0      56.0
 I2 node 1  262654      8.012994        3.702373        0.0     240.0
 I2 node 2  262654      7.735416        3.299604        0.0      70.0
 I2 node 3  262654      7.710438        3.596934        0.0     343.0

 I3 node 0  262654      7.698366        3.323664        0.0      41.0
 I3 node 1  262654      8.193256        8.472956        0.0     202.0
 I3 node 2  262654      7.486057        3.210521        0.0      52.0
 I3 node 3  262654      7.415890        3.230006        0.0     121.0

 S2 node 0  262654      9.845638        3.866295        0.0     463.0
 S2 node 1  262654      10.420176       4.552883        0.0      84.0
 S2 node 2  262654      10.953895       4.686653        0.0     110.0
 S2 node 3  262654      11.950797       10.124315       0.0     499.0

 S3 node 0  262654      15.522434       16.910323       0.0     333.0
 S3 node 1  262654      15.135917       8.197502        0.0     148.0
 S3 node 2  262654      13.616299       4.127520        0.0      55.0
 S3 node 3  262654      12.312979       3.858830        0.0      64.0
)
)
)
Statistics:
 IMAGE        NPIX      MEAN             RMS            MIN    MAX
ACIS_total  6004901    1462.86          1967.65         0.0    88837.0

 I2 node 0  262654      1201.461590     229.950908      0.0      5838.0
 I2 node 1  262654      1267.629623     307.363914      0.0     23190.0
 I2 node 2  262654      1303.870571     283.150521      0.0      8772.0
 I2 node 3  262654      1299.598889     331.564938      0.0     27594.0

 I3 node 0  262654      1364.635095     334.503187      0.0      6266.0
 I3 node 1  262654      1430.631950     1065.527639     0.0     27504.0
 I3 node 2  262654      1239.905180     223.128797      0.0      5776.0
 I3 node 3  262654      1226.374317     238.307527      0.0     22134.0

 S2 node 0  262654      1752.329837     241.032206      893.0   20044.0
 S2 node 1  262654      1864.110100     396.443484      927.0   10141.0
 S2 node 2  262654      2067.912902     390.900062      1184.0  14462.0
 S2 node 3  262654      1994.084079     288.712218      1162.0  30083.0

 S3 node 0  262654      2958.986110     1423.020043     1224.0  11766.0
 S3 node 1  262654      4214.858088     1865.086369     0.0     12357.0
 S3 node 2  262654      3192.164744     890.289325      1161.0   8024.0
 S3 node 3  262654      2436.097288     397.579436      1316.0   9074.0
)
|
)
|
)
|
)
|
| Sep 2010 | Jun 2010 | Mar 2010 | Dec 2009 |
|---|
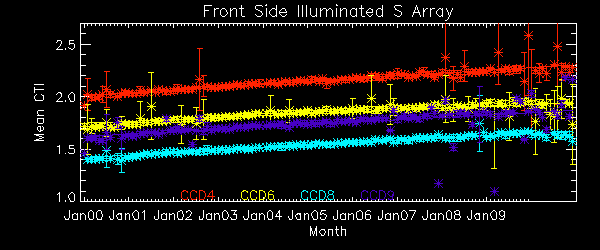
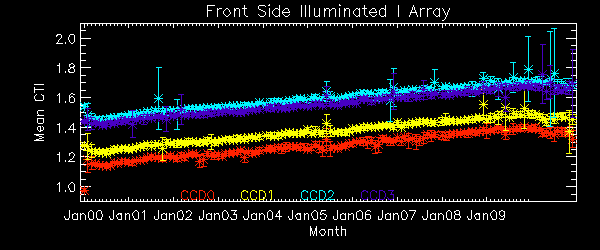
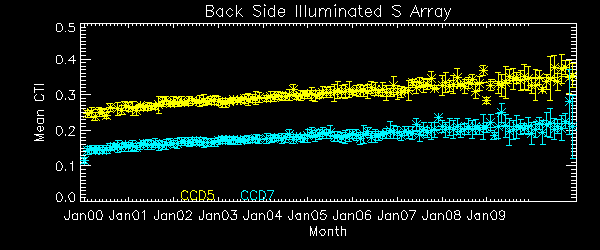
The Mean Detrended CTI
We report CTIs with a refined data definition. CTIs were computed for the temperature dependency corrected data. Please see CTI page for detailed explanation. CTI's are computed for Mn K alpha, and defined as slope/intercept x10^4 of row # vs ADU. Data file: here
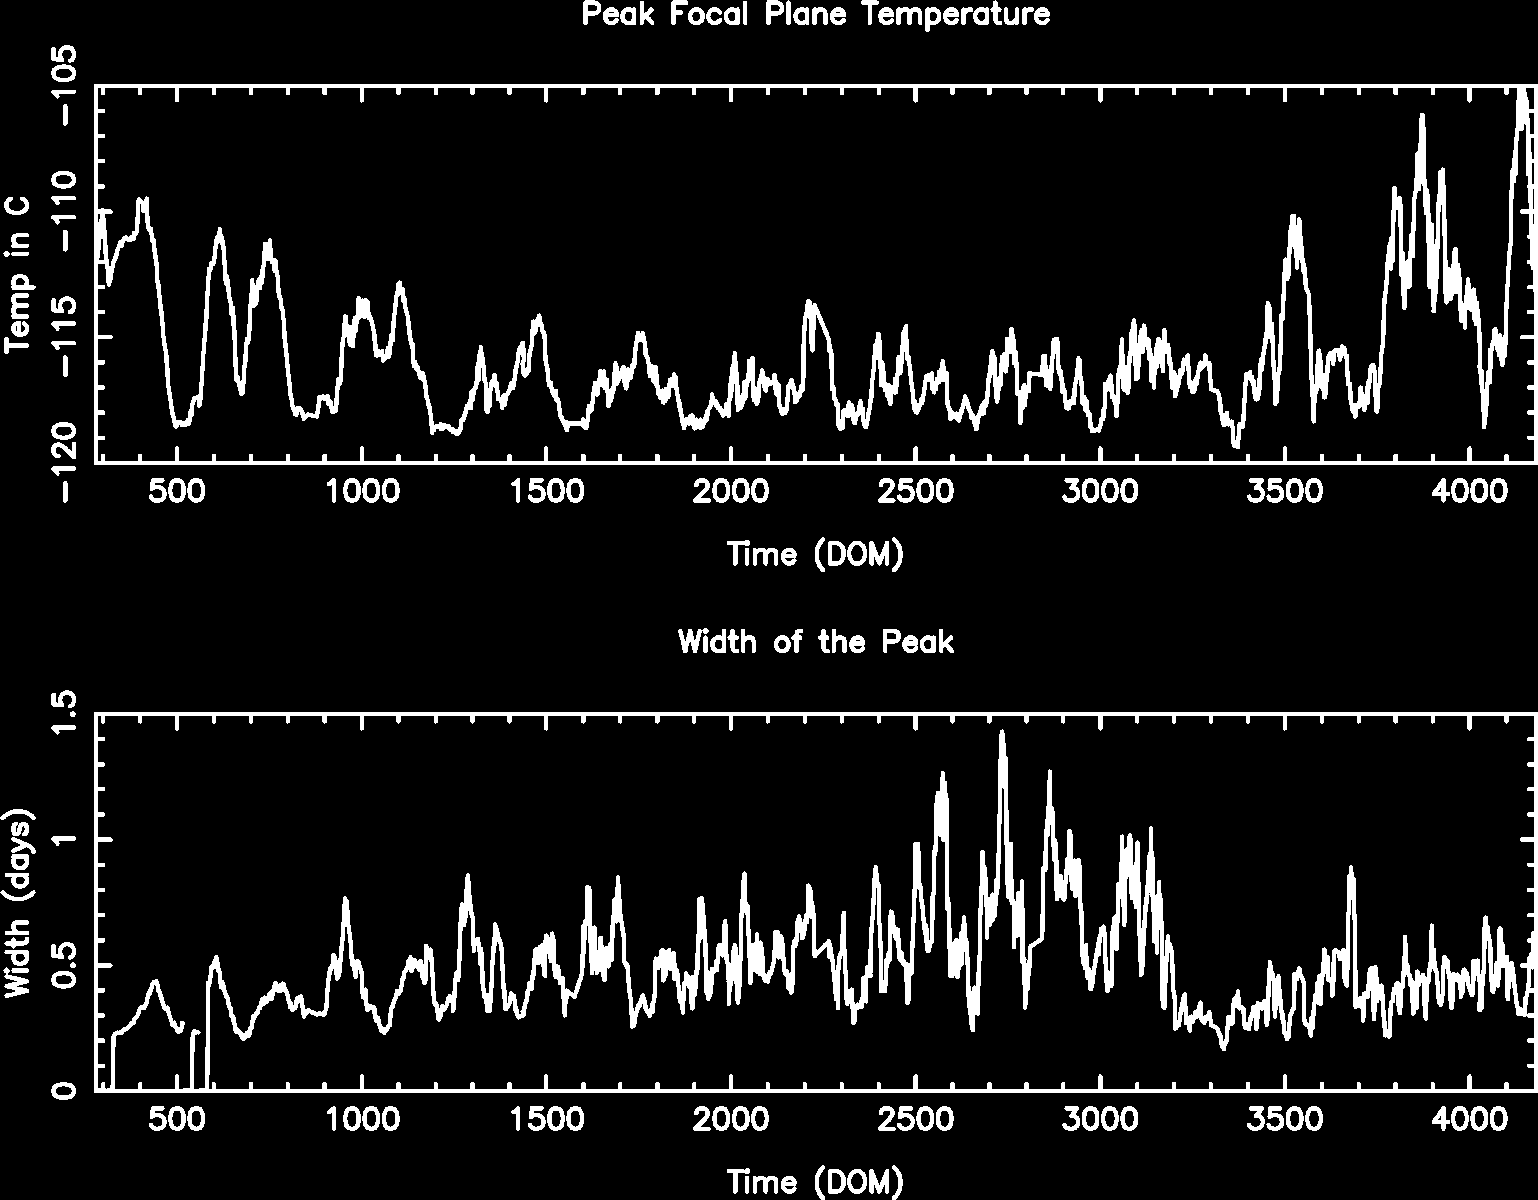
Focal Plane Temperature
Nov 2010 Focal Temperature
| The Mean (max) FPT: | |
|---|---|
| -111.98 | +/- 6.54 C |
| Mean Width: | |
| 0.57 | +/- 0.47 days |
Averaged Focal Plane Temperature
We are using 10 period moving averages to show trends of peak temperatures and peak widths. Note, the gaps in the width plot are due to missing/corrupted data.
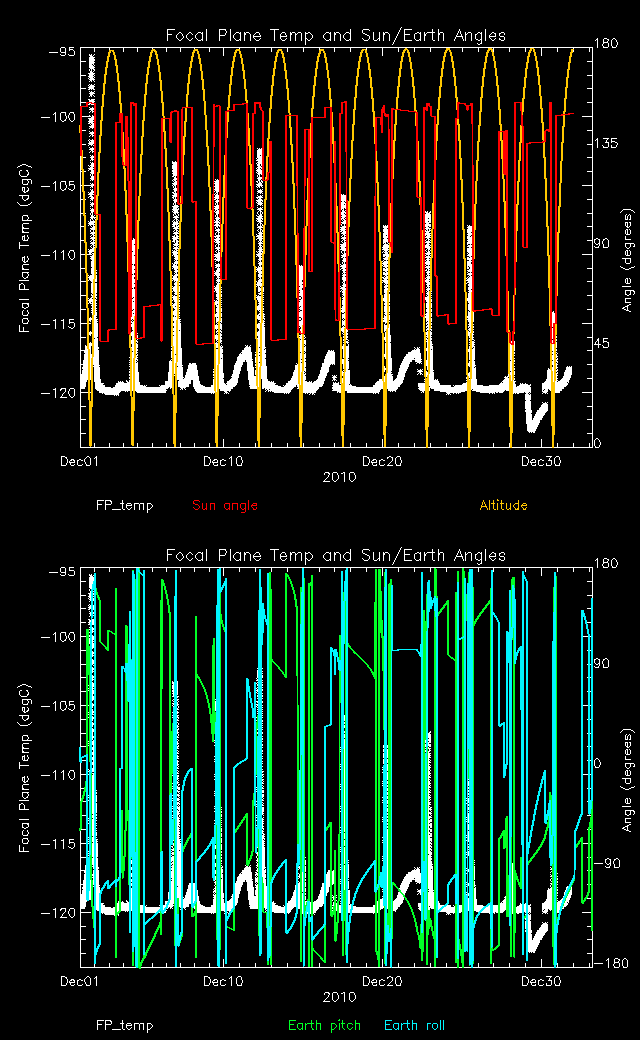
Focal Plane Temperature and Sun Angle, Earth Engle, and Altitude
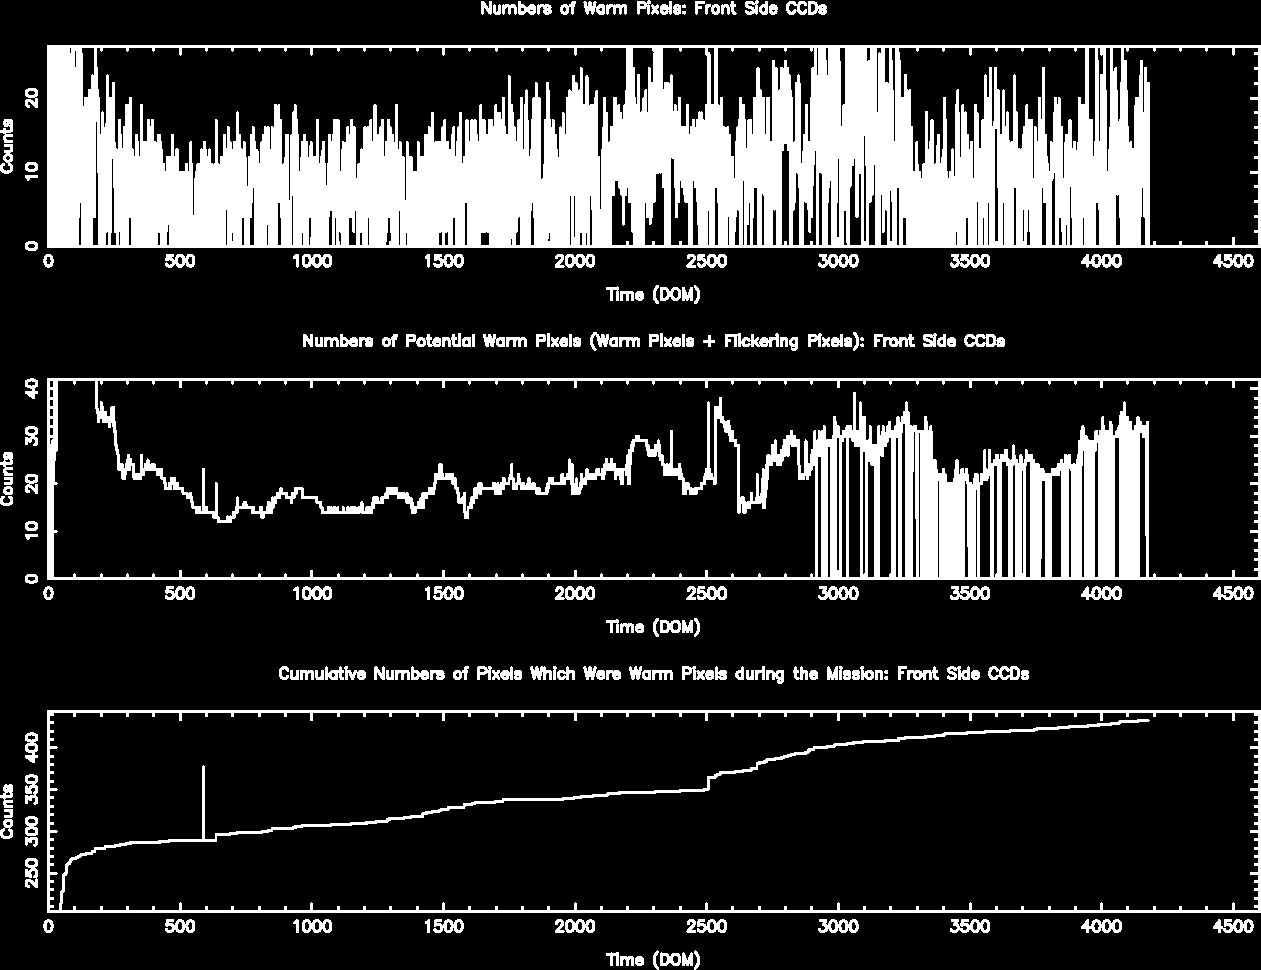
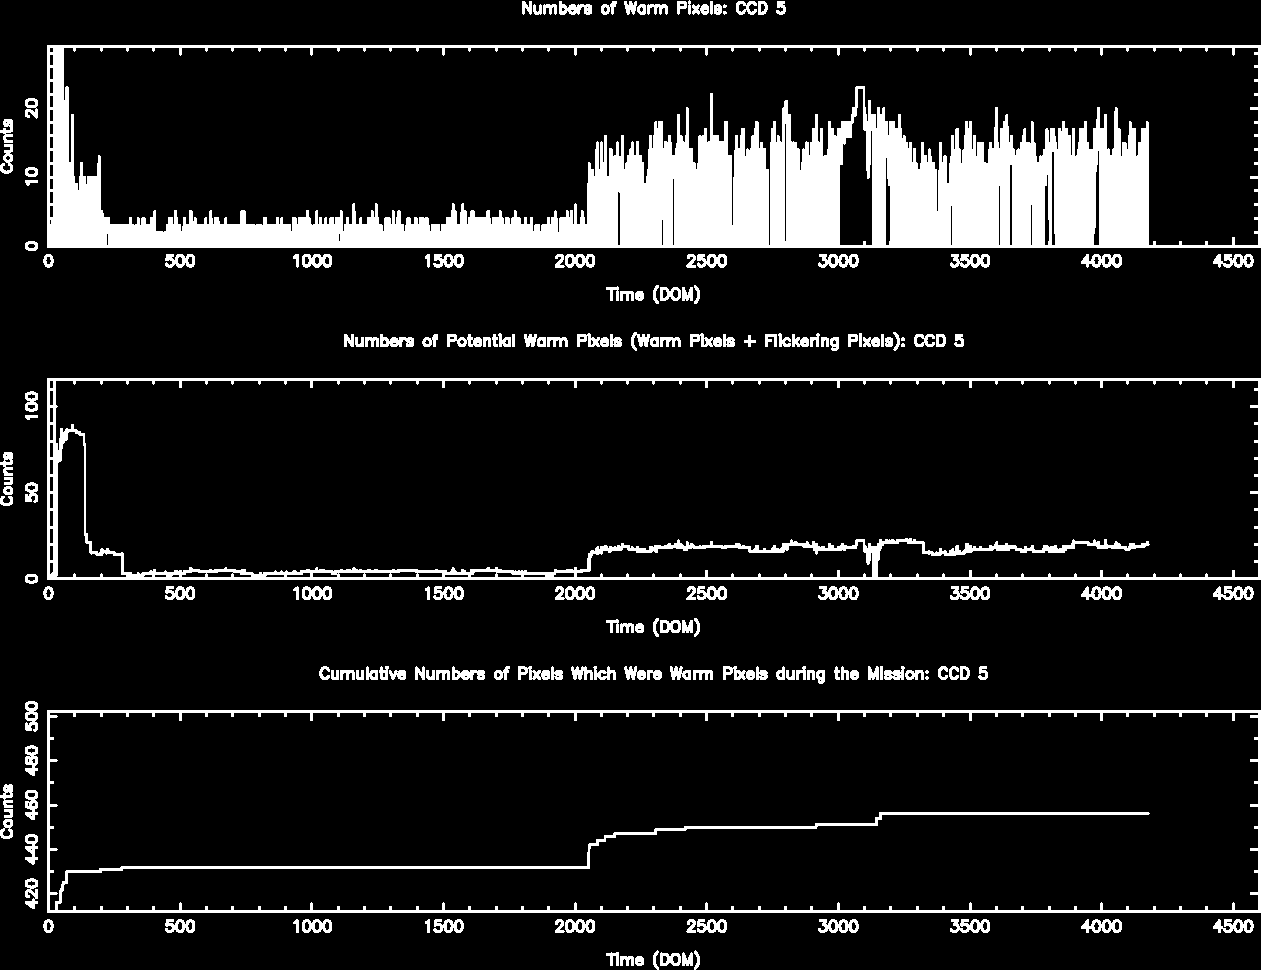
Bad Pixels
The plots below were generated with a new warm pixel finding script. Please see Acis Bad Pixel Page for details.
Front Side CCDs
Back Side CCD (CCD5)
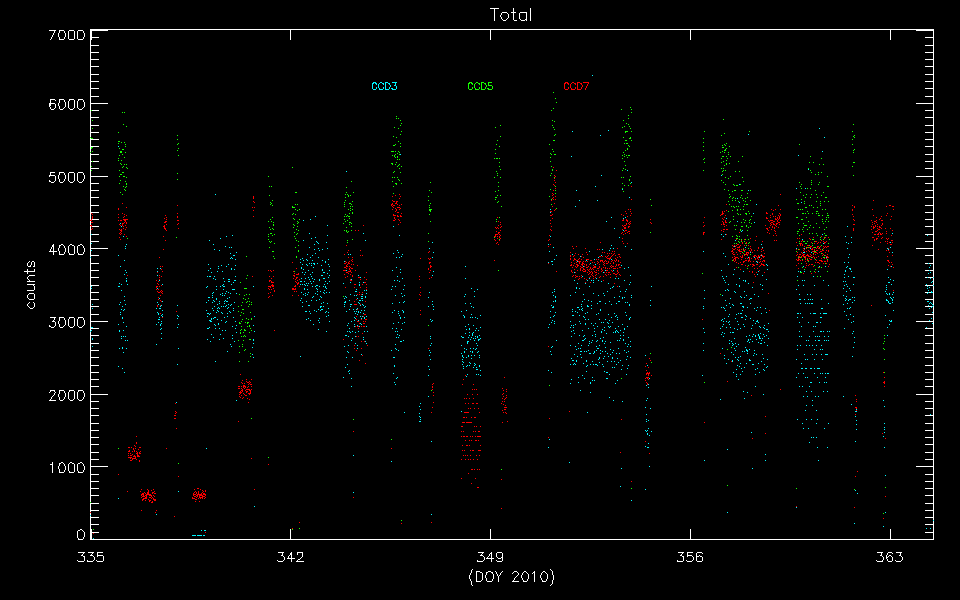
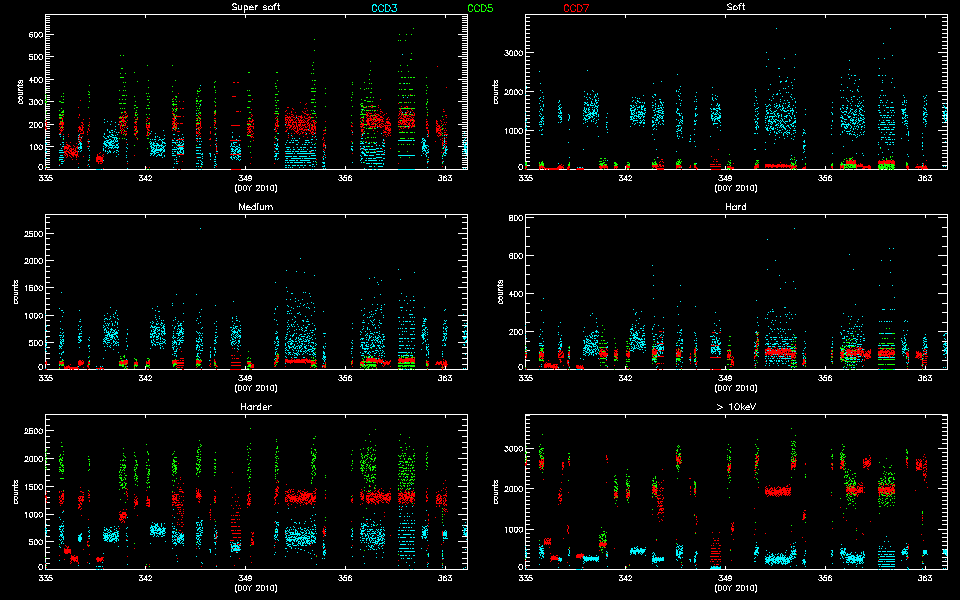
Science Instrument Background Rates
| Name | Low (keV) | High(KeV) | Description |
|---|---|---|---|
| SSoft | 0.00 | 0.50 | Super soft photons |
| Soft | 0.50 | 1.00 | Soft photons |
| Med | 1.00 | 3.00 | Moderate energy photons |
| Hard | 3.00 | 5.00 | Hard Photons |
| Harder | 5.00 | 10.00 | Very Hard photons |
| Hardest | 10.00 | Beyond 10 keV |
HRC
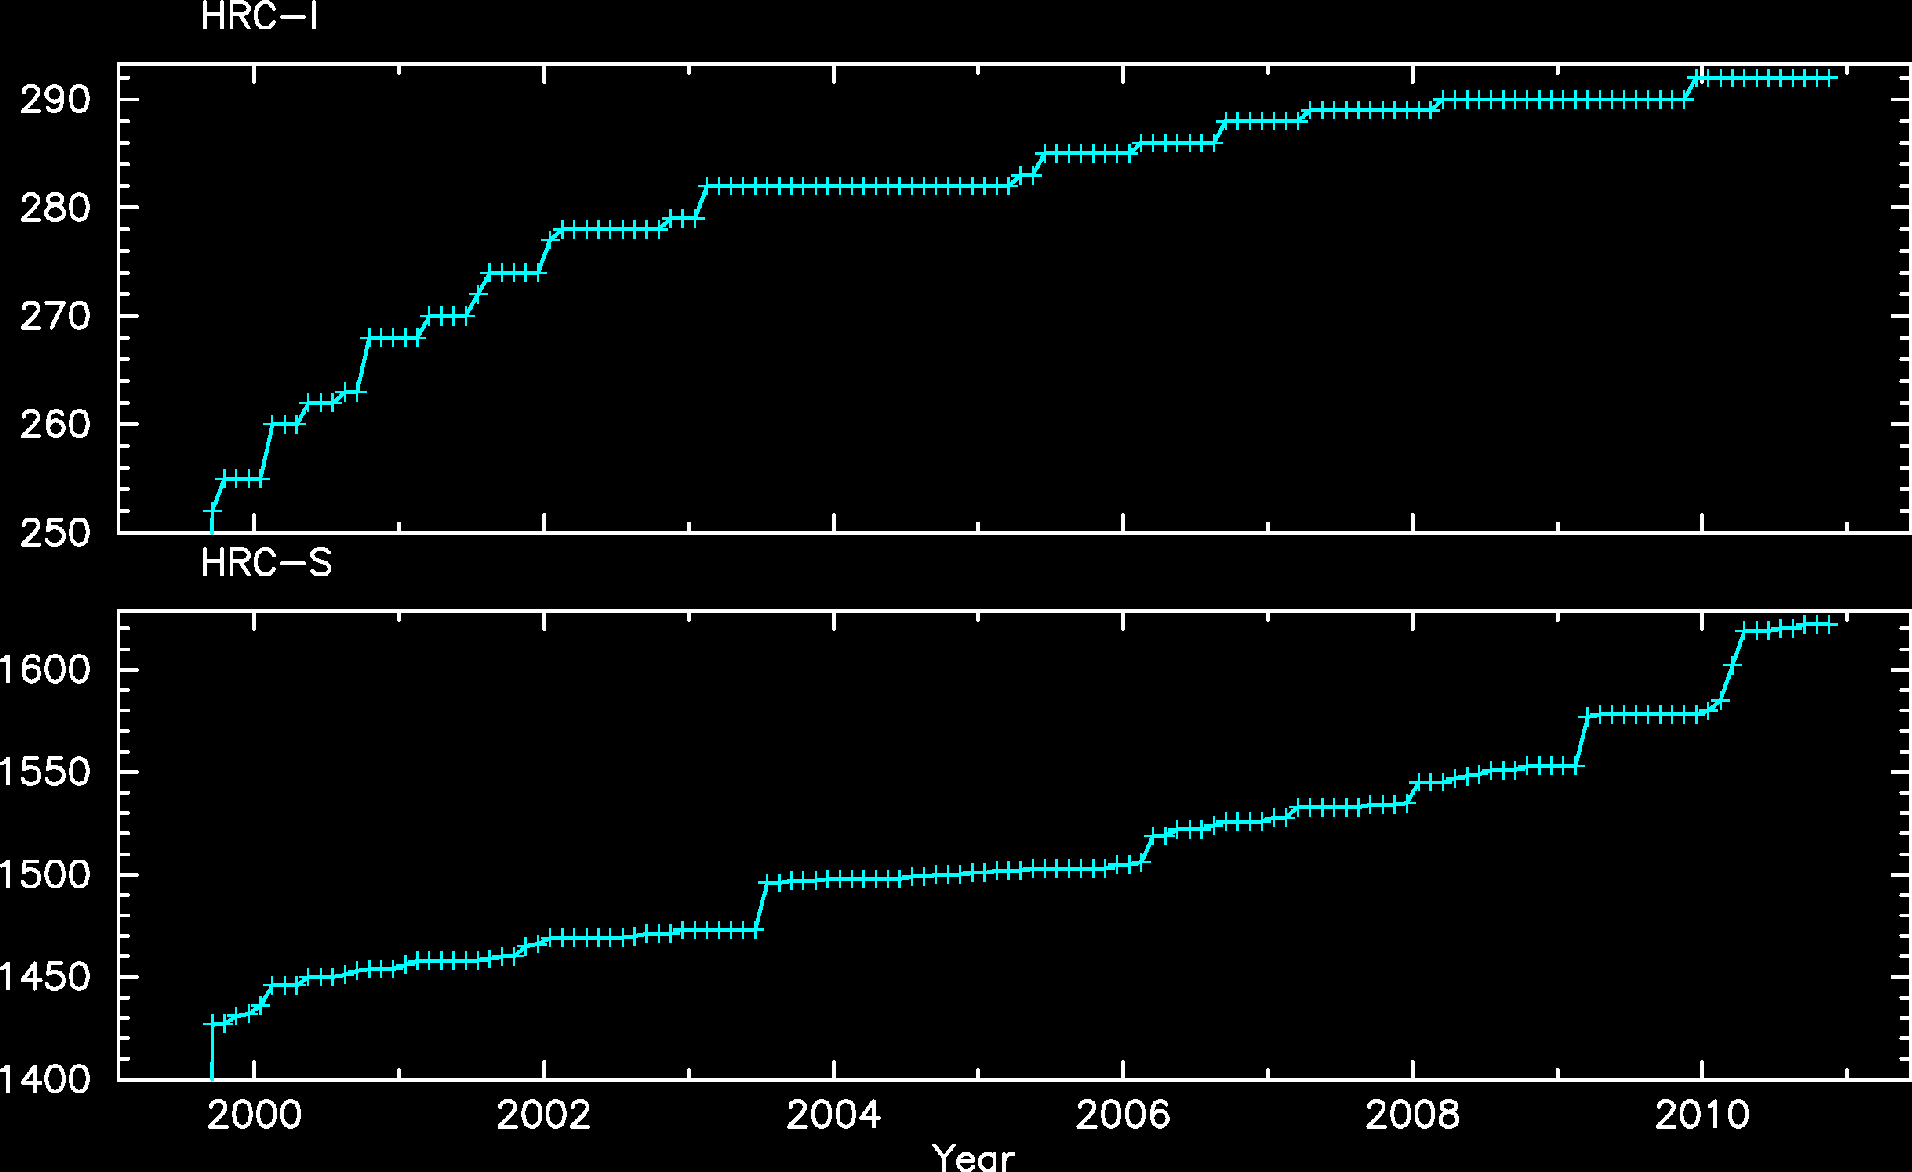
DOSE of Central 4K Pore-Pairs
Please refer to Maximum Dose Trends for more details.
)
        IMAGE                NPIX      MEAN    STDDEV      MIN       MAX
HRCI_12_2010.fits          16777216   0.050    0.265       0.0       22.0
)
        IMAGE                NPIX      MEAN    STDDEV      MIN       MAX
HRCI_08_1999_12_2010.fits  16777216   3.430    4.261       0.0       292.0
No Data-->
)
        IMAGE                NPIX     MEAN      STDDEV      MIN      MAX
HRCS_08_1999_12_2010.fits  16777216  13.340      22.281      0.0      1622.0
|
|
Max dose trend plots corrected for events that "pile-up"
in the center of the taps due to bad position information.
|
)
|
)
|
)
|
)
|
| Sep 2010 | Jun 2010 | Mar 2010 | Dec 2009 |
|---|
)
|
)
|
)
|
)
|
| Sep 2010 | Jun 2010 | Mar 2010 | Dec 2009 |
|---|
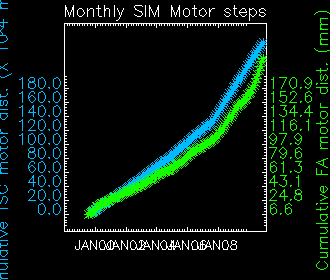
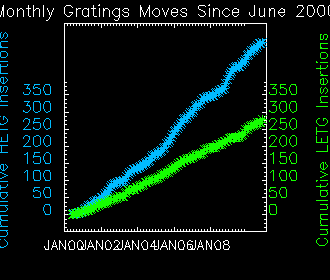
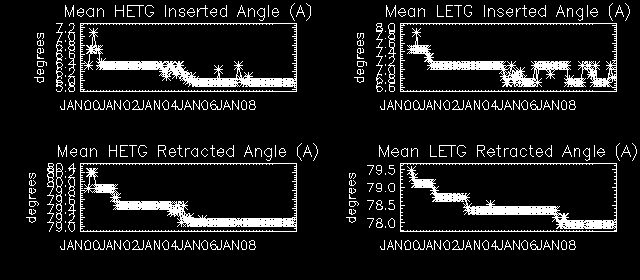
Gratings
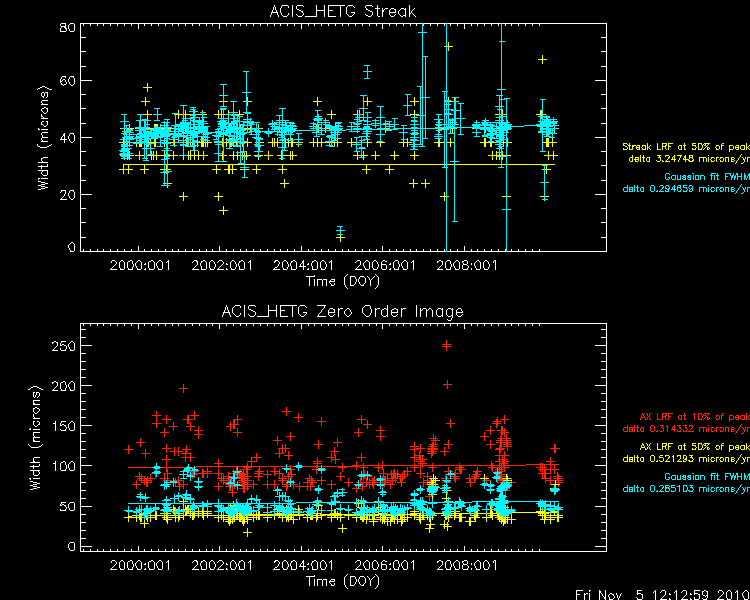
Focus
We plot the width of the zero order streak of ACIS/HETG observations and the width of the zero order image for HRC/LETG observations of point sources. No significant defocusing trend is seen at this time. See Gratings Focus pages. (NOTE: the figures are not updated from Mar 2009 due to a system problem.)
PCAD
ACA Trending
Fid Light Drift
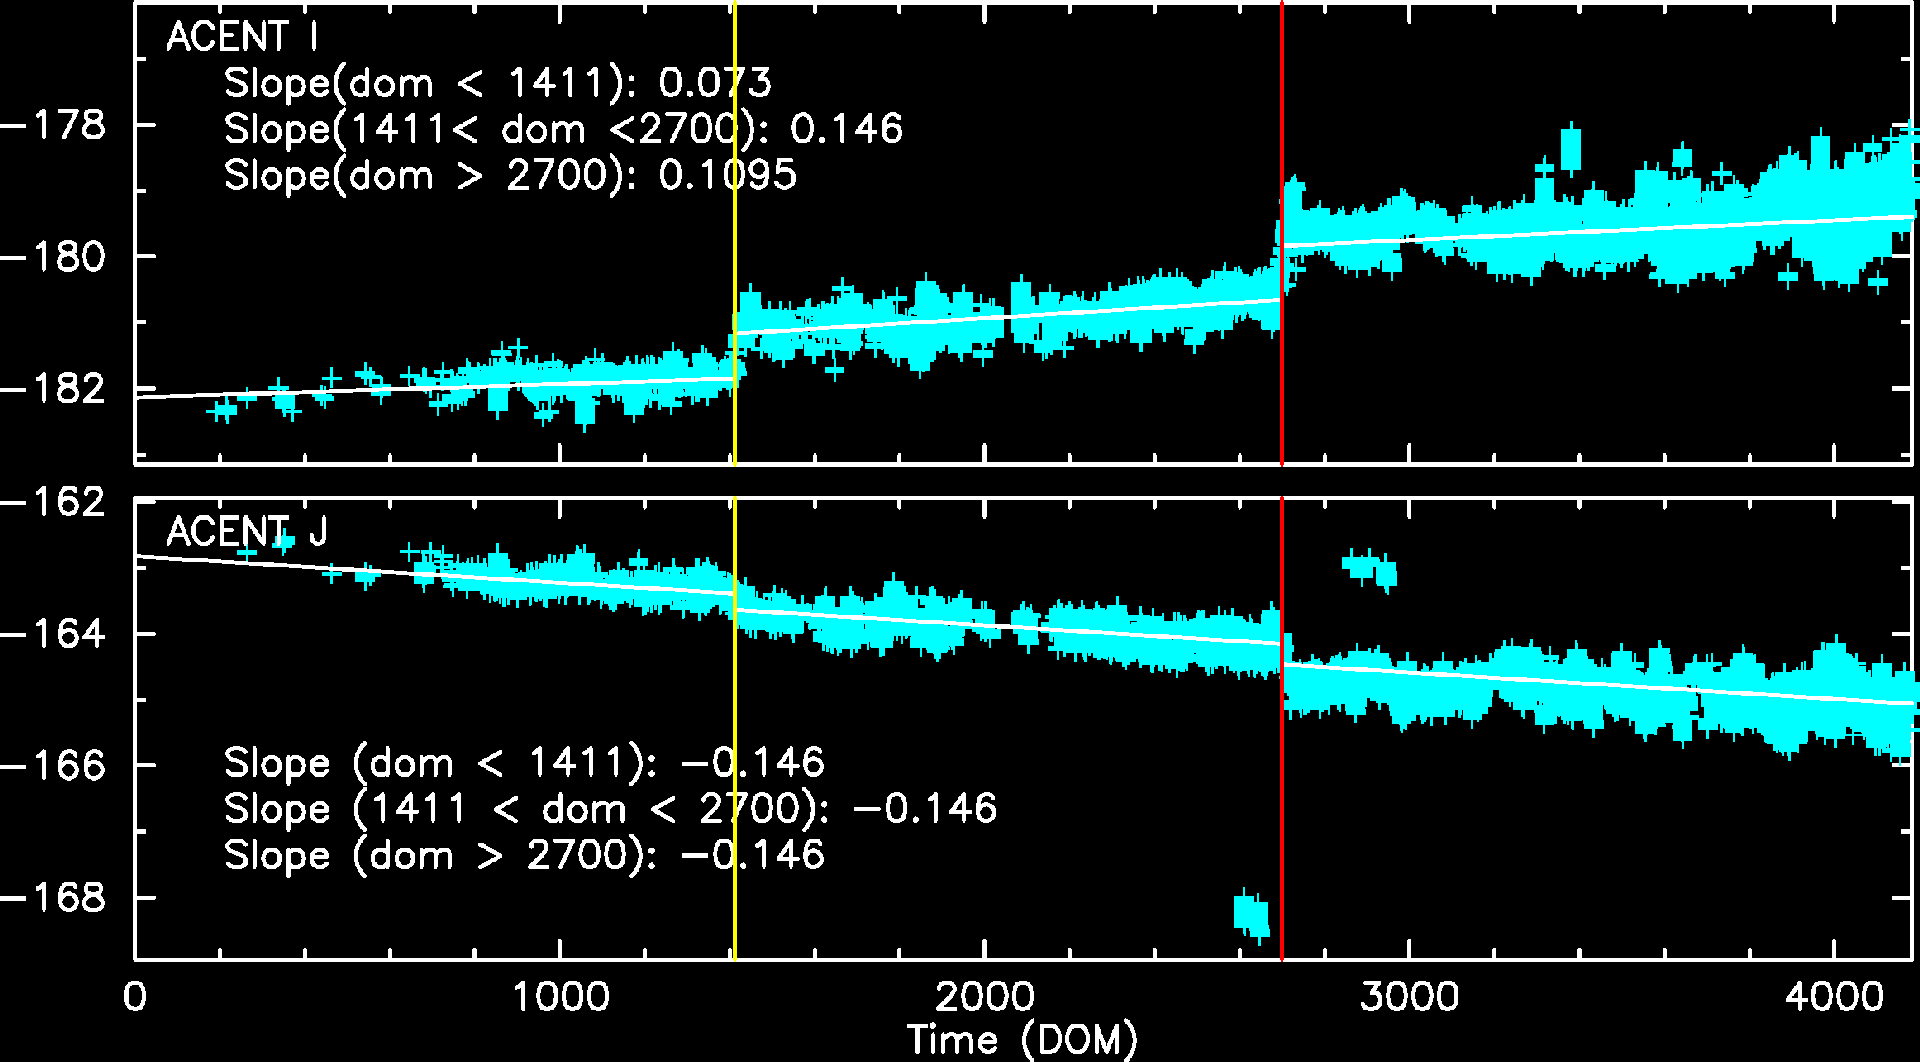
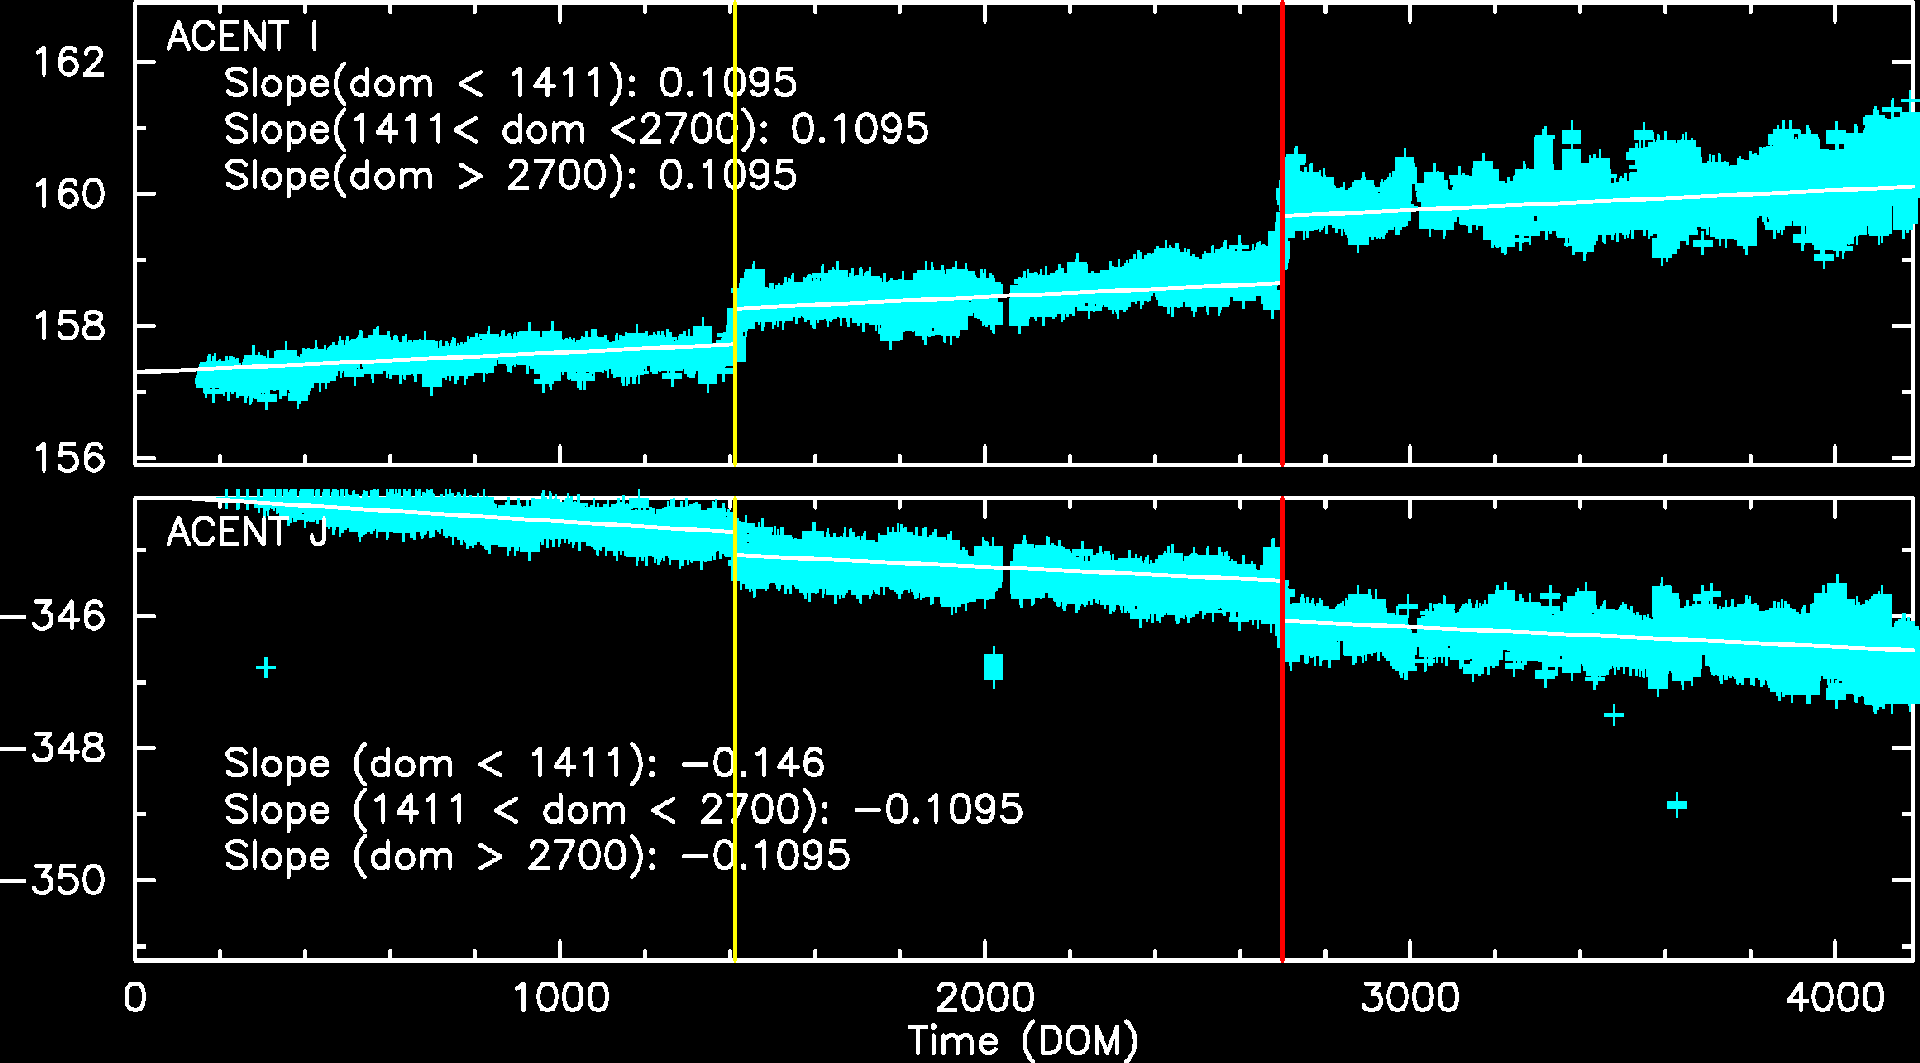
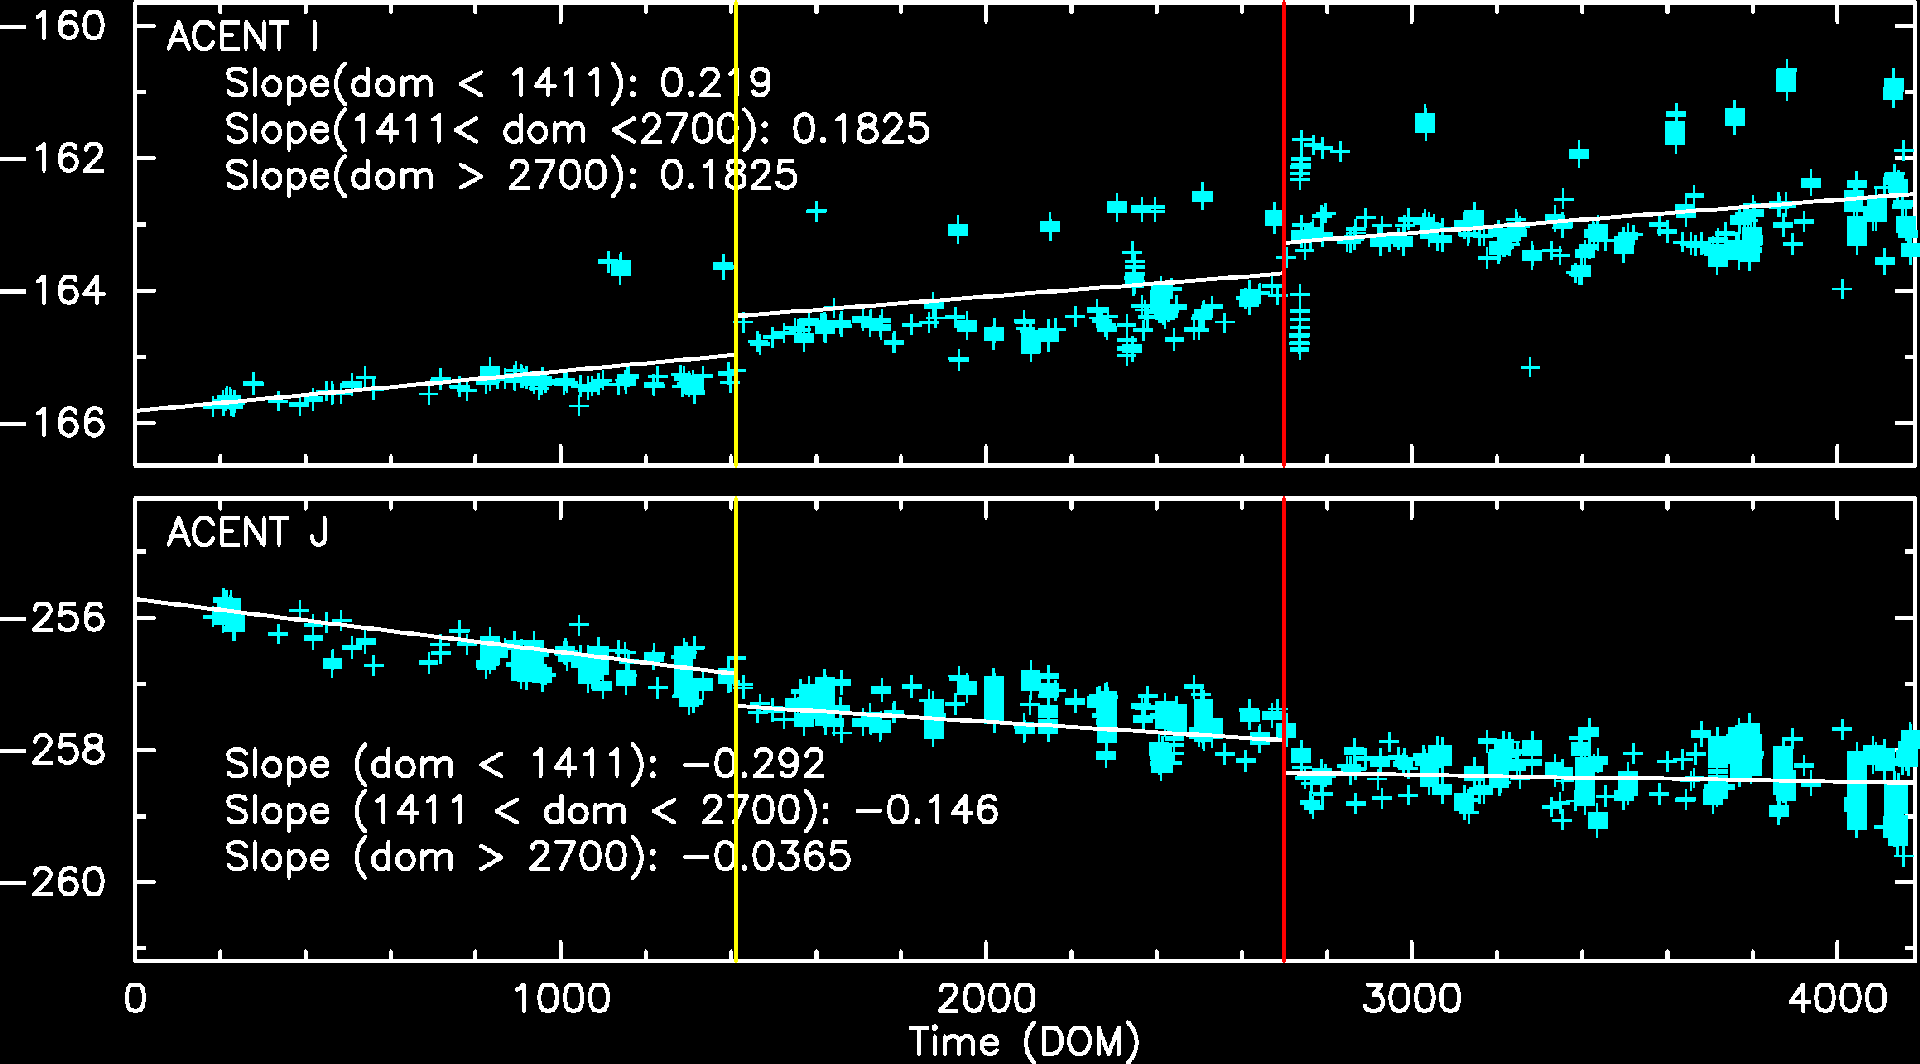
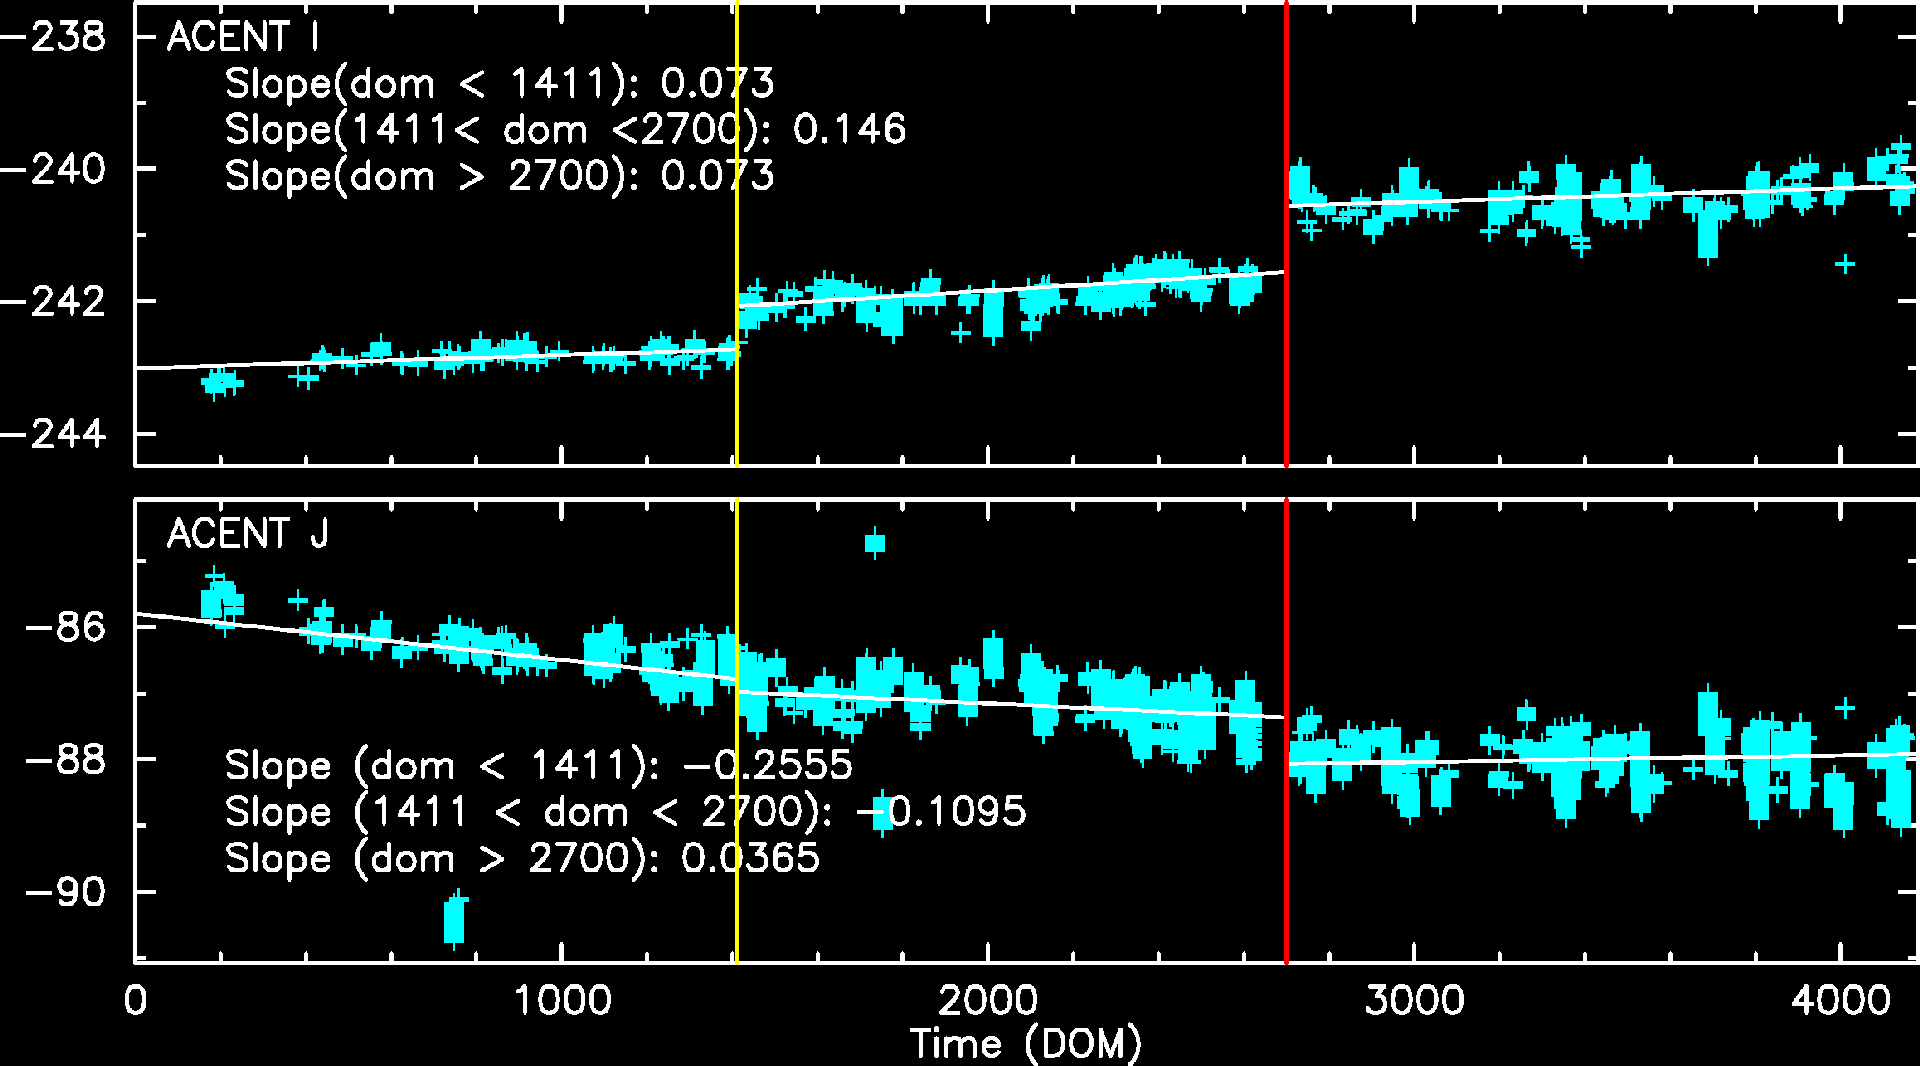
Fid light positions on ACA drift with time. The drift trends of Fid light 2 with ACIS-I and ACIS-S configurations are shown below.
The top panel shows Fid light 2 drift in ACENT I (app. along with -Y axis), and the
bottom panel shows that in ACENT J (app. along with Z axis). The unit is a pixel, and
one pixel is approximately 0.5 arcsec. The slope listed at the top right corner is
the change in a position per year (arcsec/yr). The vertical line on DOM = 1411 (Jun 1, 2003)
indicates a transition date of use of IRU-1 to IRU-2.
See also Tom Aldcroft's updated page:
https://cxc.cfa.harvard.edu/mta/ASPECT/fid_drift
Fid 2 (ACIS-I)
Fid 2 (ACIS-S)
Fid 8 (HRC-I)
Fid 12 (HRC-S)
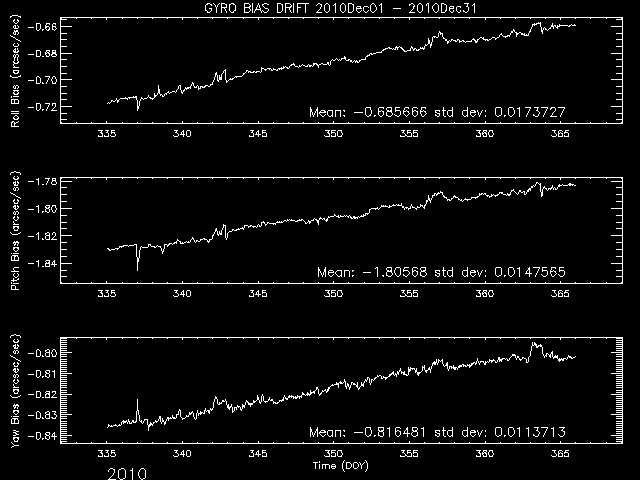
Gyro Bias Drift
Radiation History
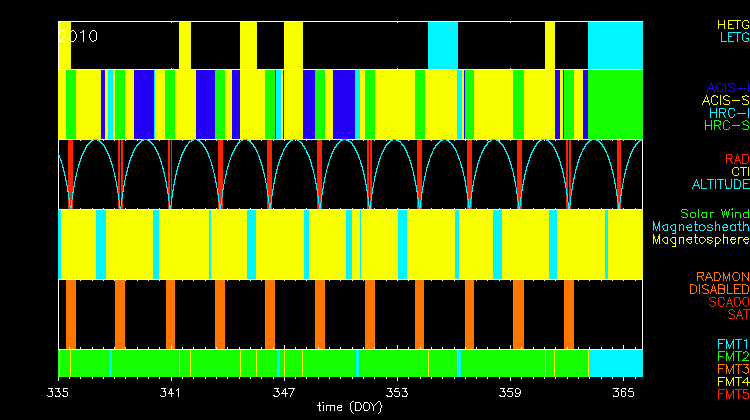
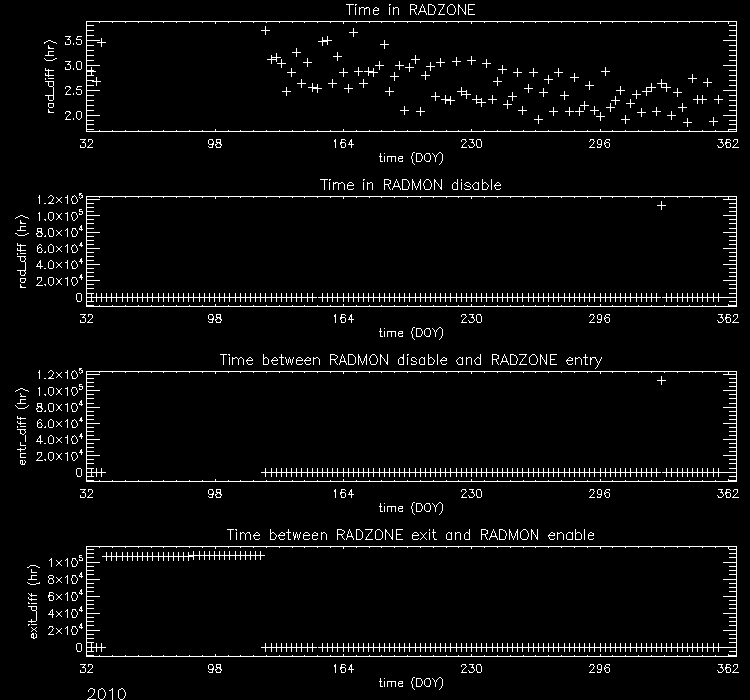
Radiation Zone Timing
Plotted below are radiation zone timing plots based on the following definitions of radiation zone:
- RADZONE - Ephin levels (in any of the E1300,P4GM,P41GM channels) are more than 1/3 of RADMON safing thresholds.
- RADMON - Radmon is disabled for radiation zone (as commanded based on OFLS model, for comparison with actual radiation levels).
- PERIGEE - Time of closest earth approach (for comparison)
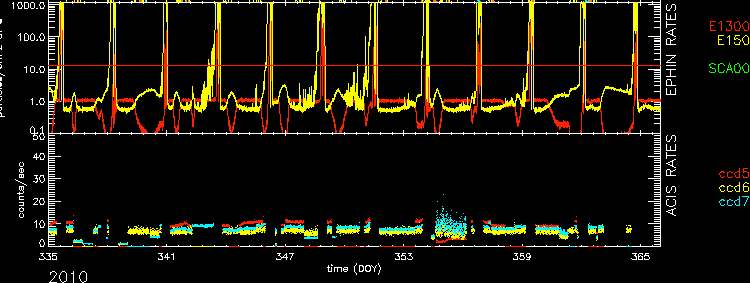
Radiation Count Rates of Dec 2010
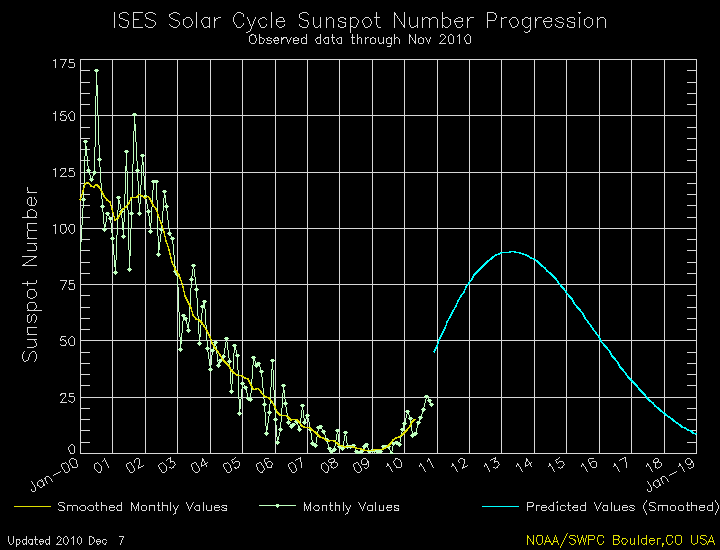
Sun Spot History
Trending
Critical Trends
| ACIS Temperatures - Daily Maximums | ||||||
|---|---|---|---|---|---|---|
| MSID | MEAN | RMS | DELTA/YR | DELTA/YR/YR | UNITS | DESCRIPTION |
| 1PDEAAT | 307.54 | 8.01 | -5.428e-01 | 1.455e+00 | K | PSMC DEA PS A TEMP |
| 1PIN1AT | 293.54 | 7.19 | -3.095e-01 | 1.510e+00 | K | PSMC TEMP 1A |
| HRMA Computed Averages - Daily Maximums | ||||||
| OBAAVG | 284.76 | 0.98 | 2.934e-01 | 4.399e-02 | K | OBA/TFTE TEMP |
| EPHIN Temperatures - Daily Maximums | ||||||
| TEIO | 313.55 | 17.92 | 2.178e+00 | 1.767e+00 | K | EPHIN ELECTRONICS HOUSING TEMP |
| TEPHIN | 310.15 | 7.86 | 2.653e+00 | -2.240e-01 | K | EPHIN SENSOR HOUSING TEMP |
| S/C Main Temperatures - Daily Maximums | ||||||
| TCYLFMZM | 297.94 | 23.49 | 9.003e-01 | -3.737e-01 | K | CNT CYL TEMP:-Z SIDE UNDER LAE-1 |
| TCYLFMZP | 300.52 | 22.38 | 8.248e-01 | -4.224e-01 | K | CNT CYL TEMP:-Z SIDE UNDER LAE-2 |
| S/C Ancillary Temperatures - Daily Maximums | ||||||
| TFSSBKT1 | 327.22 | 19.57 | 1.747e+00 | 4.025e-01 | K | FSS BRACKET-1 TEMP (+Y) |
| TFSSBKT2 | 323.21 | 24.08 | 1.359e+00 | 4.611e-01 | K | FSS BRACKET-2 TEMP (+Y) |
| TSCTSF1 | 289.90 | 4.00 | 9.917e-01 | -1.019e-01 | K | SC-TS FITTING -1 TEMP |
| TSCTSF6 | 289.65 | 4.50 | 1.144e+00 | -1.243e-01 | K | SC-TS FITTING -6 TEMP |
| MUPS - Daily Maximums | ||||||
| PM1THV1T | 330.71 | 9.47 | 1.563e+00 | -1.452e+00 | K | MUPS 1 THRUSTER VALVE 01 TEMP |
| PLINE02T | 309.18 | 10.74 | 1.771e+00 | 1.844e-01 | K | PROP LINE TEMP 02 |
| PLINE03T | 310.41 | 11.15 | 1.197e+00 | 6.756e-01 | K | PROP LINE TEMP 03 |
| PLINE04T | 298.47 | 10.17 | 3.193e-01 | 3.722e-01 | K | PROP LINE TEMP 04 |
)
)
)
)
)
)
)
)
)
)
)
)
)
)
)
Quarterly Trends
- ACIS Thermal
| Previous Quarter | ||||||
| MSID | MEAN | RMS | DELTA/YR | DELTA/YR/YR | UNITS | DESCRIPTION | 204.39 | 1.53 | 5.579e+00 | 4.215e+01 | K | CAMERA BODY TEMP. A |
| 1CBBT | 204.84 | 1.67 | 5.394e+00 | 1.401e+01 | K | CAMERA BODY TEMP. B |
| 1CRAT | 146.28 | 2.59 | 2.953e+00 | 1.433e+01 | K | COLD RADIATOR TEMP. A |
| 1CRBT | 146.73 | 2.84 | 3.623e+00 | 6.703e+00 | K | COLD RADIATOR TEMP. B |
| 1OAHBT | 238.44 | 1.11 | 3.640e+00 | 2.838e+01 | K | OPEN ACTUATOR HOUSING TEMP. B |
| 1PDEAAT | 308.49 | 8.83 | -5.429e+00 | 1.971e+02 | K | PSMC DEA PS A TEMP |
| 1PDEABT | 300.22 | 8.76 | -6.083e+00 | 1.501e+02 | K | PSMC DEA PS B TEMP |
| 1PIN1AT | 294.84 | 7.97 | -4.647e+00 | 1.032e+02 | K | PSMC TEMP 1A |
)
)
)
)
)
)
)
- ACIS Thermal
| Previous Quarter | ||||||
| MSID | MEAN | RMS | DELTA/YR | DELTA/YR/YR | UNITS | DESCRIPTION |
| 5EIOT | 348.19 | 17.22 | -2.821e+01 | -3.521e+02 | K | EIO TEMP |
| 5EPHINT | 319.22 | 3.80 | -1.486e-01 | -2.913e+01 | K | EPHIN TEMP |
| HKEBOXTEMP | 324.09 | 3.89 | -1.160e+00 | -3.829e+01 | K | EPHIN HOUSEKEEPING EBOX: TEMPERATURE (5EHSE300) |
| TEIO | 322.50 | 19.70 | -3.118e+01 | -4.080e+02 | K | EPHIN ELECTRONICS HOUSING TEMP |
| TEPHIN | 319.71 | 4.09 | -1.916e+00 | -4.193e+01 | K | EPHIN SENSOR HOUSING TEMP |
)
)
)
)
)
Spacecraft Motions
|
|
Reaction Wheel Rotations
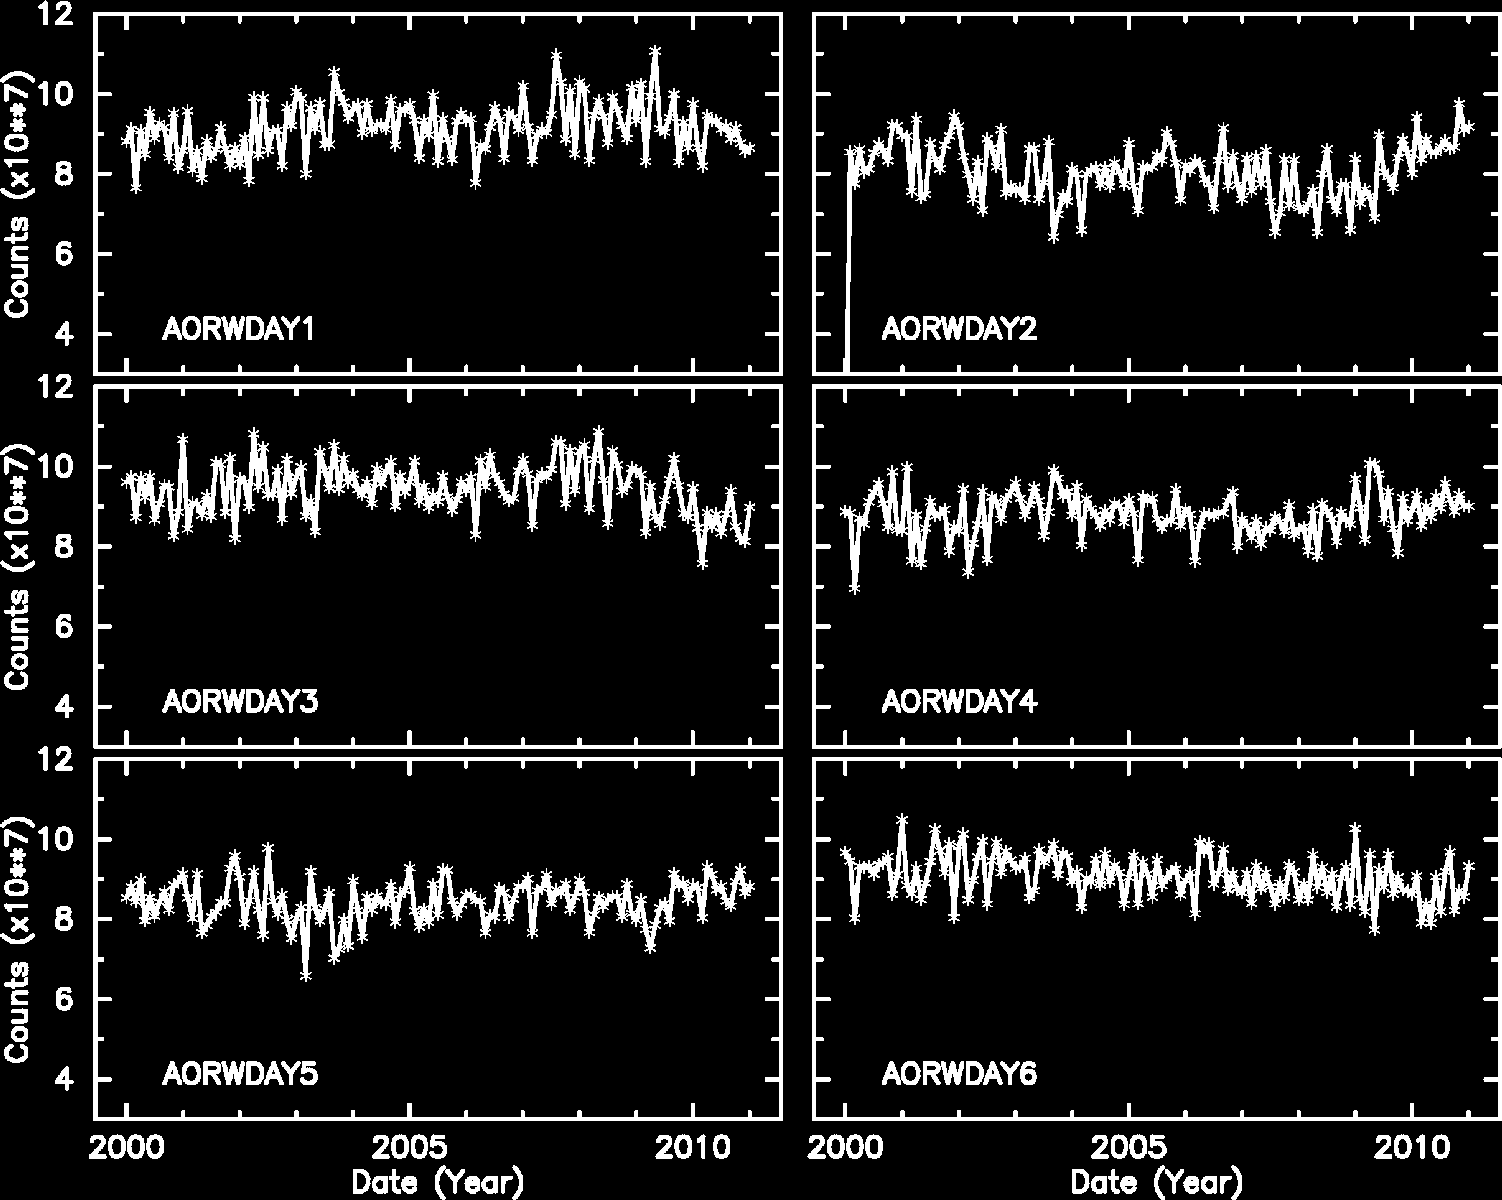
Note: From Feb 2010, the computation of reaction wheel rotations are slightly modified.
Links to Past Monthly Reports
| Year | Month | |||||||||||
|---|---|---|---|---|---|---|---|---|---|---|---|---|
| 1999 | Jul | Aug | Sep | Oct | Nov | Dec | ||||||
| 2000 | Jan | Feb | Mar | Apr | May | Jun | Jul | Aug | Sep | Oct | Nov | Dec |
| 2001 | Jan | Feb | Mar | Apr | May | Jun | Jul | Aug | Sep | Oct | Nov | Dec |
| 2002 | Jan | Feb | Mar | Apr | May | Jun | Jul | Aug | Sep | Oct | Nov | Dec |
| 2003 | Jan | Feb | Mar | Apr | May | Jun | Jul | Aug | Sep | Oct | Nov | Dec |
| 2004 | Jan | Feb | Mar | Apr | May | Jun | Jul | Aug | Sep | Oct | Nov | Dec |
| 2005 | Jan | Feb | Mar | Apr | May | Jun | Jul | Aug | Sep | Oct | Nov | Dec |
| 2006 | Jan | Feb | Mar | Apr | May | Jun | Jul | Aug | Sep | Oct | Nov | Dec |
| 2007 | Jan | Feb | Mar | Apr | May | Jun | Jul | Aug | Sep | Oct | Nov | Dec |
| 2008 | Jan | Feb | Mar | Apr | May | Jun | Jul | Aug | Sep | Oct | Nov | Dec |
| 2009 | Jan | Feb | Mar | Apr | May | Jun | Jul | Aug | Sep | Oct | Nov | Dec |
| 2010 | Jan | Feb | Mar | Apr | May | Jun | Jul | Aug | Sep | Oct | Nov | |