ACIS
ACIS DOSE Registered-Photon-Map
The steps we took to compute the dose map are;
- Level 1 Event files for a specified month are obtained from archive.
- Image data including I2, I3, S2, S3 CCDs are extracted from all event files.
- All the extracted image data were merged to create a month long exposure map for the month.
- The exposure map is opened with ds9, and check a distribution of count rates against energy. From this, estimate the upper threshold value. Any events beyond this upper threshold are assumed erroneous events such as bad pixels.
- Using this upper threshold, the data is filtered, and create a cleaned exposure map for the month.
- The exposure map from each month from the Sep 1999 is added up to create a cumulative exposure map for each month.
- Using fimgstatistic, we compute count rate statistics for each CCDs.
- For observations with high data drop rates (e.g., Crab nebula, Cas A), we corrected the observations by adding events.
-
Note: Counts and RMS's of Cumulative maps are lower than the previous months.
This is because we excluded extreme outliers.
Please check more detail plots at Telemetered Photon Dose Trend page.
)
)
)
Statistics:
# IMAGE     NPIX        MEAN           RMS              MIN     MAX
ACIS_oct11 6004901       7.894         11.395           0.0     425

 I2 node 0  262654      6.895180        3.114534        0.0      47.0
 I2 node 1  262654      7.320770        3.532735        0.0     380.0
 I2 node 2  262654      7.154179        3.181832        0.0      94.0
 I2 node 3  262654      7.140175        3.396952        0.0      44.0

 I3 node 0  262654      7.449316        3.313018        0.0      49.0
 I3 node 1  262654      7.979263        7.887600        0.0     237.0
 I3 node 2  262654      7.302114        3.195634        0.0      59.0
 I3 node 3  262654      7.289478        3.222681        0.0     124.0

 S2 node 0  262654      9.345868        3.796007        0.0     116.0
 S2 node 1  262654      10.428027       4.976732        0.0      69.0
 S2 node 2  262654      13.819167       7.478376        0.0     109.0
 S2 node 3  262654      14.610597       8.156037        0.0     391.0

 S3 node 0  262654      17.903872       23.686277       0.0     378.0
 S3 node 1  262654      12.415254       7.795138        0.0      88.0
 S3 node 2  262654      14.724889       9.009694        0.0      80.0
 S3 node 3  262654      13.698946       8.940118        0.0      71.0
)
)
)
Statistics:
 IMAGE        NPIX      MEAN             RMS            MIN    MAX
ACIS_total  6004901    1549.10          2079.07        0.0    93504

 I2 node 0  262654      1278.730652     246.808743      0.0     6408.0
 I2 node 1  262654      1349.860600     331.192591      0.0     26908.0
 I2 node 2  262654      1384.236248     299.903879      0.0     8872.0
 I2 node 3  262654      1379.714309     352.386814      0.0     27670.0

 I3 node 0  262654      1446.197052     352.783841      0.0     6462.0
 I3 node 1  262654      1517.438377     1144.684906     0.0     29447.0
 I3 node 2  262654      1318.949792     239.332489      0.0     6279.0
 I3 node 3  262654      1305.025913     255.001541      0.0     23368.0

 S2 node 0  262654      1855.448966     257.567570      963.0   20133.0
 S2 node 1  262654      1973.382263     424.633022      999.0   10859.0
 S2 node 2  262654      2189.052194     413.254996      1286.0  15676.0
 S2 node 3  262654      2115.440430     302.739713      1240.0  33297.0

 S3 node 0  262654      3205.528110     1629.508295     1325.0  12999.0
 S3 node 1  262654      4400.778890     1945.360123     0.0     13472.0
 S3 node 2  262654      3334.059149     903.490613      1252.0  8333.0
 S3 node 3  262654      2566.435831     414.687744      1423.0  9384.0
)
|
)
|
)
|
)
|
| Jul 2011 | Apr 2011 | Jan 2011 | Oct 2010 |
|---|
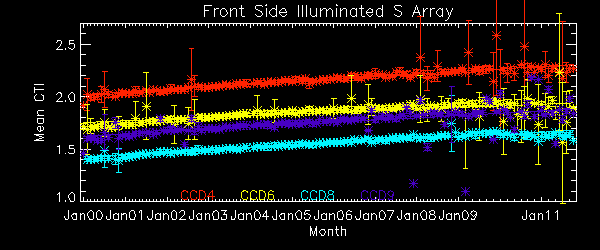
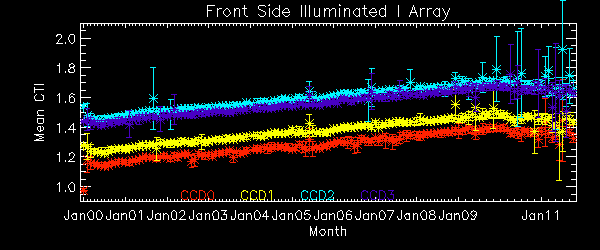
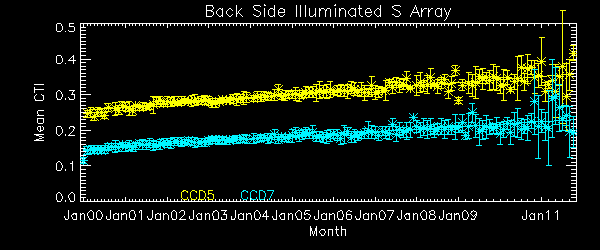
The Mean Detrended CTI
We report CTIs with a refined data definition. CTIs were computed for the temperature dependency corrected data. Please see CTI page for detailed explanation. CTI's are computed for Mn K alpha, and defined as slope/intercept x10^4 of row # vs ADU. Data file: here
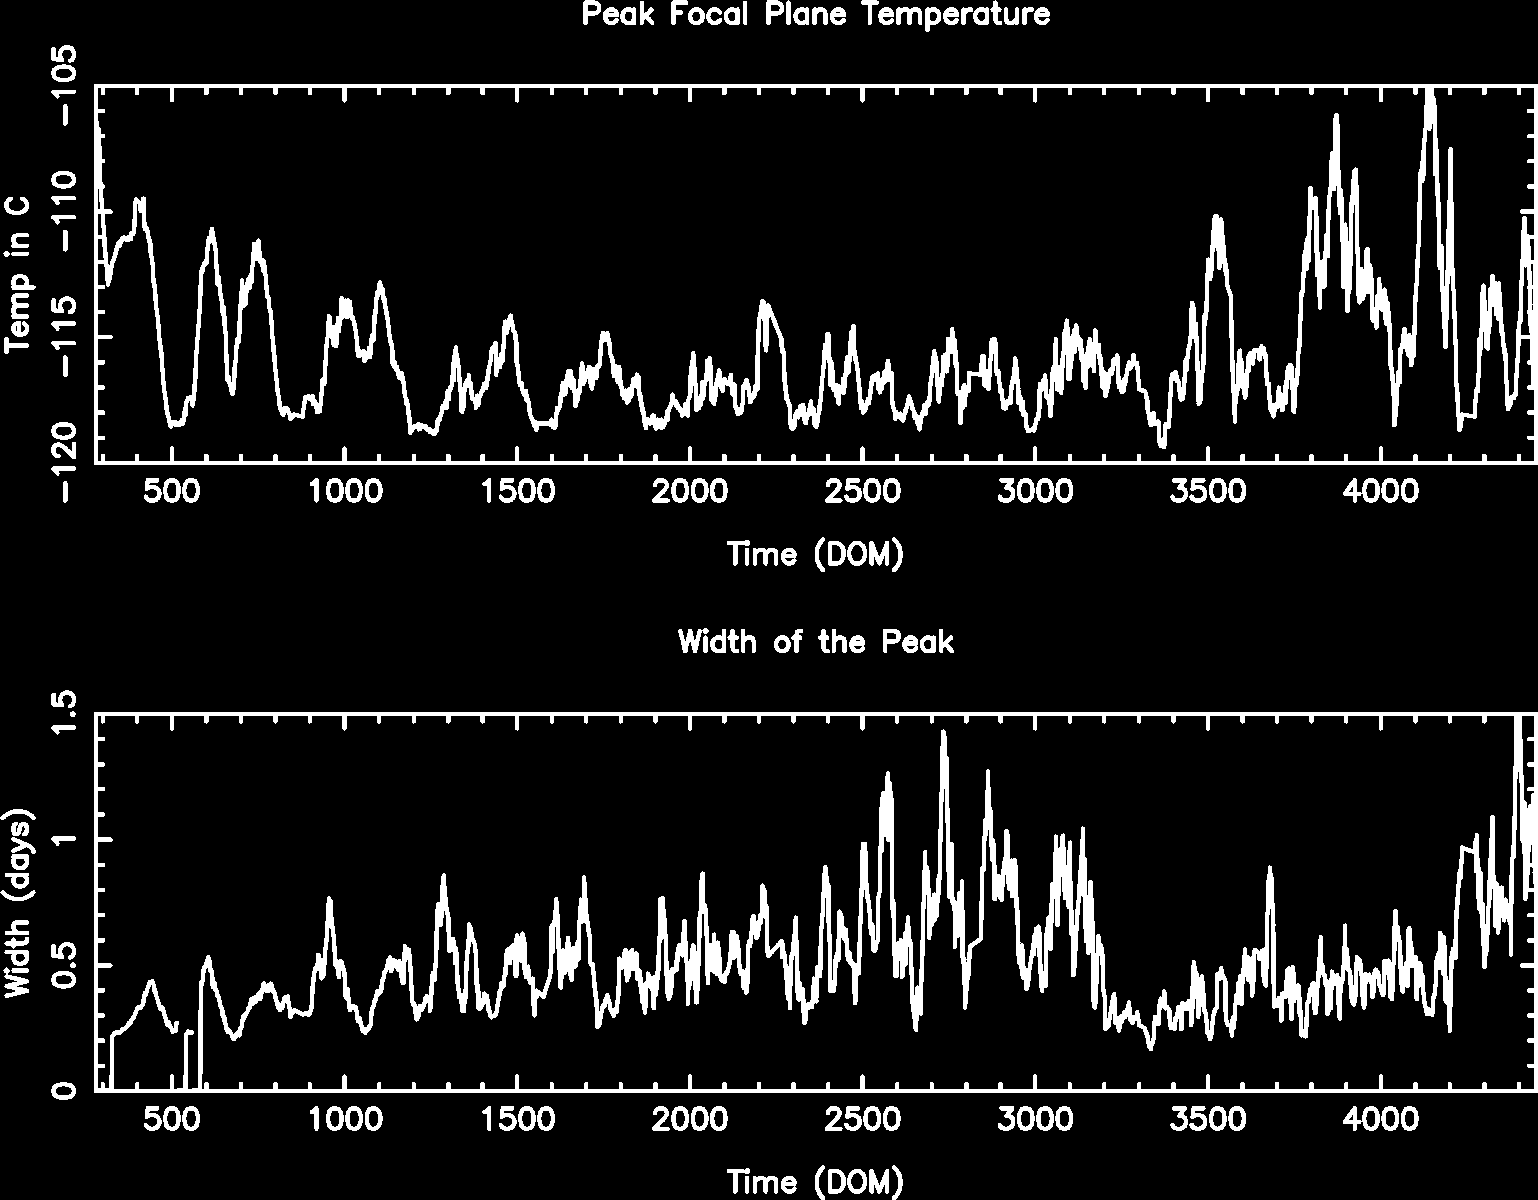
Focal Plane Temperature
Sep 2011 Focal Temperature
| The Mean (max) FPT: | |
|---|---|
| -109.09 | +/- 7.04 C |
| Mean Width: | |
| 0.80 | +/- 0.72 days |
Averaged Focal Plane Temperature
We are using 10 period moving averages to show trends of peak temperatures and peak widths. Note, the gaps in the width plot are due to missing/corrupted data.
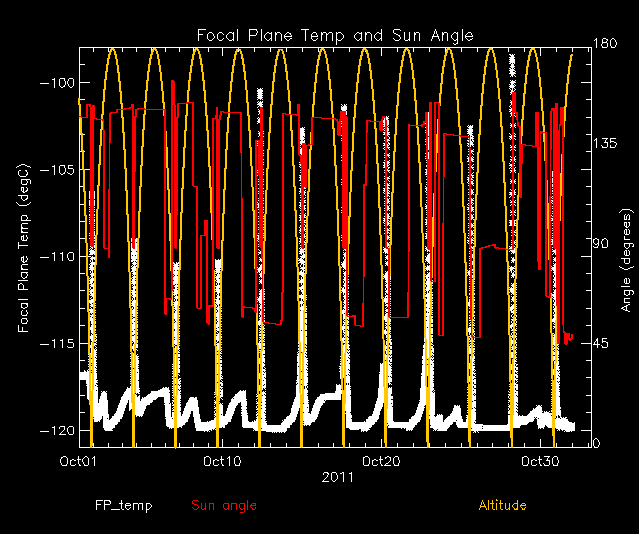
Focal Plane Temperature, Sun Angle and Altitude
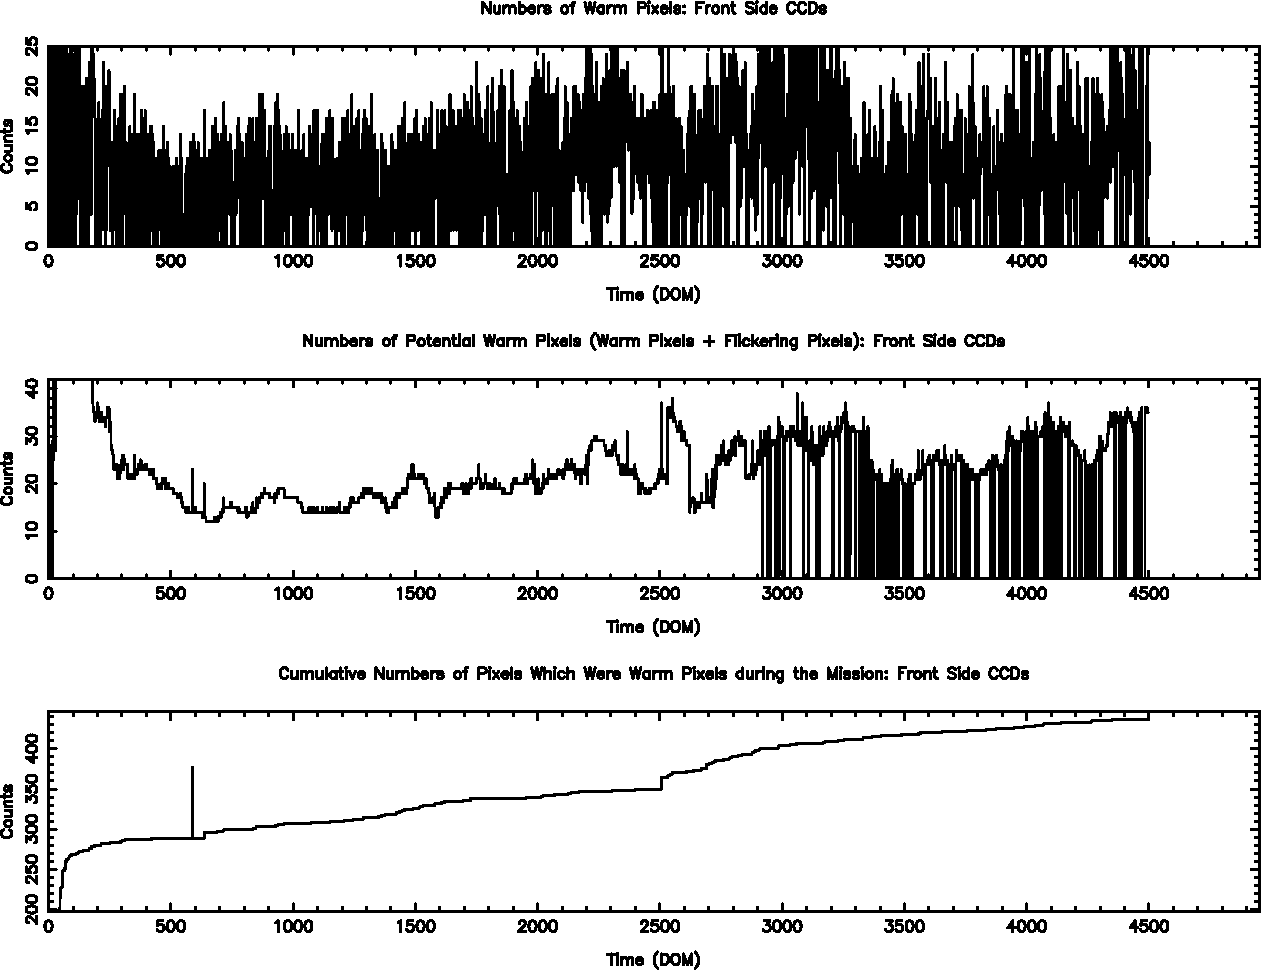
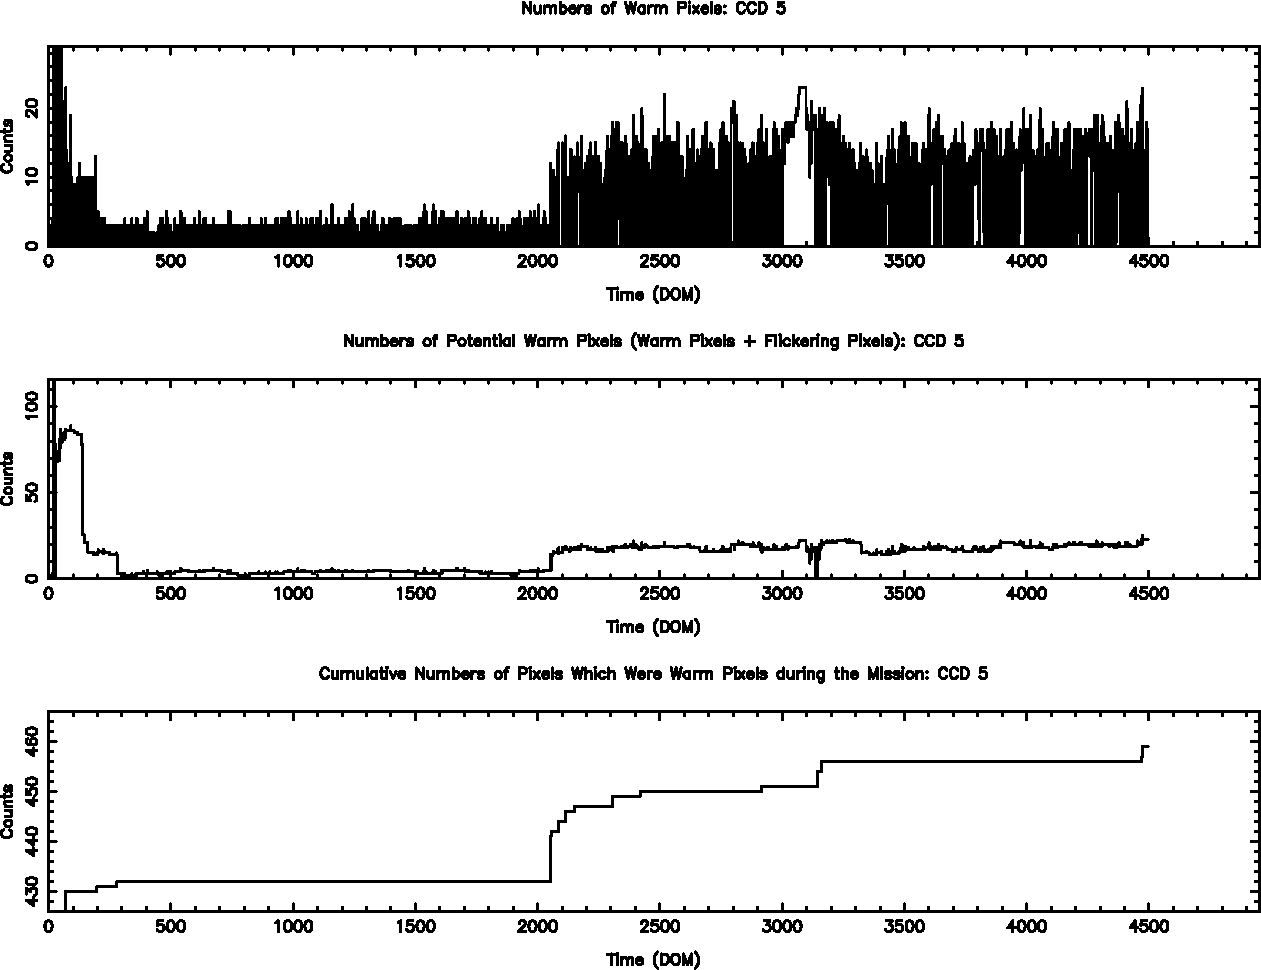
Bad Pixels
The plots below were generated with a new warm pixel finding script. Please see Acis Bad Pixel Page for details.
Front Side CCDs
Back Side CCD (CCD5)
### -->
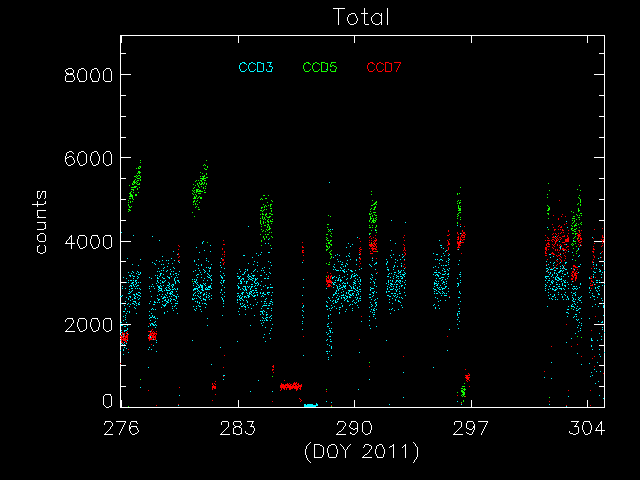
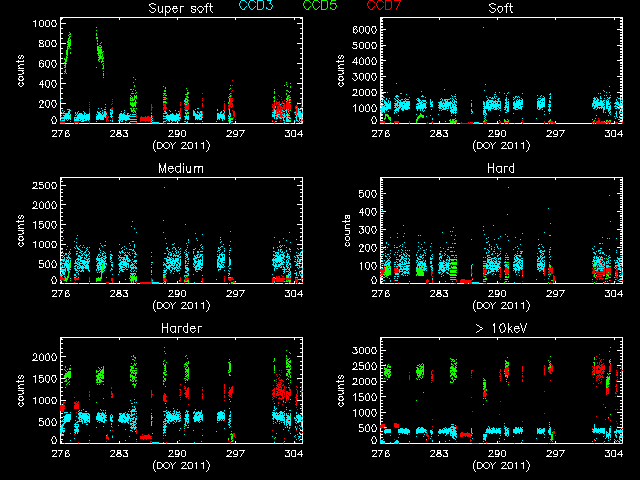
Science Instrument Background Rates
| Name | Low (keV) | High(KeV) | Description |
|---|---|---|---|
| SSoft | 0.00 | 0.50 | Super soft photons |
| Soft | 0.50 | 1.00 | Soft photons |
| Med | 1.00 | 3.00 | Moderate energy photons |
| Hard | 3.00 | 5.00 | Hard Photons |
| Harder | 5.00 | 10.00 | Very Hard photons |
| Hardest | 10.00 | Beyond 10 keV |
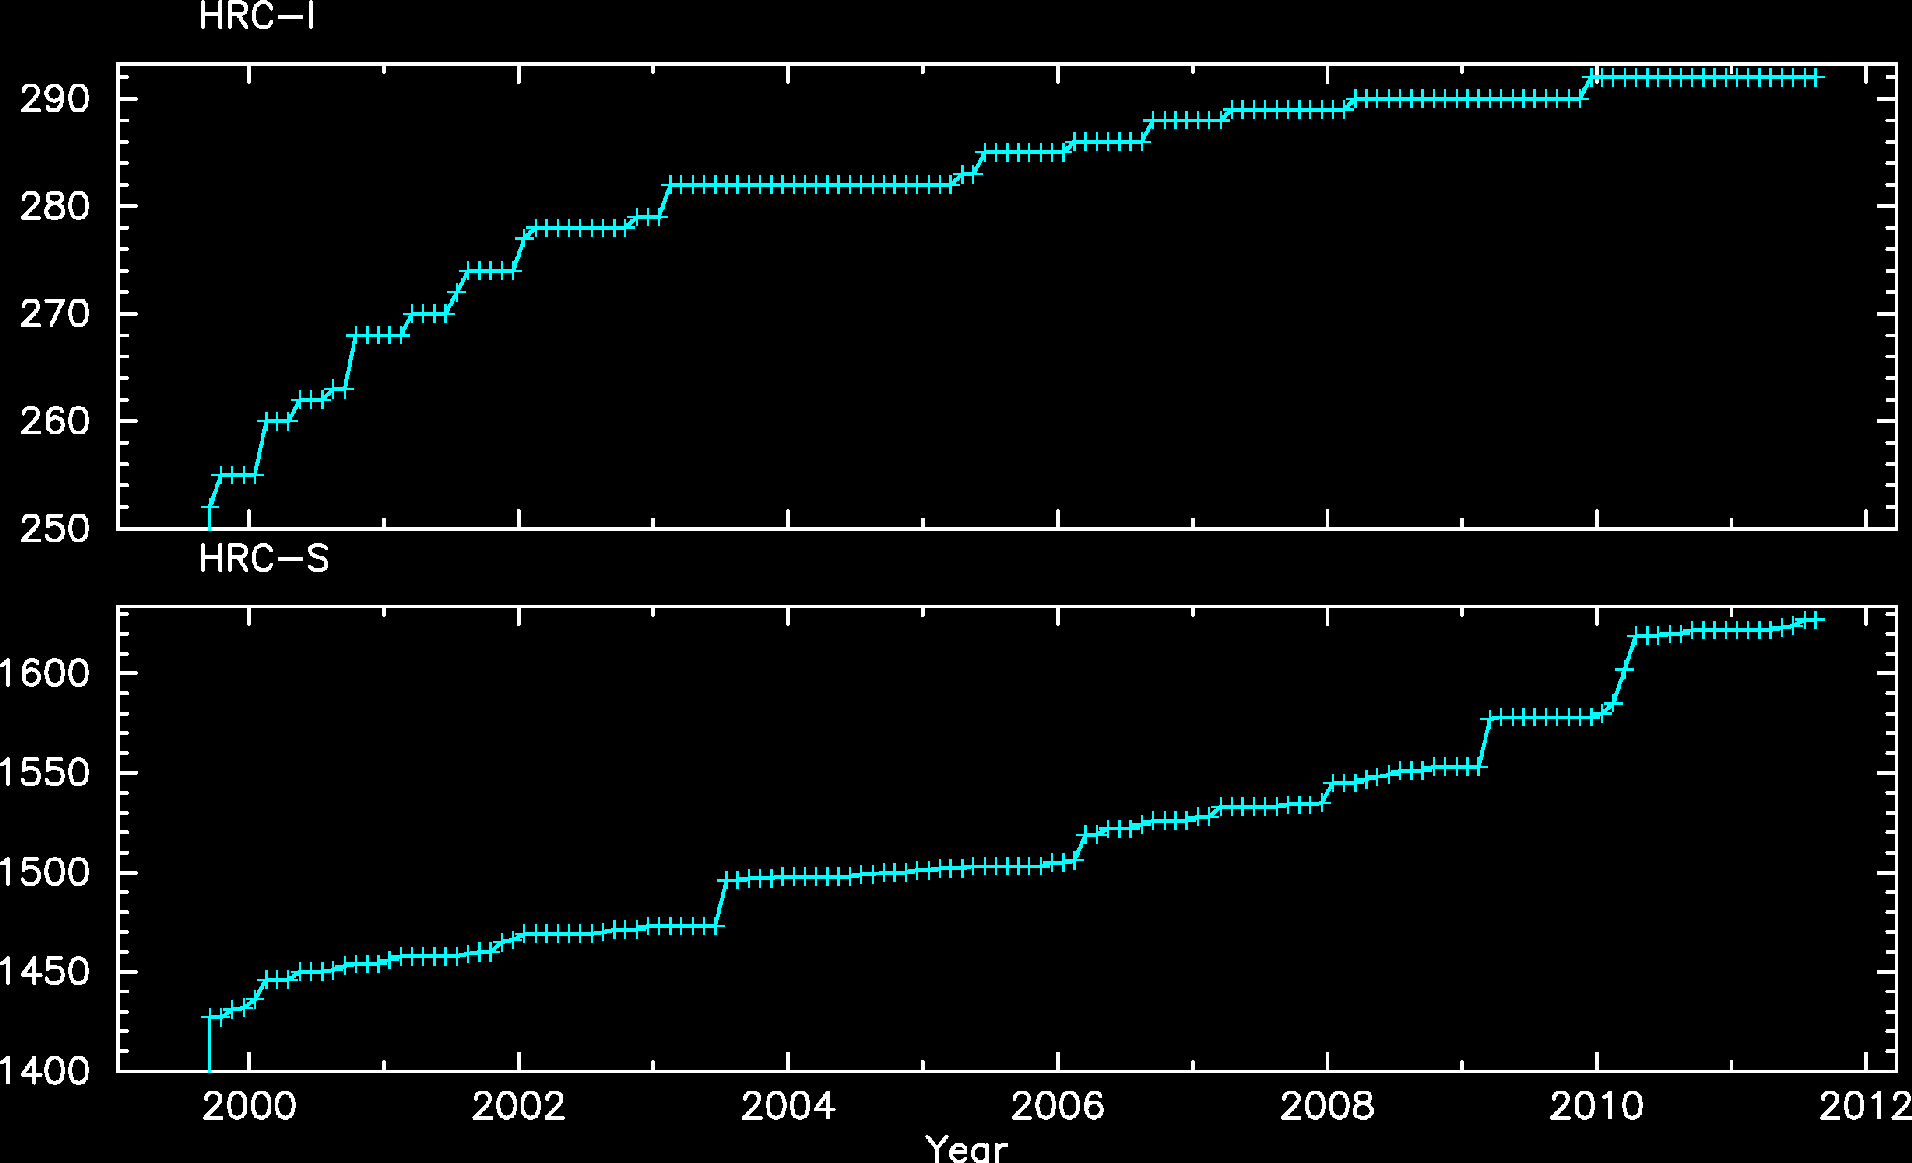
HRC
DOSE of Central 4K Pore-Pairs
Please refer to Maximum Dose Trends for more details.
)
        IMAGE                NPIX      MEAN    STDDEV      MIN       MAX
HRCI_10_2011.fits          16777216   0.002    0.044       0.0       2.0
)
        IMAGE                NPIX      MEAN    STDDEV      MIN       MAX
HRCI_08_1999_10_2011.fits  16777216   3.565    4.392       0.0       292.0
)
        IMAGE                NPIX      MEAN    STDDEV      MIN       MAX
HRCS_10_2011.fits          16777216   0.003    0.055       0.0       3.0
)
        IMAGE                NPIX     MEAN      STDDEV      MIN      MAX
HRCS_08_1999_10_2011.fits  16777216  13.766      22.906      0.0      1627.0
|
|
Max dose trend plots corrected for events that "pile-up"
in the center of the taps due to bad position information.
|
)
|
)
|
)
|
)
|
| Jul 2011 | Apr 2011 | Jan 2011 | Oct 2010 |
|---|
)
|
)
|
)
|
)
|
| Jul 2011 | Apr 2011 | Jan 2011 | Oct 2010 |
|---|
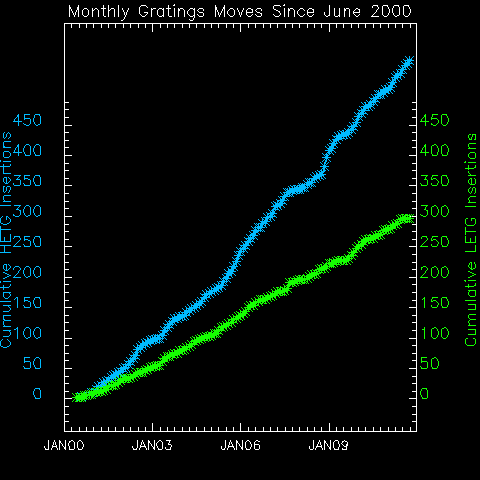
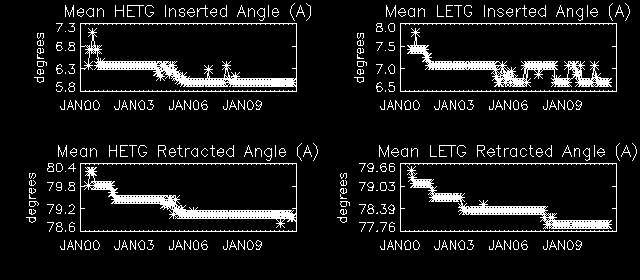
Gratings
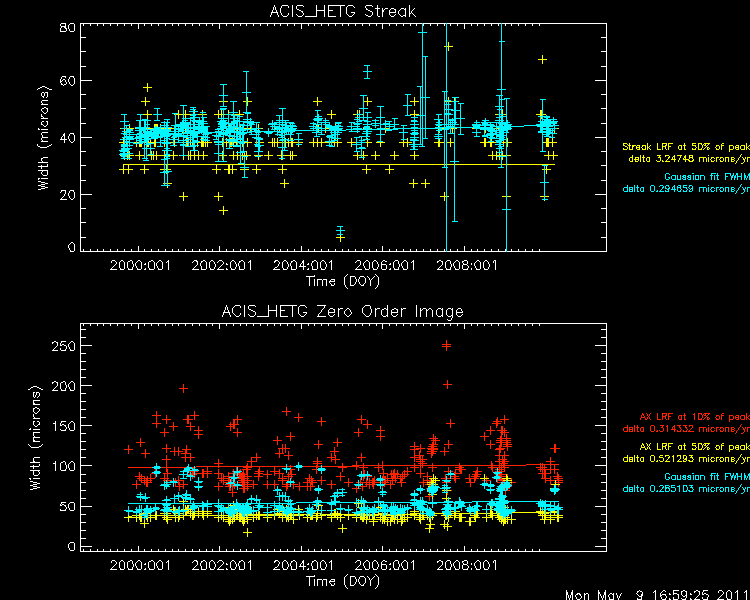
Focus
We plot the width of the zero order streak of ACIS/HETG observations and the width of the zero order image for HRC/LETG observations of point sources. No significant defocusing trend is seen at this time. See Gratings Focus pages. (NOTE: the figures are not updated from Mar 2009 due to a system problem.)
PCAD
ACA Trending
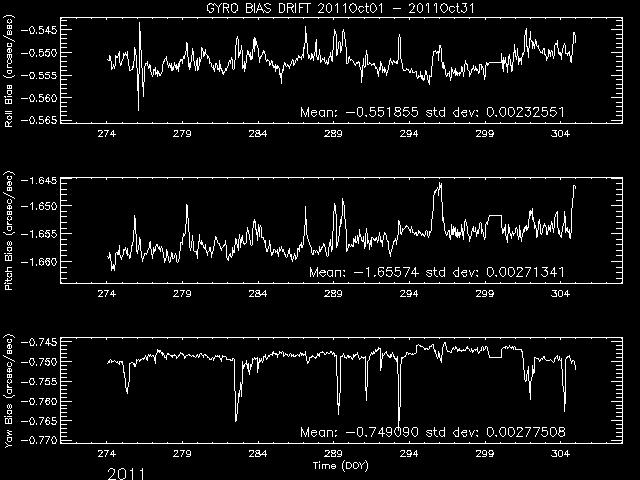
Gyro Bias Drift
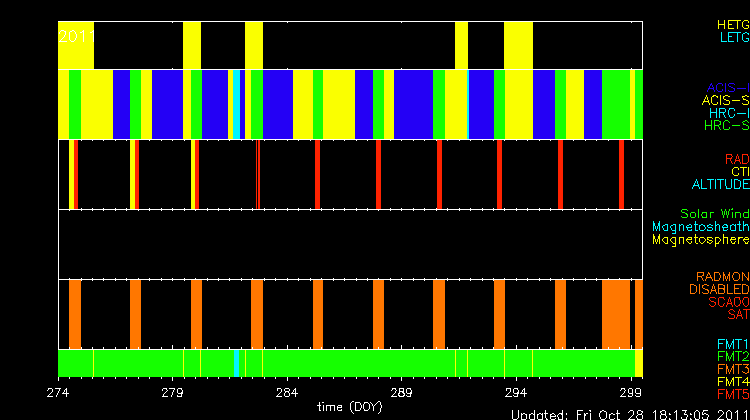
Radiation History
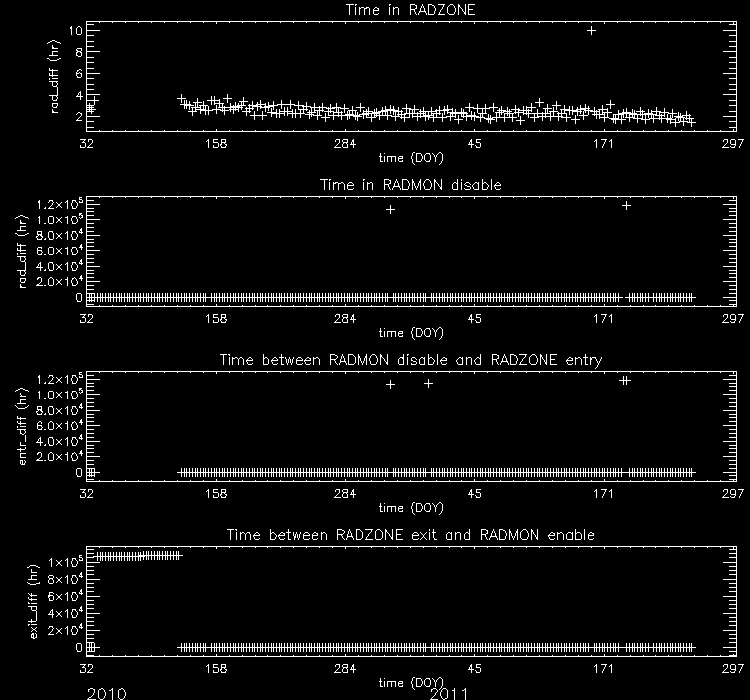
Radiation Zone Timing
Plotted below are radiation zone timing plots based on the following definitions of radiation zone:
- RADZONE - Ephin levels (in any of the E1300,P4GM,P41GM channels) are more than 1/3 of RADMON safing thresholds.
- RADMON - Radmon is disabled for radiation zone (as commanded based on OFLS model, for comparison with actual radiation levels).
- PERIGEE - Time of closest earth approach (for comparison)
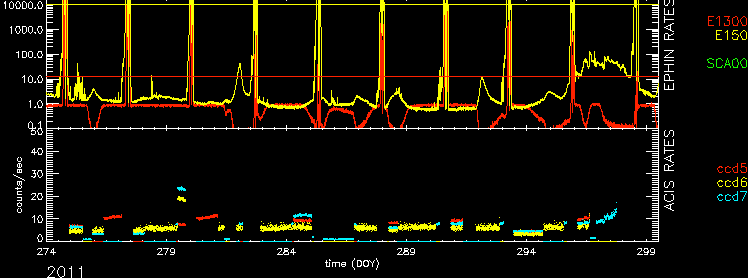
Radiation Count Rates of Oct 2011
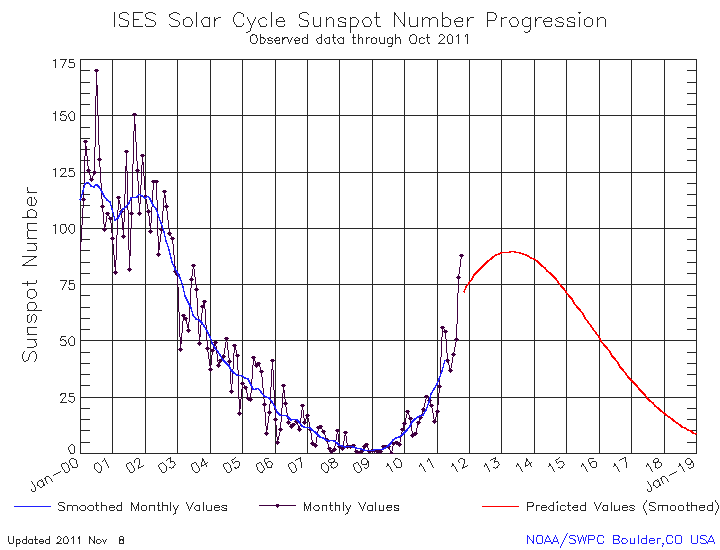
Sun Spot History
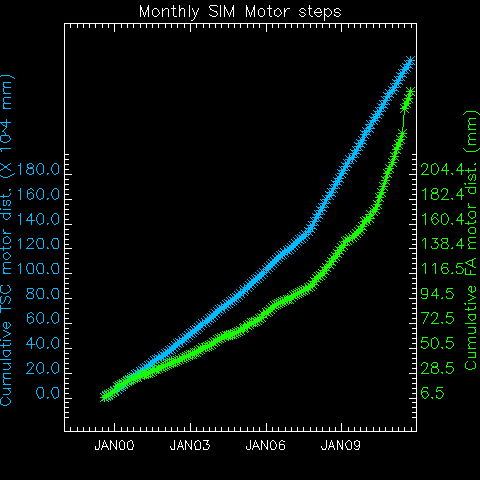
SIM
SIM Shift and Twist
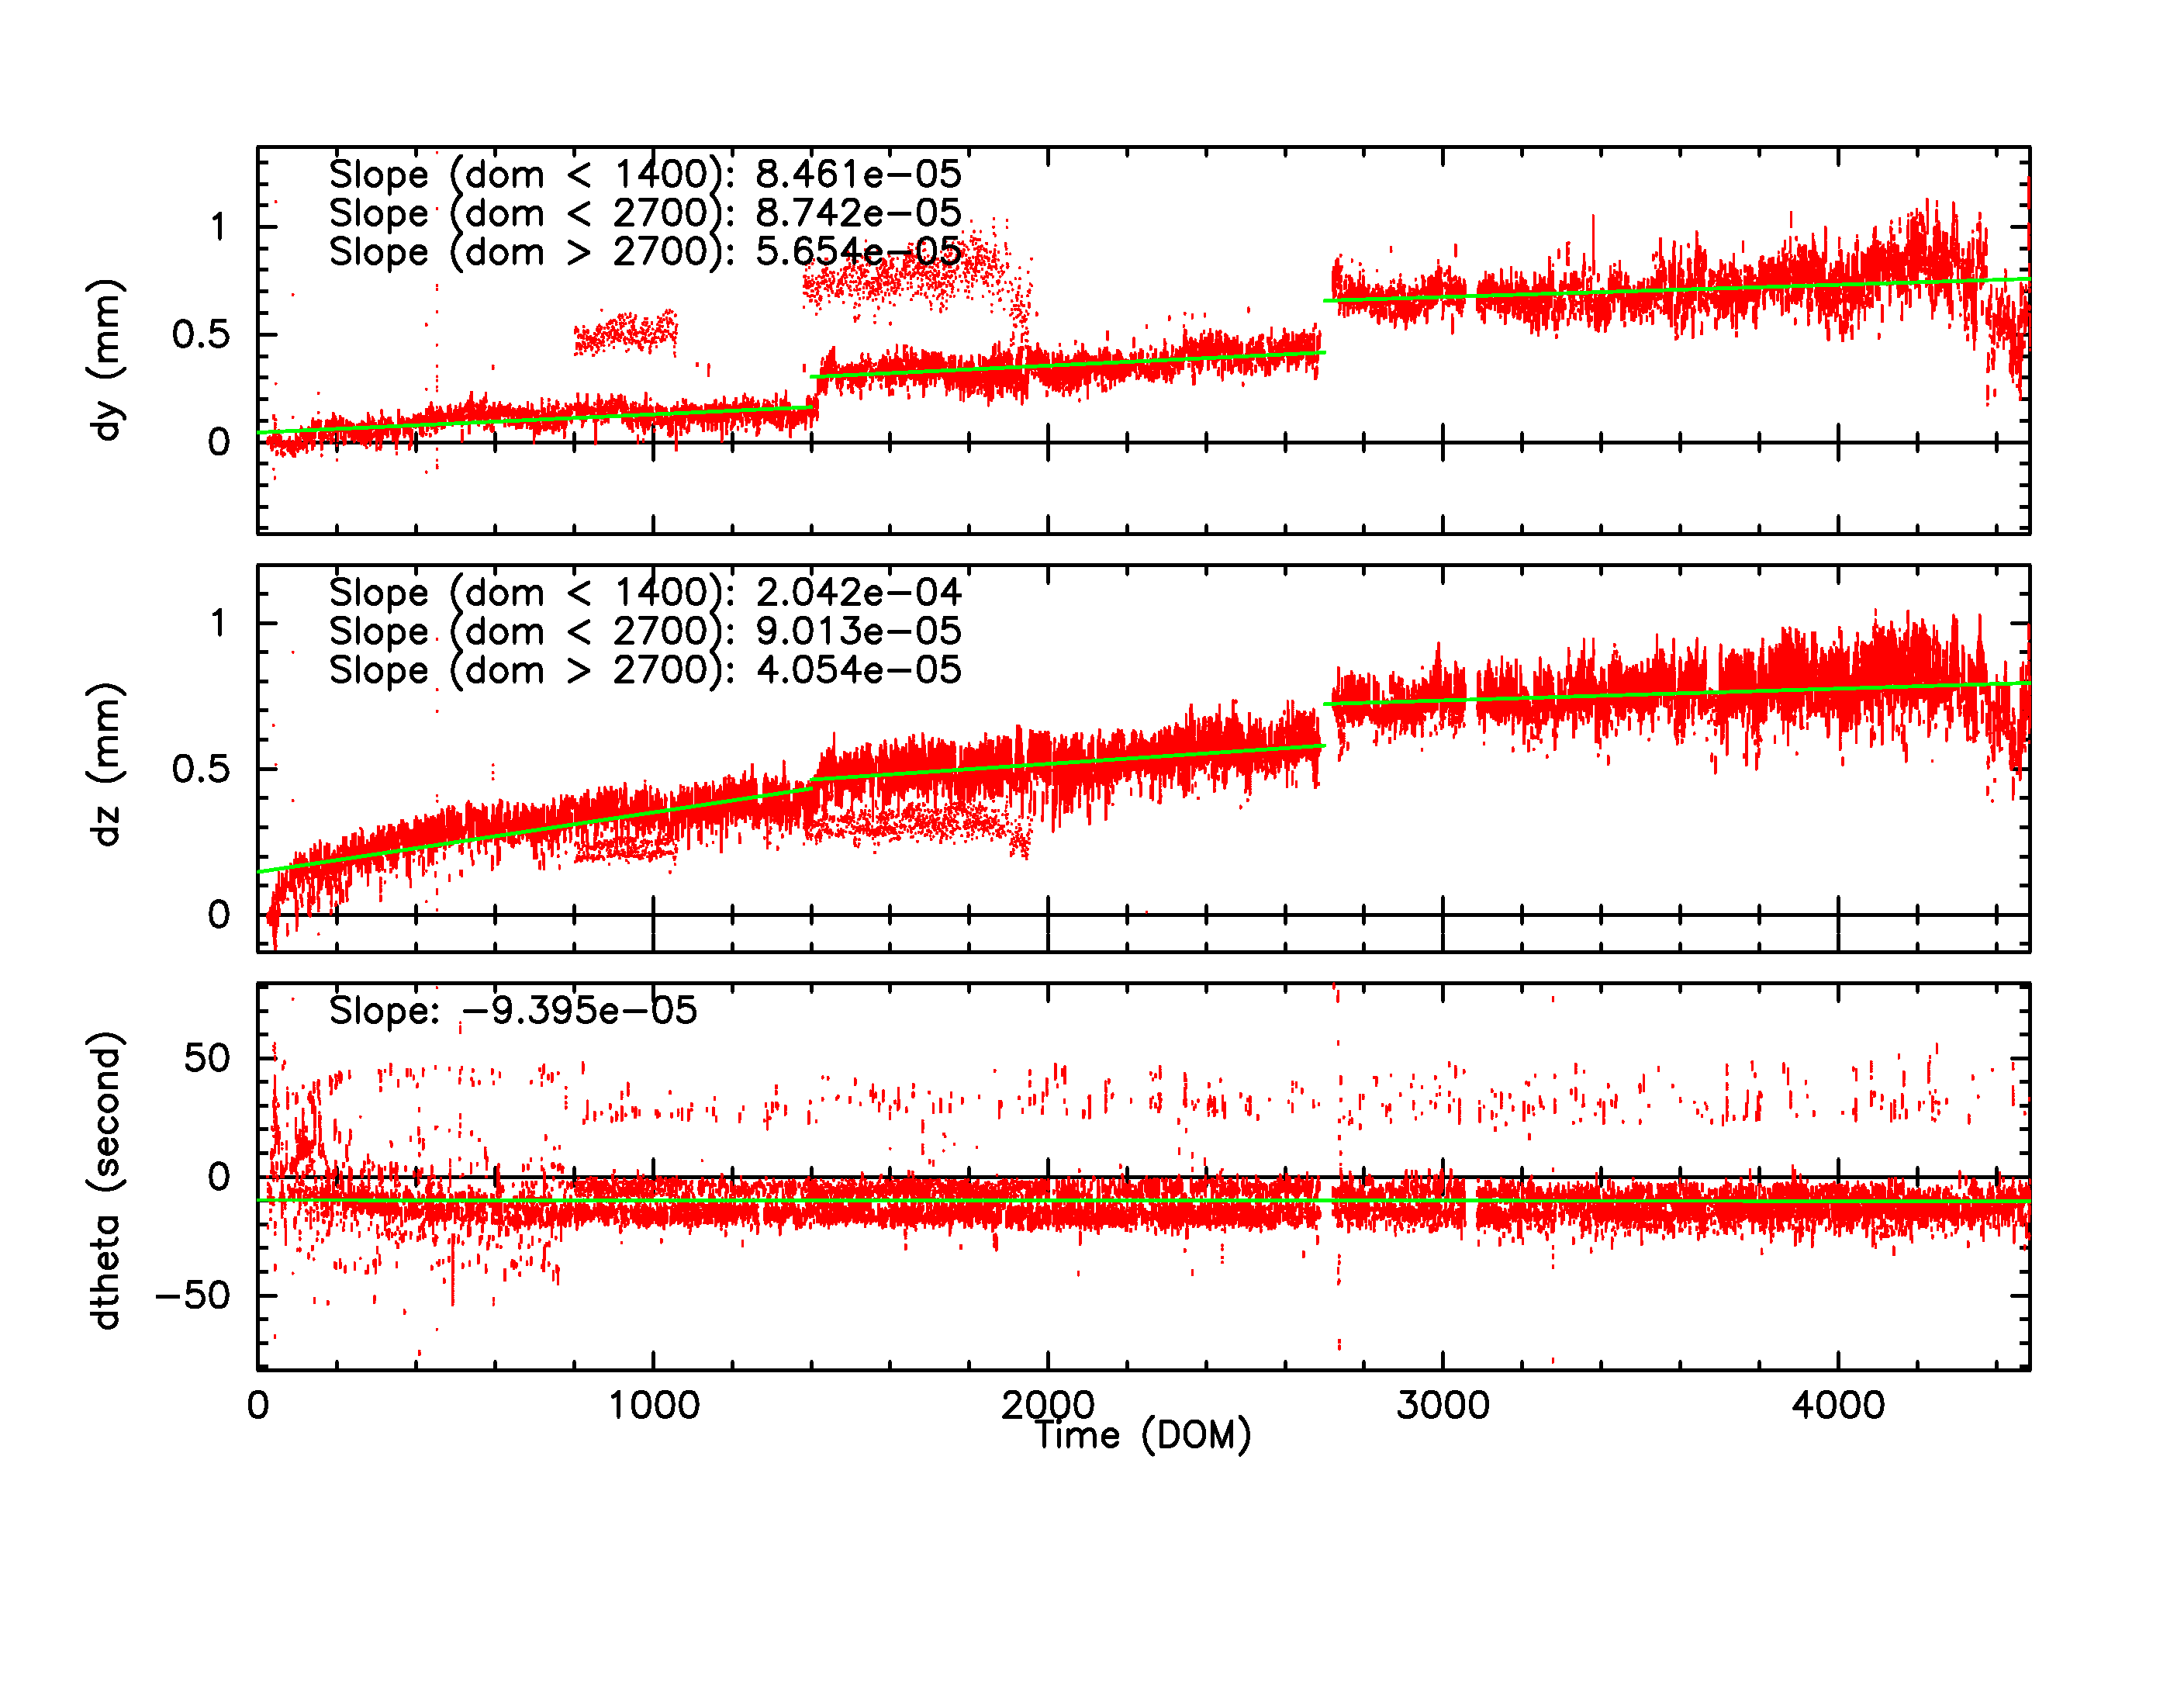
SIM Shift and Twist Trend The following plots show trends of SIM shifts (dy and dz) and twist (dtheta). All quantities are directly taken from pcaf*_asol1.fits files. The units are mm for dy and dz, and degree for dtheta. We fit three lines separated before and after (Days of Mission)= 1400 (May 21, 2003), and 2700 (Dec 11, 2006). The unit of slopes are mm per day or degree per day.
The sudden shift around DOM = 1400 and 2700 are due to fid light drift (see a memo by Aldcroft fiducial light drift). On the dtheta plot, two tracks are clearly observed. The track around 0.01 is due to HRC-I, and all others are clustered around -0.002. For more detail, please see SIM Shift and Twist Trend page
Trending
Quarterly Trends
- ACIS Electronics A
| Previous Quarter | ||||||
| MSID | MEAN | RMS | DELTA/YR | DELTA/YR/YR | UNITS | DESCRIPTION |
| 1DE28AVO | 28.31 | 0.23 | -1.800e+00 | 1.025e+01 | V | DEA +28V INPUT A |
| 1DEICACU | 1.53 | 0.33 | -2.906e-01 | -3.066e+00 | AMP | DEA INPUT CURRENT A |
| 1DEP0AVO | 6.17 | 3.780e-02 | -4.826e-02 | -6.403e-01 | V | DEA +6V VOLTAGE A |
| 1DEP1AVO | 15.89 | 0.28 | -3.495e-01 | -2.931e+00 | V | DEA +15V ANALOG A |
| 1DEP2AVO | 24.96 | 0.13 | -3.493e-01 | -2.165e+00 | V | DEA +24V ANALOG A |
| 1DEP3AVO | 30.51 | 0.13 | -4.939e-01 | -1.121e+00 | V | DEA +28V ANALOG A |
| 1DP28AVO | 28.34 | 0.22 | -1.792e+00 | 9.911e+00 | V | DPA +28V INPUT A |
)
)
)
)
)
)
)
Spacecraft Motions
|
|
Reaction Wheel Rotations
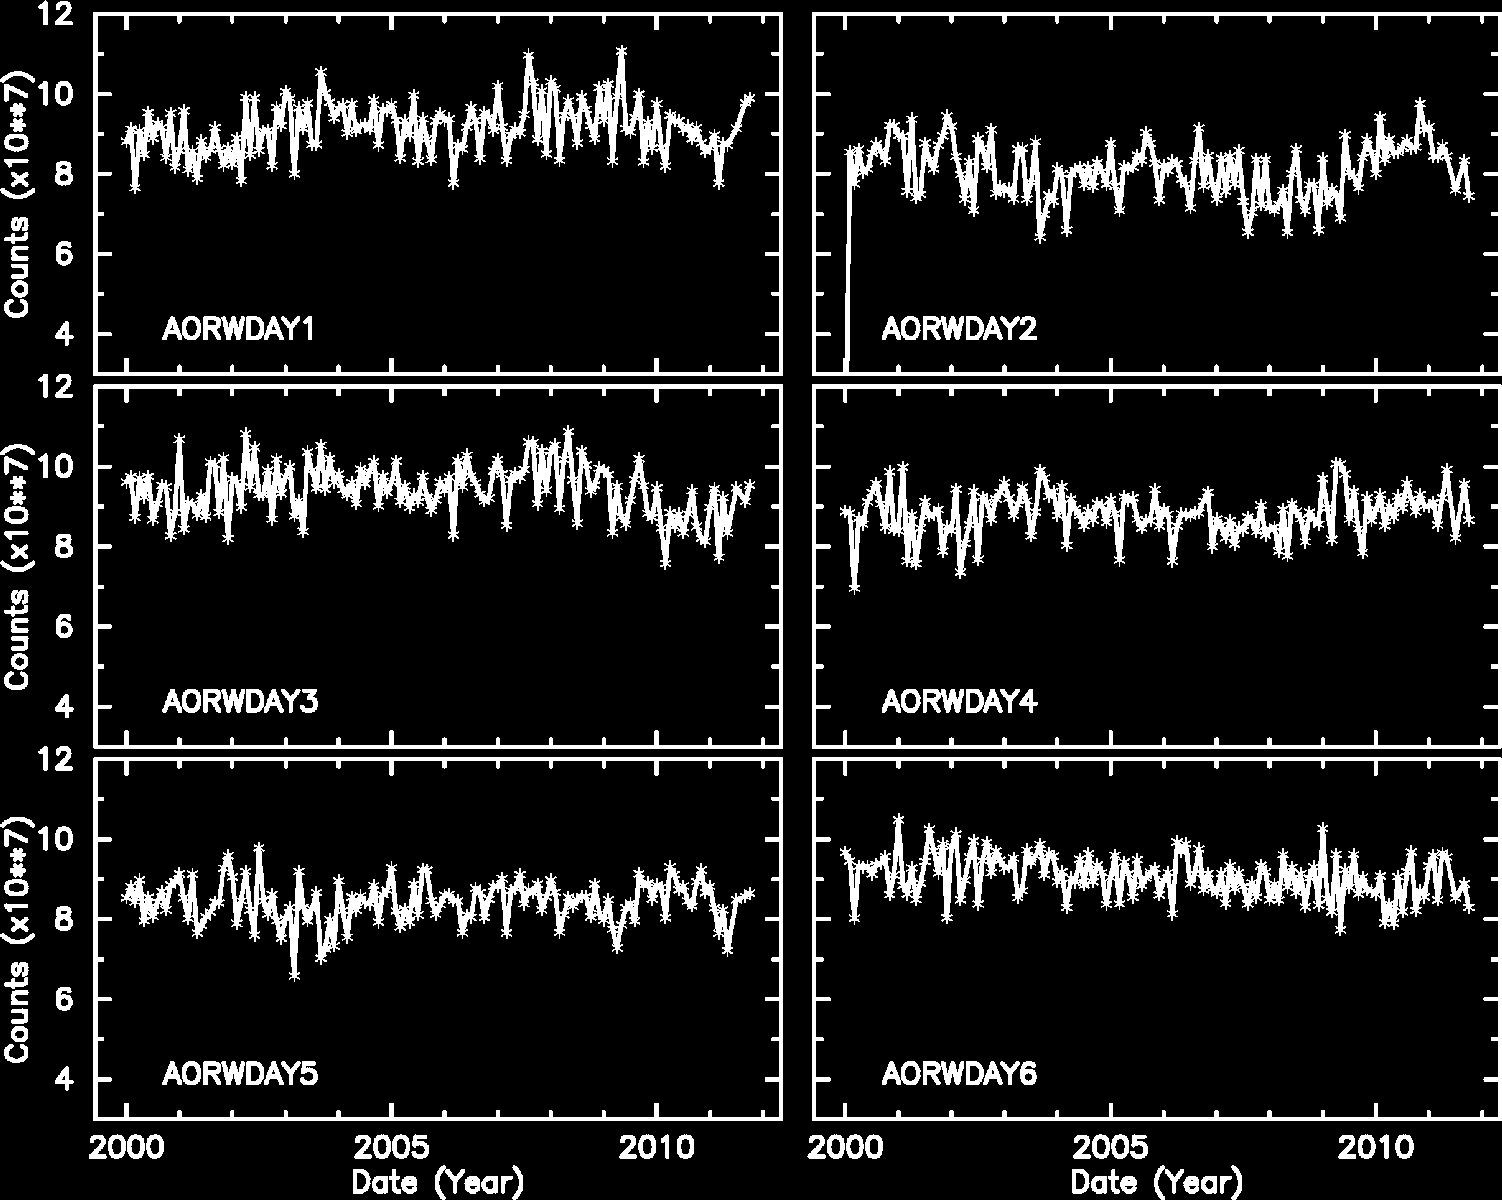
Note: From Feb 2010, the computation of reaction wheel rotations are slightly modified.
Links to Past Monthly Reports
| Year | Month | |||||||||||
|---|---|---|---|---|---|---|---|---|---|---|---|---|
| 1999 | Jul | Aug | Sep | Oct | Nov | Dec | ||||||
| 2000 | Jan | Feb | Mar | Apr | May | Jun | Jul | Aug | Sep | Oct | Nov | Dec |
| 2001 | Jan | Feb | Mar | Apr | May | Jun | Jul | Aug | Sep | Oct | Nov | Dec |
| 2002 | Jan | Feb | Mar | Apr | May | Jun | Jul | Aug | Sep | Oct | Nov | Dec |
| 2003 | Jan | Feb | Mar | Apr | May | Jun | Jul | Aug | Sep | Oct | Nov | Dec |
| 2004 | Jan | Feb | Mar | Apr | May | Jun | Jul | Aug | Sep | Oct | Nov | Dec |
| 2005 | Jan | Feb | Mar | Apr | May | Jun | Jul | Aug | Sep | Oct | Nov | Dec |
| 2006 | Jan | Feb | Mar | Apr | May | Jun | Jul | Aug | Sep | Oct | Nov | Dec |
| 2007 | Jan | Feb | Mar | Apr | May | Jun | Jul | Aug | Sep | Oct | Nov | Dec |
| 2008 | Jan | Feb | Mar | Apr | May | Jun | Jul | Aug | Sep | Oct | Nov | Dec |
| 2009 | Jan | Feb | Mar | Apr | May | Jun | Jul | Aug | Sep | Oct | Nov | Dec |
| 2010 | Jan | Feb | Mar | Apr | May | Jun | Jul | Aug | Sep | Oct | Nov | Dec |
| 2011 | Jan | Feb | Mar | Apr | May | Jun | Jul | Aug | Sep | |||