ACIS
ACIS DOSE Registered-Photon-Map
The steps we took to compute the dose map are;
- Level 1 Event files for a specified month are obtained from archive.
- Image data including I2, I3, S2, S3 CCDs are extracted from all event files.
- All the extracted image data were merged to create a month long exposure map for the month.
- The exposure map is opened with ds9, and check a distribution of count rates against energy. From this, estimate the upper threshold value. Any events beyond this upper threshold are assumed erroneous events such as bad pixels.
- Using this upper threshold, the data is filtered, and create a cleaned exposure map for the month.
- The exposure map from each month from the Sep 1999 is added up to create a cumulative exposure map for each month.
- Using fimgstatistic, we compute count rate statistics for each CCDs.
- For observations with high data drop rates (e.g., Crab nebula, Cas A), we corrected the observations by adding events.
-
Note: Counts and RMS's of Cumulative maps are lower than the previous months.
This is because we excluded extreme outliers.
Please check more detail plots at Telemetered Photon Dose Trend page.
)
)
)
Statistics:
# IMAGE     NPIX        MEAN           RMS              MIN     MAX
ACIS_sep11 6004901       7.536         12.505           0.0     597

 I2 node 0  262654      9.970997        3.983274        0.0      80.0
 I2 node 1  262654      10.619889       4.831352        0.0     439.0
 I2 node 2  262654      10.342476       3.995957        0.0      93.0
 I2 node 3  262654      10.265799       4.416733        0.0     371.0

 I3 node 0  262654      10.040601       3.967759        0.0      53.0
 I3 node 1  262654      10.819164       10.286097       0.0     310.0
 I3 node 2  262654      9.820549        3.839858        0.0      70.0
 I3 node 3  262654      9.734119        3.919325        0.0     293.0

 S2 node 0  262654      10.863228       4.117255        0.0      72.0
 S2 node 1  262654      11.407835       4.847647        0.0      87.0
 S2 node 2  262654      11.708946       4.924107        0.0     171.0
 S2 node 3  262654      11.229642       4.021895        0.0     363.0

 S3 node 0  262654      13.066648       19.107066       0.0     168.0
 S3 node 1  262654      7.142526        5.114961        0.0      83.0
 S3 node 2  262654      6.061171        2.607785        0.0      34.0
 S3 node 3  262654      5.581501        2.518919        0.0      48.0
)
)
)
Statistics:
 IMAGE        NPIX      MEAN             RMS            MIN    MAX
ACIS_total  6004901    1541.21          R2069.93        0.0    93192

 I2 node 0  262654      1271.835472     245.294341      0.0     6361.0
 I2 node 1  262654      1342.539830     329.082626      0.0     26528.0
 I2 node 2  262654      1377.082069     298.355969      0.0     8860.0
 I2 node 3  262654      1372.574134     350.491233      0.0     27665.0

 I3 node 0  262654      1438.747737     351.126071      0.0     6439.0
 I3 node 1  262654      1509.459114     1137.415602     0.0     29267.0
 I3 node 2  262654      1311.647678     237.771527      0.0     6220.0
 I3 node 3  262654      1297.736435     253.434743      0.0     23244.0

 S2 node 0  262654      1846.103098     256.587664      955.0   20122.0
 S2 node 1  262654      1962.954237     421.812219      991.0   10805.0
 S2 node 2  262654      2175.233027     408.863011      1273.0  15567.0
 S2 node 3  262654      2100.829834     297.644031      1220.0  33041.0

 S3 node 0  262654      3187.624238     1618.595574     1318.0  12988.0
 S3 node 1  262654      4388.363636     1943.538676     0.0     13458.0
 S3 node 2  262654      3319.334260     900.155158      1247.0  8317.0
 S3 node 3  262654      2552.736885     408.396820      1407.0  9357.0
)
|
)
|
)
|
)
|
| Jun 2011 | Mar 2011 | Dec 2010 | Sep 2010 |
|---|
The Mean Detrended CTI
We report CTIs with a refined data definition. CTIs were computed for the temperature dependency corrected data. Please see CTI page for detailed explanation. CTI's are computed for Mn K alpha, and defined as slope/intercept x10^4 of row # vs ADU. Data file: here
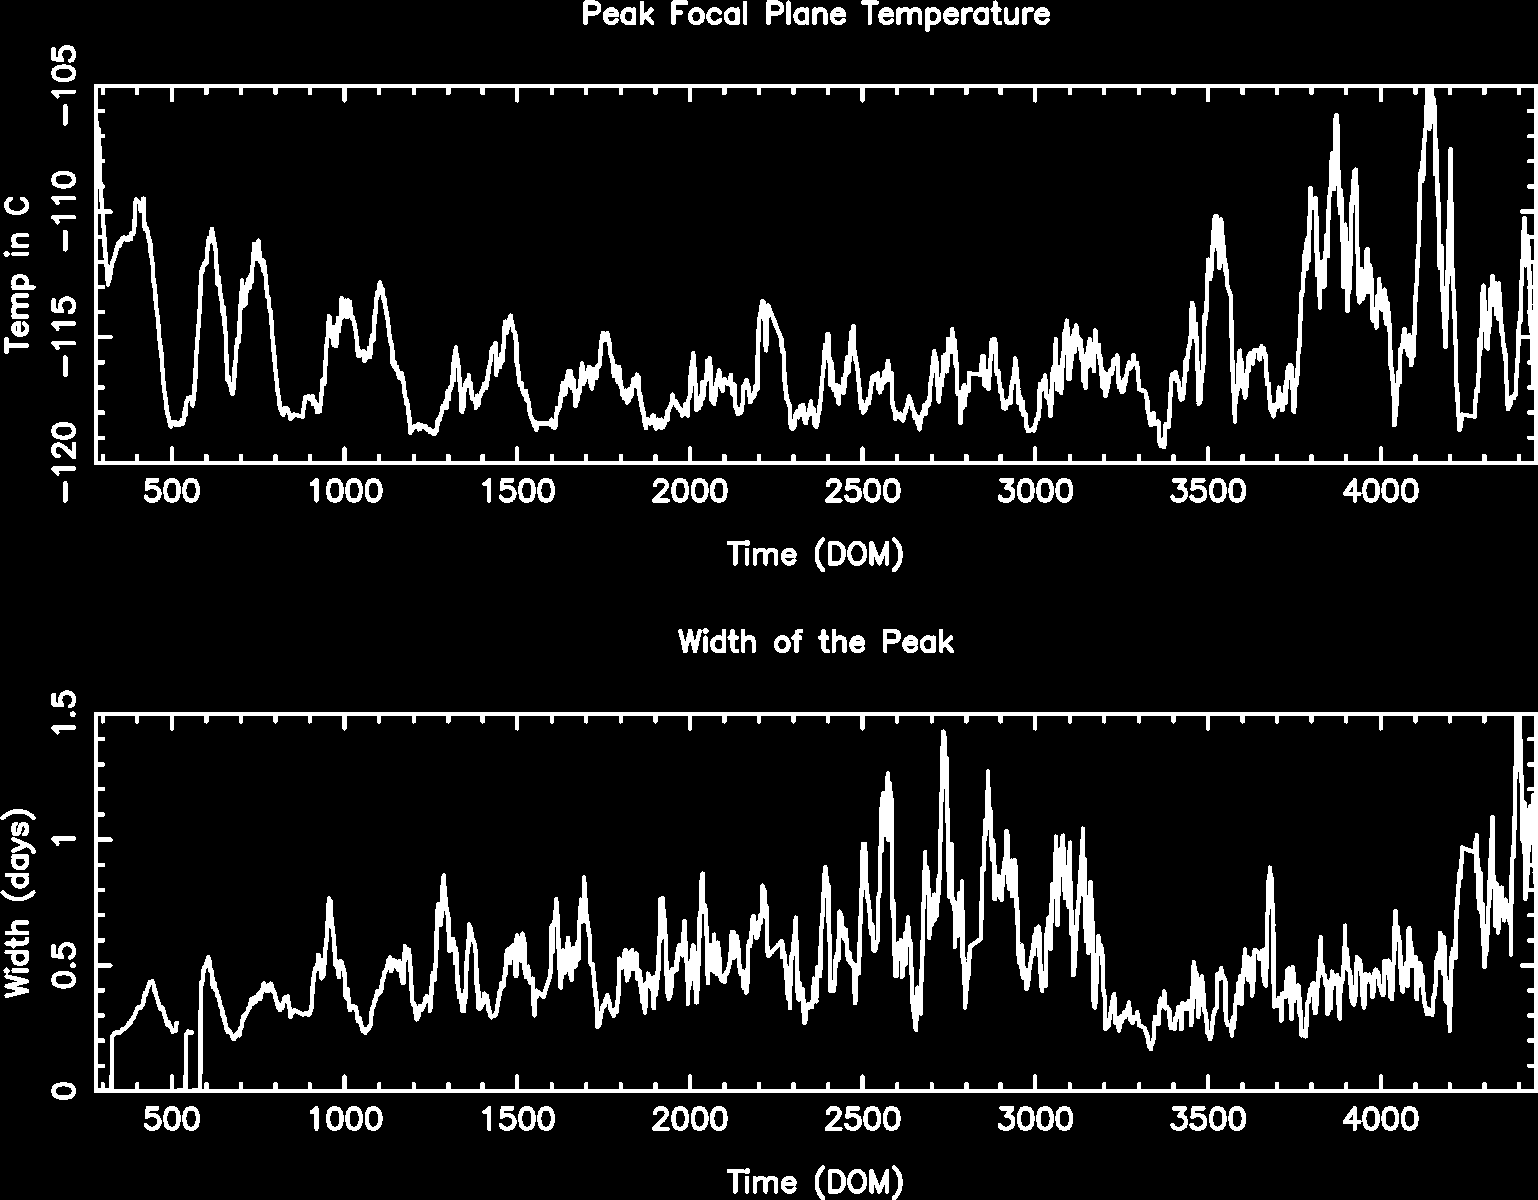
Focal Plane Temperature
Sep 2011 Focal Temperature
| The Mean (max) FPT: | |
|---|---|
| -113.30 | +/- 6.44 C |
| Mean Width: | |
| 1.02 | +/- 0.71 days |
Averaged Focal Plane Temperature
We are using 10 period moving averages to show trends of peak temperatures and peak widths. Note, the gaps in the width plot are due to missing/corrupted data.
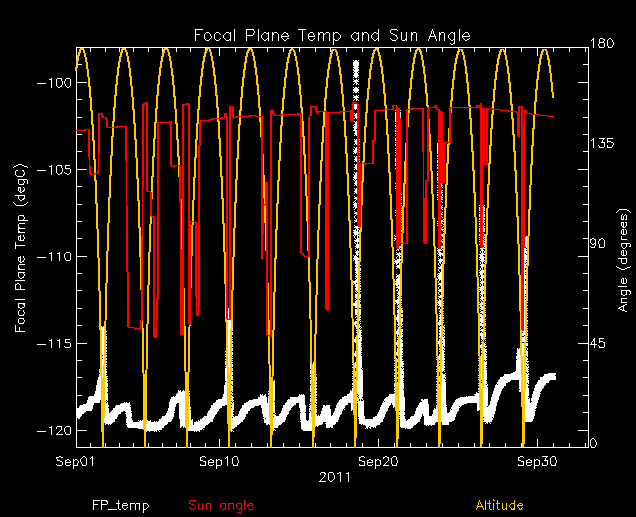
Focal Plane Temperature, Sun Angle and Altitude
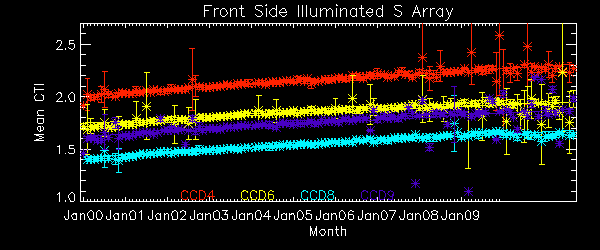
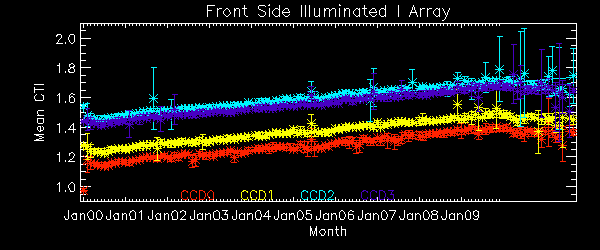
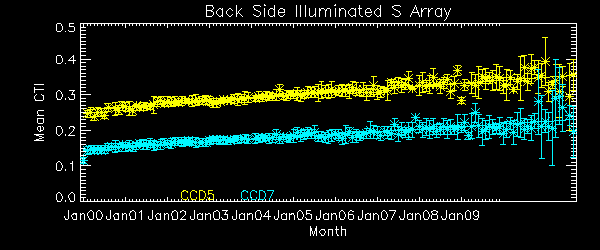
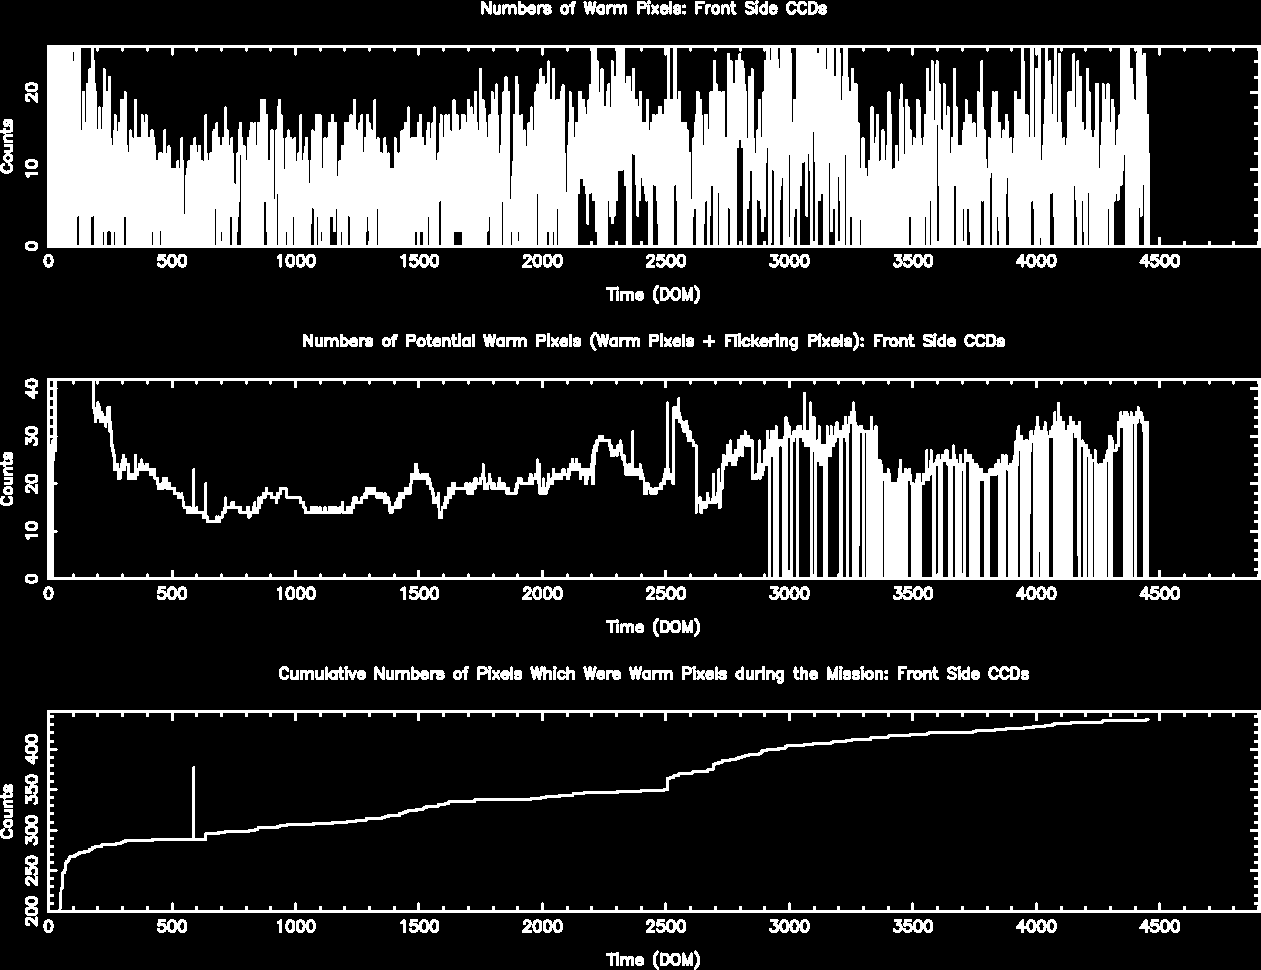
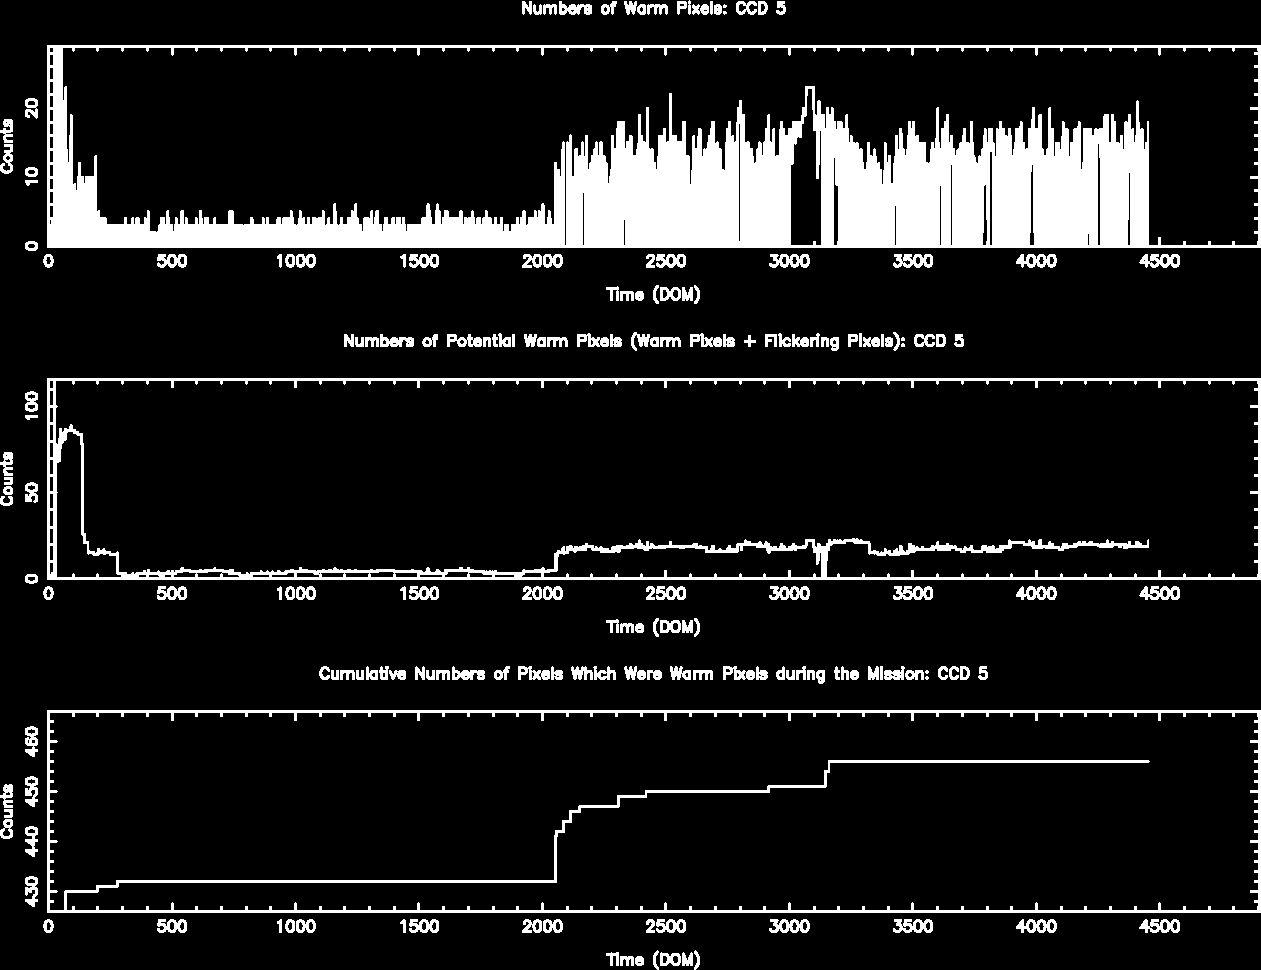
Bad Pixels
The plots below were generated with a new warm pixel finding script. Please see Acis Bad Pixel Page for details.
Front Side CCDs
Back Side CCD (CCD5)
### -->
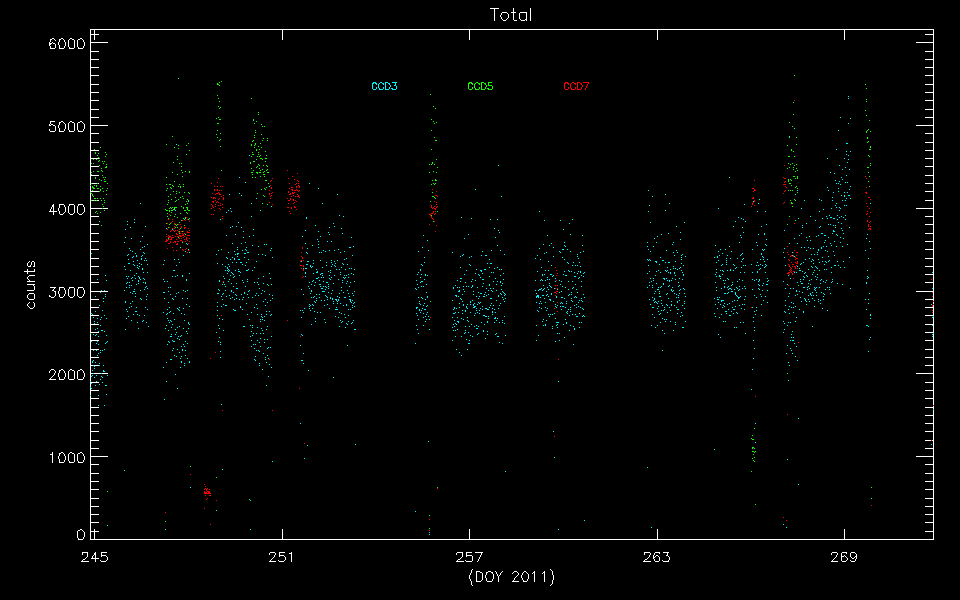
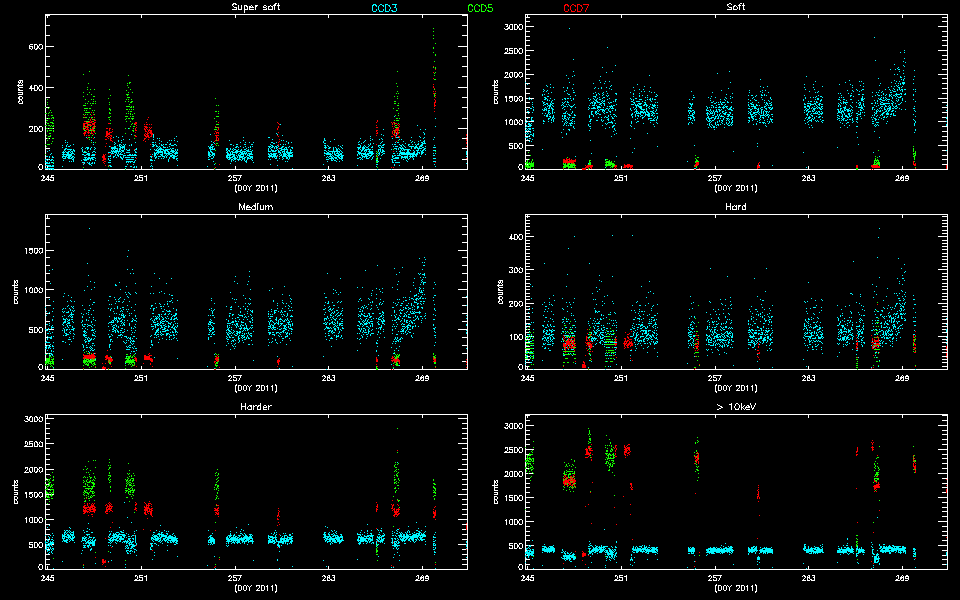
Science Instrument Background Rates
| Name | Low (keV) | High(KeV) | Description |
|---|---|---|---|
| SSoft | 0.00 | 0.50 | Super soft photons |
| Soft | 0.50 | 1.00 | Soft photons |
| Med | 1.00 | 3.00 | Moderate energy photons |
| Hard | 3.00 | 5.00 | Hard Photons |
| Harder | 5.00 | 10.00 | Very Hard photons |
| Hardest | 10.00 | Beyond 10 keV |
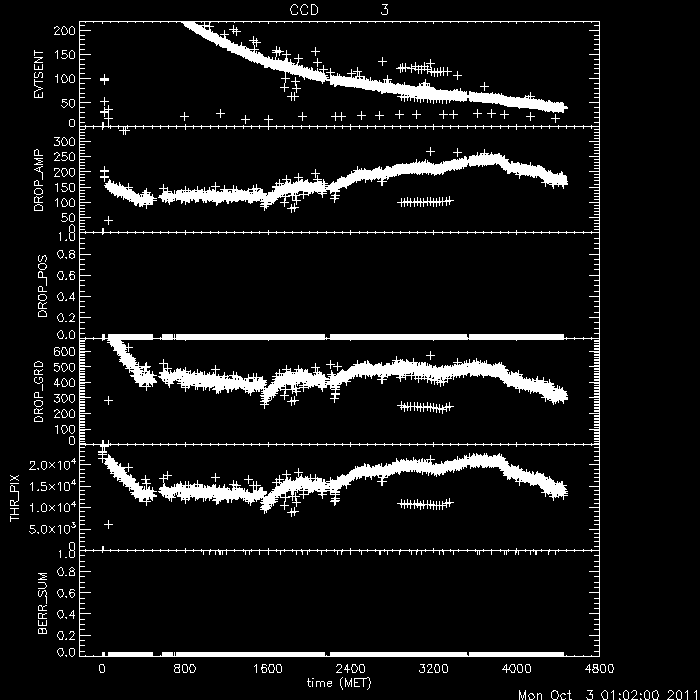
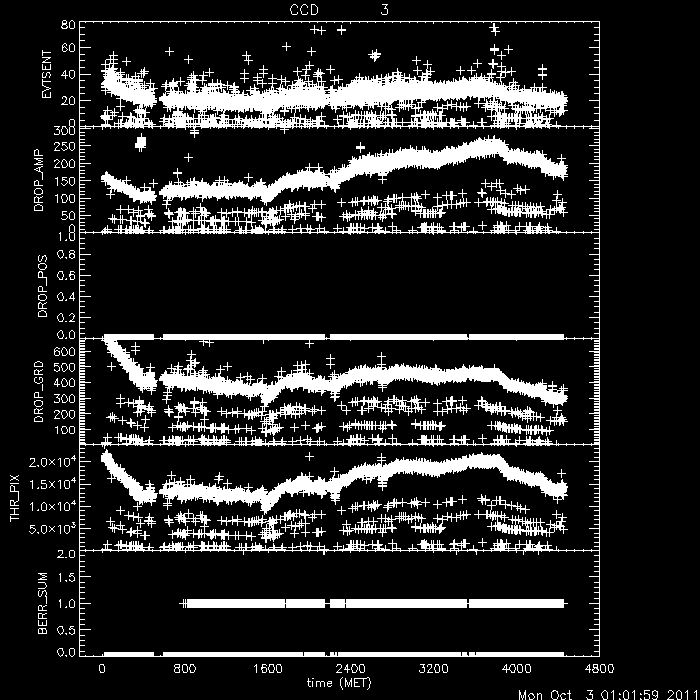
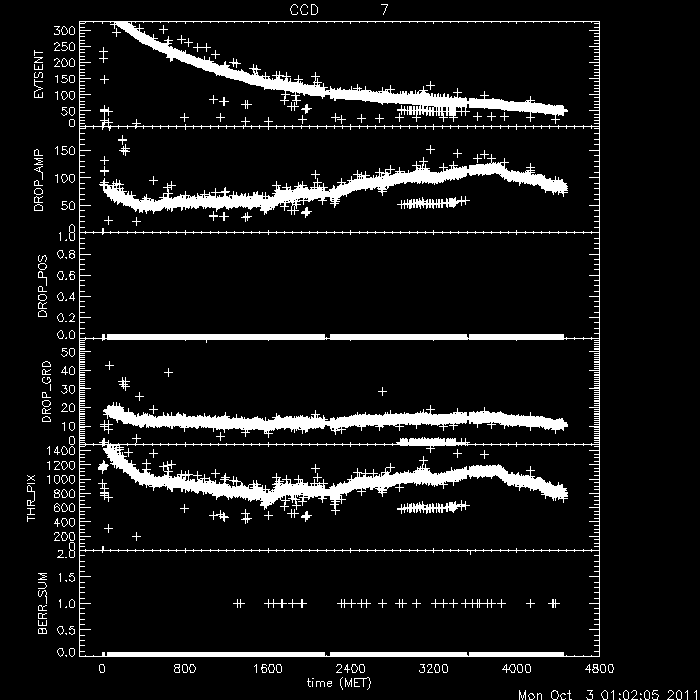
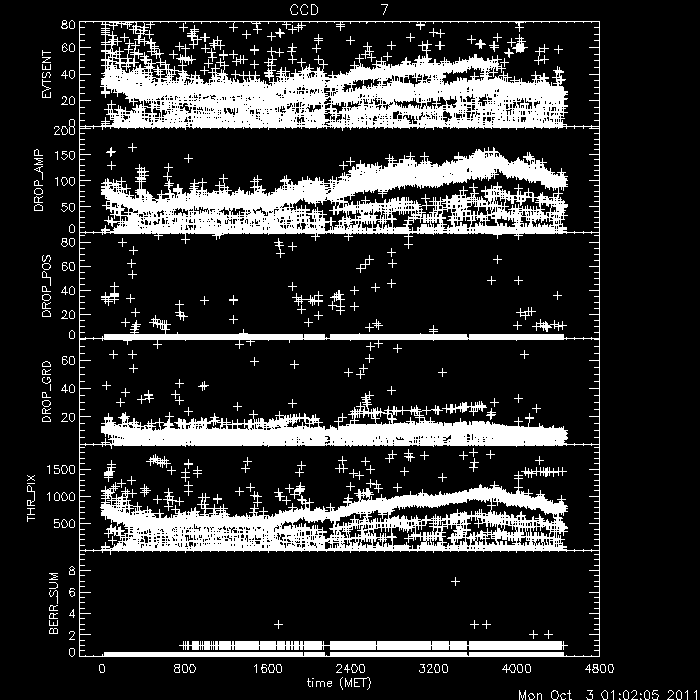
ACIS Rejected Events
The links below are plots of stat1 quantities, showing on-board rejected events. The average EVTSENT, DROP_AMP, DROP_POS, DROP_GRD, THR_PIX, and maximum BERR_SUM obtained from L1 acis*stat1.fits files are plotted for each observation. CTI observations are plotted separately from regular science observations.
Column definitions:
- EVTSENT - number of events sent in data record
- DROP_AMP - number of discarded events due to corrected amplitude
- DROP_POS - number of discarded events due to CCD position
- DROP_GRD - number of discarded events due to grade code
- THR_PIX - number of pixels above respective threshold level
- BERR_SUM - number of pixel bias errors so far in science run
Note the half-life decline of the CTI source is clearly evidenced in the steady janline of EVTSENT.
CCD3 CTI Observations
CCD3 Science Observations
CCD7 CTI Observations
CCD7 Science Observations
HRC
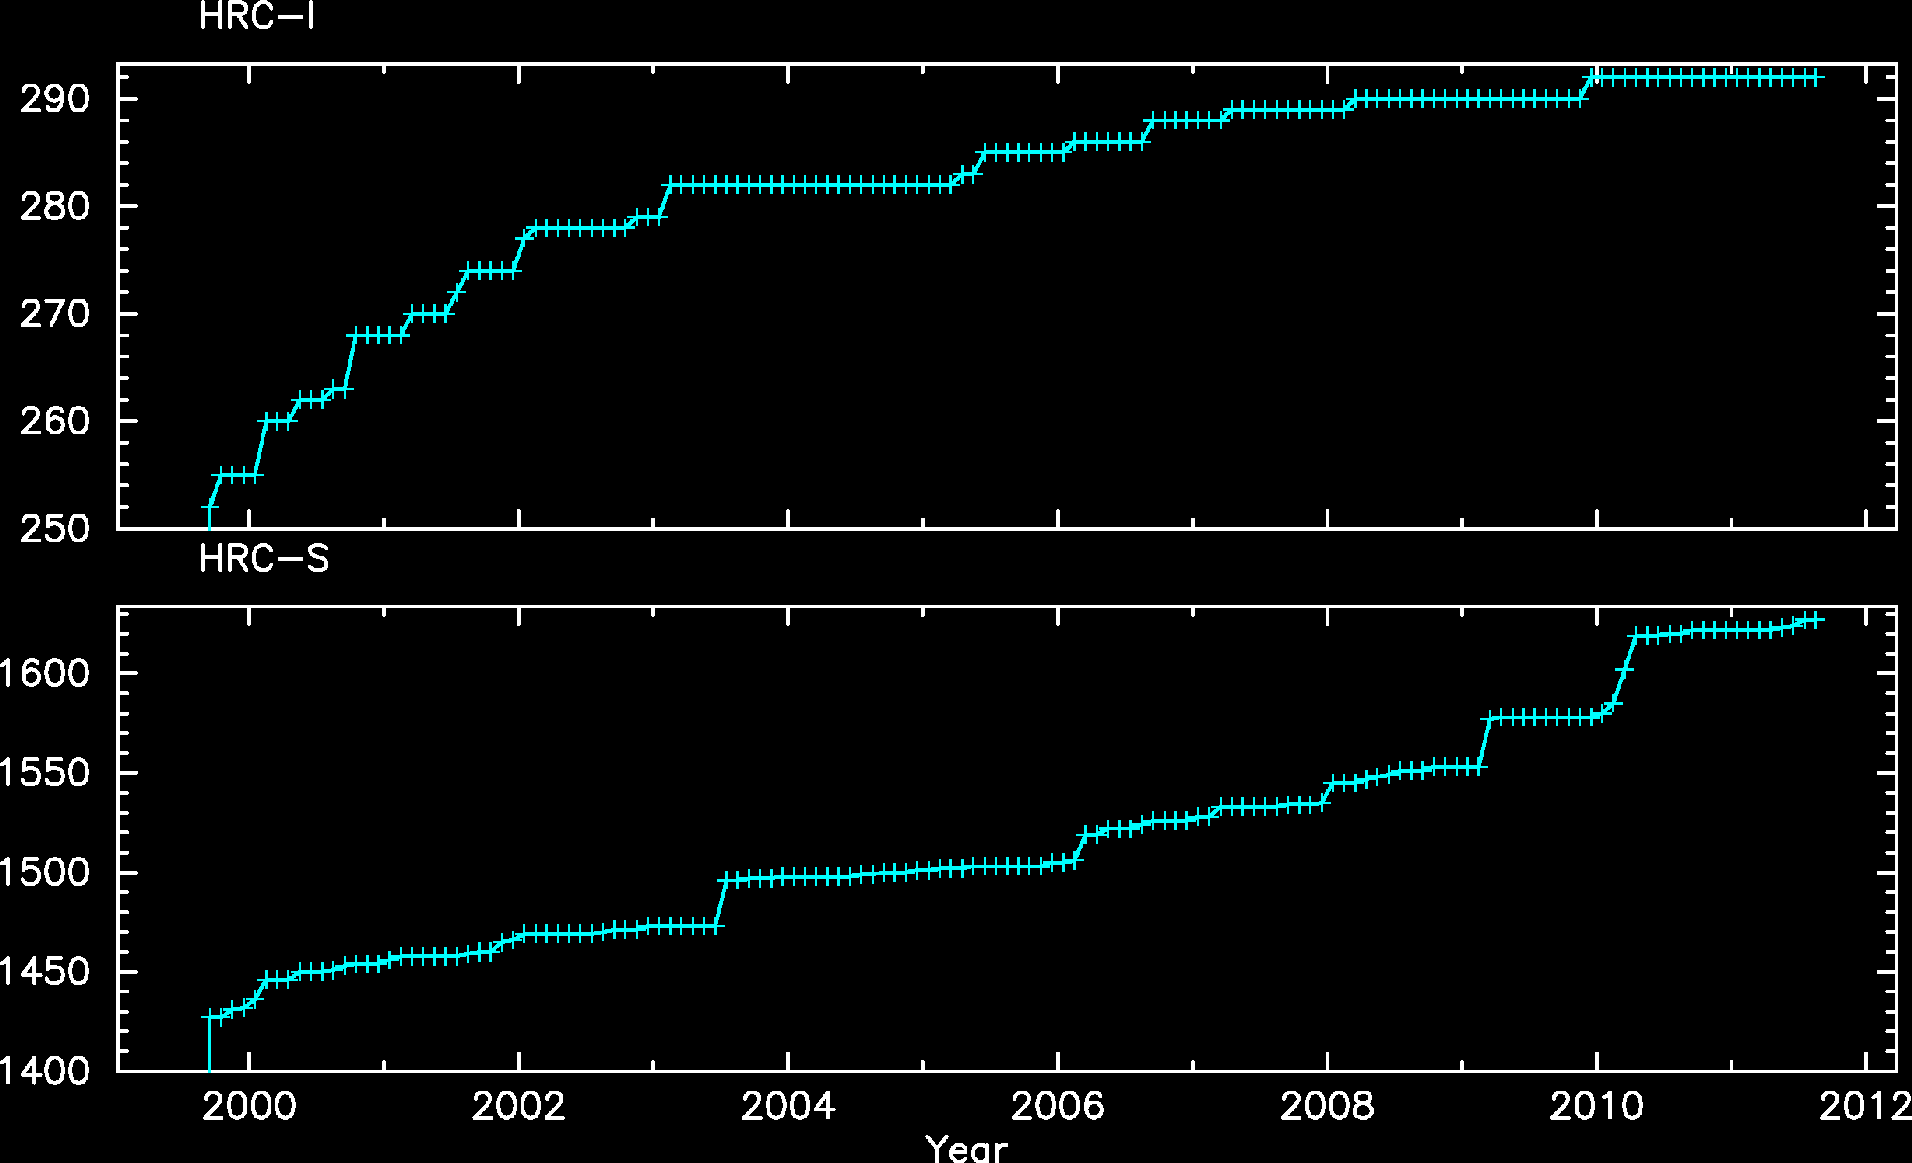
DOSE of Central 4K Pore-Pairs
Please refer to Maximum Dose Trends for more details.
)
        IMAGE                NPIX      MEAN    STDDEV      MIN       MAX
HRCI_09_2011.fits          16777216   0.020    0.151       0.0       12.0
)
        IMAGE                NPIX      MEAN    STDDEV      MIN       MAX
HRCI_08_1999_09_2011.fits  16777216   3.563    4.391       0.0       292.0
)
        IMAGE                NPIX      MEAN    STDDEV      MIN       MAX
HRCS_09_2011.fits          16777216   0.032    0.189       0.0       13.0
)
        IMAGE                NPIX     MEAN      STDDEV      MIN      MAX
HRCS_08_1999_09_2011.fits  16777216  13.760      22.905      0.0      1627.0
|
|
Max dose trend plots corrected for events that "pile-up"
in the center of the taps due to bad position information.
|
)
|
)
|
)
|
)
|
| Jun 2011 | Mar 2011 | Dec 2010 | Sep 2010 |
|---|
)
|
)
|
)
|
)
|
| Jun 2011 | Mar 2011 | Dec 2010 | Sep 2010 |
|---|
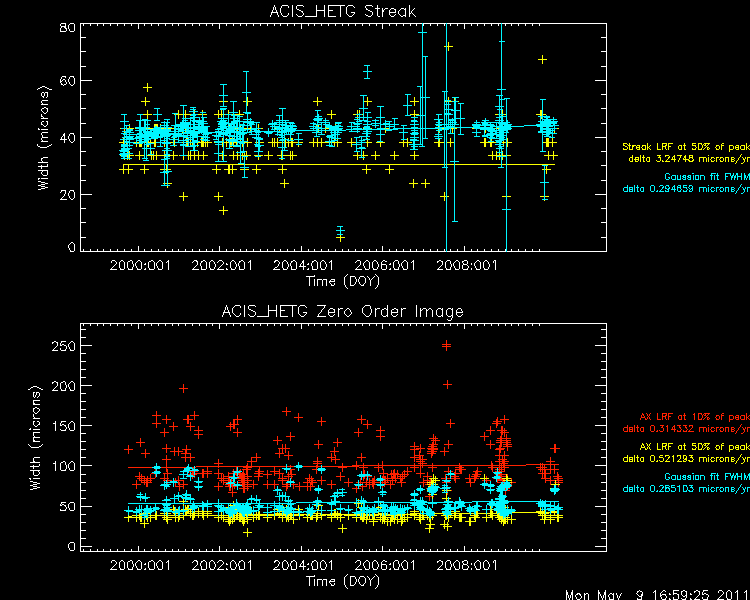
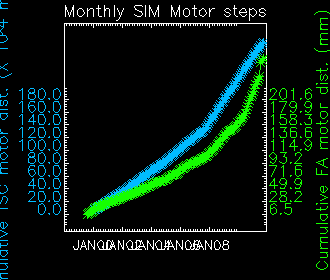
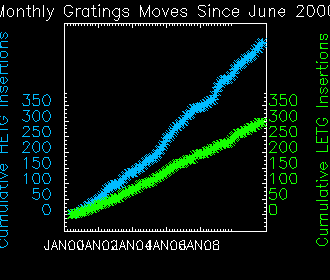
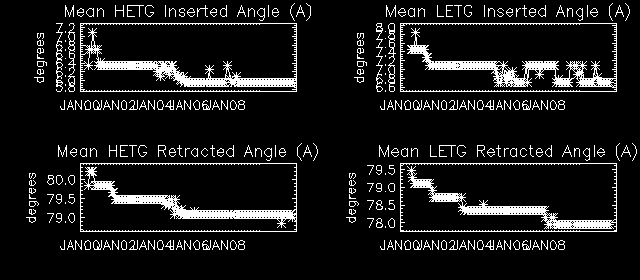
Gratings
Focus
We plot the width of the zero order streak of ACIS/HETG observations and the width of the zero order image for HRC/LETG observations of point sources. No significant defocusing trend is seen at this time. See Gratings Focus pages. (NOTE: the figures are not updated from Mar 2009 due to a system problem.)
PCAD
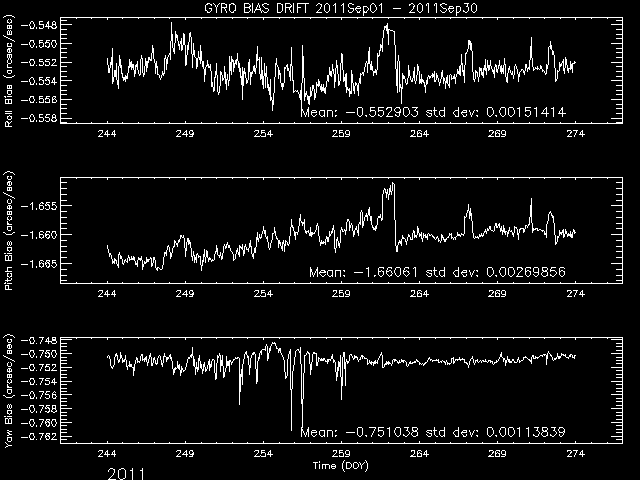
ACA Trending
Gyro Bias Drift
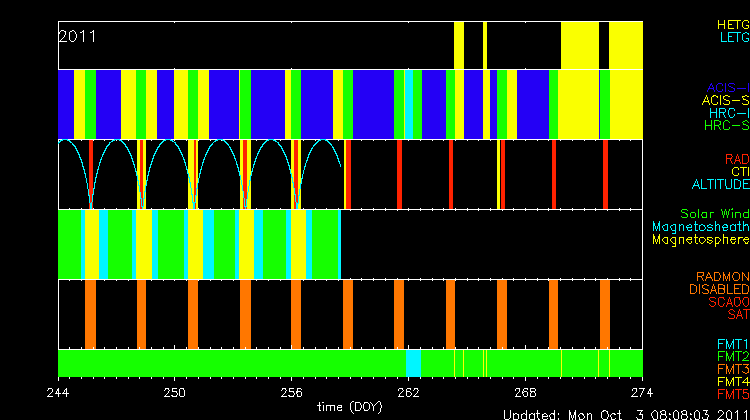
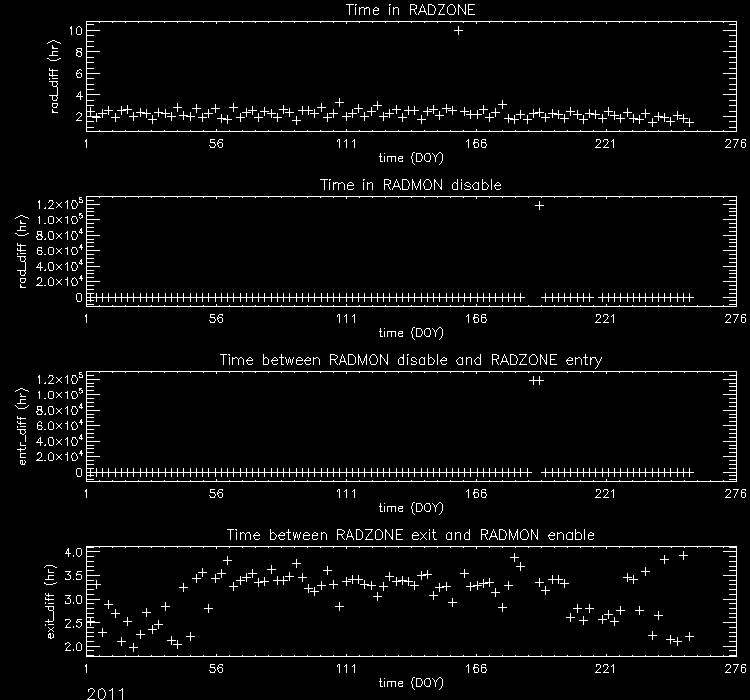
Radiation History
Radiation Zone Timing
Plotted below are radiation zone timing plots based on the following definitions of radiation zone:
- RADZONE - Ephin levels (in any of the E1300,P4GM,P41GM channels) are more than 1/3 of RADMON safing thresholds.
- RADMON - Radmon is disabled for radiation zone (as commanded based on OFLS model, for comparison with actual radiation levels).
- PERIGEE - Time of closest earth approach (for comparison)
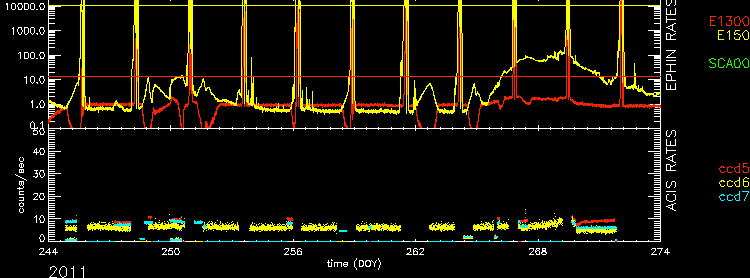
Radiation Count Rates of Sep 2011
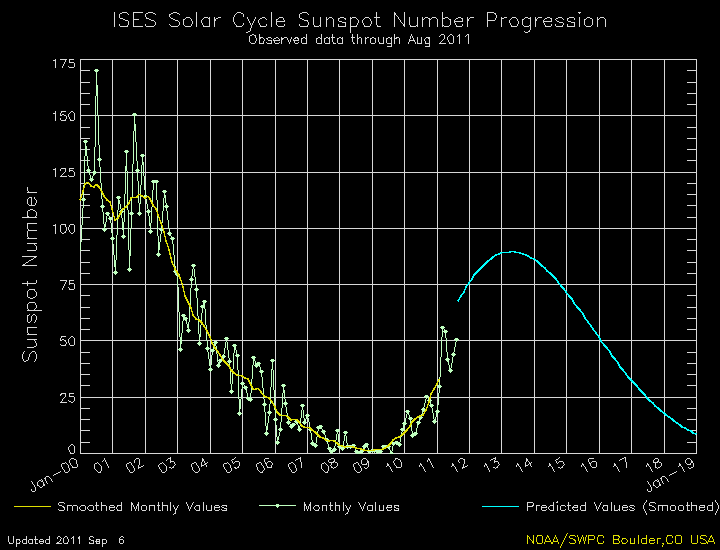
Sun Spot History
Trending
Critical Trends
| ACIS Temperatures - Daily Maximums | ||||||
|---|---|---|---|---|---|---|
| MSID | MEAN | RMS | DELTA/YR | DELTA/YR/YR | UNITS | DESCRIPTION |
| 1PDEAAT | 305.09 | 8.93 | -1.170e+00 | -6.456e+00 | K | PSMC DEA PS A TEMP |
| 1PIN1AT | 291.53 | 8.06 | -1.022e+00 | -3.588e+00 | K | PSMC TEMP 1A |
)
)
| HRMA Computed Averages - Daily Maximums | ||||||
|---|---|---|---|---|---|---|
| MSID | MEAN | RMS | DELTA/YR | DELTA/YR/YR | UNITS | DESCRIPTION |
| OBAAVG | 284.89 | 1.10 | 3.079e-01 | 2.503e-02 | K | OBA/TFTE TEMP |
)
| EPHIN Temperatures - Daily Maximums | ||||||
|---|---|---|---|---|---|---|
| MSID | MEAN | RMS | DELTA/YR | DELTA/YR/YR | UNITS | DESCRIPTION |
| TEIO | 313.46 | 20.37 | 5.410e+00 | -2.028e+01 | K | EPHIN ELECTRONICS HOUSING TEMP |
| TEPHIN | 319.02 | 6.17 | -2.863e-01 | 8.025e+00 | K | EPHIN SENSOR HOUSING TEMP |
)
)
| S/C Main Temperatures - Daily Maximums | ||||||
|---|---|---|---|---|---|---|
| MSID | MEAN | RMS | DELTA/YR | DELTA/YR/YR | UNITS | DESCRIPTION |
| TCYLFMZM | 301.52 | 26.80 | -2.844e+00 | -3.515e+01 | K | CNT CYL TEMP:-Z SIDE UNDER LAE-1 |
| TCYLFMZP | 303.77 | 25.51 | -2.737e+00 | -3.267e+01 | K | CNT CYL TEMP:-Z SIDE UNDER LAE-2 |
)
)
| S/C Ancillary Temperatures - Daily Maximums | ||||||
|---|---|---|---|---|---|---|
| MSID | MEAN | RMS | DELTA/YR | DELTA/YR/YR | UNITS | DESCRIPTION |
| TFSSBKT1 | 327.27 | 19.59 | -1.744e+01 | -6.079e+01 | K | FSS BRACKET-1 TEMP (+Y) |
| TFSSBKT2 | 319.01 | 28.10 | -2.450e+01 | -1.022e+02 | K | FSS BRACKET-2 TEMP (+Y) |
| TSCTSF1 | 294.17 | 3.08 | 8.218e-01 | -7.075e+00 | K | SC-TS FITTING -1 TEMP |
| TSCTSF6 | 294.85 | 3.39 | 1.047e+00 | -7.456e+00 | K | SC-TS FITTING -6 TEMP |
)
)
)
)
| MUPS - Daily Maximums | ||||||
|---|---|---|---|---|---|---|
| MSID | MEAN | RMS | DELTA/YR | DELTA/YR/YR | UNITS | DESCRIPTION |
| PM1THV1T | 333.47 | 8.23 | -2.762e-01 | -1.892e+02 | K | MUPS 1 THRUSTER VALVE 01 TEMP |
| PLINE02T | 315.45 | 10.27 | 2.762e-01 | -8.293e+00 | K | PROP LINE TEMP 02 |
| PLINE03T | 314.72 | 12.70 | -7.005e-01 | -6.597e+00 | K | PROP LINE TEMP 03 |
| PLINE04T | 300.11 | 11.68 | -6.714e-01 | -1.033e+01 | K | PROP LINE TEMP 04 |
)
)
)
)
Quarterly Trends
- Spececraft Electronics
| MSID | MEAN | RMS | DELTA/YR | DELTA/YR/YR | UNITS | DESCRIPTION |
| ELBI | 58.09 | 1.53 | 3.441e+00 | 1.411e+02 | AMP | LOAD BUS CURRENT |
| ELBV | 29.61 | 0.20 | -2.344e+00 | -1.258e+01 | V | LOAD BUS VOLTAGE |
| OHRMAPWR | 58.04 | 2.65 | 2.026e+01 | -1.394e+01 | W | HRMA COMPUTED TOTAL POWER |
| OOBAPWR | 51.42 | 4.14 | 2.357e+01 | 1.528e+02 | W | OBA COMPUTED TOTAL POWER |
)
)
)
)
- OBA Heaters
| MSID | MEAN | RMS | DELTA/YR | DELTA/YR/YR | UNITS | DESCRIPTION |
| OOBTHR04 | 290.74 | 0.97 | -5.140e+00 | 2.010e+01 | K | RT 27: HRMA STRUT |
| OOBTHR18 | 288.43 | 1.48 | -8.049e+00 | 5.006e+01 | K | RT 40: OBA CONE |
| OOBTHR31 | 285.61 | 3.62 | -1.525e+01 | 2.525e+02 | K | RT 53: OBA AFT BULKHEAD |
| OOBTHR44 | 289.01 | 1.21 | -5.677e+00 | 9.549e+00 | K | RT 66: TFTE COVER |
| OOBTHR56 | 295.58 | 1.92 | -8.625e+00 | 5.949e+01 | K | RT 158: OBA CONE |
)
)
)
)
)
- HRMA Heaters
| MSID | MEAN | RMS | DELTA/YR | DELTA/YR/YR | UNITS | DESCRIPTION |
| OHRTHR02 | 295.31 | 6.334e-03 | -1.816e-02 | -1.282e-01 | K | RT 2: HRMA FORWARD APERTURE PLATE |
| OHRTHR04 | 295.31 | 2.183e-03 | -3.648e-03 | -2.822e-02 | K | RT 9: HRMA PRECOLLIMATOR PLATE 10 |
| OHRTHR21 | 295.28 | 2.843e-03 | -7.710e-03 | -3.234e-02 | K | RT 3: HRMA FOWARD APERTURE PLATE |
| OHRTHR22 | 295.26 | 1.196e-03 | -7.434e-03 | -4.774e-02 | K | RT 6: HRMA FOWARD APERTURE PLATE |
| OHRTHR23 | 295.26 | 2.441e-03 | -1.472e-02 | 1.673e-01 | K | RT 8: HRMA PRECOLLIMATOR PLATE 10 |
| OHRTHR44 | 295.29 | 1.963e-03 | -8.060e-03 | -1.272e-02 | K | RT 1: HRMA FORWARD APERTURE PLATE |
| OHRTHR45 | 295.26 | 1.083e-03 | -3.085e-03 | -6.455e-02 | K | RT 4: HRMA FORWARD APERTURE PLATE |
| OHRTHR46 | 295.27 | 1.891e-03 | -1.781e-02 | 4.581e-02 | K | RT 7: HRMA FORWARD APERTURE PLATE |
)
)
)
)
)
)
)
)
Spacecraft Motions
|
|
Reaction Wheel Rotations
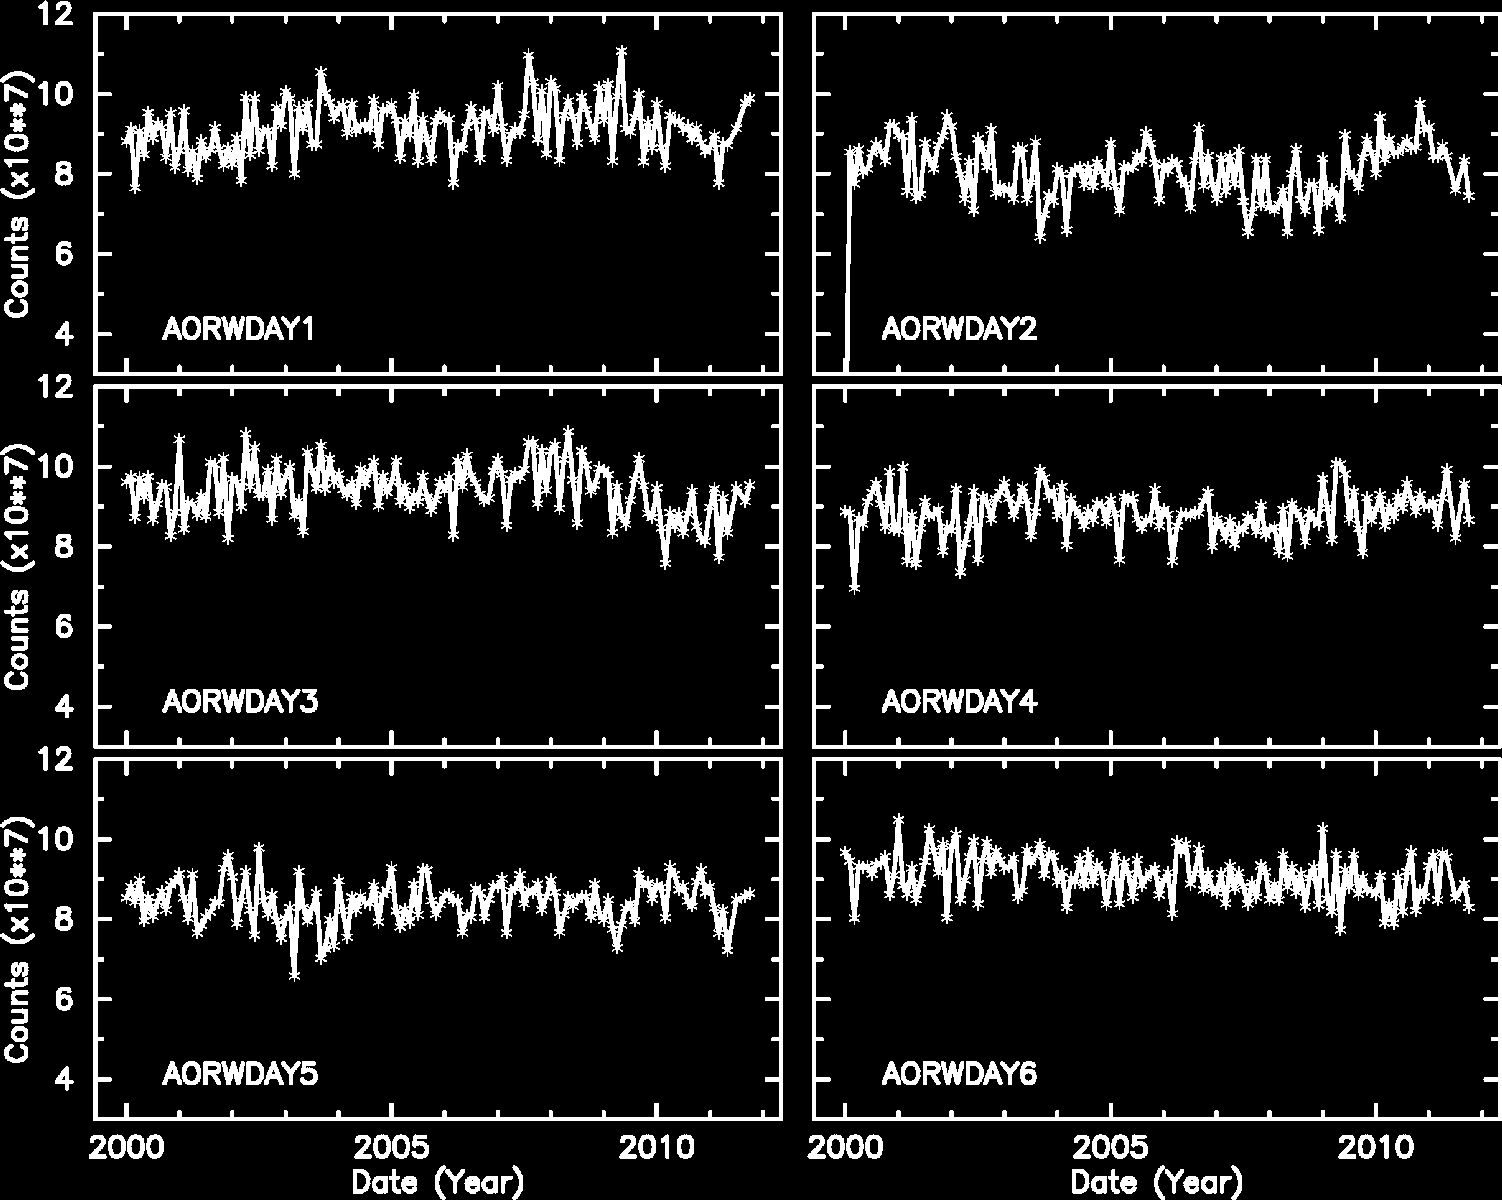
Note: From Feb 2010, the computation of reaction wheel rotations are slightly modified.
Links to Past Monthly Reports
| Year | Month | |||||||||||
|---|---|---|---|---|---|---|---|---|---|---|---|---|
| 1999 | Jul | Aug | Sep | Oct | Nov | Dec | ||||||
| 2000 | Jan | Feb | Mar | Apr | May | Jun | Jul | Aug | Sep | Oct | Nov | Dec |
| 2001 | Jan | Feb | Mar | Apr | May | Jun | Jul | Aug | Sep | Oct | Nov | Dec |
| 2002 | Jan | Feb | Mar | Apr | May | Jun | Jul | Aug | Sep | Oct | Nov | Dec |
| 2003 | Jan | Feb | Mar | Apr | May | Jun | Jul | Aug | Sep | Oct | Nov | Dec |
| 2004 | Jan | Feb | Mar | Apr | May | Jun | Jul | Aug | Sep | Oct | Nov | Dec |
| 2005 | Jan | Feb | Mar | Apr | May | Jun | Jul | Aug | Sep | Oct | Nov | Dec |
| 2006 | Jan | Feb | Mar | Apr | May | Jun | Jul | Aug | Sep | Oct | Nov | Dec |
| 2007 | Jan | Feb | Mar | Apr | May | Jun | Jul | Aug | Sep | Oct | Nov | Dec |
| 2008 | Jan | Feb | Mar | Apr | May | Jun | Jul | Aug | Sep | Oct | Nov | Dec |
| 2009 | Jan | Feb | Mar | Apr | May | Jun | Jul | Aug | Sep | Oct | Nov | Dec |
| 2010 | Jan | Feb | Mar | Apr | May | Jun | Jul | Aug | Sep | Oct | Nov | Dec |
| 2011 | Jan | Feb | Mar | Apr | May | Jun | Jul | Aug | ||||