ACIS
ACIS DOSE Registered-Photon-Map
The steps we took to compute the dose map are;
- Level 1 Event files for a specified month are obtained from archive.
- Image data including I2, I3, S2, S3 CCDs are extracted from all event files.
- All the extracted image data were merged to create a month long exposure map for the month.
- The exposure map is opened with ds9, and check a distribution of count rates against energy. From this, estimate the upper threshold value. Any events beyond this upper threshold are assumed erroneous events such as bad pixels.
- Using this upper threshold, the data is filtered, and create a cleaned exposure map for the month.
- The exposure map from each month from the Sep 1999 is added up to create a cumulative exposure map for each month.
- Using fimgstatistic, we compute count rate statistics for each CCDs.
- For observations with high data drop rates (e.g., Crab nebula, Cas A), we corrected the observations by adding events.
-
Note: Counts and RMS's of Cumulative maps are lower than the previous months.
This is because we excluded extreme outliers.
Please check more detail plots at Telemetered Photon Dose Trend page.
)
)
)
Statistics:
# IMAGE     NPIX        MEAN           RMS              MIN     MAX
ACIS_nov11 6004901       9.058         17.634           0.0     460

 I2 node 0  262654      7.546707        3.380483        0.0      73.0
 I2 node 1  262654      7.987824        4.263040        0.0     343.0
 I2 node 2  262654      7.790173        3.319859        0.0      74.0
 I2 node 3  262654      7.797150        3.697619        0.0      52.0

 I3 node 0  262654      8.287295        3.508768        0.0      46.0
 I3 node 1  262654      8.754387        8.378423        0.0     200.0
 I3 node 2  262654      7.976012        3.338361        0.0      60.0
 I3 node 3  262654      8.033993        3.463662        0.0     322.0

 S2 node 0  262654      7.599410        3.285971        0.0     332.0
 S2 node 1  262654      8.336014        3.723048        0.0      61.0
 S2 node 2  262654      11.233012       6.141524        0.0      86.0
 S2 node 3  262654      14.245922       9.140655        0.0     400.0

 S3 node 0  262654      37.900483       60.664797       0.0     455.0
 S3 node 1  262654      22.475265       13.998799       0.0     132.0
 S3 node 2  262654      14.816701       4.850877        1.0      43.0
 S3 node 3  262654      12.384925       3.847230        0.0      58.0
)
)
)
Statistics:
 IMAGE        NPIX      MEAN             RMS            MIN    MAX
ACIS_total  6004901    1558.16          2089.50        0.0    93843

 I2 node 0  262654      1286.277359     248.547733      0.0     6481.0
 I2 node 1  262654      1357.848424     334.152285      0.0     27251.0
 I2 node 2  262654      1392.026421     301.460012      0.0     8886.0
 I2 node 3  262654      1387.511459     354.533338      0.0     27682.0

 I3 node 0  262654      1454.484348     354.564128      0.0     6480.0
 I3 node 1  262654      1526.192764     1152.432690     0.0     29647.0
 I3 node 2  262654      1326.925804     240.949997      0.0     6326.0
 I3 node 3  262654      1313.059906     256.701563      0.0     23486.0

 S2 node 0  262654      1863.048376     258.740972      968.0   20139.0
 S2 node 1  262654      1981.718277     426.764155      1002.0  10903.0
 S2 node 2  262654      2200.285206     416.779169      1306.0  15762.0
 S2 node 3  262654      2129.686353     307.509956      1250.0  33503.0

 S3 node 0  262654      3243.428592     1636.398562     1345.0  13026.0
 S3 node 1  262654      4423.254155     1952.016100     0.0     13517.0
 S3 node 2  262654      3348.875850     904.854870      1267.0  8365.0
 S3 node 3  262654      2578.820755     415.951163      1440.0  9408.0
)
|
)
|
)
|
)
|
| Aug 2011 | May 2011 | Feb 2011 | Nov 2010 |
|---|
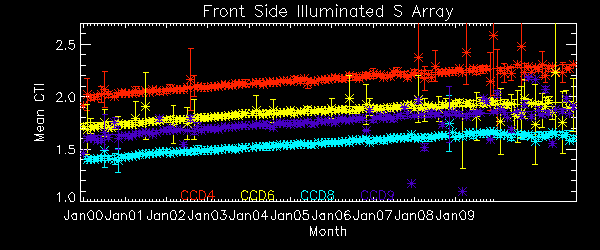
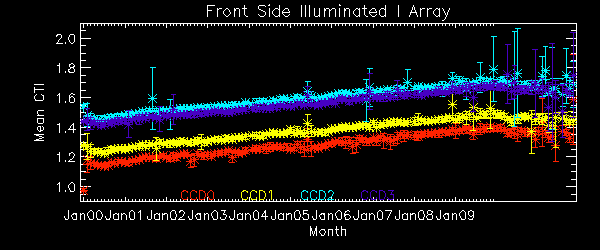
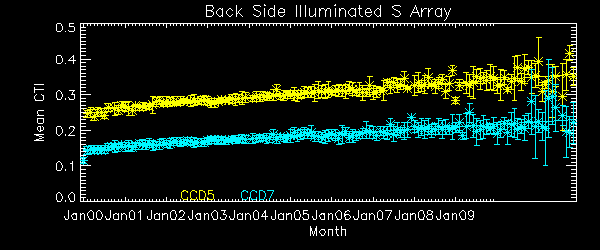
The Mean Detrended CTI
We report CTIs with a refined data definition. CTIs were computed for the temperature dependency corrected data. Please see CTI page for detailed explanation. CTI's are computed for Mn K alpha, and defined as slope/intercept x10^4 of row # vs ADU. Data file: here
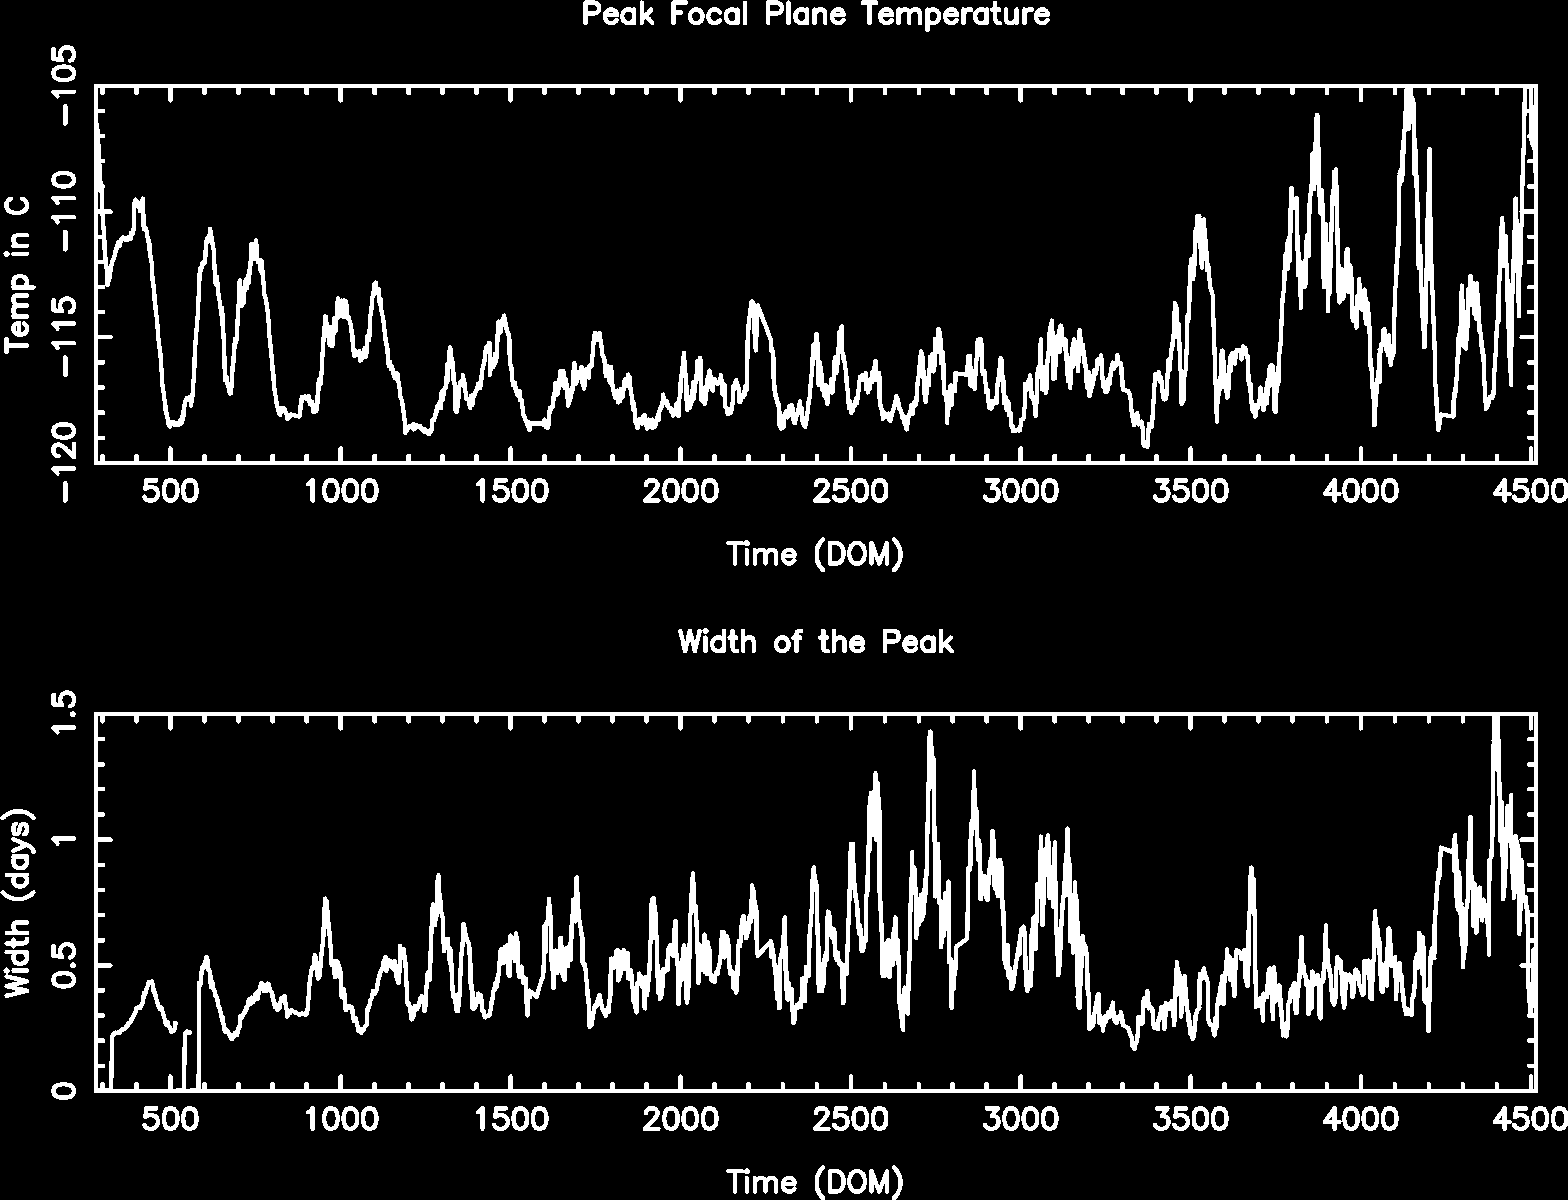
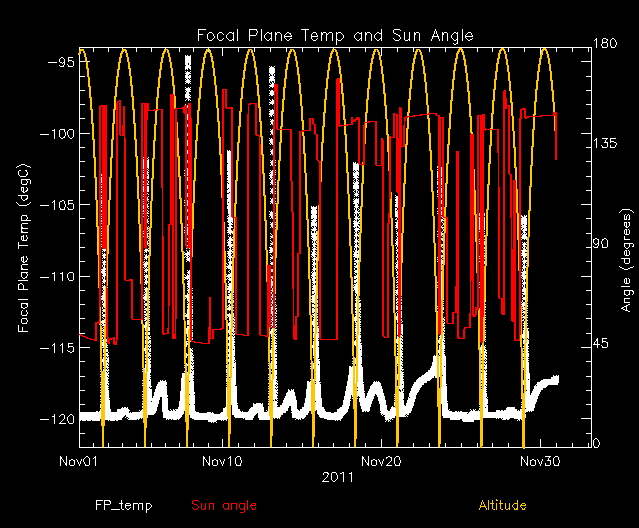
Focal Plane Temperature
Nov 2011 Focal Temperature
| The Mean (max) FPT: | |
|---|---|
| -106.55 | +/- 7.34 C |
| Mean Width: | |
| 0.53 | +/- 0.52 days |
Averaged Focal Plane Temperature
We are using 10 period moving averages to show trends of peak temperatures and peak widths. Note, the gaps in the width plot are due to missing/corrupted data.
Focal Plane Temperature, Sun Angle and Altitude
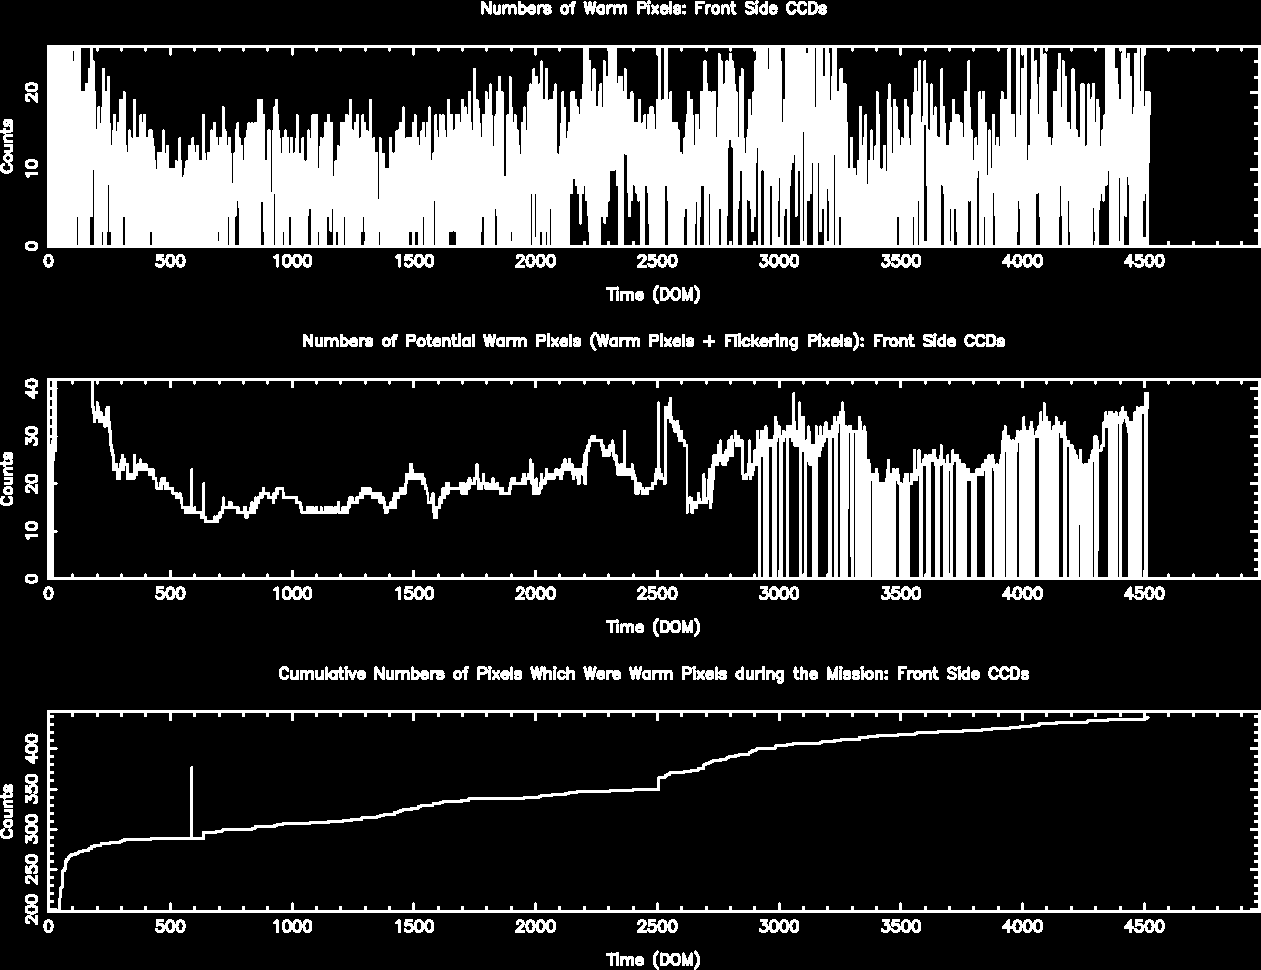
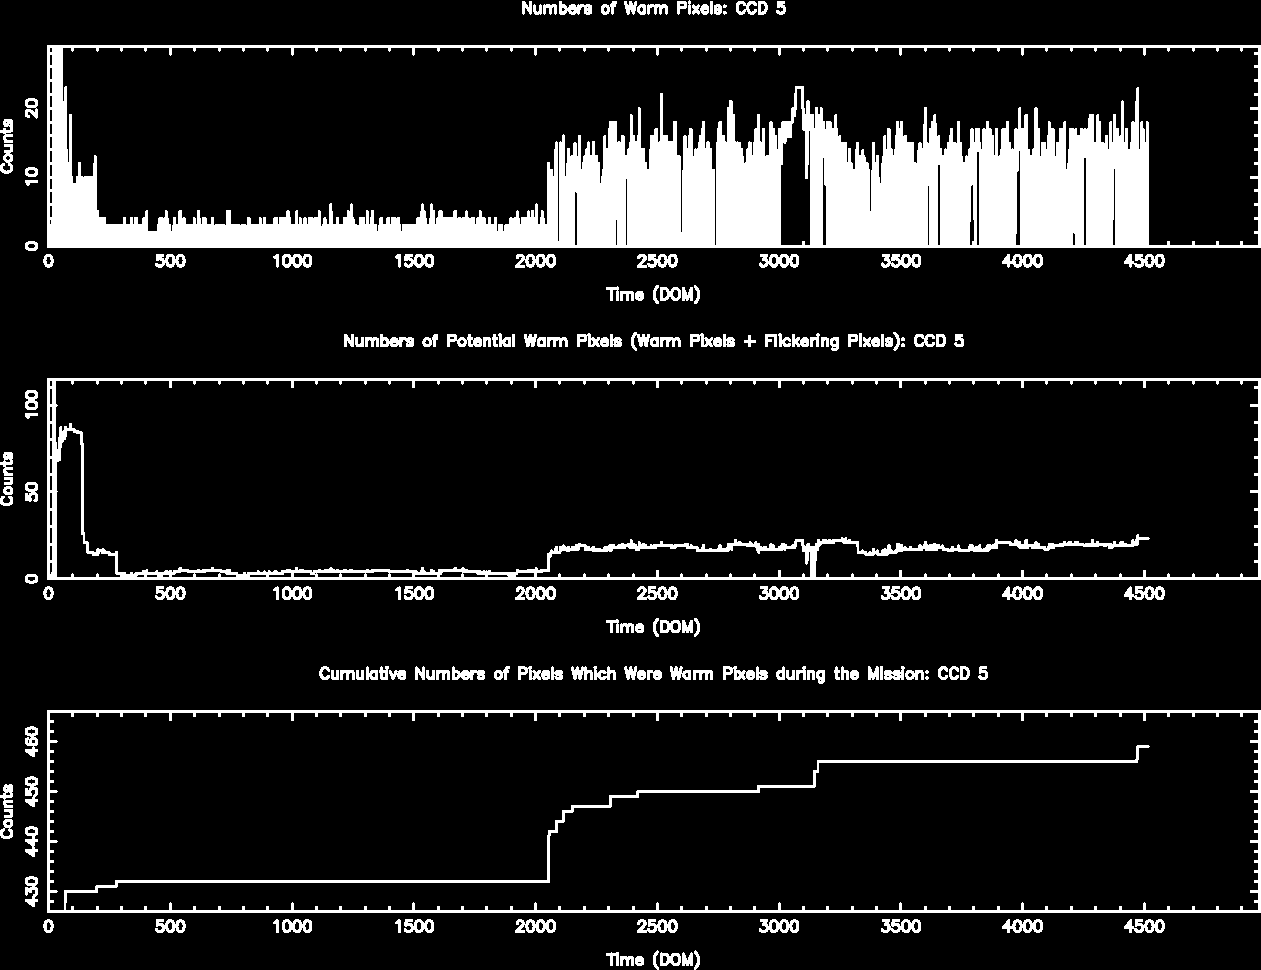
Bad Pixels
The plots below were generated with a new warm pixel finding script. Please see Acis Bad Pixel Page for details.
Front Side CCDs
Back Side CCD (CCD5)
### -->
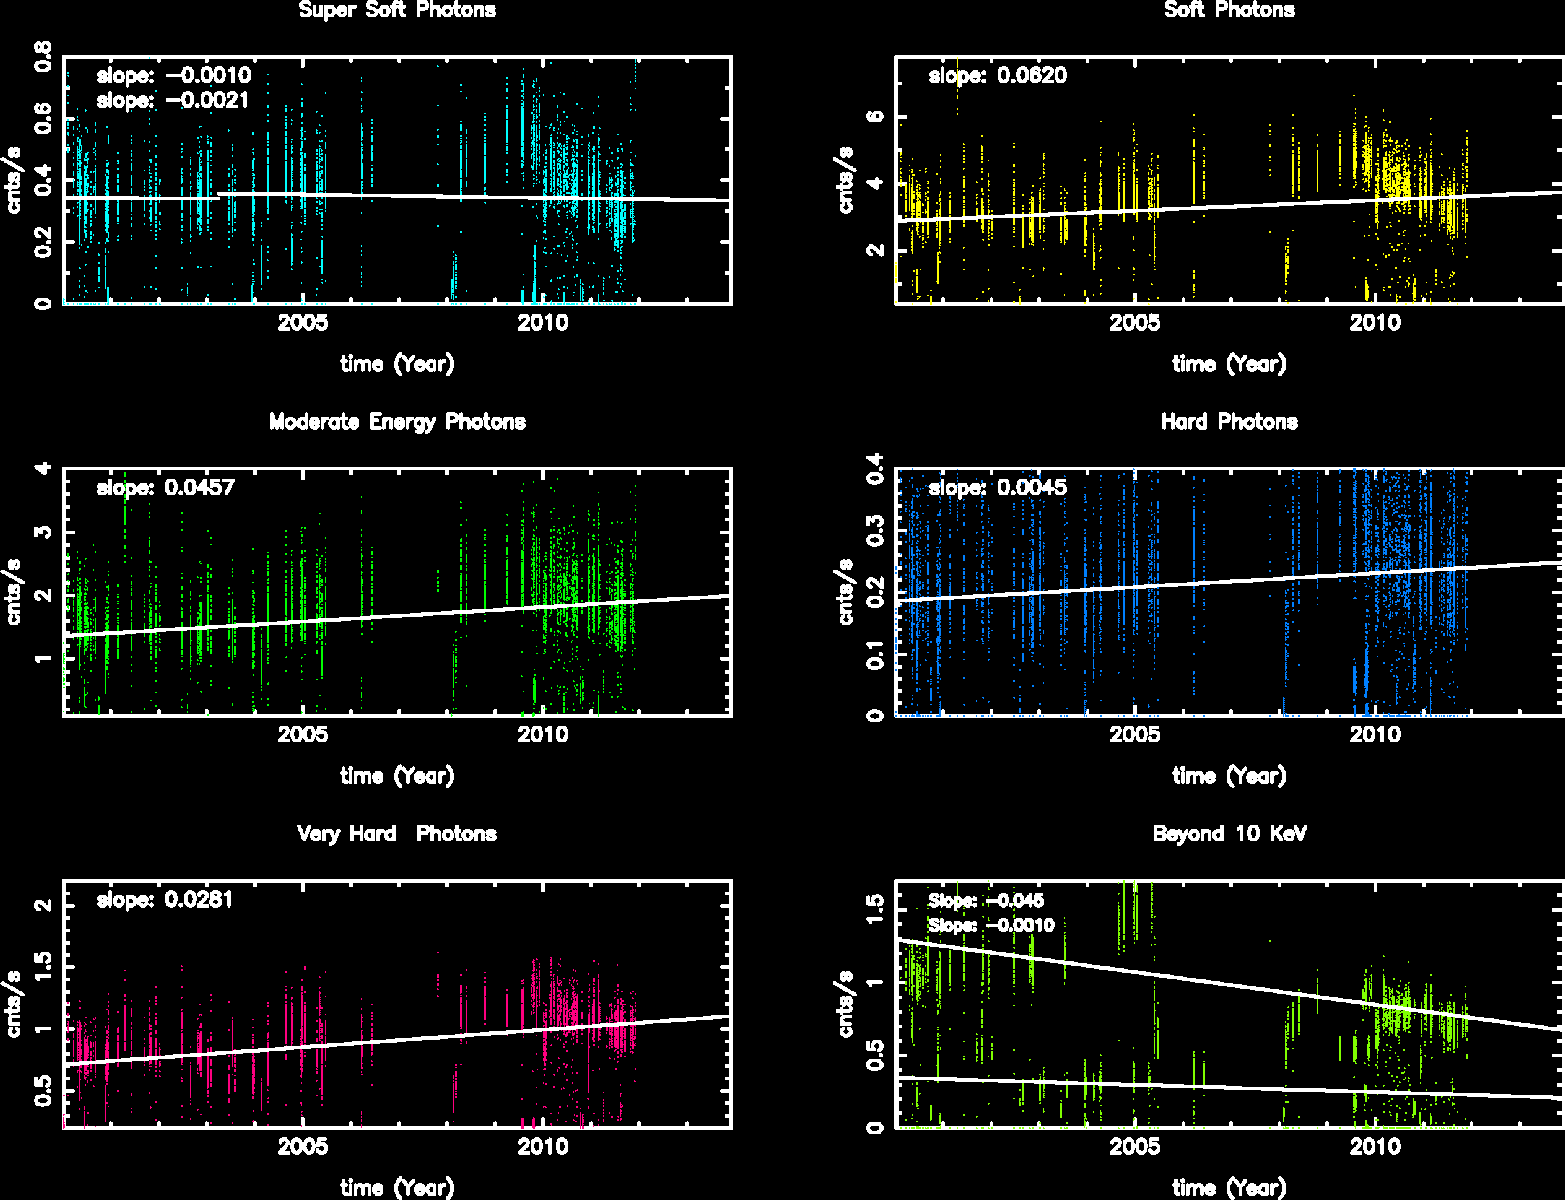
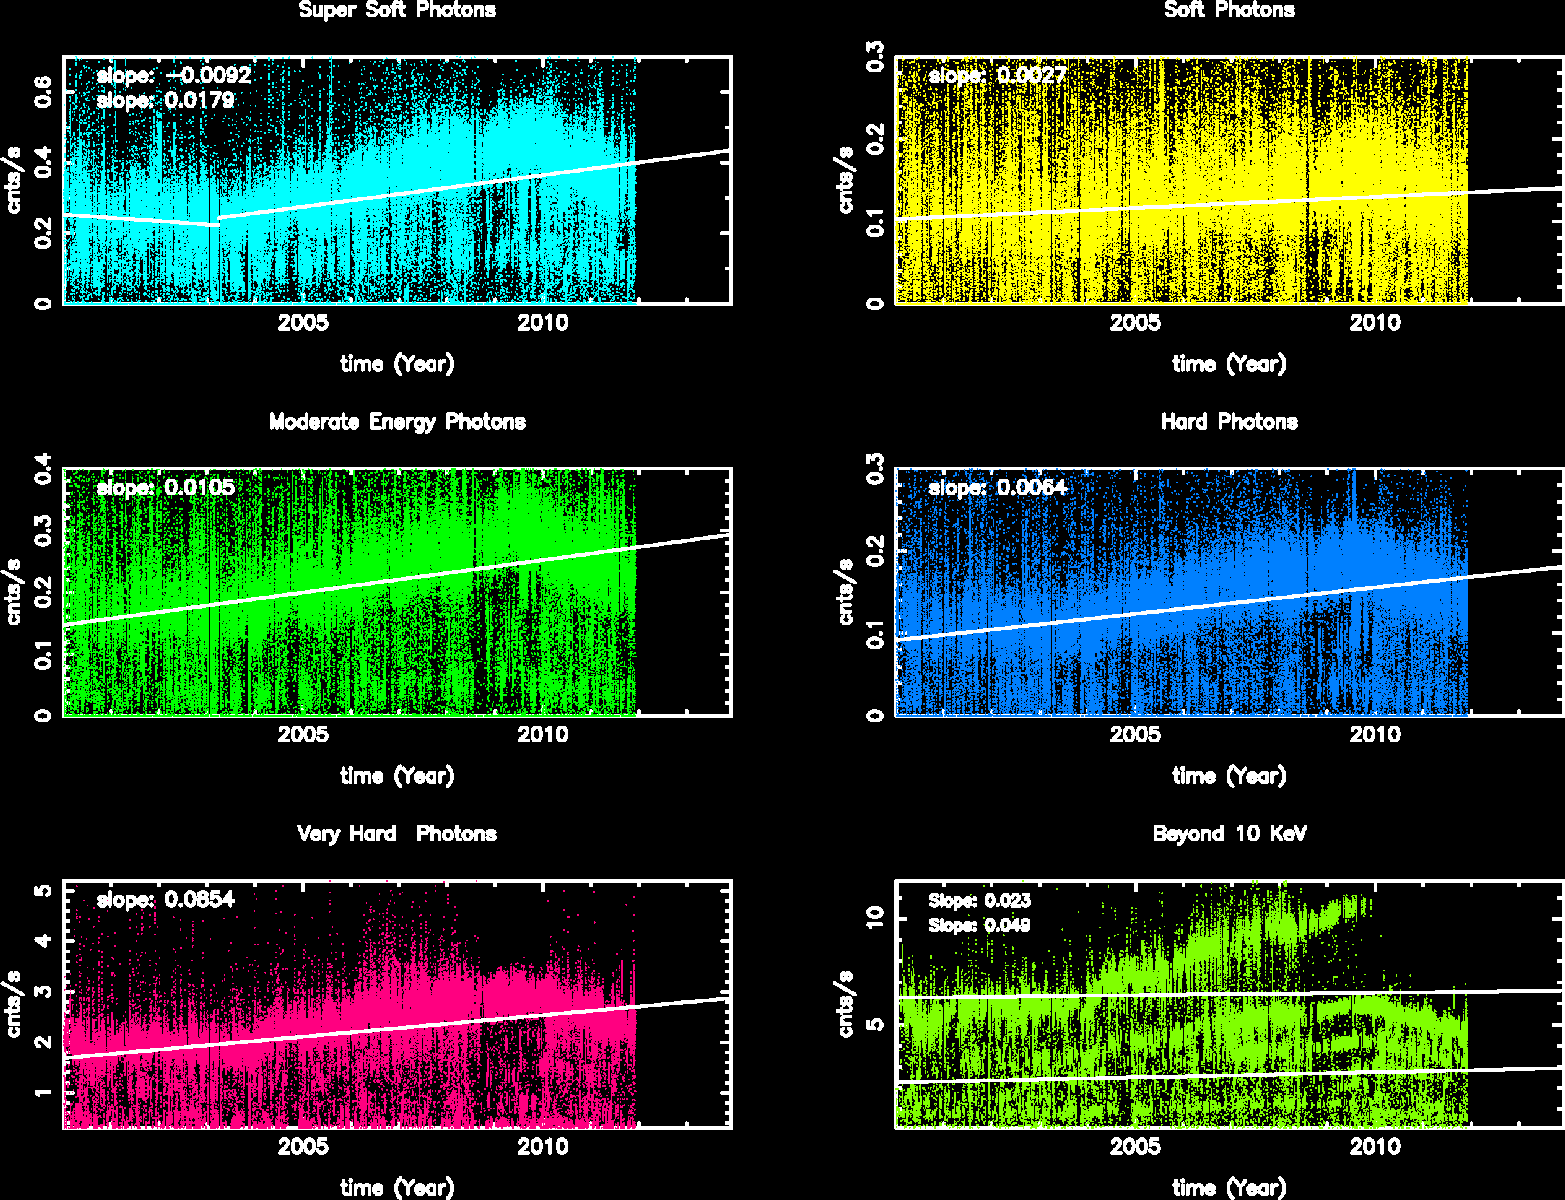
Science Instrument Background Rates
| Name | Low (keV) | High(KeV) | Description |
|---|---|---|---|
| SSoft | 0.00 | 0.50 | Super soft photons |
| Soft | 0.50 | 1.00 | Soft photons |
| Med | 1.00 | 3.00 | Moderate energy photons |
| Hard | 3.00 | 5.00 | Hard Photons |
| Harder | 5.00 | 10.00 | Very Hard photons |
| Hardest | 10.00 | Beyond 10 keV |
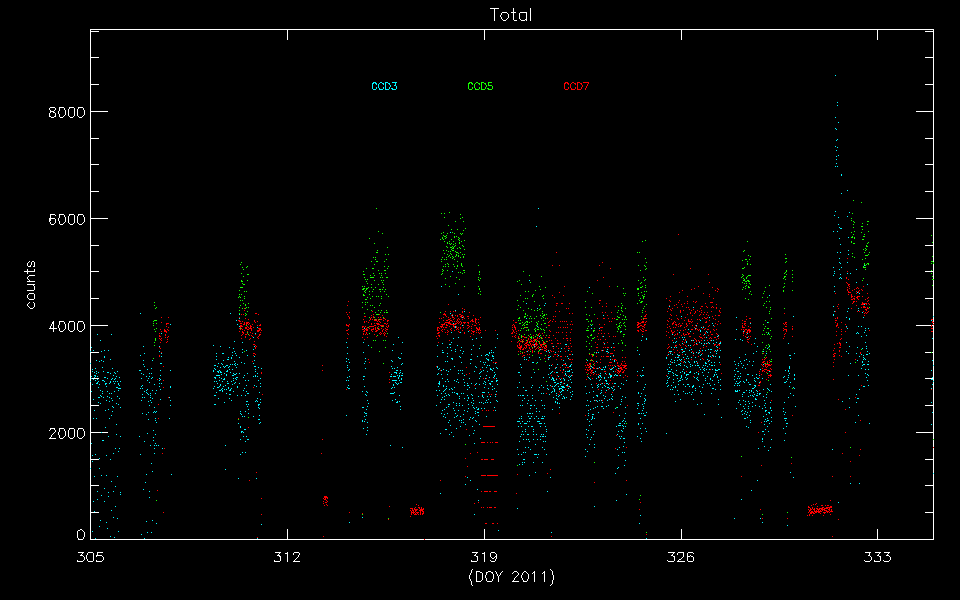
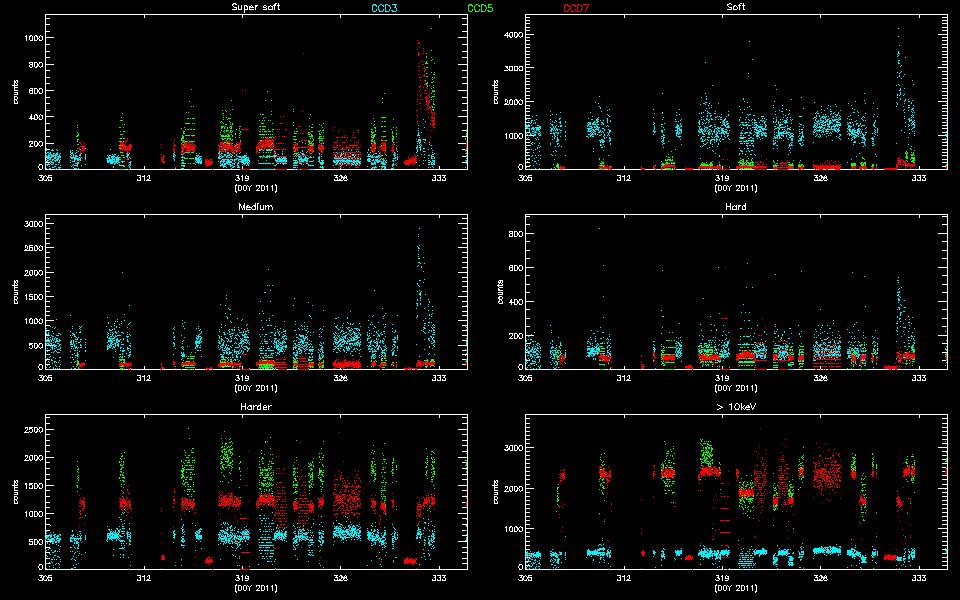
The following three plots show trends of SIB from year 2000. CCDs shown here are CCD3, CCD5, and CCD7. Fitted lines are linear fit after eliminating extreme outliers. For >10 keV plots, 2 lines are fit. One is with a 13 keV filter, and another without.
CCD 3
CCD 5

CCD 7
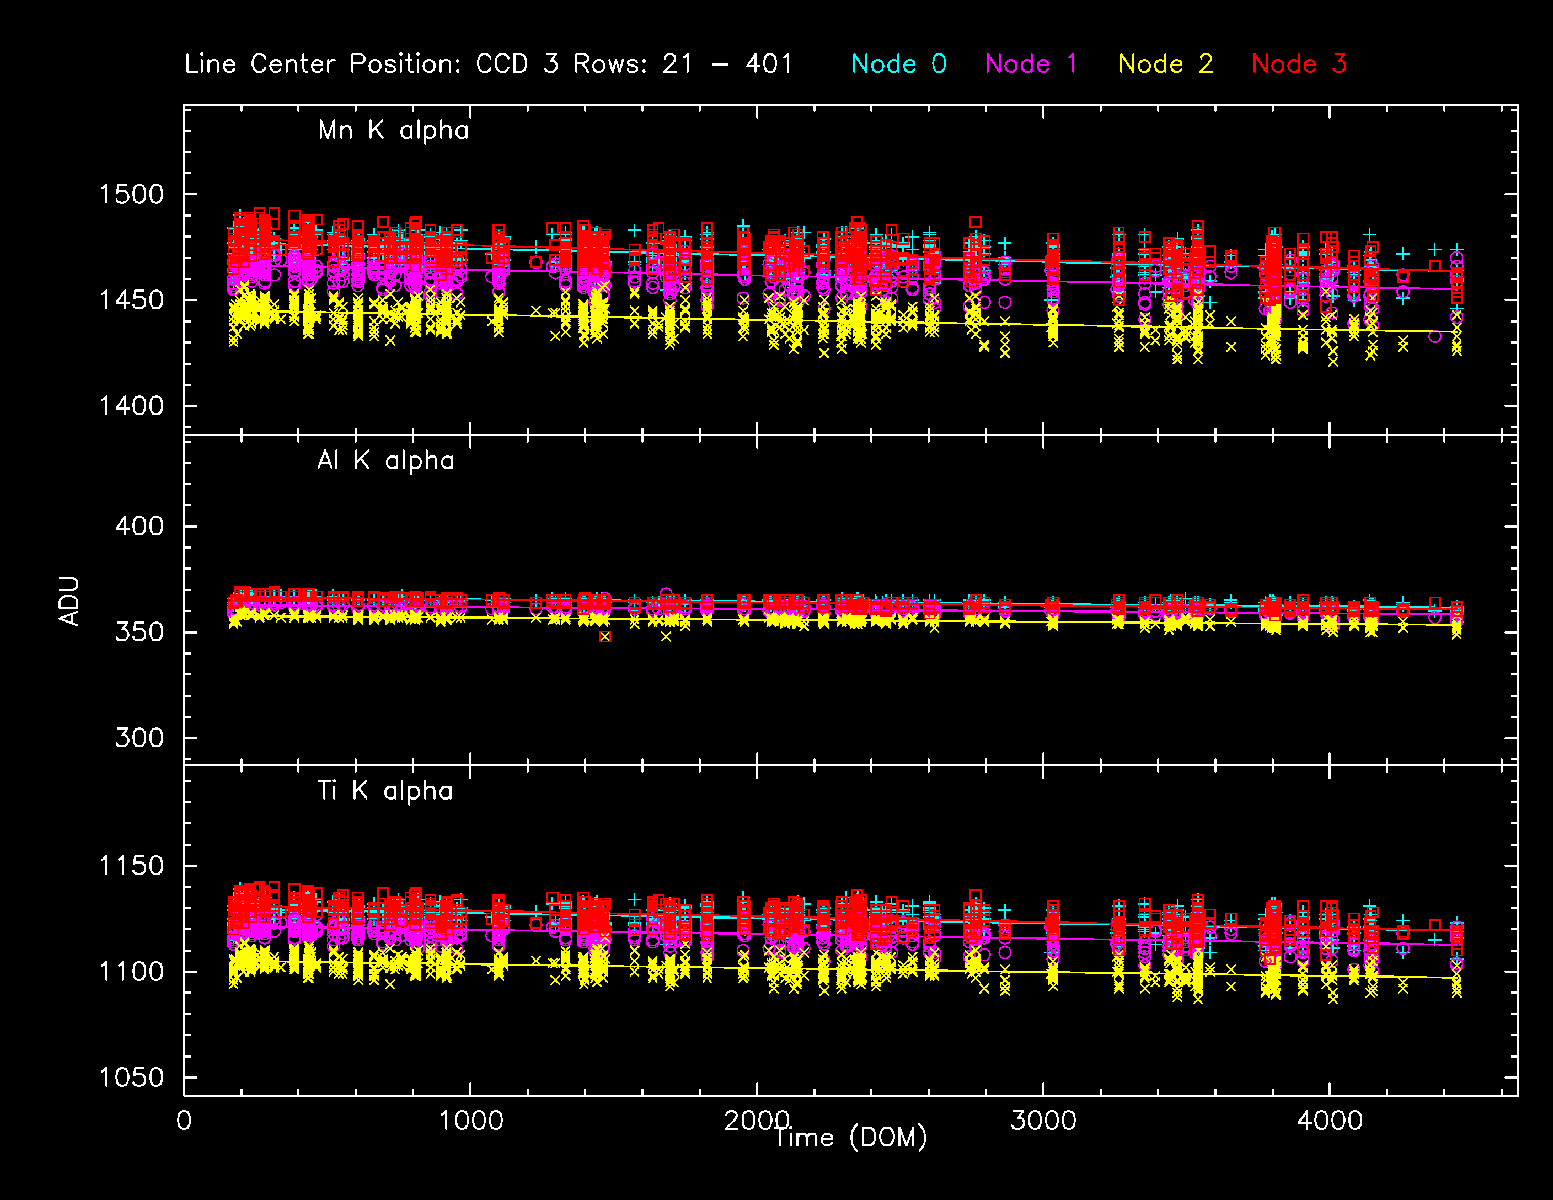
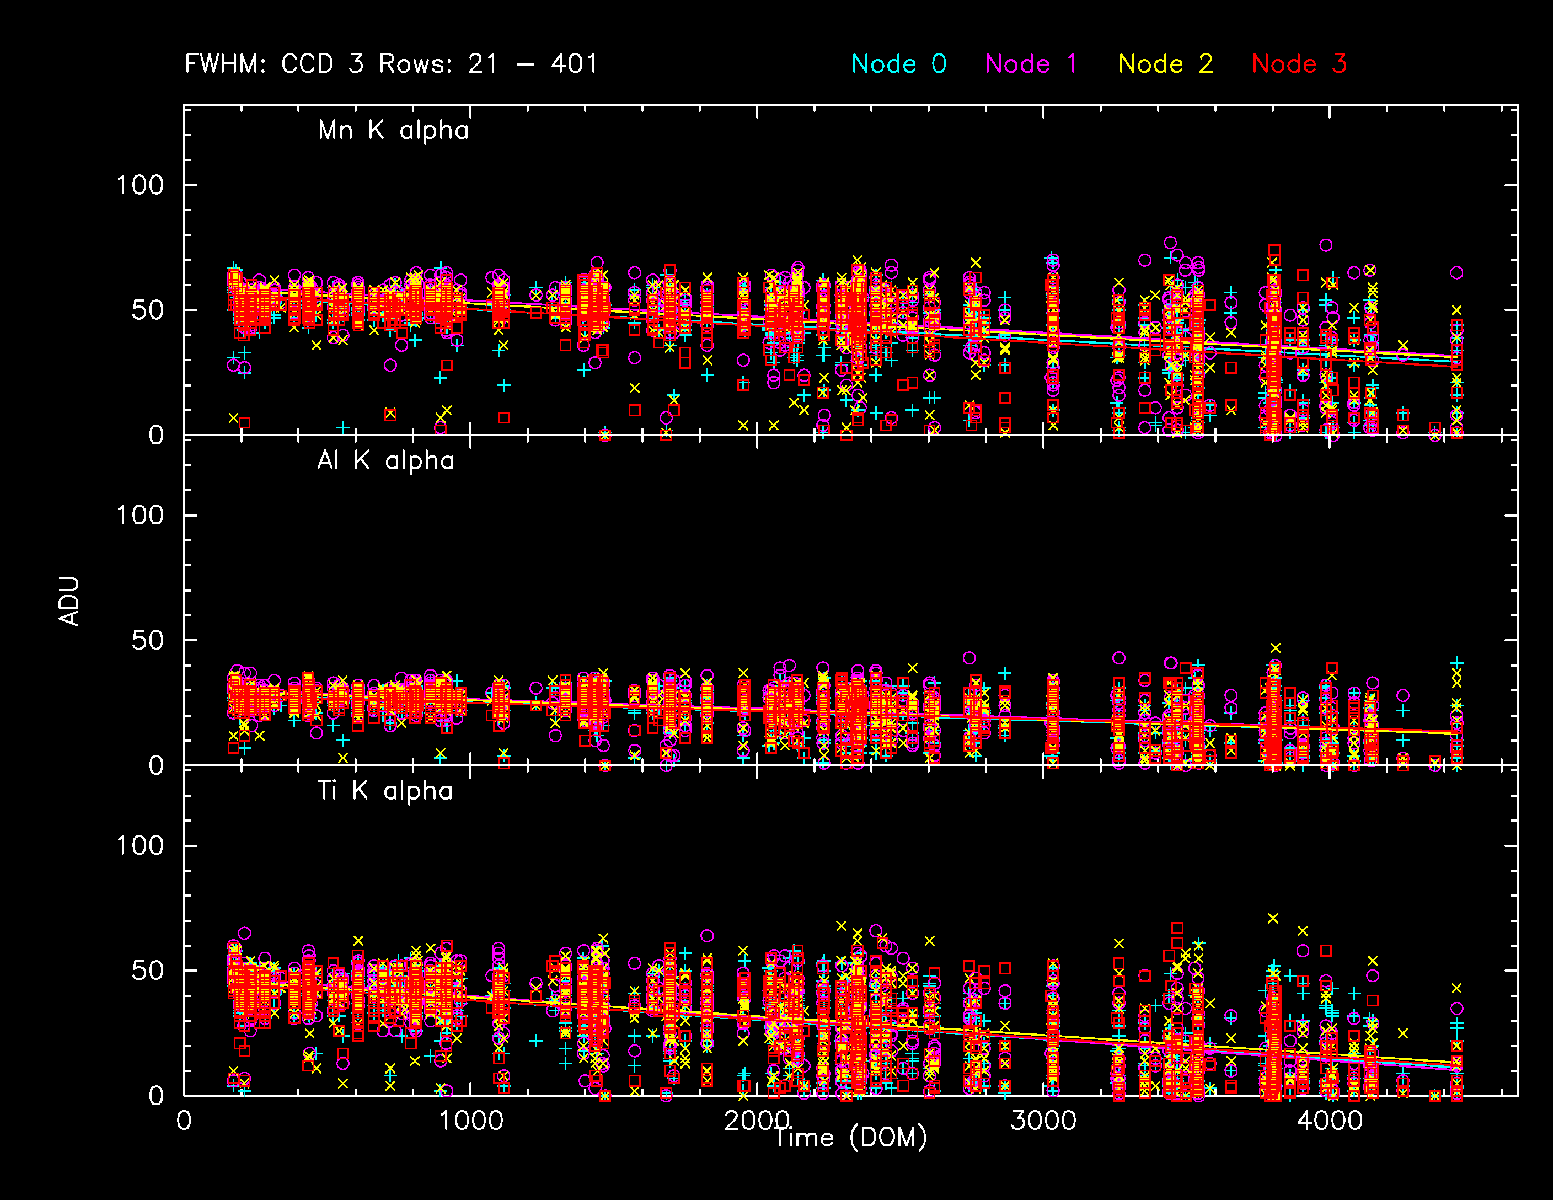
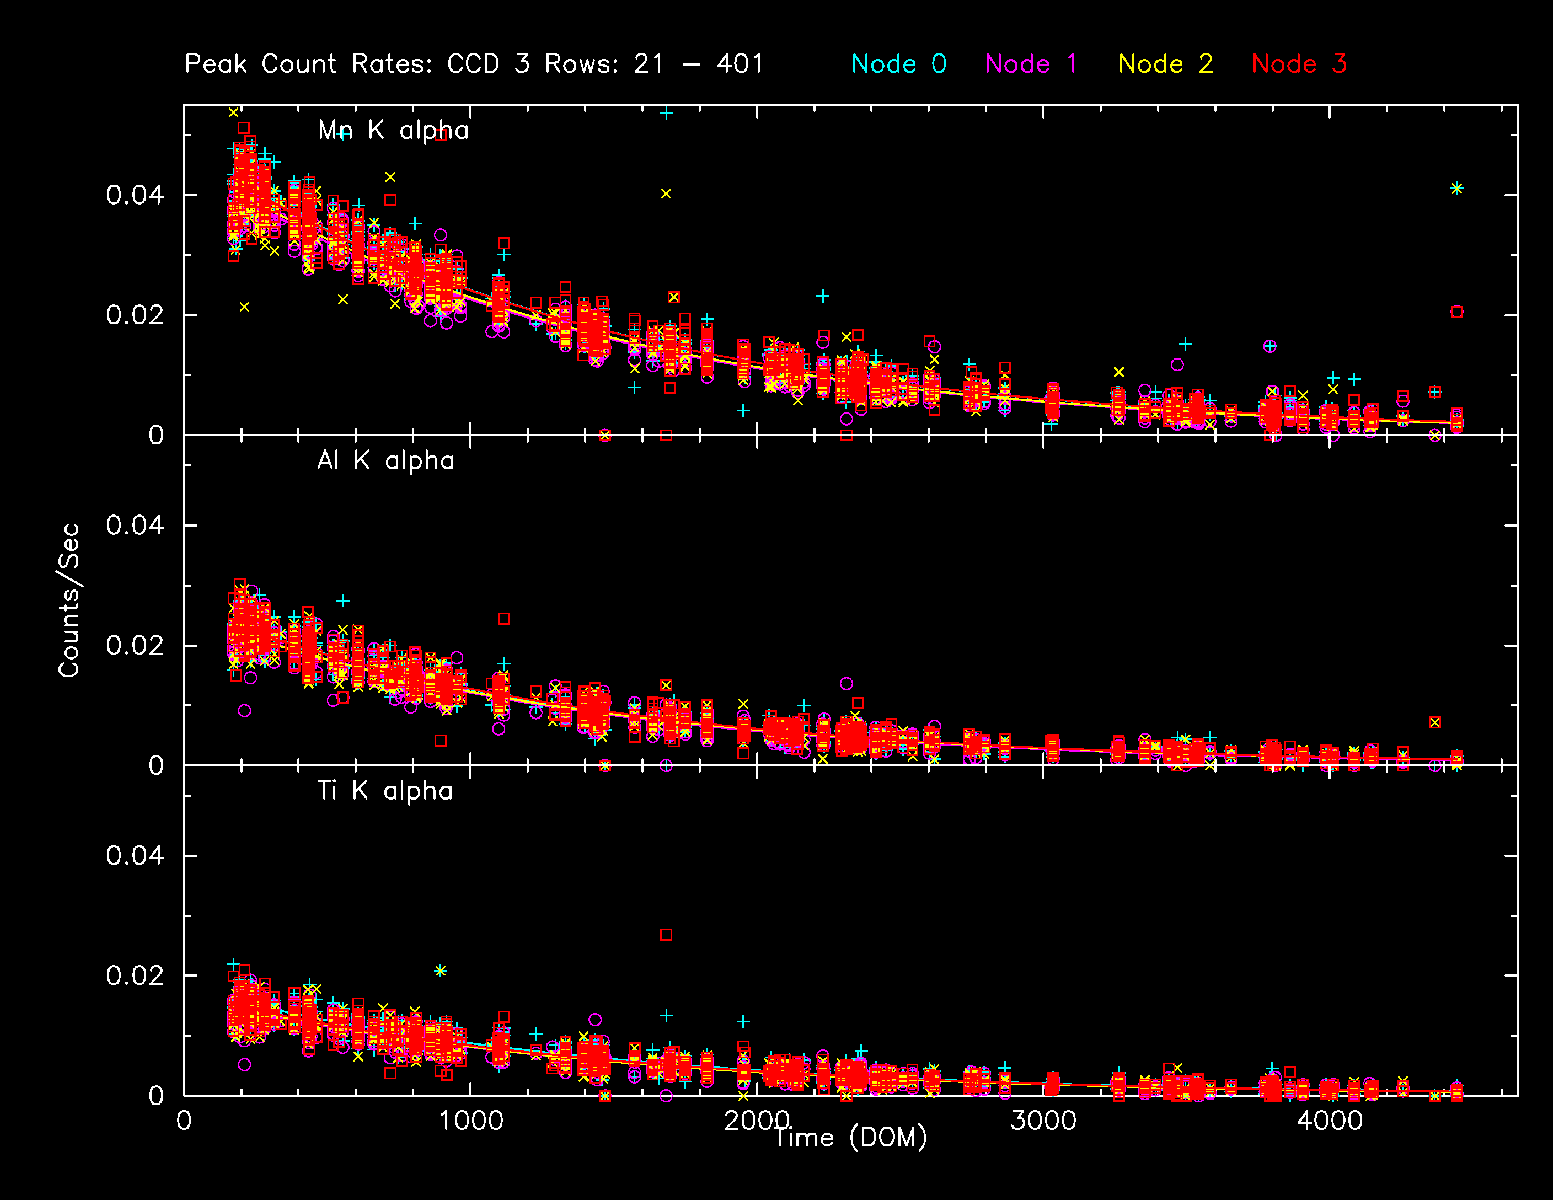
ACIS Histogram Mode Trends
We collected data from acis histogram mode data, and created trend plots of peak portions and peak widths against time (DOM). The peaks were estimated by fitting a simple Gaussian on three peaks (Al, Ti, and Mn), and the widths were estimated by a width at the half max from the peak.
All histogram data are taken under TIMED and GRADED_HIST mode, SIM position is at an external calibration source position, the focal temperature is around -119.7 C, and parameter settings in aciselec, acistemp are set to about same for all.
CCD 3, Peak Position
CCD 3, Peak Widths
CCD 3, Count Rates
HRC
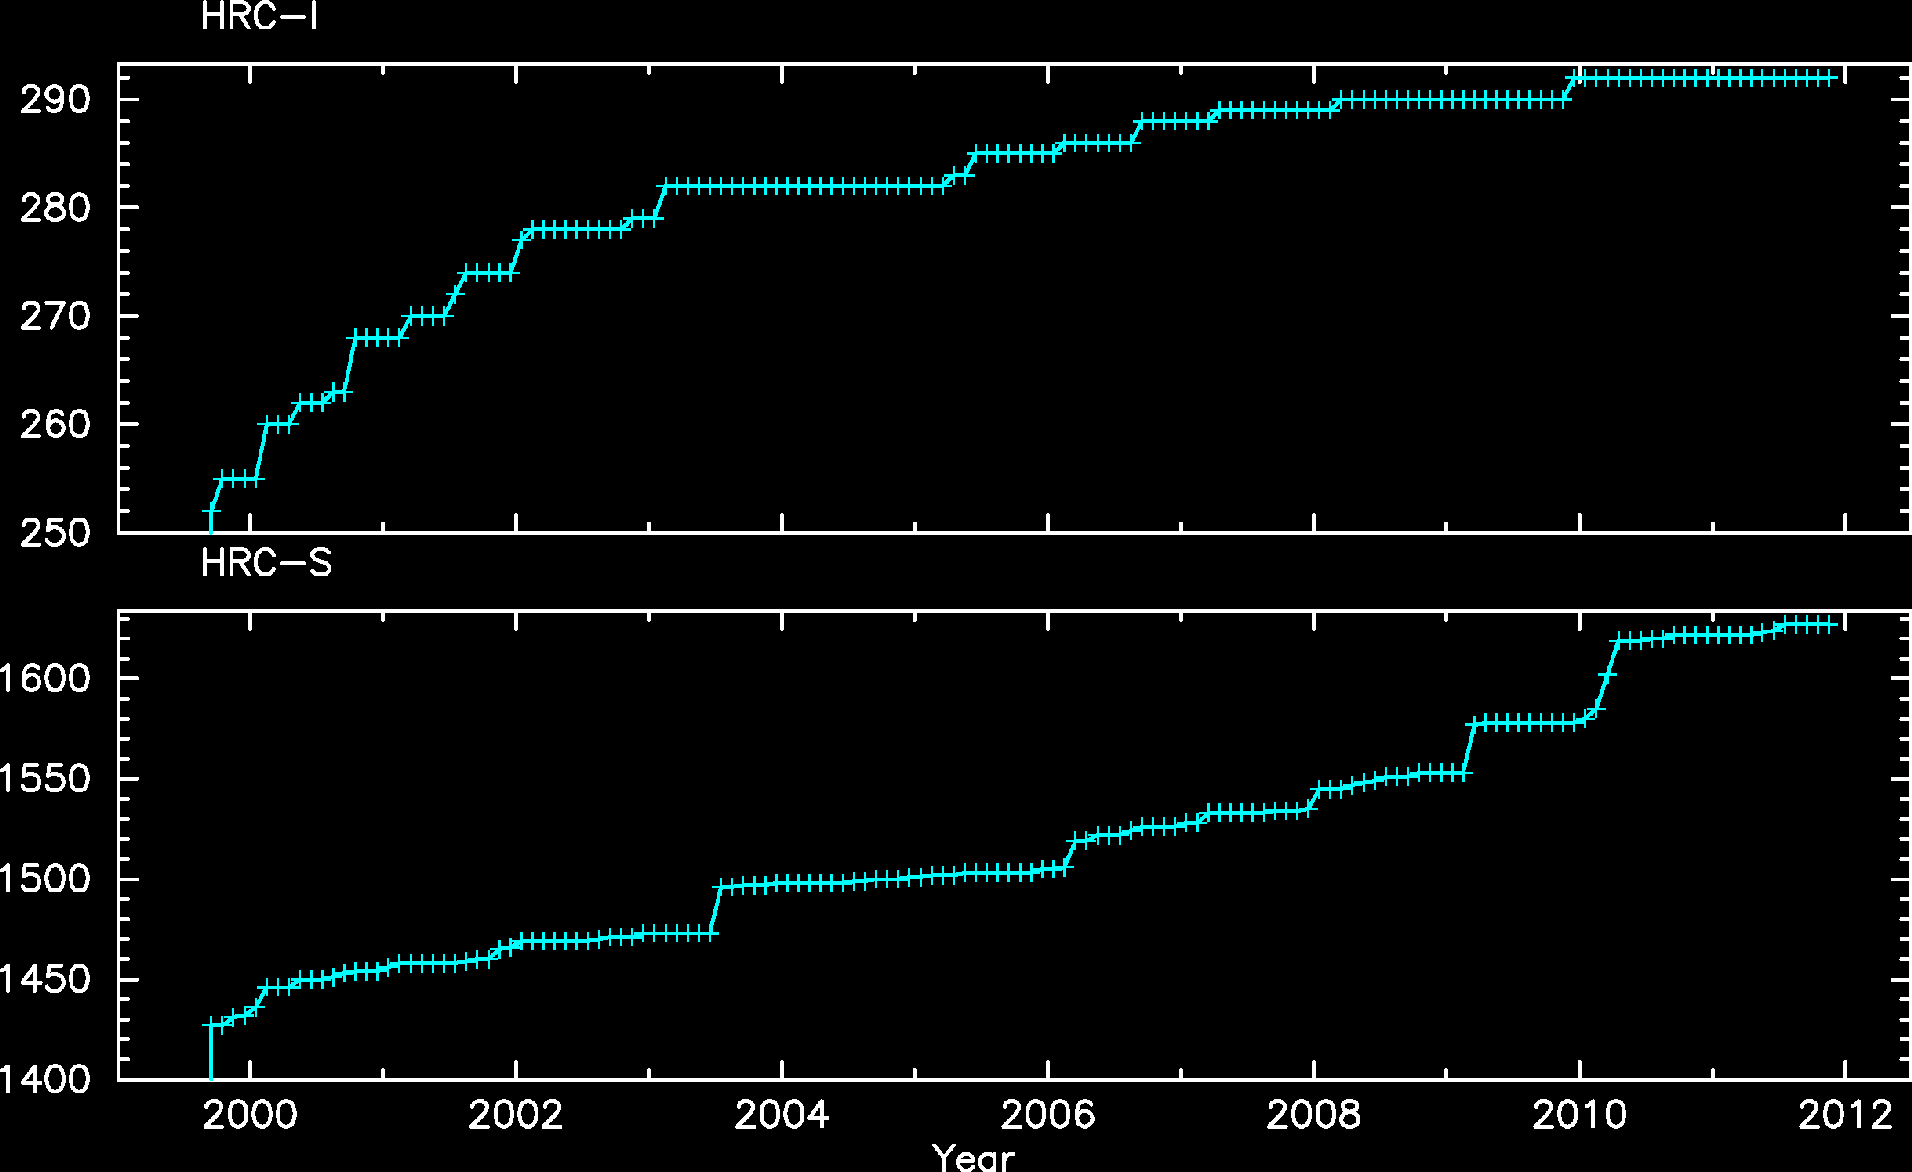
DOSE of Central 4K Pore-Pairs
Please refer to Maximum Dose Trends for more details.
)
        IMAGE                NPIX      MEAN    STDDEV      MIN       MAX
HRCI_08_1999_11_2011.fits  16777216   3.565    4.392       0.0       292.0
)
        IMAGE                NPIX      MEAN    STDDEV      MIN       MAX
HRCS_11_2011.fits          16777216   0.035    0.191       0.0       1.0
)
        IMAGE                NPIX     MEAN      STDDEV      MIN      MAX
HRCS_08_1999_11_2011.fits  16777216  13.802      22.931      0.0      1627.0
|
|
Max dose trend plots corrected for events that "pile-up"
in the center of the taps due to bad position information.
|
)
|
)
|
)
|
)
|
| Aug 2011 | May 2011 | Feb 2011 | Nov 2010 |
|---|
)
|
)
|
)
|
)
|
| Aug 2011 | May 2011 | Feb 2011 | Nov 2010 |
|---|
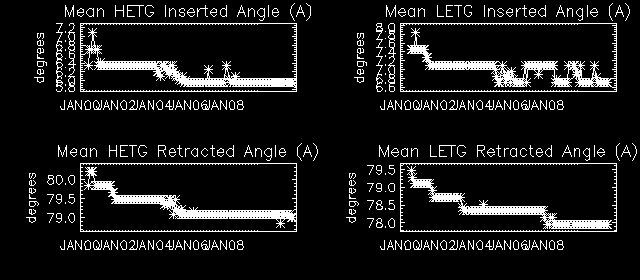
Gratings
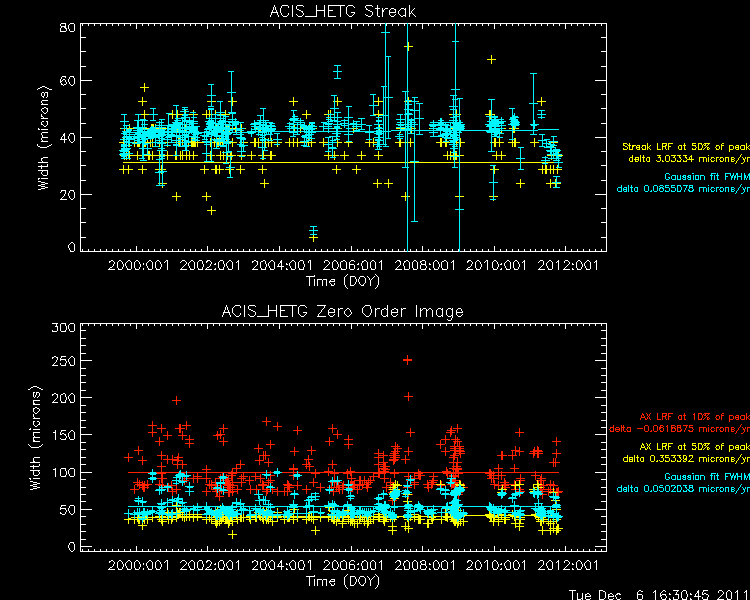
Focus
We plot the width of the zero order streak of ACIS/HETG observations and the width of the zero order image for HRC/LETG observations of point sources. No significant defocusing trend is seen at this time. See Gratings Focus pages. (NOTE: the figures are not updated from Mar 2009 due to a system problem.)
PCAD
ACA Trending
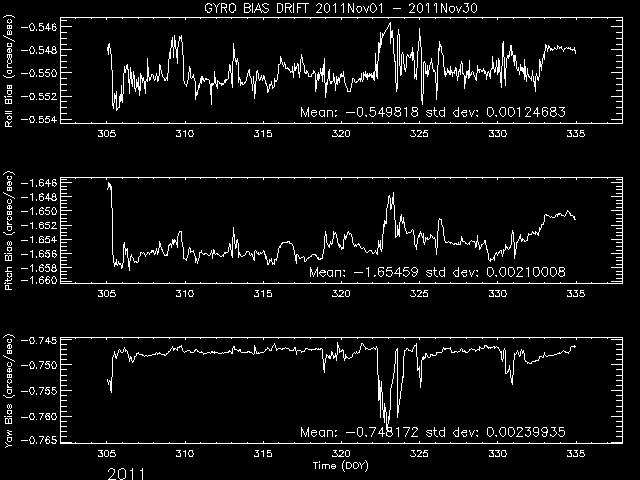
Gyro Bias Drift
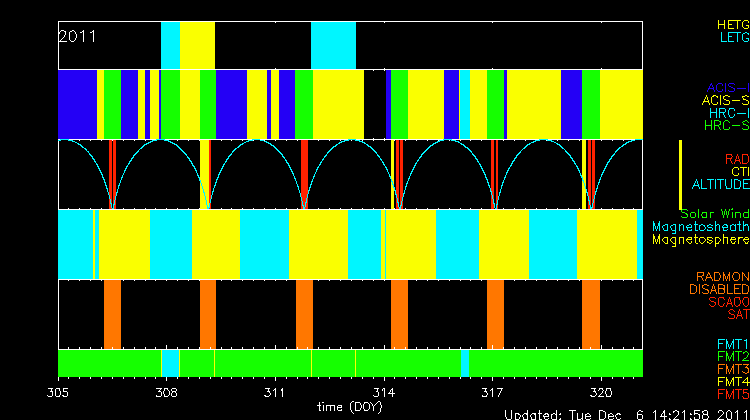
Radiation History
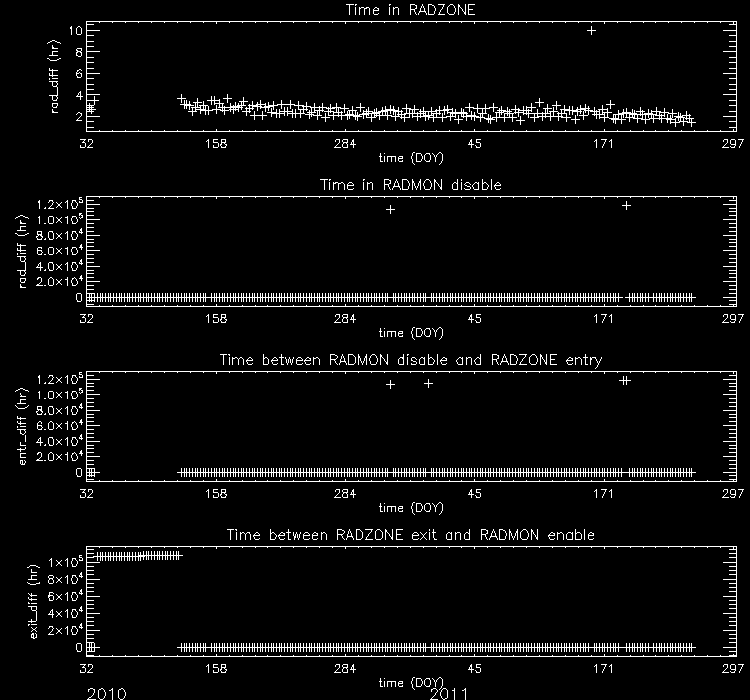
Radiation Zone Timing
Plotted below are radiation zone timing plots based on the following definitions of radiation zone:
- RADZONE - Ephin levels (in any of the E1300,P4GM,P41GM channels) are more than 1/3 of RADMON safing thresholds.
- RADMON - Radmon is disabled for radiation zone (as commanded based on OFLS model, for comparison with actual radiation levels).
- PERIGEE - Time of closest earth approach (for comparison)
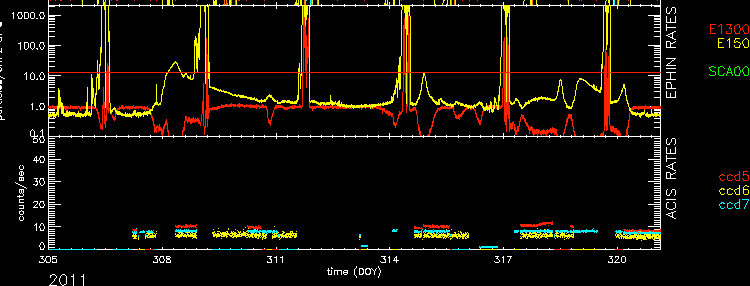
Radiation Count Rates of Nov 2011
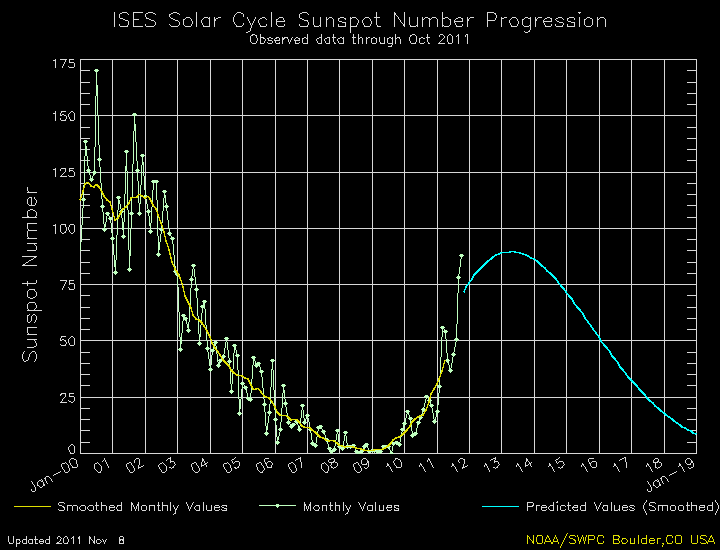
Sun Spot History
Trending
Quarterly Trends
- SIM Temperature
| MSID | MEAN | RMS | DELTA/YR | DELTA/YR/YR | UNITS | DESCRIPTION |
| 3TSMXSPT | 274.85 | 27.04 | -7.275e+01 | -4.086e-11 | K | -X TURTLE SHELL NR ACIS SS |
| BOXTEMP | 282.29 | 0.93 | 1.334e+00 | 2.404e-13 | K | SEA box temperature (3FASEAAT) |
| PSUTEMP | 311.91 | 0.78 | -3.672e-01 | -1.541e-13 | K | SEA power supply temperature (3FAPSAT) |
| TSCMTRTEMP | 268.89 | 22.13 | 9.243e+01 | -4.067e-11 | K | TSC motor temperature |
)
)
)
)
Spacecraft Motions
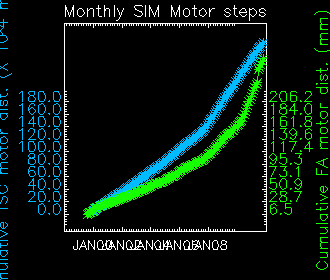
|
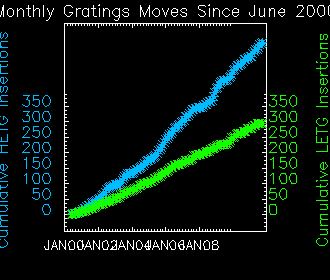
|
Reaction Wheel Rotations
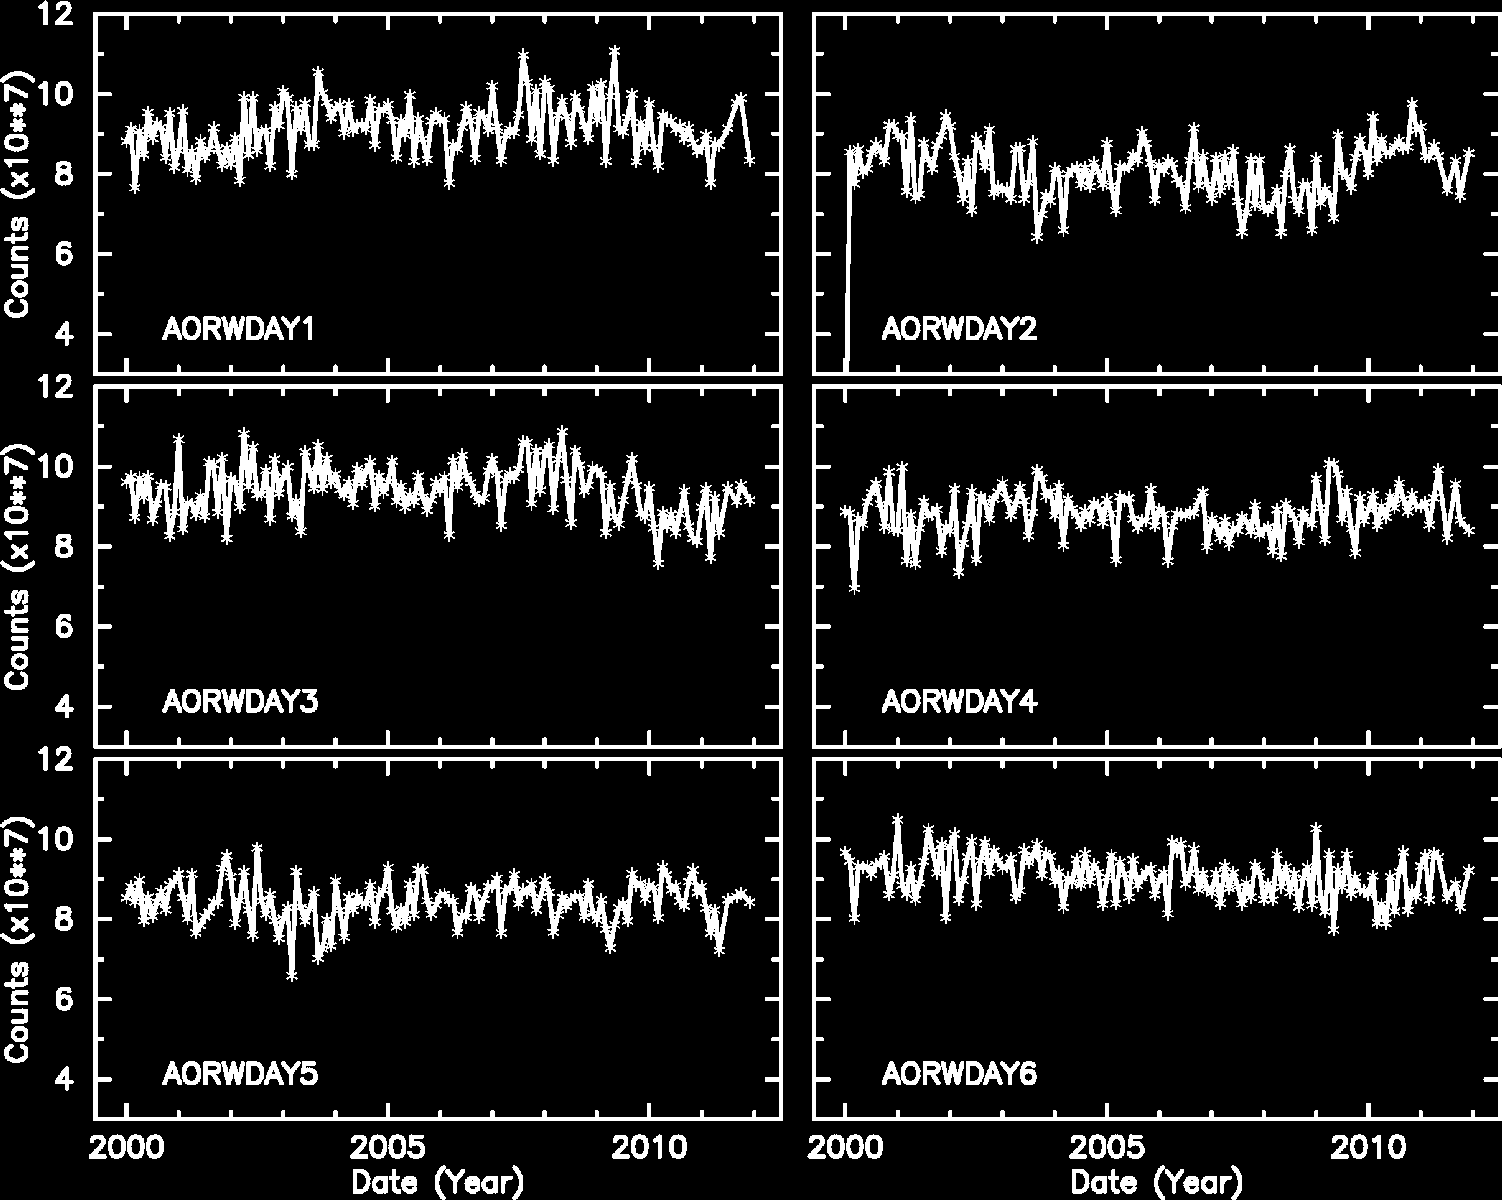
Note: From Feb 2010, the computation of reaction wheel rotations are slightly modified.
Links to Past Monthly Reports
| Year | Month | |||||||||||
|---|---|---|---|---|---|---|---|---|---|---|---|---|
| 1999 | Jul | Aug | Sep | Oct | Nov | Dec | ||||||
| 2000 | Jan | Feb | Mar | Apr | May | Jun | Jul | Aug | Sep | Oct | Nov | Dec |
| 2001 | Jan | Feb | Mar | Apr | May | Jun | Jul | Aug | Sep | Oct | Nov | Dec |
| 2002 | Jan | Feb | Mar | Apr | May | Jun | Jul | Aug | Sep | Oct | Nov | Dec |
| 2003 | Jan | Feb | Mar | Apr | May | Jun | Jul | Aug | Sep | Oct | Nov | Dec |
| 2004 | Jan | Feb | Mar | Apr | May | Jun | Jul | Aug | Sep | Oct | Nov | Dec |
| 2005 | Jan | Feb | Mar | Apr | May | Jun | Jul | Aug | Sep | Oct | Nov | Dec |
| 2006 | Jan | Feb | Mar | Apr | May | Jun | Jul | Aug | Sep | Oct | Nov | Dec |
| 2007 | Jan | Feb | Mar | Apr | May | Jun | Jul | Aug | Sep | Oct | Nov | Dec |
| 2008 | Jan | Feb | Mar | Apr | May | Jun | Jul | Aug | Sep | Oct | Nov | Dec |
| 2009 | Jan | Feb | Mar | Apr | May | Jun | Jul | Aug | Sep | Oct | Nov | Dec |
| 2010 | Jan | Feb | Mar | Apr | May | Jun | Jul | Aug | Sep | Oct | Nov | Dec |
| 2011 | Jan | Feb | Mar | Apr | May | Jun | Jul | Aug | Sep | Oct | ||