ACIS
ACIS DOSE Registered-Photon-Map
The steps we took to compute the dose map are;
- Level 1 Event files for a specified month are obtained from archive.
- Image data including I2, I3, S2, S3 CCDs are extracted from all event files.
- All the extracted image data were merged to create a month long exposure map for the month.
- The exposure map is opened with ds9, and check a distribution of count rates against energy. From this, estimate the upper threshold value. Any events beyond this upper threshold are assumed erroneous events such as bad pixels.
- Using this upper threshold, the data is filtered, and create a cleaned exposure map for the month.
- The exposure map from each month from the Sep 1999 is added up to create a cumulative exposure map for each month.
- Using fimgstatistic, we compute count rate statistics for each CCDs.
- For observations with high data drop rates (e.g., Crab nebula, Cas A), we corrected the observations by adding events.
-
Note: Counts and RMS's of Cumulative maps are lower than the previous months.
This is because we excluded extreme outliers.
Please check more detail plots at Telemetered Photon Dose Trend page.
)
)
)
Statistics:
# IMAGE     NPIX        MEAN           RMS              MIN     MAX
ACIS_jan12 6004901       6.449         10.729           0.0     349

 I2 node 0  262654      5.346706        2.690190        0.0      34.0
 I2 node 1  262654      5.643252        2.973133        0.0     195.0
 I2 node 2  262654      5.521168        2.697476        0.0      57.0
 I2 node 3  262654      5.488266        2.823576        0.0      38.0

 I3 node 0  262654      5.655297        3.085779        0.0      36.0
 I3 node 1  262654      5.909821        5.956098        0.0     169.0
 I3 node 2  262654      5.311783        2.629670        0.0      39.0
 I3 node 3  262654      5.302906        2.653339        0.0      71.0

 S2 node 0  262654      6.742360        3.115437        0.0     249.0
 S2 node 1  262654      7.451420        4.038455        0.0      59.0
 S2 node 2  262654      9.193279        9.076125        0.0     121.0
 S2 node 3  262654      11.014202       16.413008       0.0     308.0

 S3 node 0  262654      16.919715       19.060654       0.0     163.0
 S3 node 1  262654      15.850798       17.870976       0.0     222.0
 S3 node 2  262654      13.636761       13.096542       0.0     185.0
 S3 node 3  262654      10.759450       7.130913        0.0     110.0
)
)
)
Statistics:
 IMAGE        NPIX      MEAN             RMS            MIN    MAX
ACIS_total  6004901    1572.06          2106.22        0.0    94638

 I2 node 0  262654      1300.189995     251.761160      0.0     6592.0
 I2 node 1  262654      1372.564228     338.395880      0.0     27769.0
 I2 node 2  262654      1406.583668     304.636899      0.0     8909.0
 I2 node 3  262654      1402.021128     358.388256      0.0     27691.0

 I3 node 0  262654      1469.455222     358.618865      0.0     6513.0
 I3 node 1  262654      1542.279671     1166.557190     0.0     30008.0
 I3 node 2  262654      1341.115242     244.111459      0.0     6403.0
 I3 node 3  262654      1326.963200     259.866545      0.0     23685.0

 S2 node 0  262654      1878.262791     261.484197      979.0   20157.0
 S2 node 1  262654      1998.106688     431.145272      1011.0  10996.0
 S2 node 2  262654      2218.555844     420.454457      1316.0  15955.0
 S2 node 3  262654      2149.400367     313.696965      1257.0  33952.0

 S3 node 0  262654      3271.843758     1643.289568     1358.0  13059.0
 S3 node 1  262654      4451.938819     1956.258790     0.0     13553.0
 S3 node 2  262654      3374.829607     907.652761      1285.0  8425.0
 S3 node 3  262654      2600.792359     417.239573      1454.0  9453.0
)
|
)
|
)
|
)
|
| Oct 2011 | Jul 2011 | Apr 2011 | Jan 2011 |
|---|
The Mean Detrended CTI
We report CTIs with a refined data definition. CTIs were computed for the temperature dependency corrected data. Please see CTI page for detailed explanation. CTI's are computed for Mn K alpha, and defined as slope/intercept x10^4 of row # vs ADU. Data file: here
Focal Plane Temperature
Jan 2012 Focal Temperature
| The Mean (max) FPT: | |
|---|---|
| -108.95 | +/-10.22 C |
| Mean Width: | |
| 0.49 | +/- 0.53 days |
Averaged Focal Plane Temperature
We are using 10 period moving averages to show trends of peak temperatures and peak widths. Note, the gaps in the width plot are due to missing/corrupted data.
Focal Plane Temperature, Sun Angle and Altitude
Bad Pixels
The plots below were generated with a new warm pixel finding script. Please see Acis Bad Pixel Page for details.
Front Side CCDs
Back Side CCD (CCD5)
Science Instrument Background Rates
| Name | Low (keV) | High(KeV) | Description |
|---|---|---|---|
| SSoft | 0.00 | 0.50 | Super soft photons |
| Soft | 0.50 | 1.00 | Soft photons |
| Med | 1.00 | 3.00 | Moderate energy photons |
| Hard | 3.00 | 5.00 | Hard Photons |
| Harder | 5.00 | 10.00 | Very Hard photons |
| Hardest | 10.00 | Beyond 10 keV |
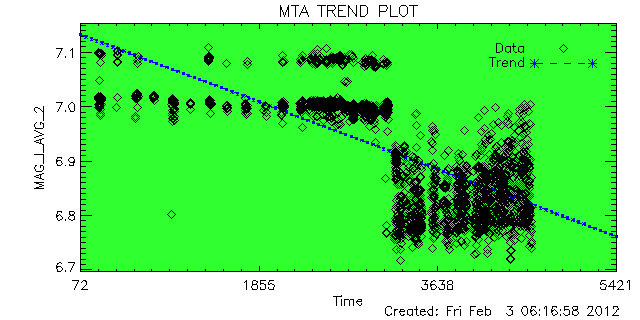
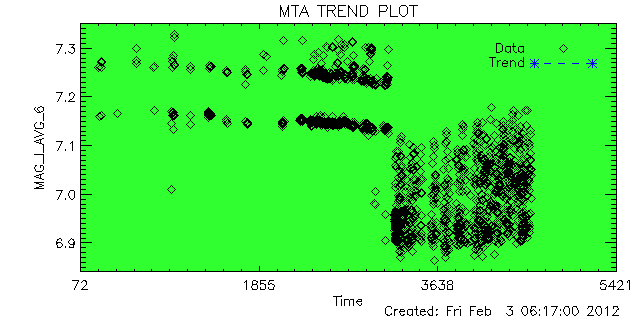
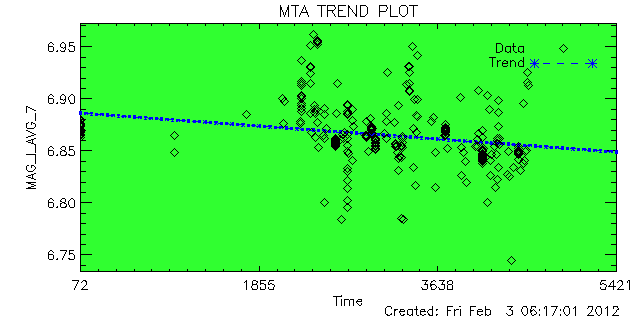
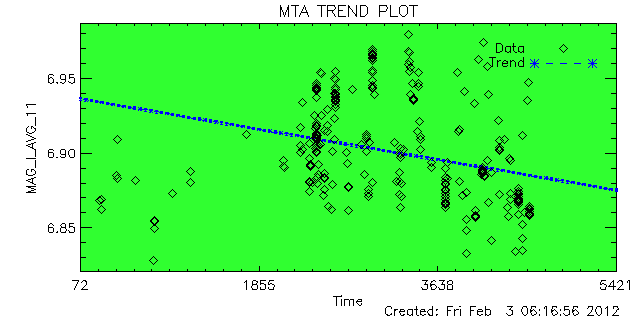
ACIS Corner Pixels
We plot the average corner pixel centroid slope and mean for ACIS observations. Separate plots are shown for FAINT MODE (3X3) and VFAINT MODE (5X5) observations. Metric is the centroid of a Gaussian fit to the histogram of corner pixel PHA values of detected events. Plus signs are FAINT observations, diamonds are VFAINT observations, and boxes are VFAINT observations with centroids computed using only the corner pixels of a 3X3 event island (referred to as AFAINT). We see a very small upward trend.
CCD: I3
CCD: S3
ACIS Bias Trends
The bias plus overclock level was calculated as follows:
- Get acisf*bias0.fits is obtained from a database or /dsops/ap/sdp/cache/*/acis/
- Data with timed mode exposure is selected.
- Fits files were divided into 4 quads, then an average of bias level for each quad is computed. No corrections for dead spots, columns etc were included.
An example of Overclock values as reported in FITS file header:
An example of mean bias minus overclock value:
HRC
DOSE of Central 4K Pore-Pairs
Please refer to Maximum Dose Trends for more details.
)
        IMAGE                NPIX      MEAN    STDDEV      MIN       MAX
HRCI_08_1999_01_2012.fits  16777216   3.605    4.415       0.0       292.0
)
        IMAGE                NPIX      MEAN    STDDEV      MIN       MAX
HRCS_01_2012.fits          16777216   0.005    0.089       0.0       11.0
)
        IMAGE                NPIX     MEAN      STDDEV      MIN      MAX
HRCS_08_1999_01_2012.fits  16777216  13.826      22.983      0.0      1629.0
|
|
Max dose trend plots corrected for events that "pile-up"
in the center of the taps due to bad position information.
|
)
|
)
|
)
|
)
|
| Oct 2011 | Jul 2011 | Apr 2011 | Jan 2011 |
|---|
)
|
)
|
)
|
)
|
| Oct 2011 | Jul 2011 | Apr 2011 | Jan 2011 |
|---|
Gratings
Focus
We plot the width of the zero order streak of ACIS/HETG observations and the width of the zero order image for HRC/LETG observations of point sources. No significant defocusing trend is seen at this time. See Gratings Focus pages.
PCAD
ACA Trending
ACIS-1
ACIS-6
HRC-I-1
HRC-S-1
Gyro Bias Drift
Radiation History
Radiation Zone Timing
Plotted below are radiation zone timing plots based on the following definitions of radiation zone:
- RADZONE - Ephin levels (in any of the E1300,P4GM,P41GM channels) are more than 1/3 of RADMON safing thresholds.
- RADMON - Radmon is disabled for radiation zone (as commanded based on OFLS model, for comparison with actual radiation levels).
- PERIGEE - Time of closest earth approach (for comparison)
Radiation Count Rates of Jan 2012
Sun Spot History
Trending
Quarterly Trends
- OBA Heaters
| MSID | MEAN | RMS | DELTA/YR | DELTA/YR/YR | UNITS | DESCRIPTION |
| OOBTHR08 | 290.13 | 1.15 | 8.377e+00 | -8.896e+01 | K | RT 31: OBA CONE |
| OOBTHR18 | 289.38 | 1.11 | 8.041e+00 | -8.531e+01 | K | RT 40: OBA CONE |
| OOBTHR45 | 293.35 | 1.24 | 9.895e+00 | -1.088e+02 | K | RT 67: TFTE COVER |
| OOBTHR56 | 296.41 | 1.63 | 1.235e+01 | -1.386e+02 | K | RT 158: OBA CONE |
| OOBTHR60 | 290.06 | 1.76 | 8.819e+00 | -9.402e+01 | K | RT 153: OBA CONE |
)
)
)
)
)
- HRMA Heaters
| MSID | MEAN | RMS | DELTA/YR | DELTA/YR/YR | UNITS | DESCRIPTION |
| OHRTHR02 | 295.31 | 3.298e-03 | -8.657e-03 | 5.628e-02 | K | RT 2: HRMA FORWARD APERTURE PLATE |
| OHRTHR04 | 295.31 | 2.271e-03 | 3.748e-04 | -1.426e-02 | K | RT 9: HRMA PRECOLLIMATOR PLATE 10 |
| OHRTHR05 | 294.71 | 1.494e-03 | 1.859e-03 | -8.613e-02 | K | RT 13: HRMA AFT HEATER PLATE |
| OHRTHR19 | 294.54 | 8.967e-03 | 5.010e-02 | -7.694e-01 | K | RT 132: HRMA AFT HEATER PLATE |
| OHRTHR21 | 295.27 | 1.981e-03 | -1.084e-02 | 6.449e-03 | K | RT 3: HRMA FOWARD APERTURE PLATE |
| OHRTHR44 | 295.29 | 8.826e-03 | -4.817e-03 | 1.267e-01 | K | RT 1: HRMA FORWARD APERTURE PLATE |
| OHRTHR47 | 295.29 | 4.082e-03 | -2.950e-02 | 3.185e-01 | K | RT 10: HRMA PRECOLLIMATOR PLATE 10 |
)
)
)
)
)
)
)
Spacecraft Motions
|
|
Reaction Wheel Rotations
Note: From Feb 2010, the computation of reaction wheel rotations are slightly modified.
Links to Past Monthly Reports
| Year | Month | |||||||||||
|---|---|---|---|---|---|---|---|---|---|---|---|---|
| 1999 | Jul | Aug | Sep | Oct | Nov | Dec | ||||||
| 2000 | Jan | Feb | Mar | Apr | May | Jun | Jul | Aug | Sep | Oct | Nov | Dec |
| 2001 | Jan | Feb | Mar | Apr | May | Jun | Jul | Aug | Sep | Oct | Nov | Dec |
| 2002 | Jan | Feb | Mar | Apr | May | Jun | Jul | Aug | Sep | Oct | Nov | Dec |
| 2003 | Jan | Feb | Mar | Apr | May | Jun | Jul | Aug | Sep | Oct | Nov | Dec |
| 2004 | Jan | Feb | Mar | Apr | May | Jun | Jul | Aug | Sep | Oct | Nov | Dec |
| 2005 | Jan | Feb | Mar | Apr | May | Jun | Jul | Aug | Sep | Oct | Nov | Dec |
| 2006 | Jan | Feb | Mar | Apr | May | Jun | Jul | Aug | Sep | Oct | Nov | Dec |
| 2007 | Jan | Feb | Mar | Apr | May | Jun | Jul | Aug | Sep | Oct | Nov | Dec |
| 2008 | Jan | Feb | Mar | Apr | May | Jun | Jul | Aug | Sep | Oct | Nov | Dec |
| 2009 | Jan | Feb | Mar | Apr | May | Jun | Jul | Aug | Sep | Oct | Nov | Dec |
| 2010 | Jan | Feb | Mar | Apr | May | Jun | Jul | Aug | Sep | Oct | Nov | Dec |
| 2011 | Jan | Feb | Mar | Apr | May | Jun | Jul | Aug | Sep | Oct | Nov | Dec |