Science Run Interruptions
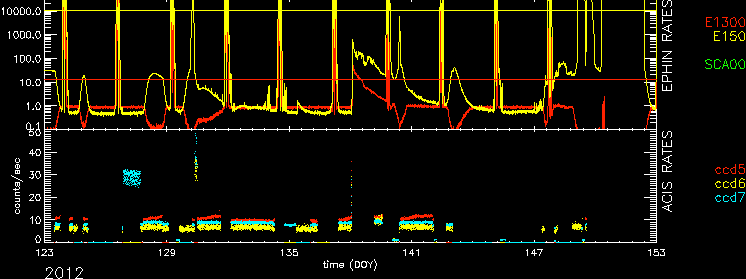
Science observations were interrupted twice in May. Due to high radiation, the science instrument safing sequence was activated at May 16, 10:18pm (EDT). Observations were restarted on May 18 with 93.8ks of science loss. (see details at Radiation Count Rate Plots for Periods Which Interrupted Science Runs).
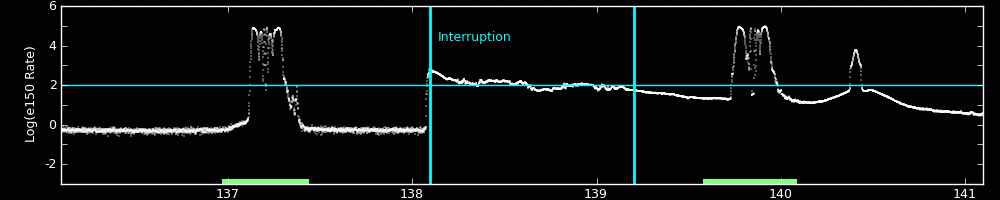
Observations were again interrupted at May 28, 11:33pm (EDT) due to a spacecraft safemode event. The cause of the safemode was a trip of the sun-position monitor. Observations were restarted on May 30, 11:20pm (EDT). (for more detail descriptions about this event, see: June 1 2012, Operations CXO Status Report).
ACIS
ACIS DOSE Registered-Photon-Map
The steps we took to compute the dose map are;
- Level 1 Event files for a specified month are obtained from archive.
- Image data including I2, I3, S2, S3 CCDs are extracted from all event files.
- All the extracted image data were merged to create a month long exposure map for the month.
- The exposure map is opened with ds9, and check a distribution of count rates against energy. From this, estimate the upper threshold value. Any events beyond this upper threshold are assumed erroneous events such as bad pixels.
- Using this upper threshold, the data is filtered, and create a cleaned exposure map for the month.
- The exposure map from each month from the Sep 1999 is added up to create a cumulative exposure map for each month.
- Using fimgstatistic, we compute count rate statistics for each CCDs.
- For observations with high data drop rates (e.g., Crab nebula, Cas A), we corrected the observations by adding events.
-
Note: Counts and RMS's of Cumulative maps are lower than the previous months.
This is because we excluded extreme outliers.
Please check more detail plots at Telemetered Photon Dose Trend page.
)
)
)
Statistics:
# IMAGE     NPIX        MEAN           RMS              MIN     MAX
ACIS_may12 6004901       9.309         16.706           0.0      422

 I2 node 0  262654      5.286446        2.660011        0.0      36.0
 I2 node 1  262654      5.698723        2.997176        0.0     181.0
 I2 node 2  262654      5.586308        2.716664        0.0      44.0
 I2 node 3  262654      5.640350        2.891595        0.0      36.0

 I3 node 0  262654      6.255952        3.075821        0.0      36.0
 I3 node 1  262654      7.009747        6.159692        0.0     152.0
 I3 node 2  262654      5.916915        2.780792        0.0      48.0
 I3 node 3  262654      5.722084        2.762056        0.0     240.0

 S2 node 0  262654      8.661504        3.541274        0.0     172.0
 S2 node 1  262654      9.375980        4.025898        0.0      65.0
 S2 node 2  262654      9.845554        4.387229        0.0     250.0
 S2 node 3  262654      8.982076        3.648002        0.0     392.0

 S3 node 0  262654      22.460164       23.037504       0.0     283.0
 S3 node 1  262654      47.455664       37.869679       0.0     261.0
 S3 node 2  262654      30.716471       27.106902       2.0     245.0
 S3 node 3  262654      13.338815       5.951792        0.0      91.0
)
)
Statistics:
 IMAGE        NPIX      MEAN             RMS            MIN    MAX
ACIS_total  6004901    1602.06          2142.65        0.0     95132

 I2 node 0  262654      1325.371067     256.487318      0.0     6784.0
 I2 node 1  262654      1399.702648     345.552720      0.0     28633.0
 I2 node 2  262654      1433.580376     309.729465      0.0     8940.0
 I2 node 3  262654      1429.617513     365.092097      0.0     27724.0

 I3 node 0  262654      1497.345203     364.788698      0.0     6559.0
 I3 node 1  262654      1572.232582     1188.944610     0.0     30521.0
 I3 node 2  262654      1367.594261     249.060214      0.0     6551.0
 I3 node 3  262654      1352.437500     264.546495      0.0     24029.0

 S2 node 0  262654      1913.767425     269.488191      997.0   20835.0
 S2 node 1  262654      2035.310232     439.968514      1030.0  11252.0
 S2 node 2  262654      2257.190349     425.943727      1338.0  16397.0
 S2 node 3  262654      2186.157871     314.154246      1276.0  34981.0

 S3 node 0  262654      3340.556457     1664.676723     1397.0  13102.0
 S3 node 1  262654      4540.786212     1979.915829     0.0     13608.0
 S3 node 2  262654      3438.496266     927.007118      1313.0  8582.0
 S3 node 3  262654      2644.522895     419.232612      1485.0  9547.0
)
|
)
|
)
|
)
|
| Feb 2012 | Nov 2011 | Aug 2011 | May 2011 |
|---|
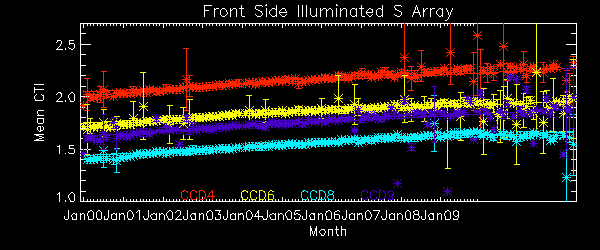
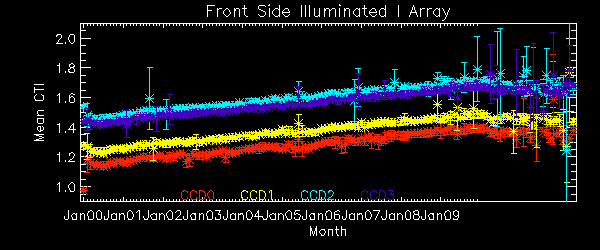
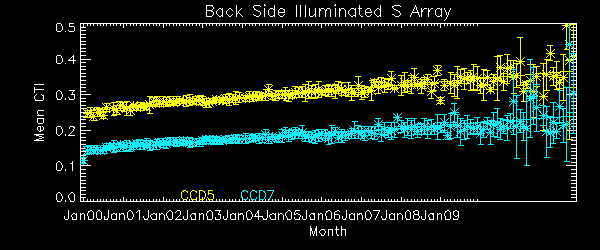
The Mean Detrended CTI
We report CTIs with a refined data definition. CTIs were computed for the temperature dependency corrected data. Please see CTI page for detailed explanation. CTI's are computed for Mn K alpha, and defined as slope/intercept x10^4 of row # vs ADU. Data file: here
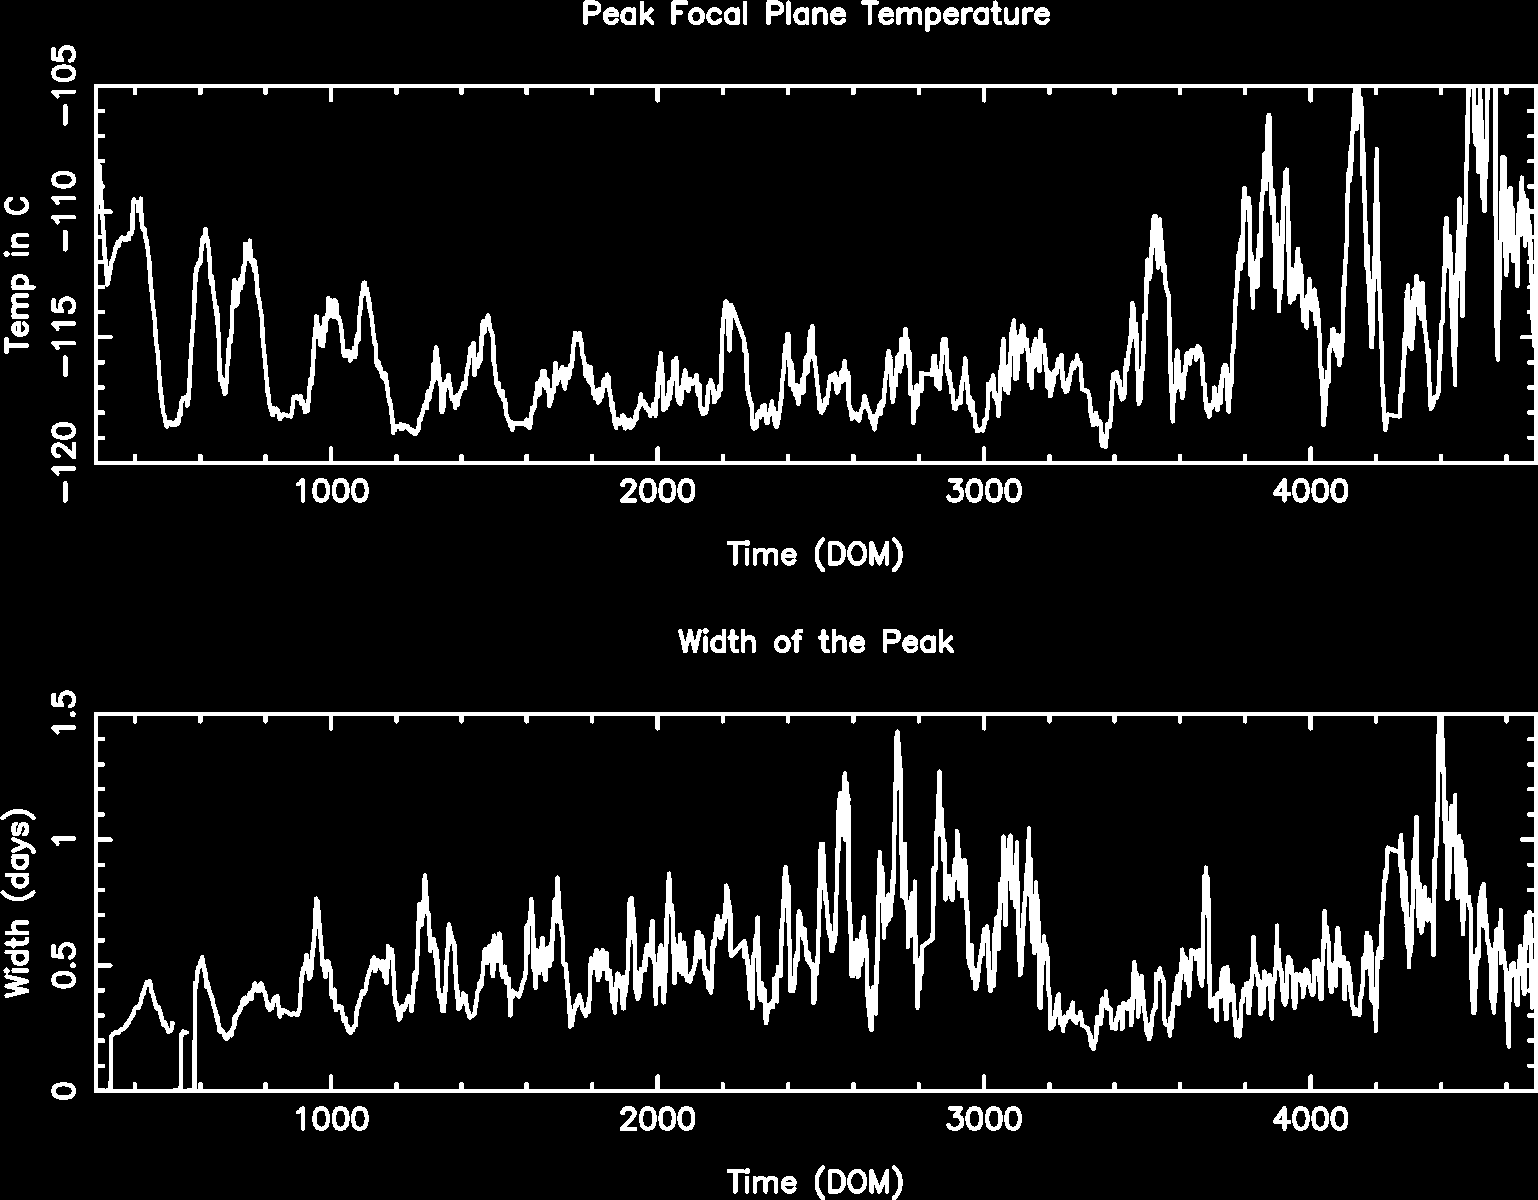
Focal Plane Temperature
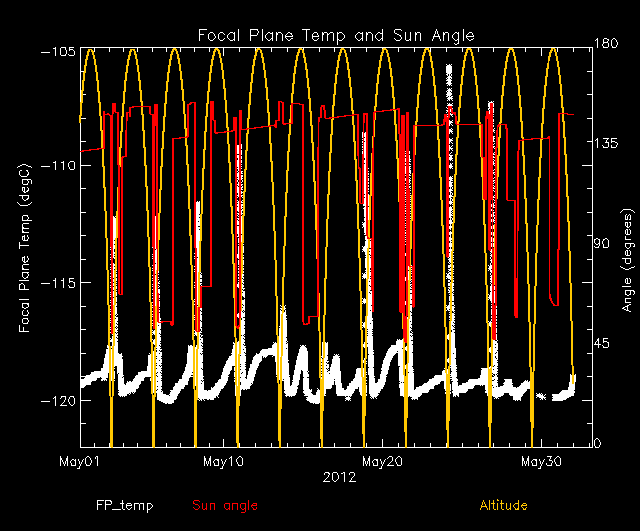
May 2012 Focal Temperature
| The Mean (max) FPT: | |
|---|---|
| -114.02 | +/- 4.22 C |
| Mean Width: | |
| 0.43 | +/- 0.34 days |
Averaged Focal Plane Temperature
We are using 10 period moving averages to show trends of peak temperatures and peak widths. Note, the gaps in the width plot are due to missing/corrupted data.
Focal Plane Temperature, Sun Angle and Altitude
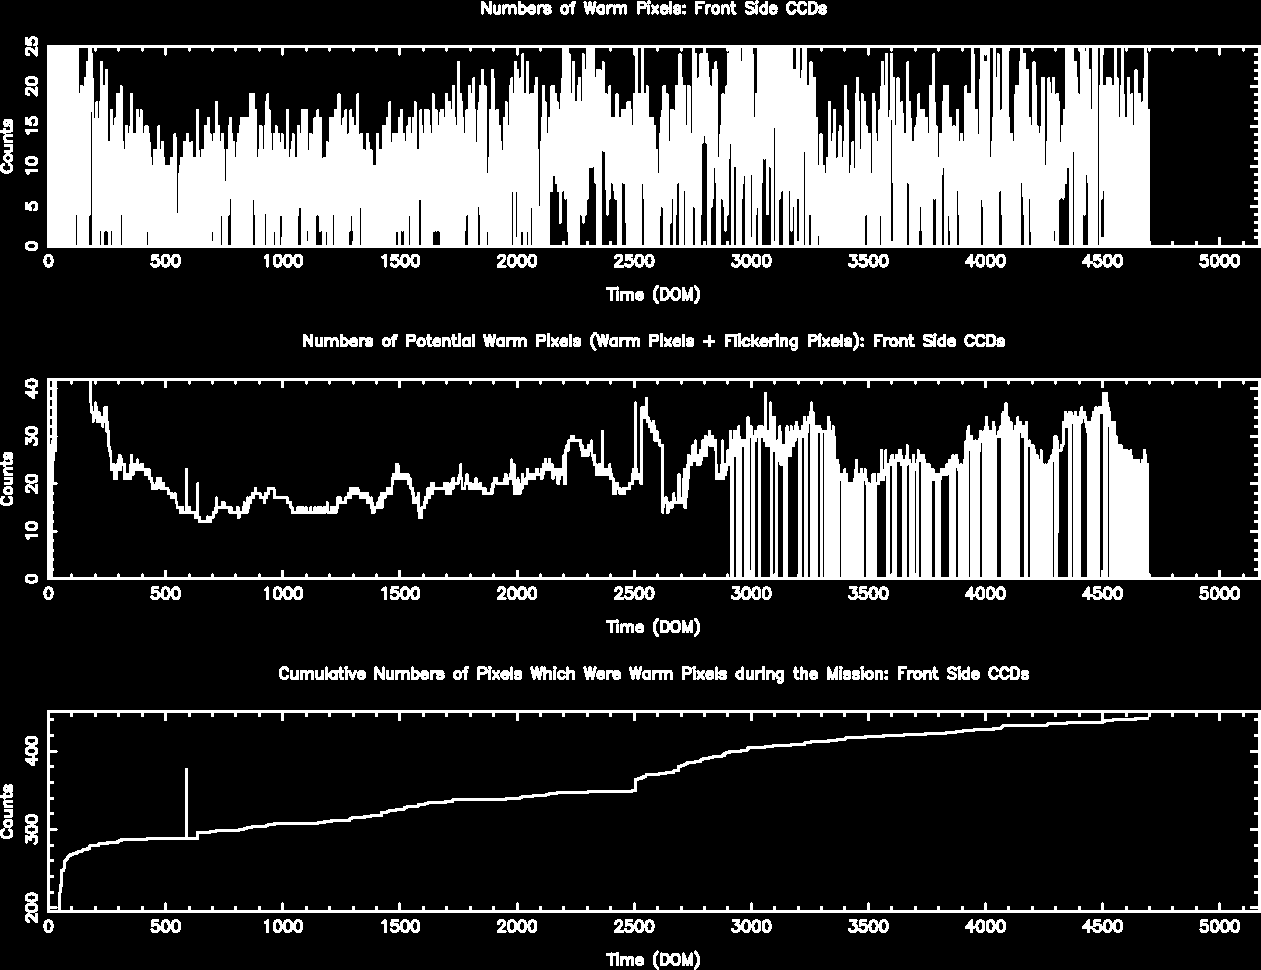
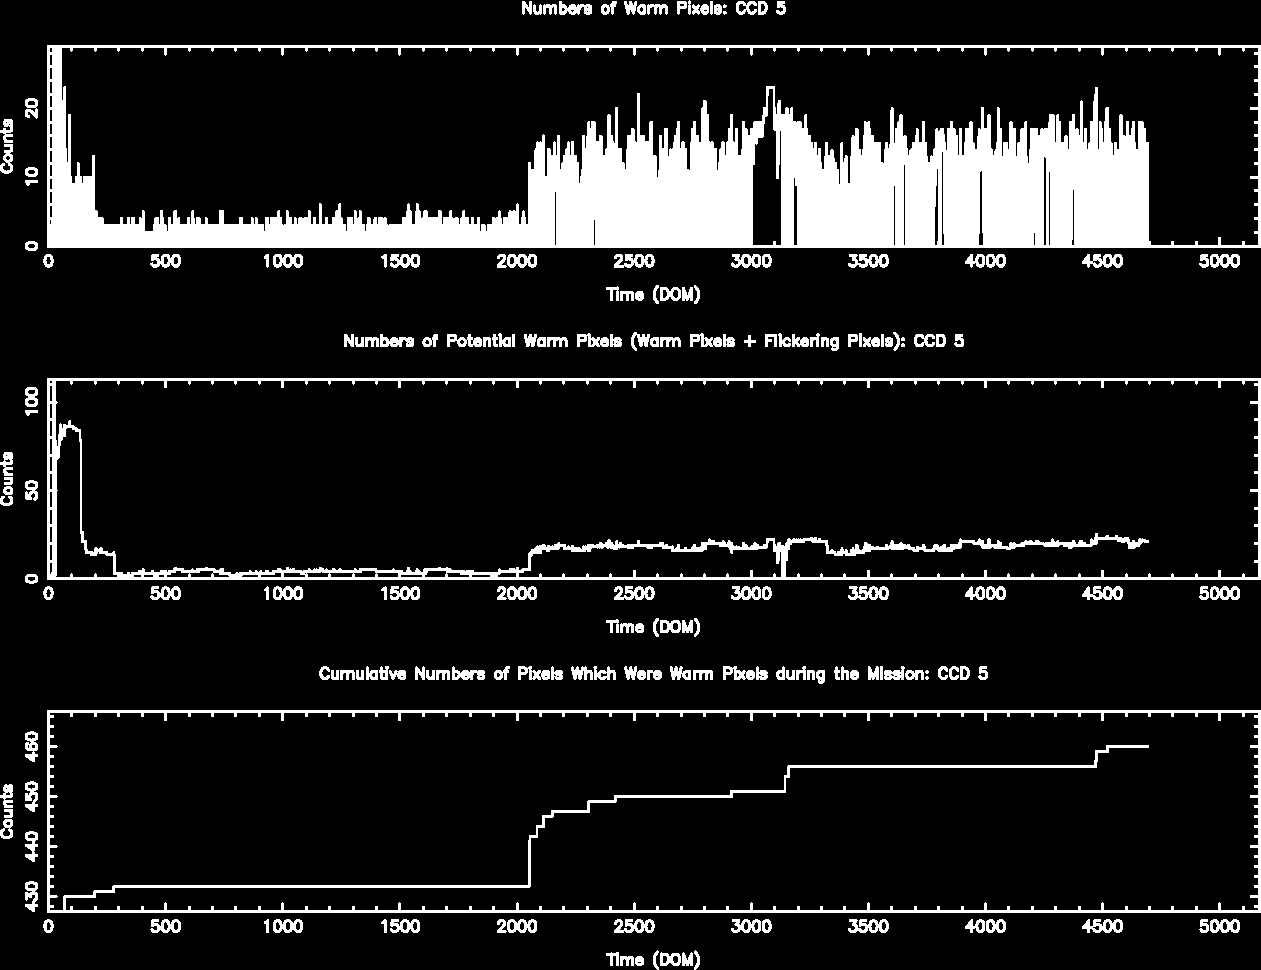
Bad Pixels
The plots below were generated with a new warm pixel finding script. Please see Acis Bad Pixel Page for details.
Front Side CCDs
Back Side CCD (CCD5)
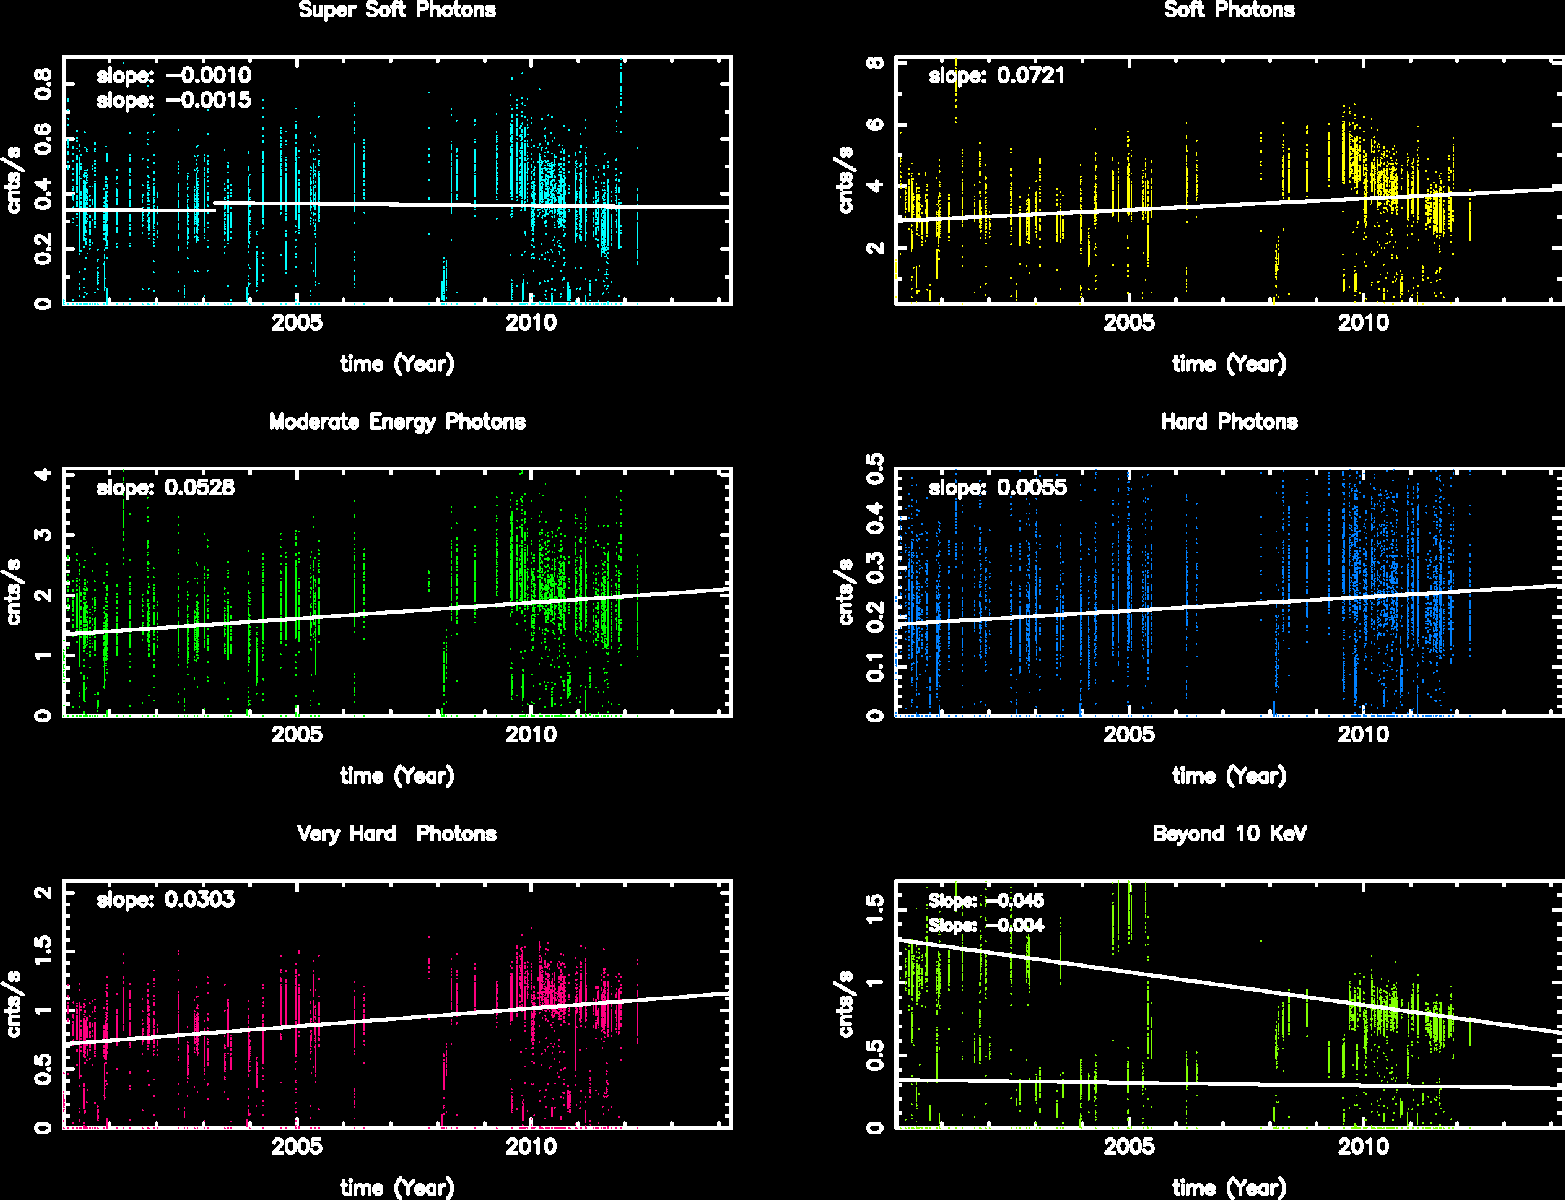
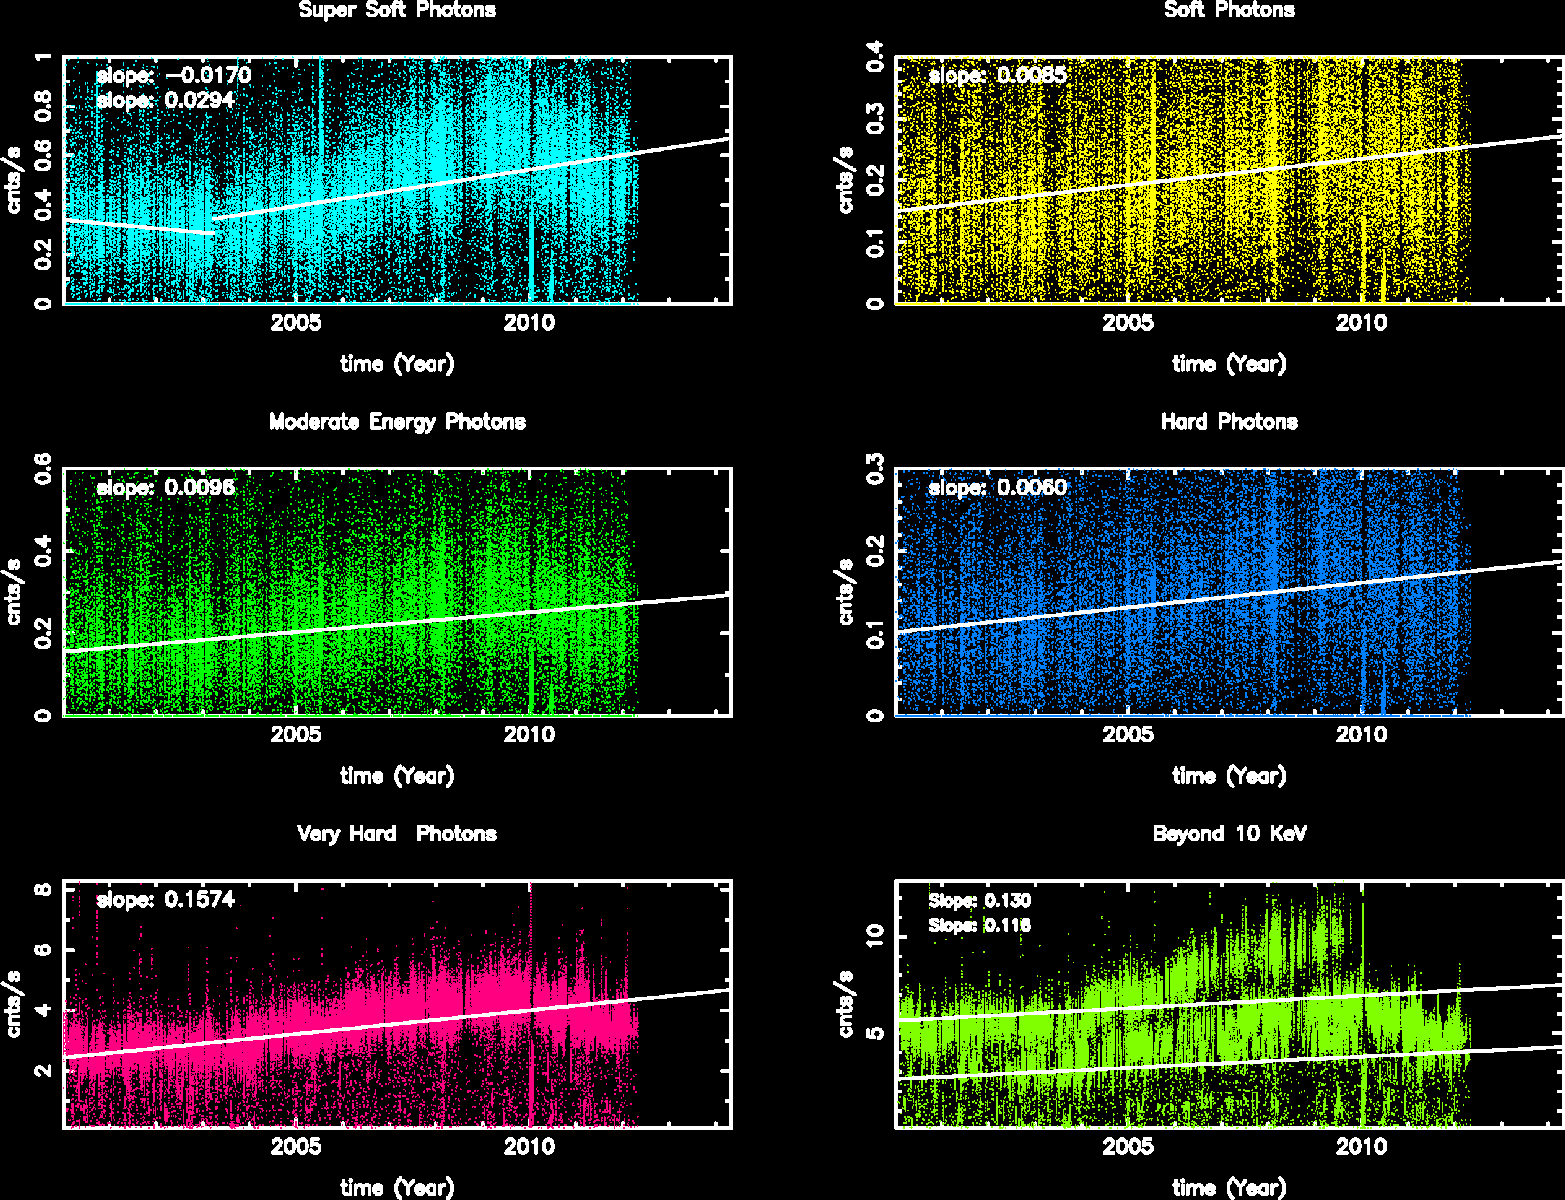
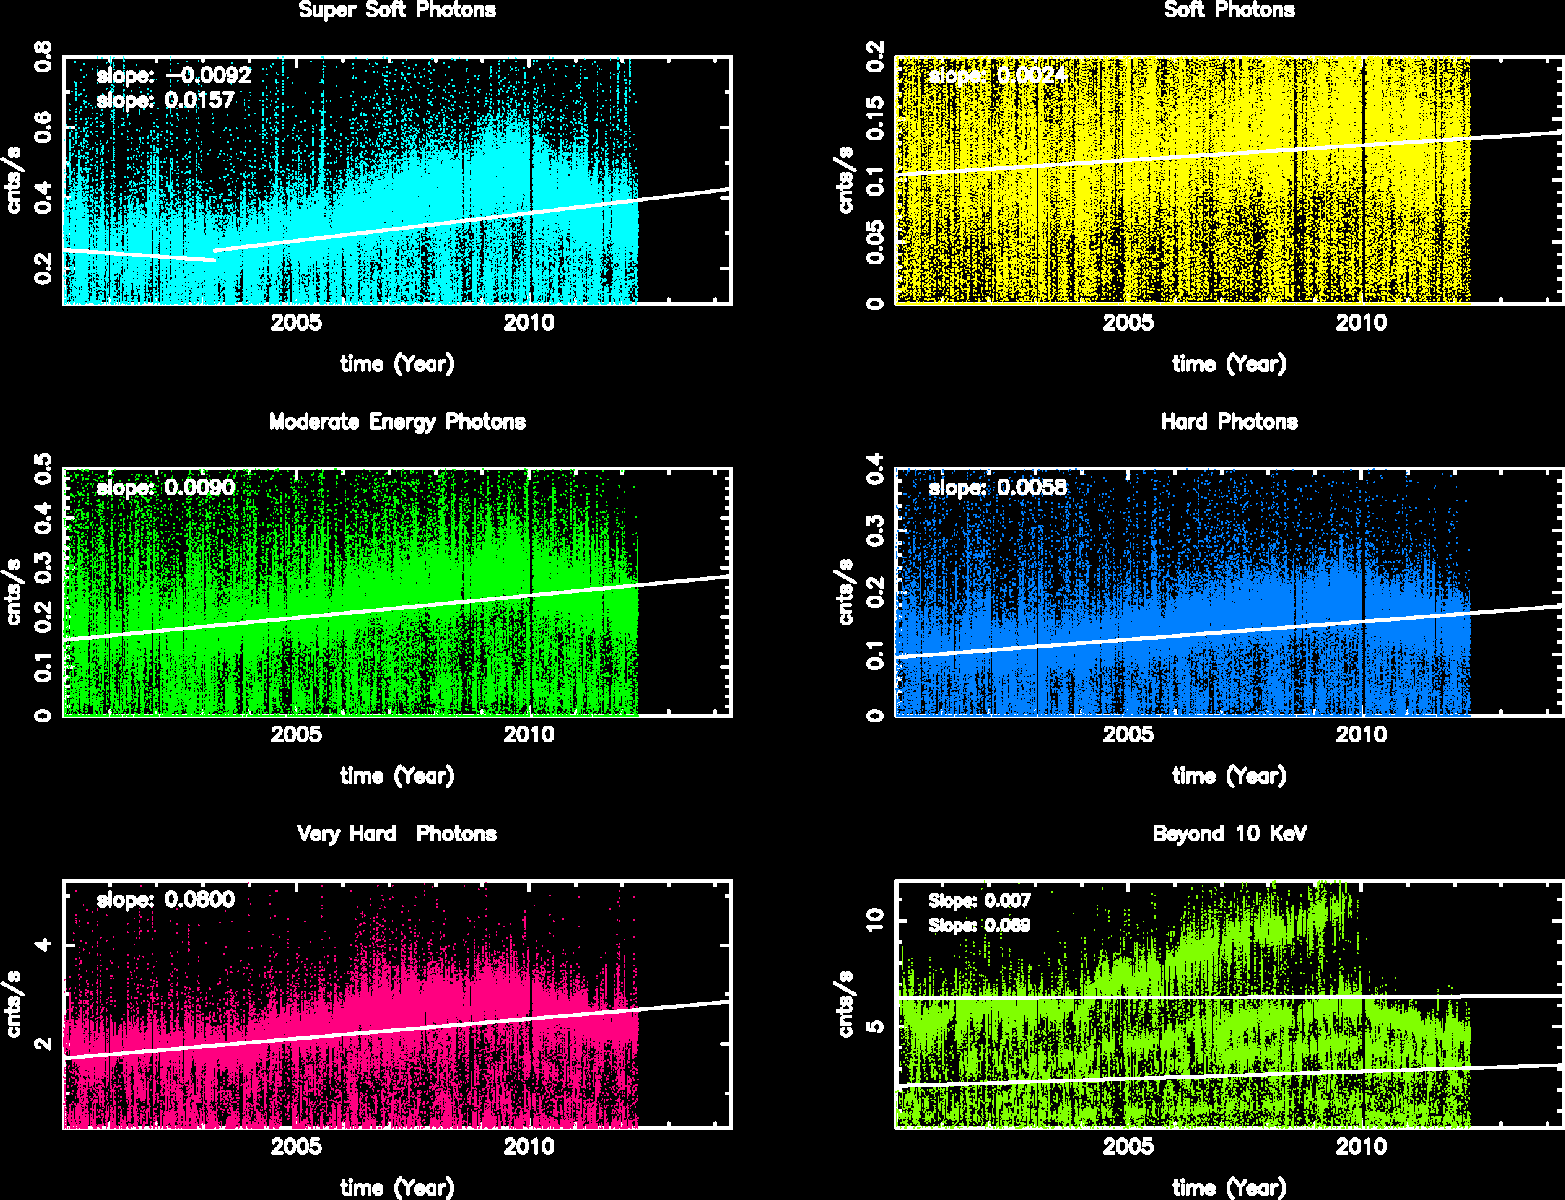
Science Instrument Background Rates
| Name | Low (keV) | High(KeV) | Description |
|---|---|---|---|
| SSoft | 0.00 | 0.50 | Super soft photons |
| Soft | 0.50 | 1.00 | Soft photons |
| Med | 1.00 | 3.00 | Moderate energy photons |
| Hard | 3.00 | 5.00 | Hard Photons |
| Harder | 5.00 | 10.00 | Very Hard photons |
| Hardest | 10.00 | Beyond 10 keV |
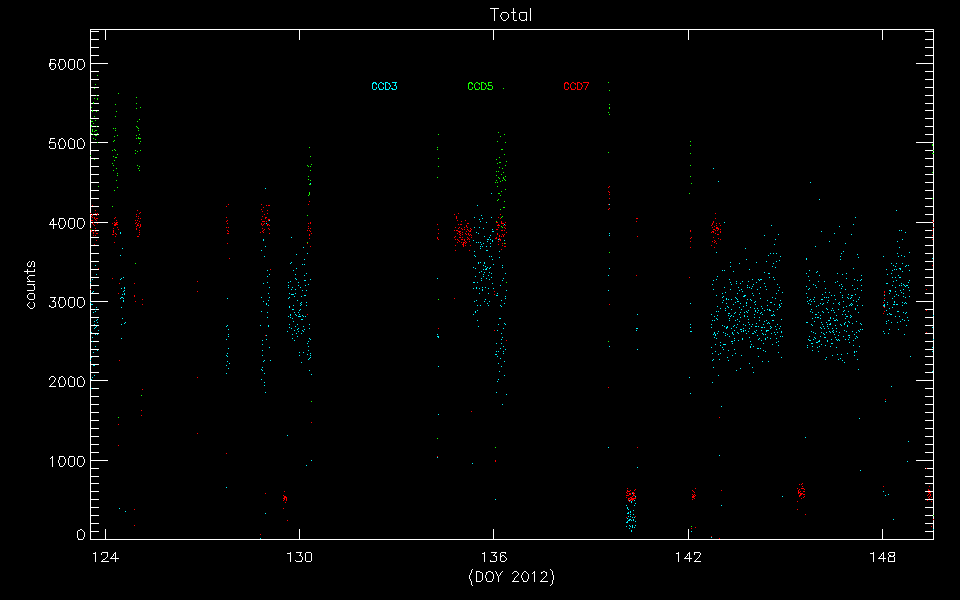
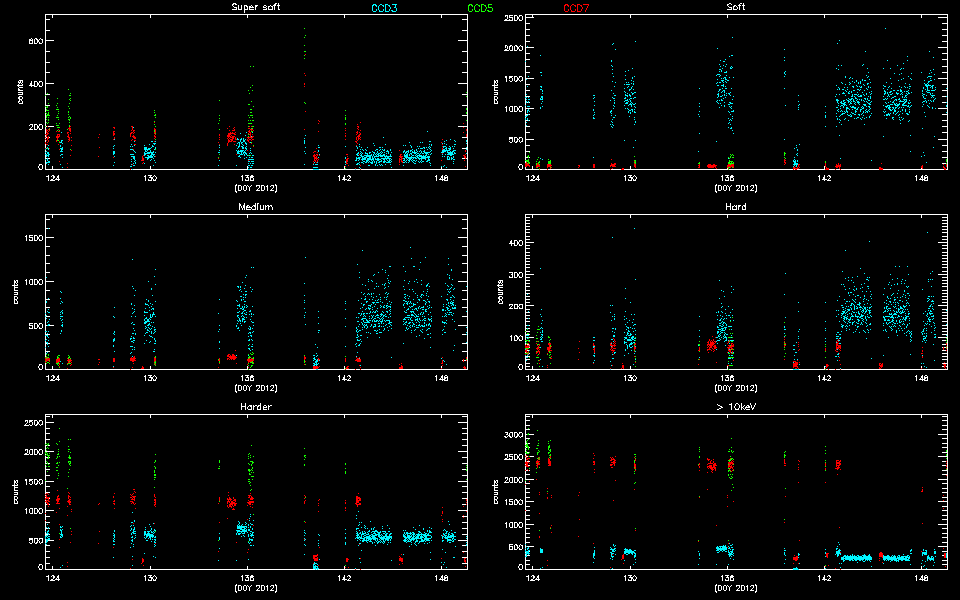
The following three plots show trends of SIB from year 2000. CCDs shown here are CCD3, CCD5, and CCD7. Fitted lines are linear fit after eliminating extreme outliers. For >10 keV plots, 2 lines are fit. One is with a 13 keV filter, and another without.
CCD 3
CCD 5
CCD 7
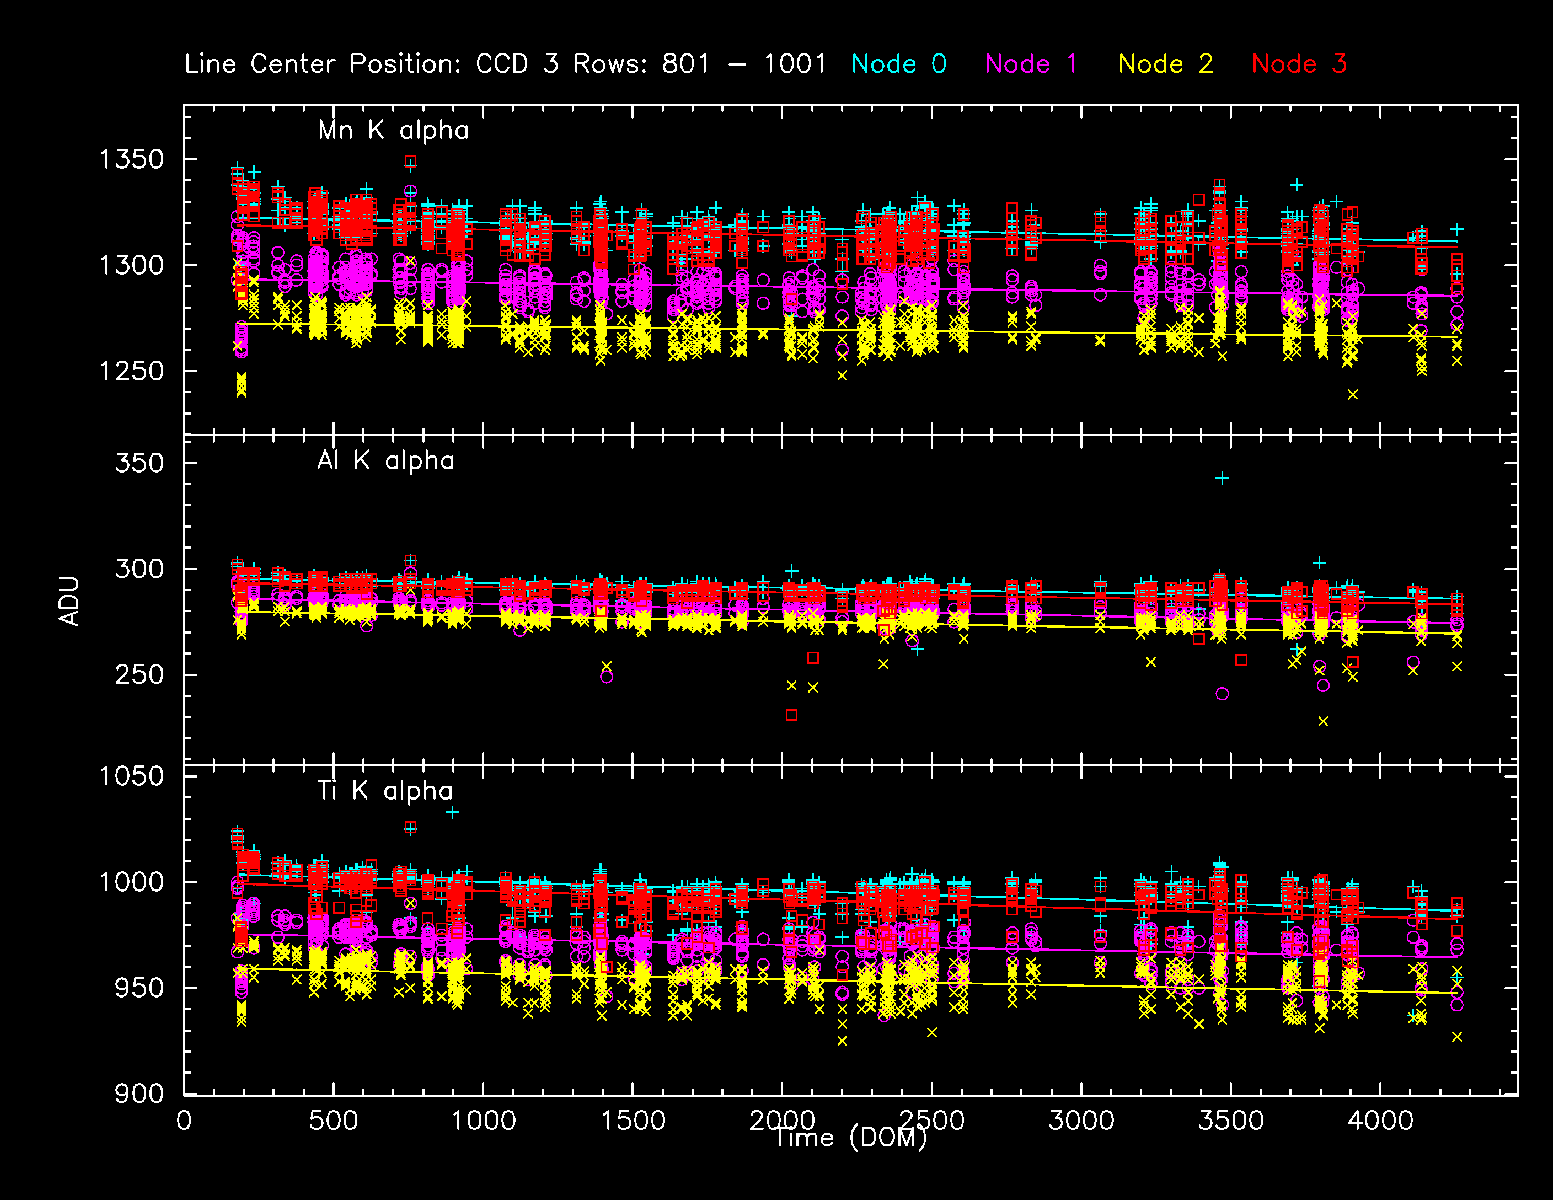
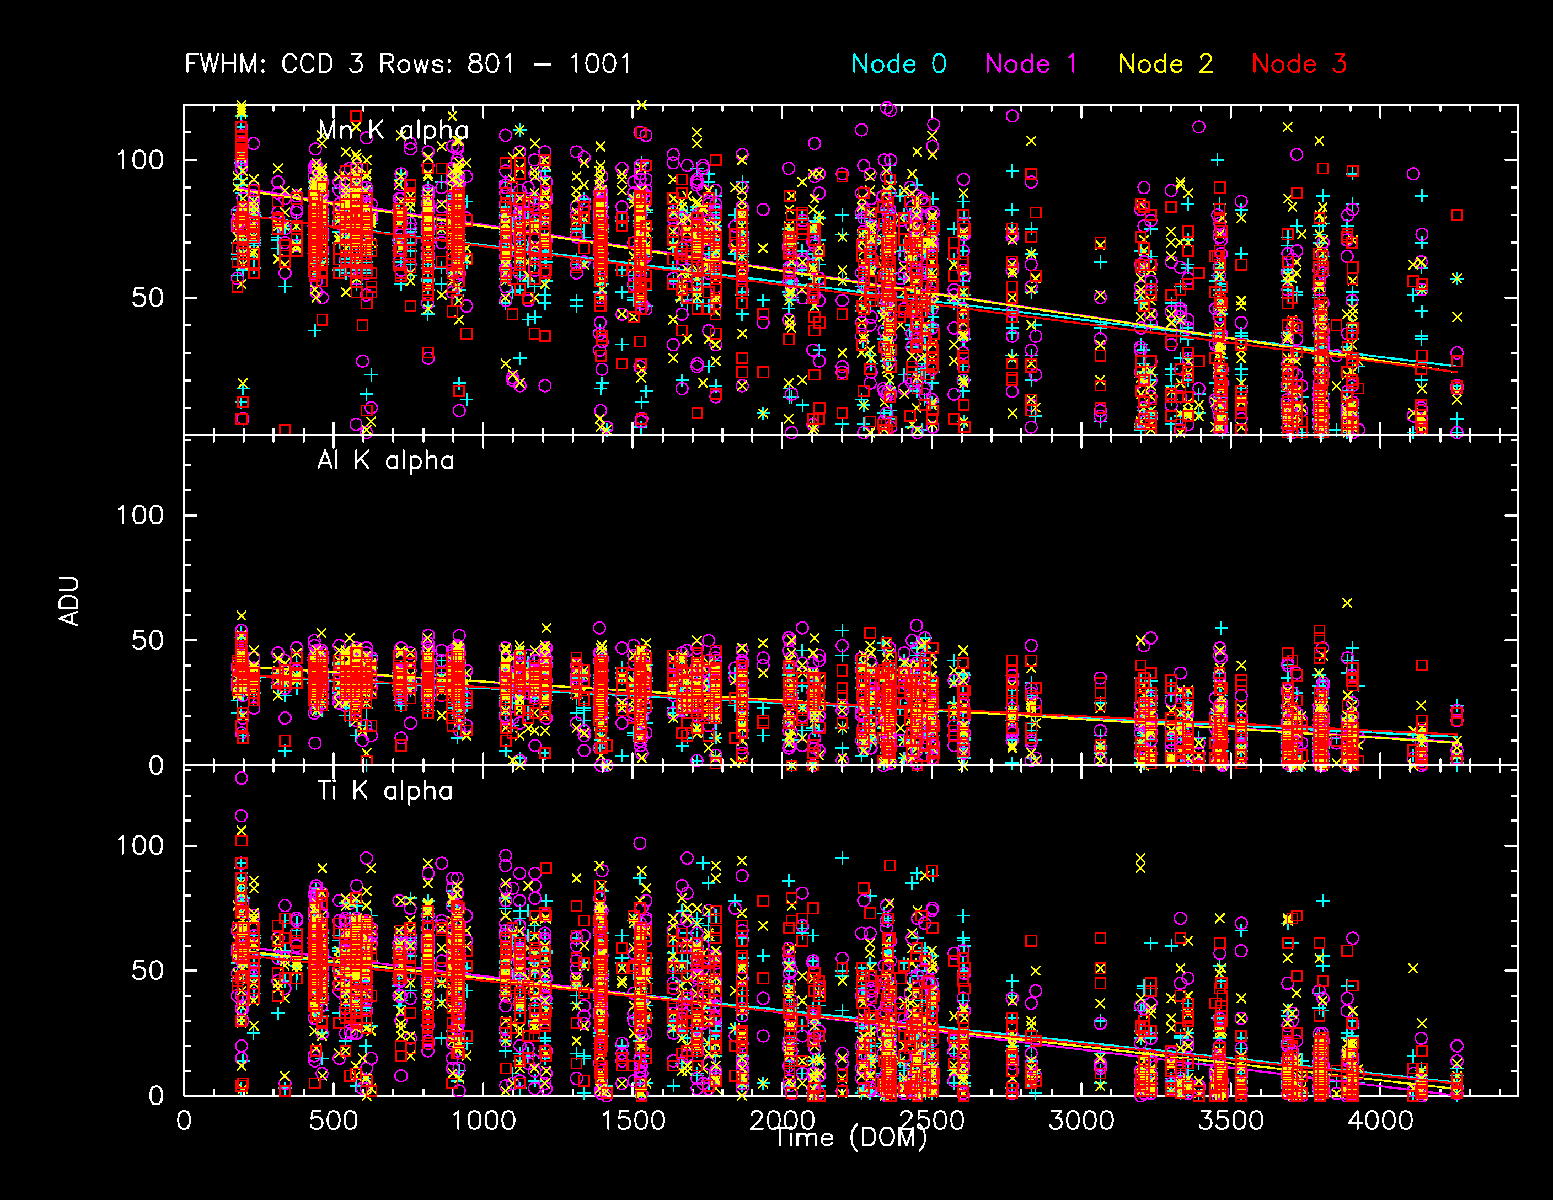
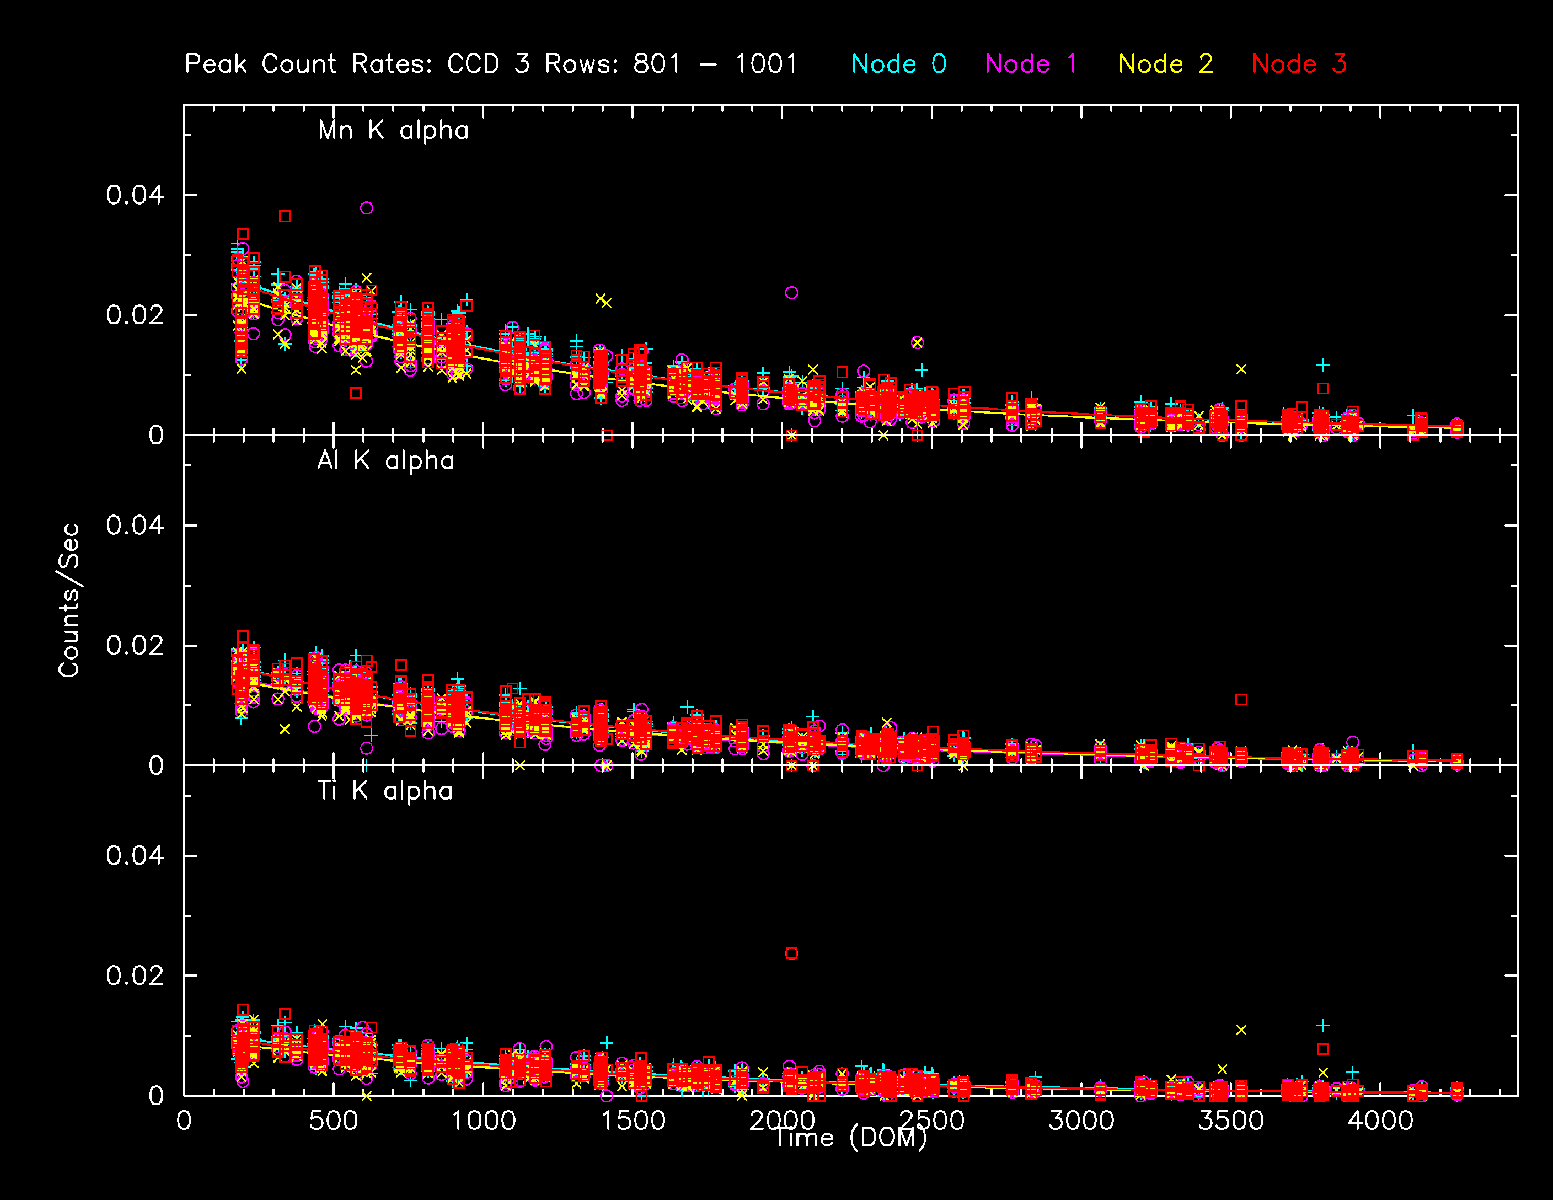
ACIS Histogram Mode Trends
We collected data from acis histogram mode data, and created trend plots of peak portions and peak widths against time (DOM). The peaks were estimated by fitting a simple Gaussian on three peaks (Al, Ti, and Mn), and the widths were estimated by a width at the half max from the peak.
All histogram data are taken under TIMED and GRADED_HIST mode, SIM position is at an external calibration source position, the focal temperature is around -119.7 C, and parameter settings in aciselec, acistemp are set to about same for all.
CCD 3, Peak Position
CCD 3, Peak Widths
CCD 3, Count Rates
HRC
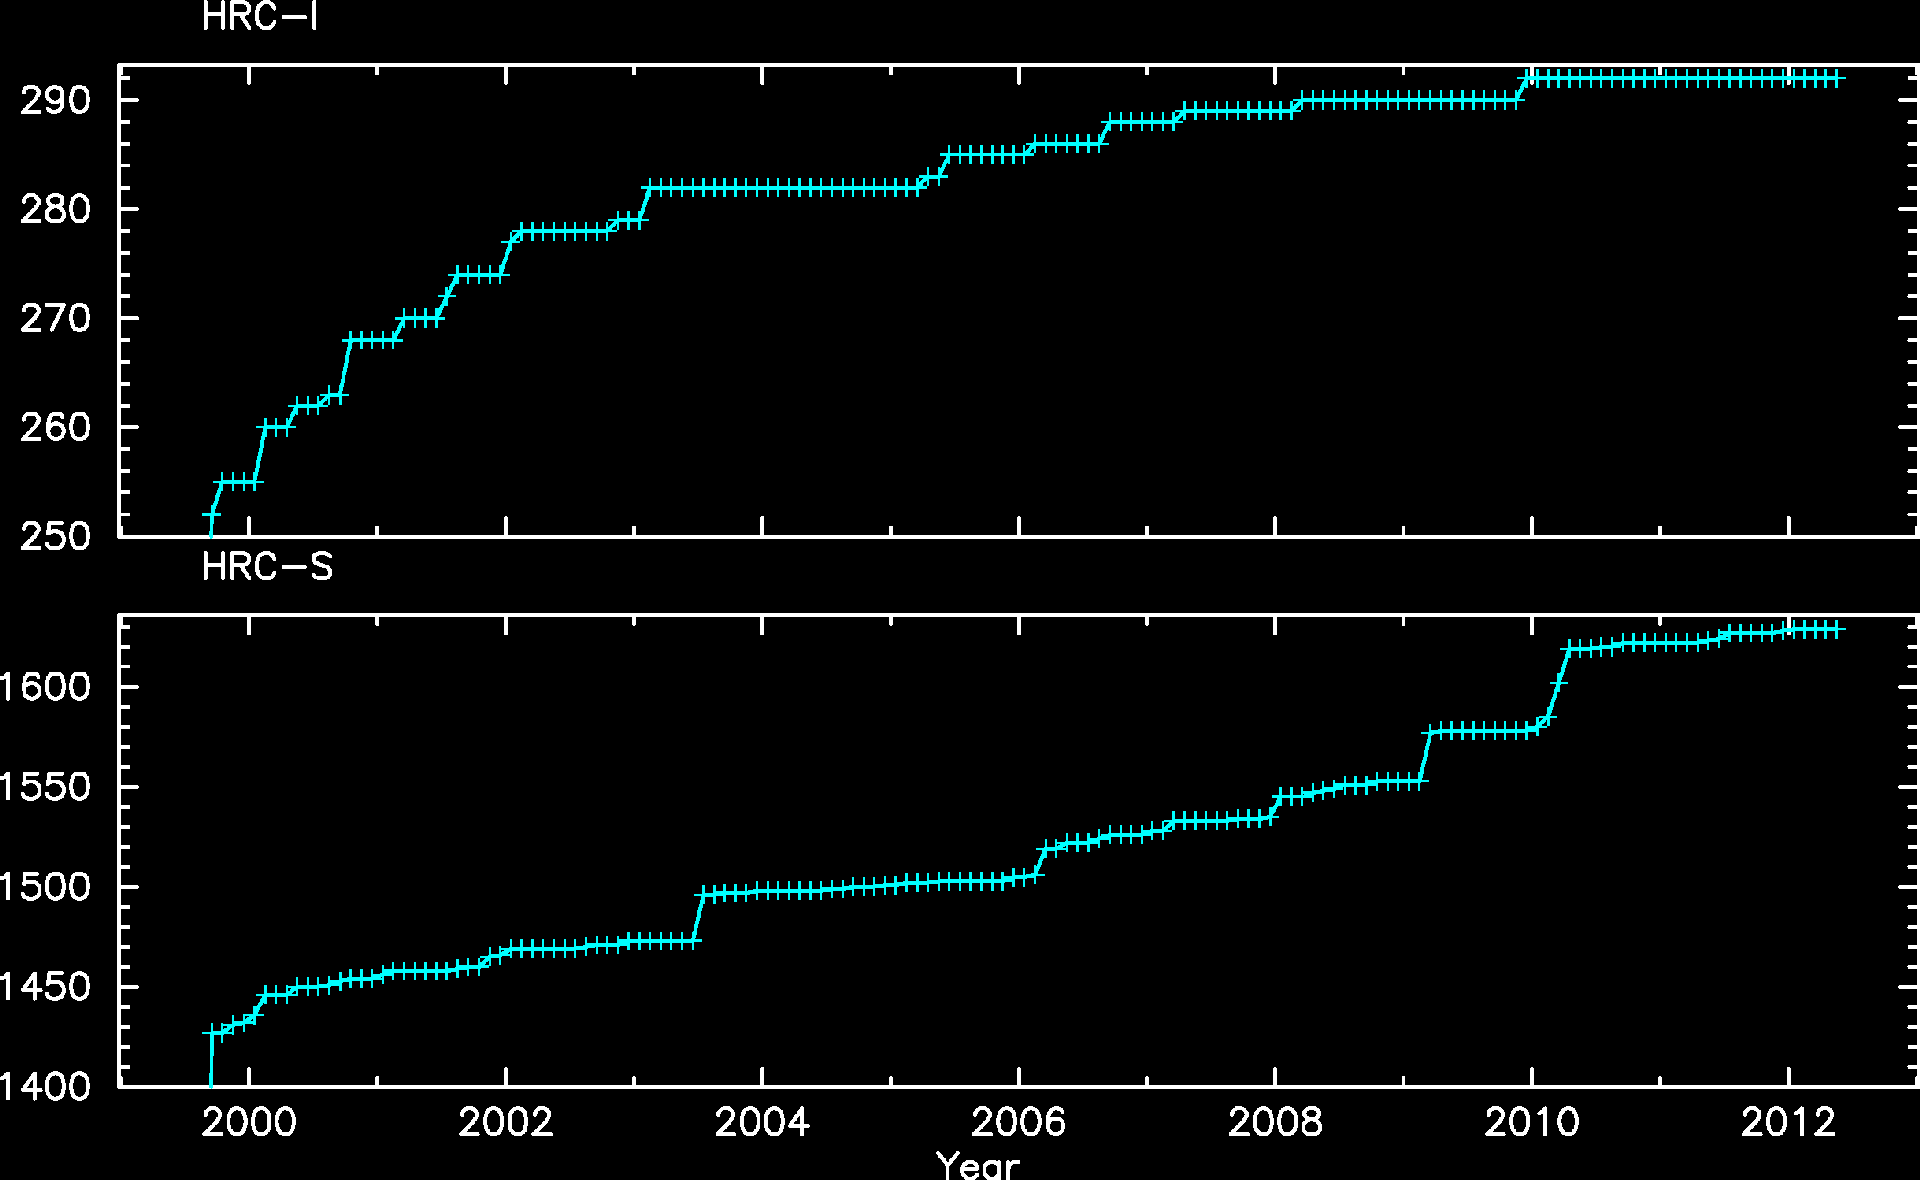
DOSE of Central 4K Pore-Pairs
Please refer to Maximum Dose Trends for more details.
No Data
)
        IMAGE                NPIX      MEAN    STDDEV      MIN       MAX
HRCI_08_1999_05_2012.fits  16777216   3.860    4.706       0.0       292.0
No Data
)
        IMAGE                NPIX     MEAN      STDDEV      MIN      MAX
HRCS_08_1999_05_2012.fits  16777216  13.931      23.110      0.0      1629.0
|
|
Max dose trend plots corrected for events that "pile-up"
in the center of the taps due to bad position information.
|
)
|
)
|
)
|
)
|
| Feb 2012 | Nov 2011 | Aug 2011 | May 2011 |
|---|
)
|
)
|
)
|
)
|
| Feb 2012 | Nov 2011 | Aug 2011 | May 2011 |
|---|
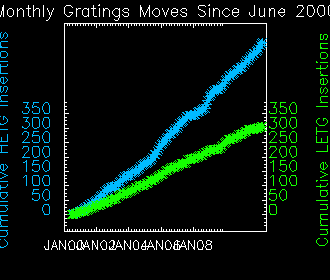
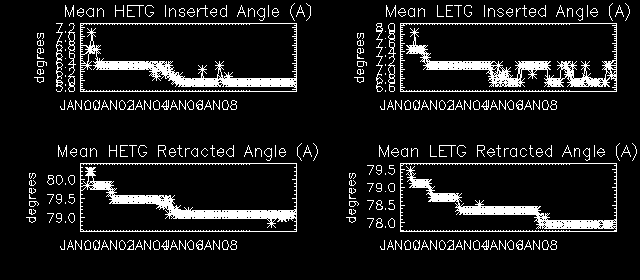
Gratings
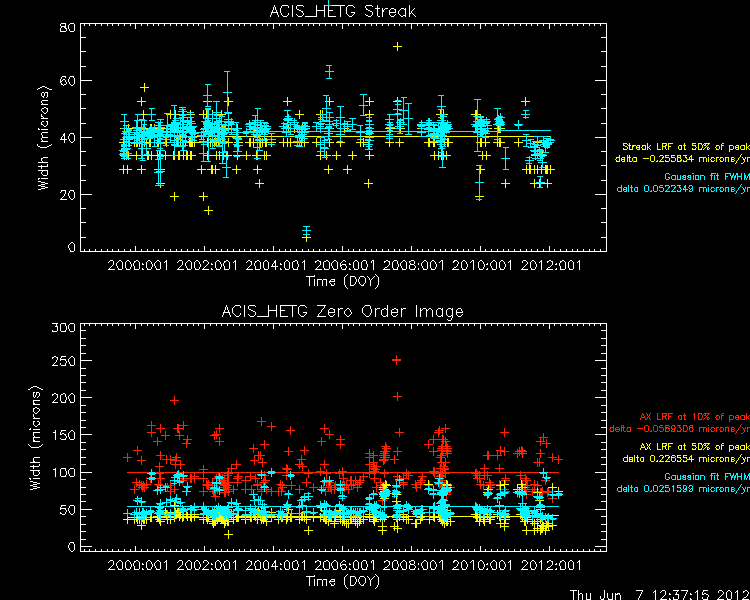
Focus
We plot the width of the zero order streak of ACIS/HETG observations and the width of the zero order image for HRC/LETG observations of point sources. No significant defocusing trend is seen at this time. See Gratings Focus pages.
PCAD
ACA Trending
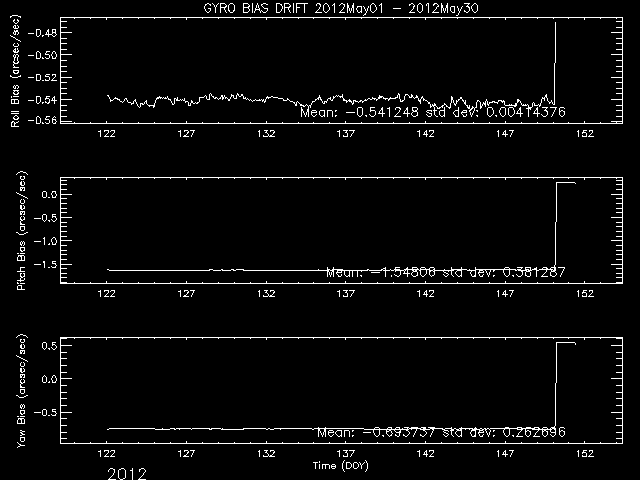
Gyro Bias Drift
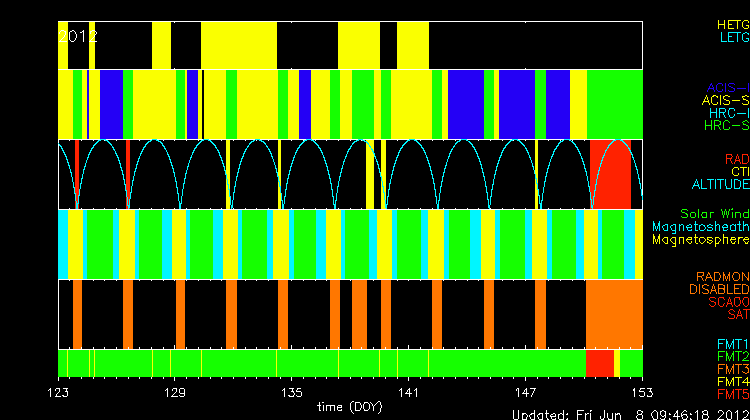
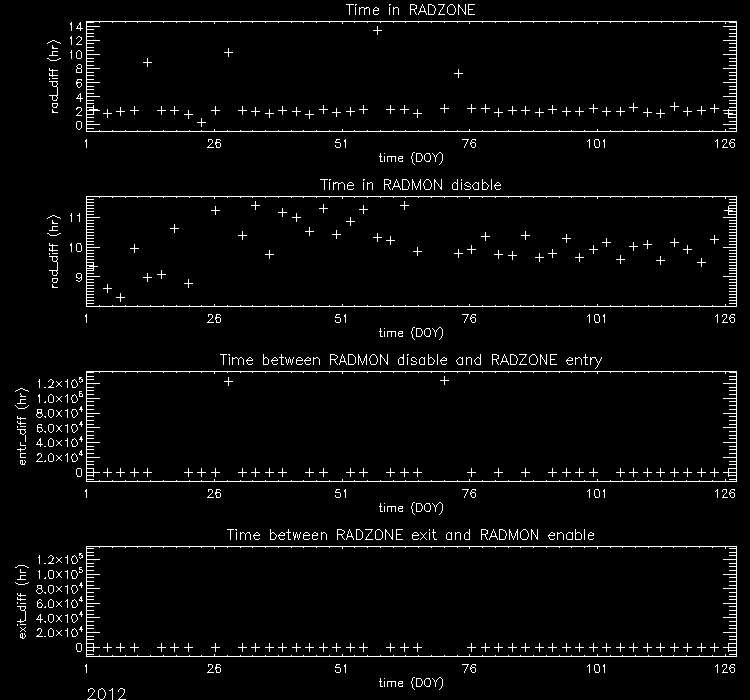
Radiation History
Radiation Zone Timing
Plotted below are radiation zone timing plots based on the following definitions of radiation zone:
- RADZONE - Ephin levels (in any of the E1300,P4GM,P41GM channels) are more than 1/3 of RADMON safing thresholds.
- RADMON - Radmon is disabled for radiation zone (as commanded based on OFLS model, for comparison with actual radiation levels).
- PERIGEE - Time of closest earth approach (for comparison)
Radiation Count Rates of May 2012
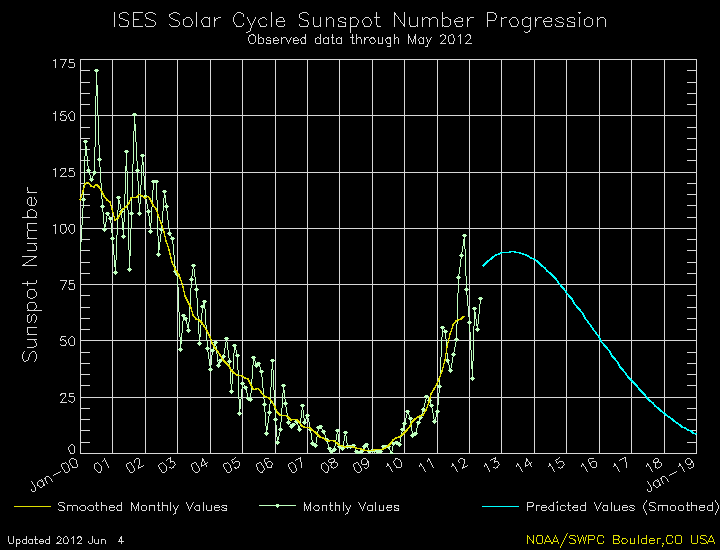
Sun Spot History
Trending
Quarterly Trends
- ACIS Temperature
| Previous Quarter | ||||||
| MSID | MEAN | RMS | DELTA/YR | DELTA/YR/YR | UNITS | DESCRIPTION |
| 1CBAT | 206.01 | 2.19 | 6.627e+00 | -2.003e+02 | K | CAMERA BODY TEMP. A |
| 1CBBT | 206.66 | 2.17 | 5.653e+00 | -1.803e+02 | K | CAMERA BODY TEMP. B |
| 1CRAT | 147.15 | 2.66 | 1.622e+00 | -5.018e+01 | K | COLD RADIATOR TEMP. A |
| 1CRBT | 147.74 | 2.78 | 2.000e+00 | -4.411e+01 | K | COLD RADIATOR TEMP. B |
)
)
)
)
- Ephin Voltage and Temperature
| Previous Quarter | ||||||
| MSID | MEAN | RMS | DELTA/YR | DELTA/YR/YR | UNITS | DESCRIPTION |
| 5EIOT | 340.81 | 15.41 | -4.151e+01 | -3.512e+02 | K | EIO TEMP |
| 5EPHINT | 320.73 | 4.45 | -1.741e+01 | -2.197e+02 | K | EPHIN TEMP |
| HKEBOXTEMP | 325.27 | 4.55 | -1.912e+01 | -2.195e+02 | K | EPHIN HOUSEKEEPING EBOX: TEMPERATURE (5EHSE300) |
| TEIO | 314.26 | 17.64 | -4.927e+01 | -3.857e+02 | K | EPHIN ELECTRONICS HOUSING TEMP |
| TEPHIN | 320.50 | 4.63 | -1.999e+01 | -2.078e+02 | K | EPHIN SENSOR HOUSING TEMP |
)
)
)
)
)
- PCAD Temperature
| Previous Quarter | ||||||
| MSID | MEAN | RMS | DELTA/YR | DELTA/YR/YR | UNITS | DESCRIPTION |
| AACCCDRT | 297.55 | 0.64 | -3.648e+00 | -3.613e+01 | K | AC CCD TEMP (RDNT) |
| AACH1T | 294.66 | 0.69 | -3.851e+00 | -3.886e+01 | K | AC HOUSING TEMP (ACH1) |
| AACH2T | 294.70 | 0.70 | -3.882e+00 | -3.845e+01 | K | AC HOUSING TEMP (ACH2) |
| AAOTALT | 294.30 | 0.69 | -3.861e+00 | -3.884e+01 | K | AC OPT TEL ASSY LENS TEMP |
| AAOTAPMT | 293.62 | 0.70 | -3.889e+00 | -3.734e+01 | K | AC OPT TEL ASSY PRIMARY MIRROR TEMP |
| AAOTASMT | 293.76 | 0.68 | -3.801e+00 | -3.637e+01 | K | AC OPT TEL ASSY SECONDARY MIRROR TEMP |
| AAOTH2MT | 294.22 | 0.68 | -3.824e+00 | -3.733e+01 | K | AC OPT TEL ASSY SECONDARY MIRROR TEMP (HRMA) |
)
)
)
)
)
)
)
Spacecraft Motions
|
|
Reaction Wheel Rotations

Note: From Feb 2010, the computation of reaction wheel rotations are slightly modified.
Links to Past Monthly Reports
| Year | Month | |||||||||||
|---|---|---|---|---|---|---|---|---|---|---|---|---|
| 1999 | Jul | Aug | Sep | Oct | Nov | Dec | ||||||
| 2000 | Jan | Feb | Mar | Apr | May | Jun | Jul | Aug | Sep | Oct | Nov | Dec |
| 2001 | Jan | Feb | Mar | Apr | May | Jun | Jul | Aug | Sep | Oct | Nov | Dec |
| 2002 | Jan | Feb | Mar | Apr | May | Jun | Jul | Aug | Sep | Oct | Nov | Dec |
| 2003 | Jan | Feb | Mar | Apr | May | Jun | Jul | Aug | Sep | Oct | Nov | Dec |
| 2004 | Jan | Feb | Mar | Apr | May | Jun | Jul | Aug | Sep | Oct | Nov | Dec |
| 2005 | Jan | Feb | Mar | Apr | May | Jun | Jul | Aug | Sep | Oct | Nov | Dec |
| 2006 | Jan | Feb | Mar | Apr | May | Jun | Jul | Aug | Sep | Oct | Nov | Dec |
| 2007 | Jan | Feb | Mar | Apr | May | Jun | Jul | Aug | Sep | Oct | Nov | Dec |
| 2008 | Jan | Feb | Mar | Apr | May | Jun | Jul | Aug | Sep | Oct | Nov | Dec |
| 2009 | Jan | Feb | Mar | Apr | May | Jun | Jul | Aug | Sep | Oct | Nov | Dec |
| 2010 | Jan | Feb | Mar | Apr | May | Jun | Jul | Aug | Sep | Oct | Nov | Dec |
| 2011 | Jan | Feb | Mar | Apr | May | Jun | Jul | Aug | Sep | Oct | Nov | Dec |
| 2012 | Jan | Feb | Mar | Apr | ||||||||