ACIS
ACIS DOSE Registered-Photon-Map
The steps we took to compute the dose map are;
- Level 1 Event files for a specified month are obtained from archive.
- Image data including I2, I3, S2, S3 CCDs are extracted from all event files.
- All the extracted image data were merged to create a month long exposure map for the month.
- The exposure map is opened with ds9, and check a distribution of count rates against energy. From this, estimate the upper threshold value. Any events beyond this upper threshold are assumed erroneous events such as bad pixels.
- Using this upper threshold, the data is filtered, and create a cleaned exposure map for the month.
- The exposure map from each month from the Sep 1999 is added up to create a cumulative exposure map for each month.
- Using fimgstatistic, we compute count rate statistics for each CCDs.
- For observations with high data drop rates (e.g., Crab nebula, Cas A), we corrected the observations by adding events.
-
Note: Counts and RMS's of Cumulative maps are lower than the previous months.
This is because we excluded extreme outliers.
Please check more detail plots at Telemetered Photon Dose Trend page.
)
)
)
Statistics:
# IMAGE     NPIX        MEAN           RMS              MIN     MAX
ACIS_dec12 6004901       7.116         12.664           0.0     7685


I2 node 0  262654   7.318291    13.418295   0.0 6664.0
I2 node 1  262654   7.747473    4.091801    0.0  236.0
I2 node 2  262654   7.553436    3.312604    0.0   77.0
I2 node 3  262654   7.620245    15.369608   0.0 7591.0

I3 node 0  262654   7.824502    3.514884    0.0   55.0
I3 node 1  262654   8.354778    7.716820    0.0  172.0
I3 node 2  262654   7.473954    3.246777    0.0   66.0
I3 node 3  262654   7.641644    3.391152    0.0  102.0

S2 node 0  262654   9.166525    15.728389   0.0 5671.0
S2 node 1  262654   9.333069    4.356729    0.0   71.0
S2 node 2  262654   9.618153    20.077173   0.0 7685.0
S2 node 3  262654   9.304468    16.785367   0.0 7349.0

S3 node 0  262654   11.860133   5.097861    0.0  115.0
S3 node 1  262654   12.740052   4.312762    0.0   93.0
S3 node 2  262654   12.180143   3.666456    0.0   58.0
S3 node 3  262654   11.062387   3.489672    0.0   32.0
)
)
)
Statistics:
 IMAGE        NPIX      MEAN             RMS            MIN    MAX
ACIS_total   6004901       1677.255         2216.967           0.0    99094


I2 node 0  262654   1396.597576 274.904556     0.0   8809.0
I2 node 1  262654   1468.973765 367.656648     0.0  32174.0
I2 node 2  262654   1499.179325 323.056219     0.0   6487.0
I2 node 3  262654   1494.622710 379.352806     0.0   9282.0

I3 node 0  262654   1570.395647 385.526412     0.0   6198.0
I3 node 1  262654   1649.138363 1249.431951    0.0  31959.0
I3 node 2  262654   1436.350179 265.423462     0.0   6984.0
I3 node 3  262654   1421.572166 282.365317     0.0  25005.0

S2 node 0  262654   2027.557311 309.256727  1059.0  28561.0
S2 node 1  262654   2164.279914 475.145074  1096.0  11939.0
S2 node 2  262654   2398.099977 472.685570  1442.0  41973.0
S2 node 3  262654   2331.223170 360.836973  1379.0  38091.0

S3 node 0  262654   3502.503309 1675.049760 1455.0  12665.0
S3 node 1  262654   4598.558291 1886.669840    0.0  12944.0
S3 node 2  262654   3549.867253 903.695072  1407.0   8927.0
S3 node 3  262654   2778.260734 445.185851  1579.0   9115.0
)
|
)
|
)
|
)
|
| Sep 2012 | Jun 2012 | Mar 2012 | Dec 2011 |
|---|
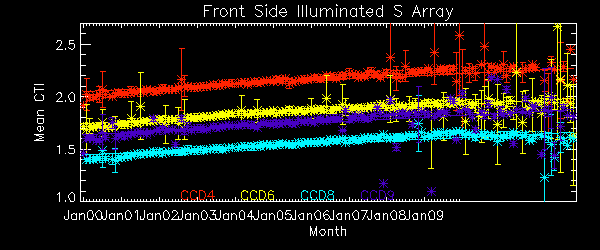
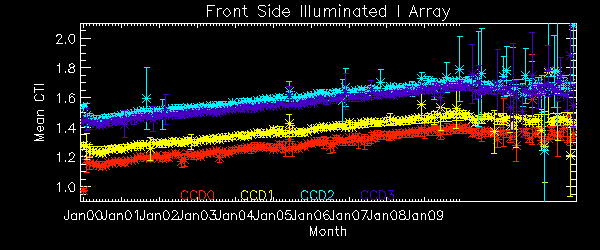
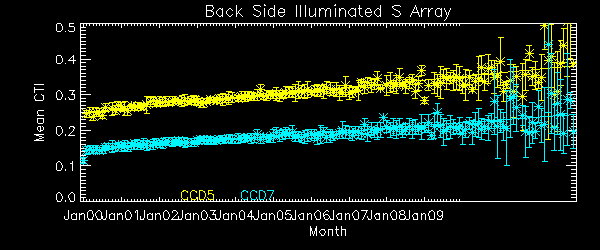
The Mean Detrended CTI
We report CTIs with a refined data definition. CTIs were computed for the temperature dependency corrected data. Please see CTI page for detailed explanation. CTI's are computed for Mn K alpha, and defined as slope/intercept x10^4 of row # vs ADU. Data file: here
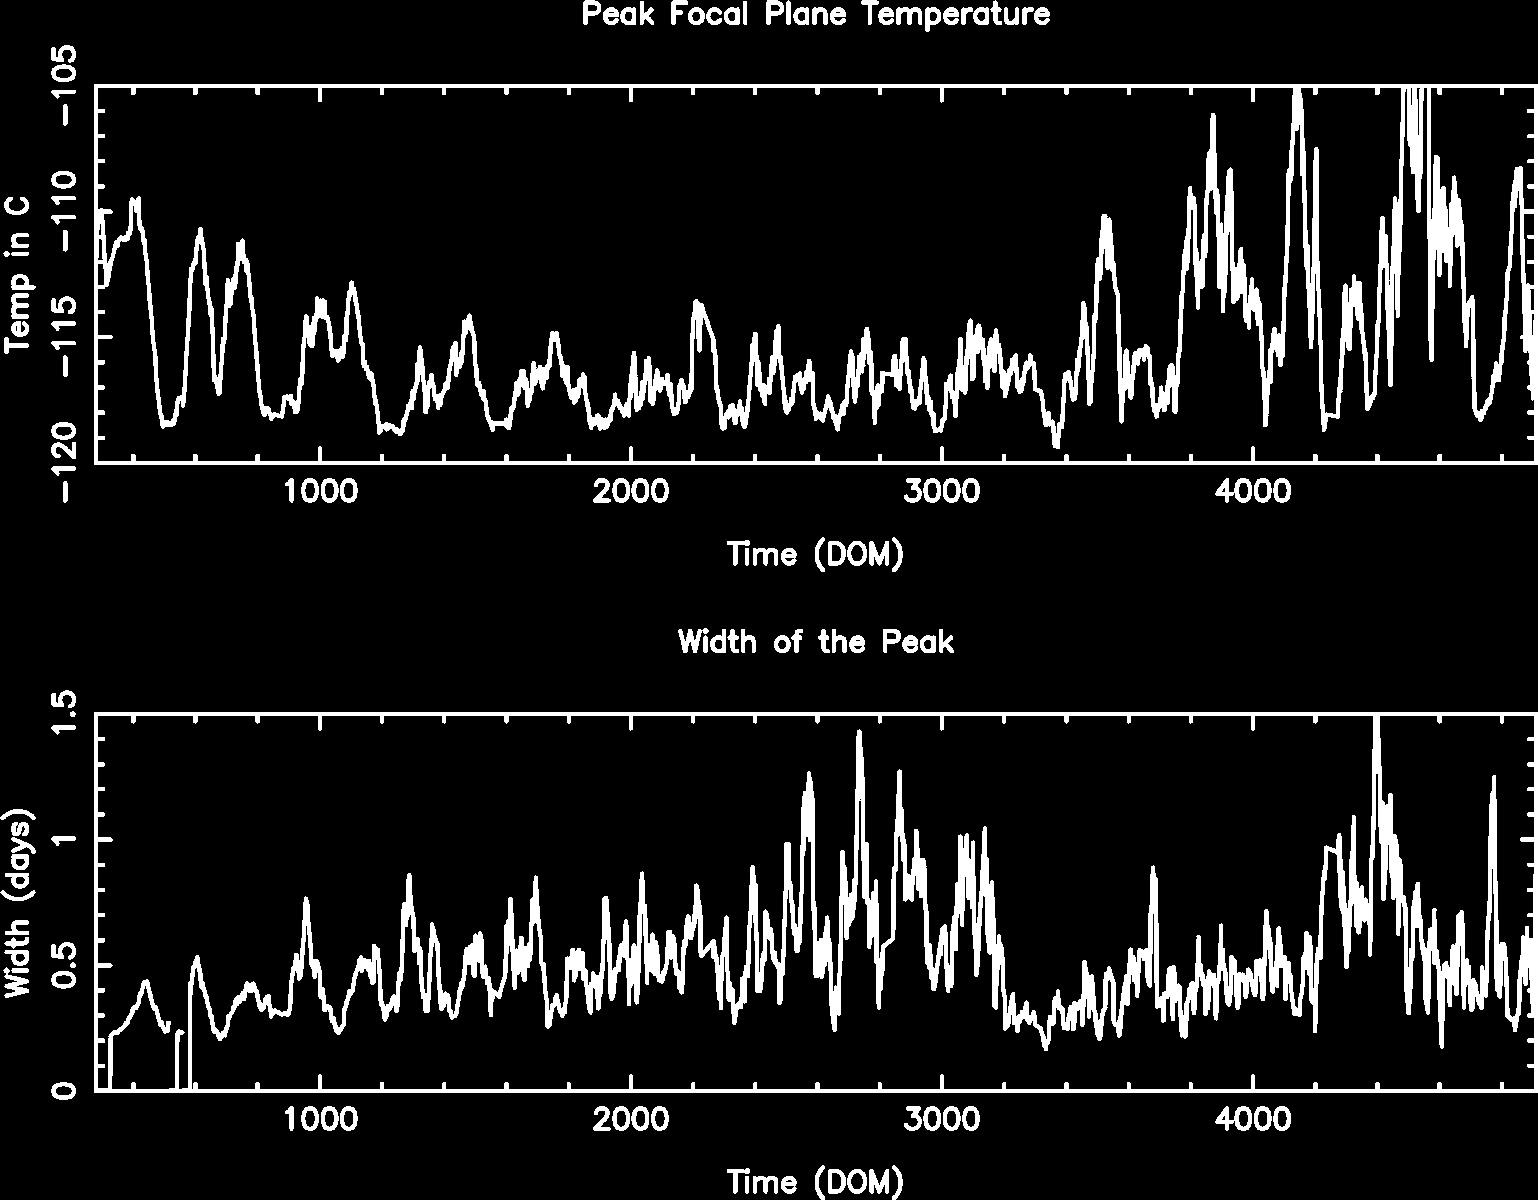
Focal Plane Temperature
Dec 2012 Focal Temperature
| The Mean (max) FPT: | |
|---|---|
| -115.66 | +/- 3.40 C |
| Mean Width: | |
| 0.66 | +/- 0.58 days |
Averaged Focal Plane Temperature
We are using 10 period moving averages to show trends of peak temperatures and peak widths. Note, the gaps in the width plot are due to missing/corrupted data.
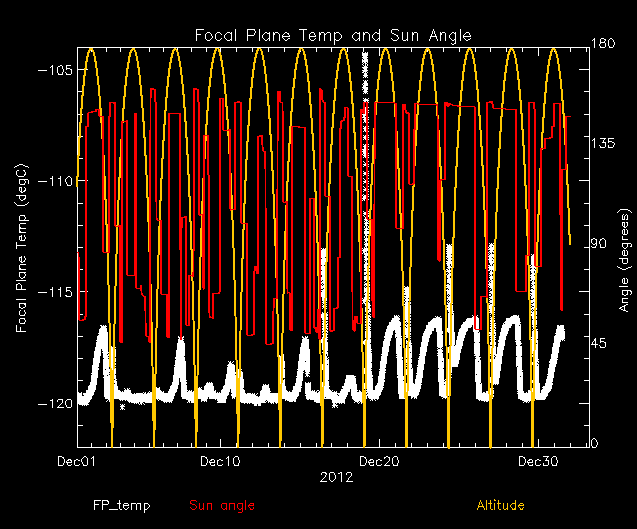
Focal Plane Temperature, Sun Angle and Altitude
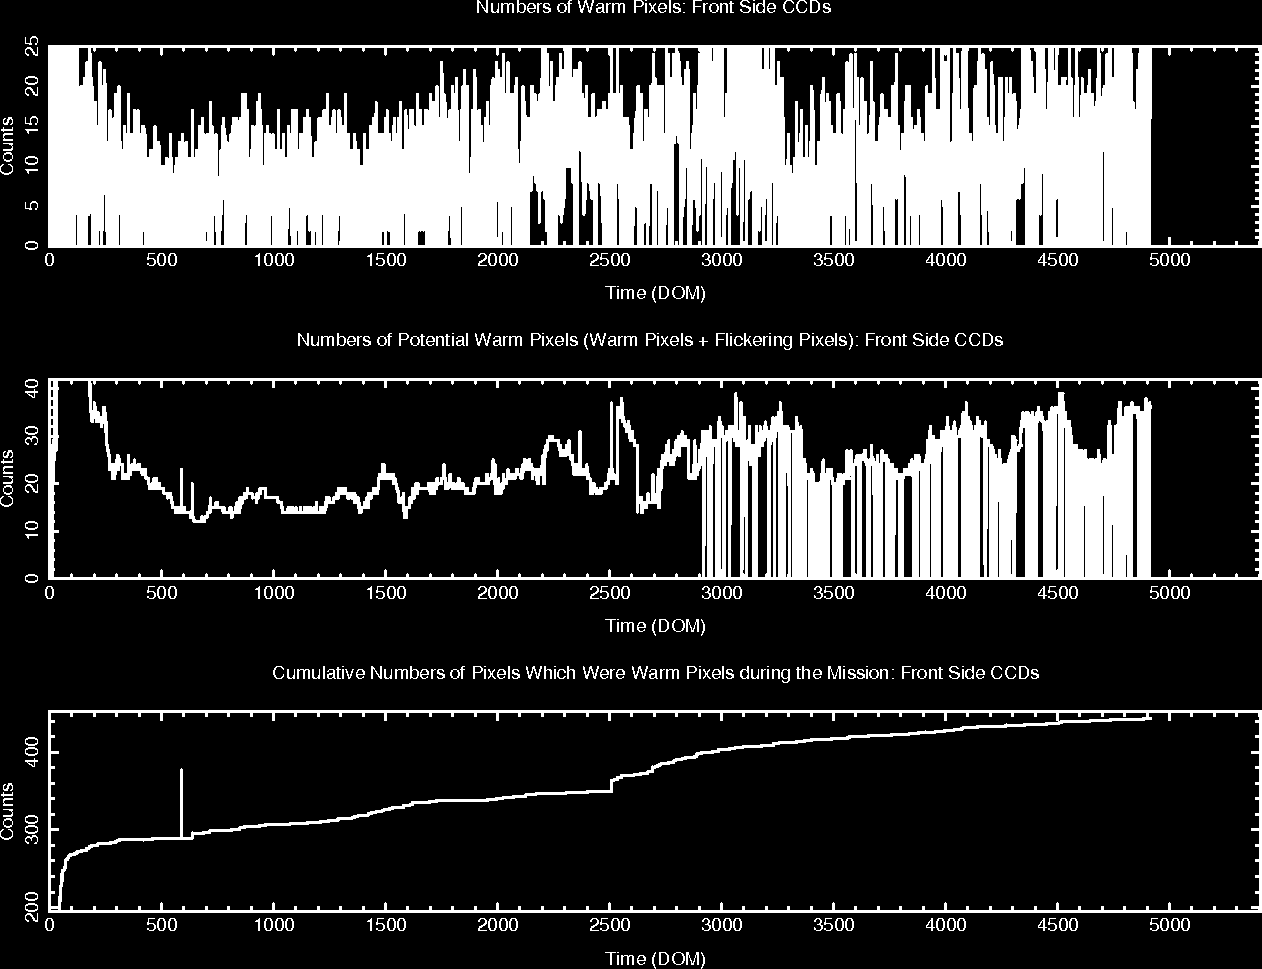
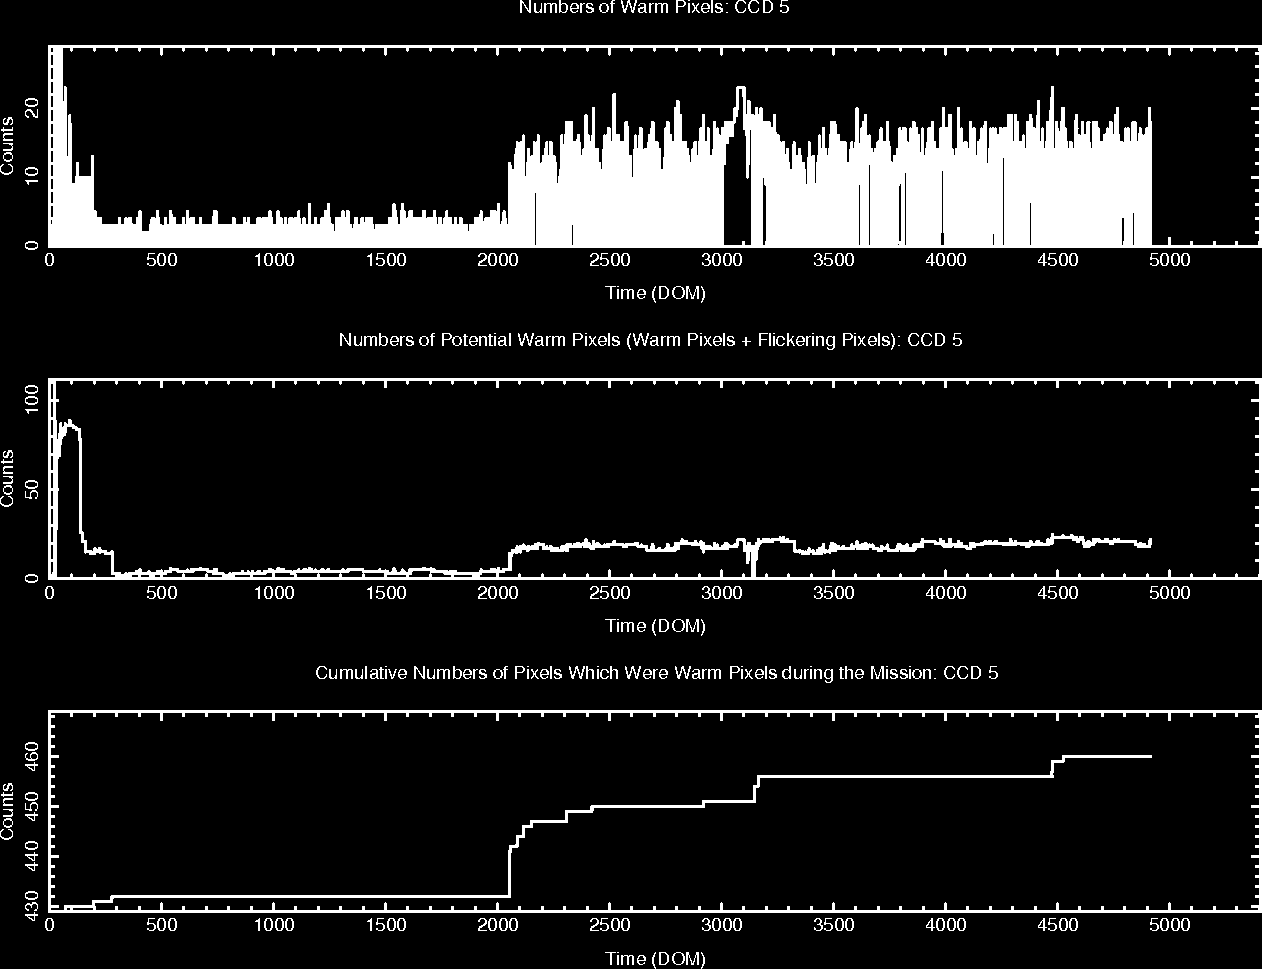
Bad Pixels
The plots below were generated with a new warm pixel finding script. Please see Acis Bad Pixel Page for details.
Front Side CCDs
Back Side CCD (CCD5)
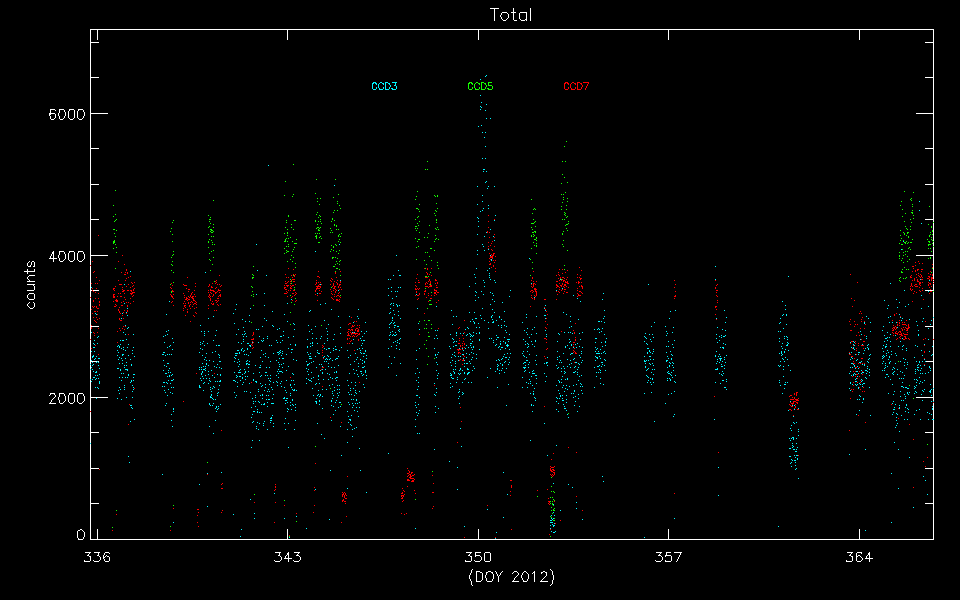
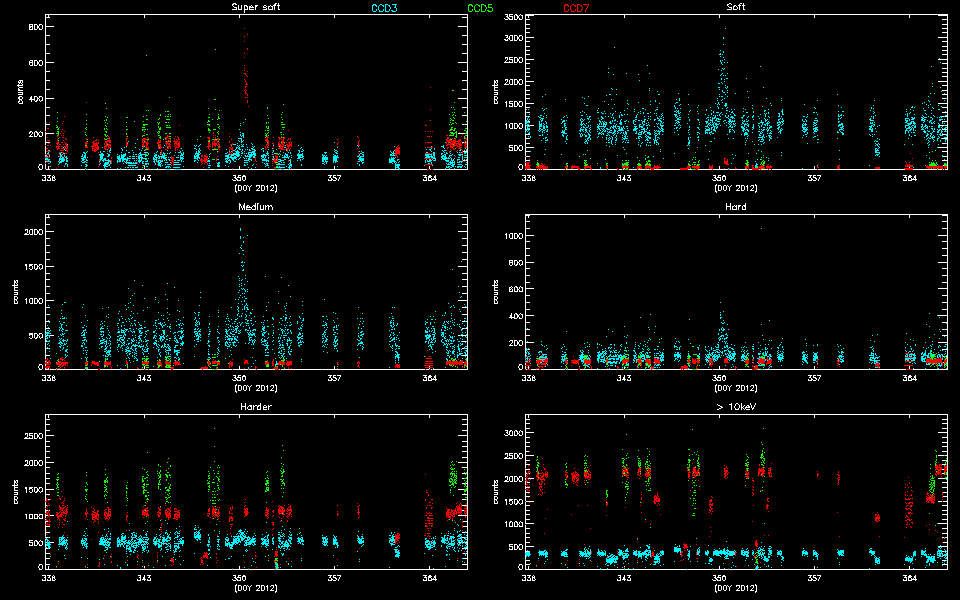
Science Instrument Background Rates
| Name | Low (keV) | High(KeV) | Description |
|---|---|---|---|
| SSoft | 0.00 | 0.50 | Super soft photons |
| Soft | 0.50 | 1.00 | Soft photons |
| Med | 1.00 | 3.00 | Moderate energy photons |
| Hard | 3.00 | 5.00 | Hard Photons |
| Harder | 5.00 | 10.00 | Very Hard photons |
| Hardest | 10.00 | Beyond 10 keV |
HRC
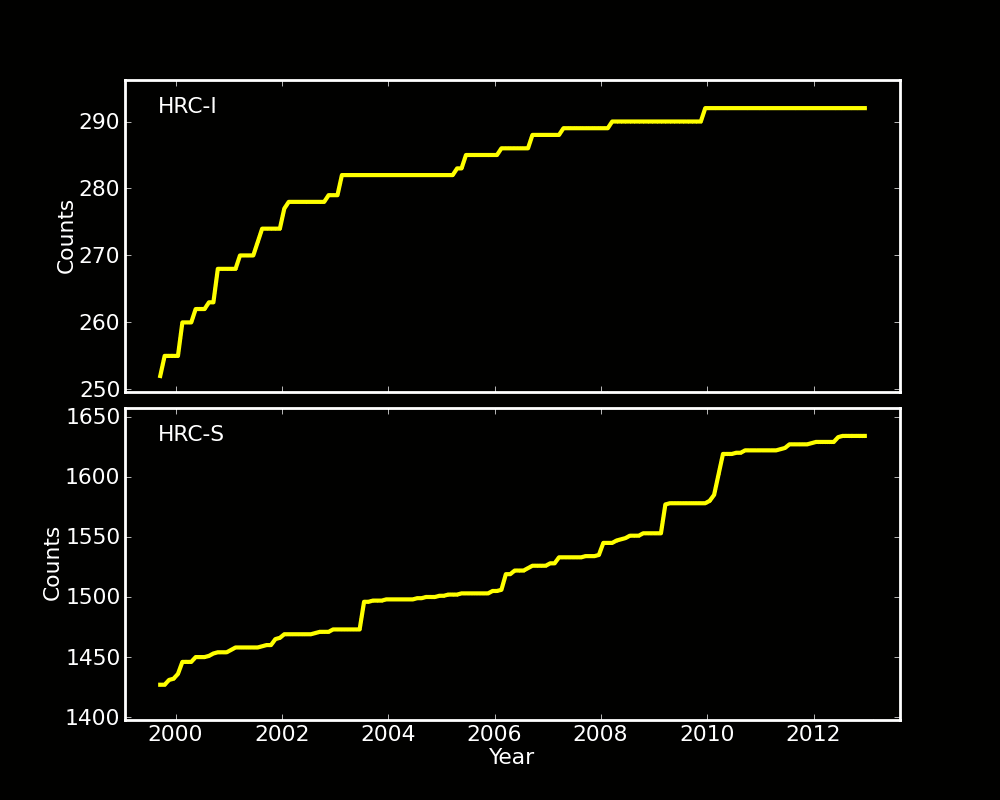
DOSE of Central 4K Pore-Pairs
Please refer to Maximum Dose Trends for more details.
)
        IMAGE                NPIX      MEAN    STDDEV      MIN       MAX
HRCI_12_2012.fits          16777216   0.015    0.1300      0.0       10.0
)
        IMAGE                NPIX      MEAN    STDDEV      MIN       MAX
HRCI_08_1999_12_2012.fits  16777216   3.921    4.759       0.0       292.0
)
         IMAGE                NPIX      MEAN    STDDEV      MIN       MAX
HRCS_12_2012.fits          16777216   0.010    0.101       0.0        3.0
)
        IMAGE                NPIX     MEAN      STDDEV      MIN      MAX
HRCS_08_1999_12_2012.fits  16777216  14.229      23.922      0.0      1634.0
|
|
Max dose trend plots corrected for events that "pile-up"
in the center of the taps due to bad position information.
|
)
|
)
|
)
|
)
|
| Sep 2012 | Jun 2012 | Mar 2012 | Dec 2011 |
|---|
)
|
)
|
)
|
)
|
| Sep 2012 | Jun 2012 | Mar 2012 | Dec 2011 |
|---|
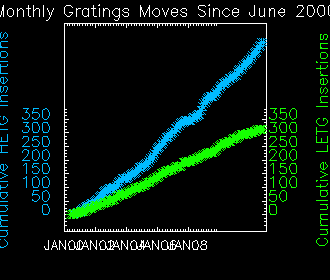
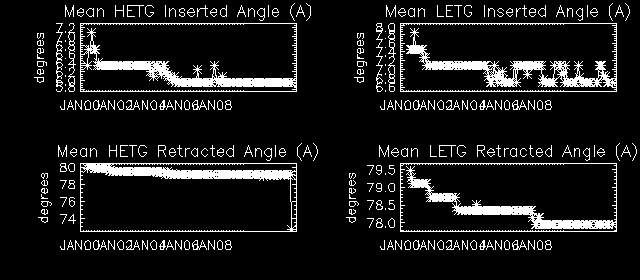
Gratings
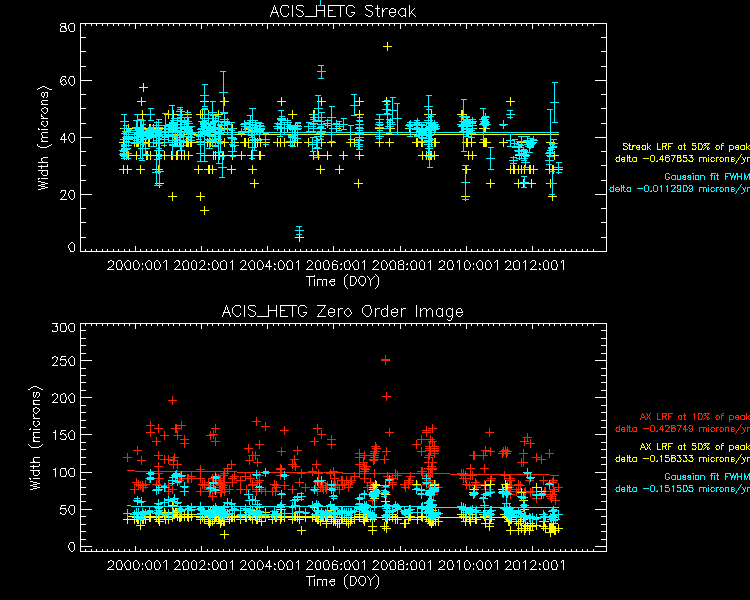
Focus
We plot the width of the zero order streak of ACIS/HETG observations and the width of the zero order image for HRC/LETG observations of point sources. No significant defocusing trend is seen at this time. See Gratings Focus pages.
PCAD
ACA Trending
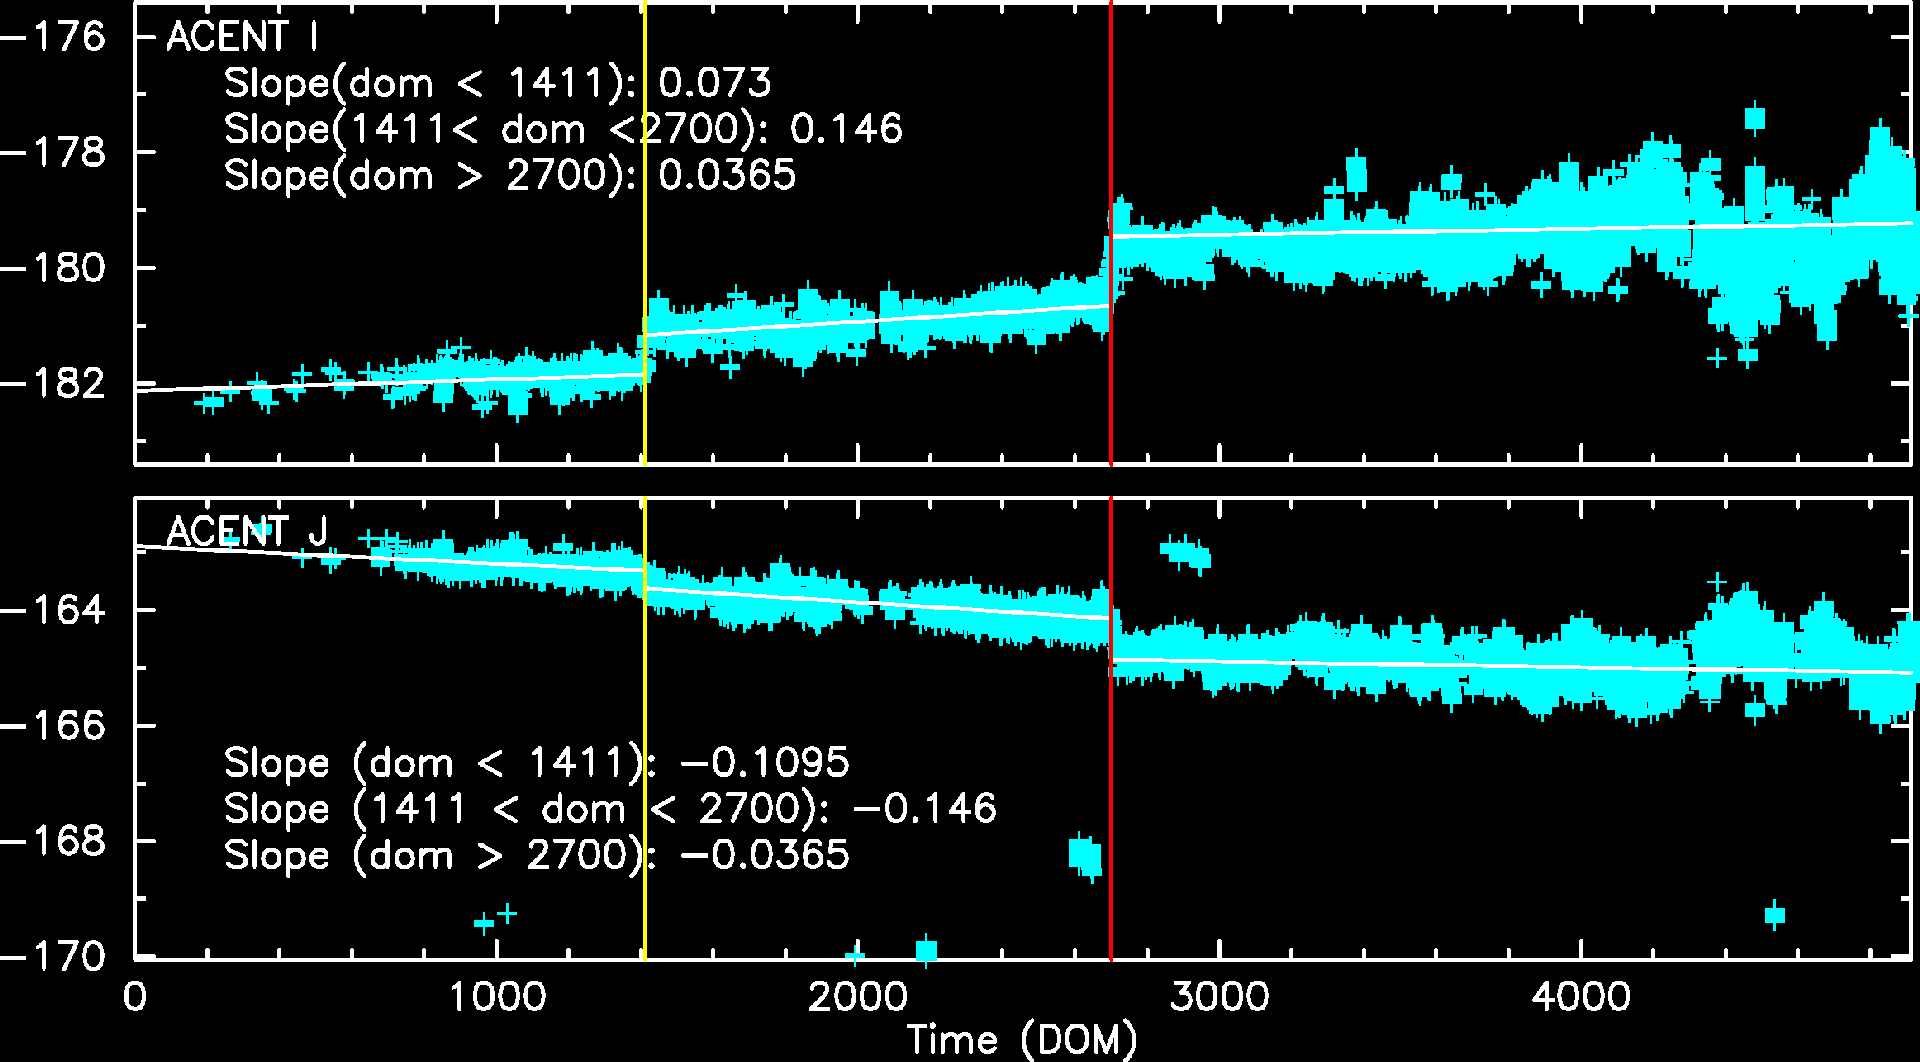
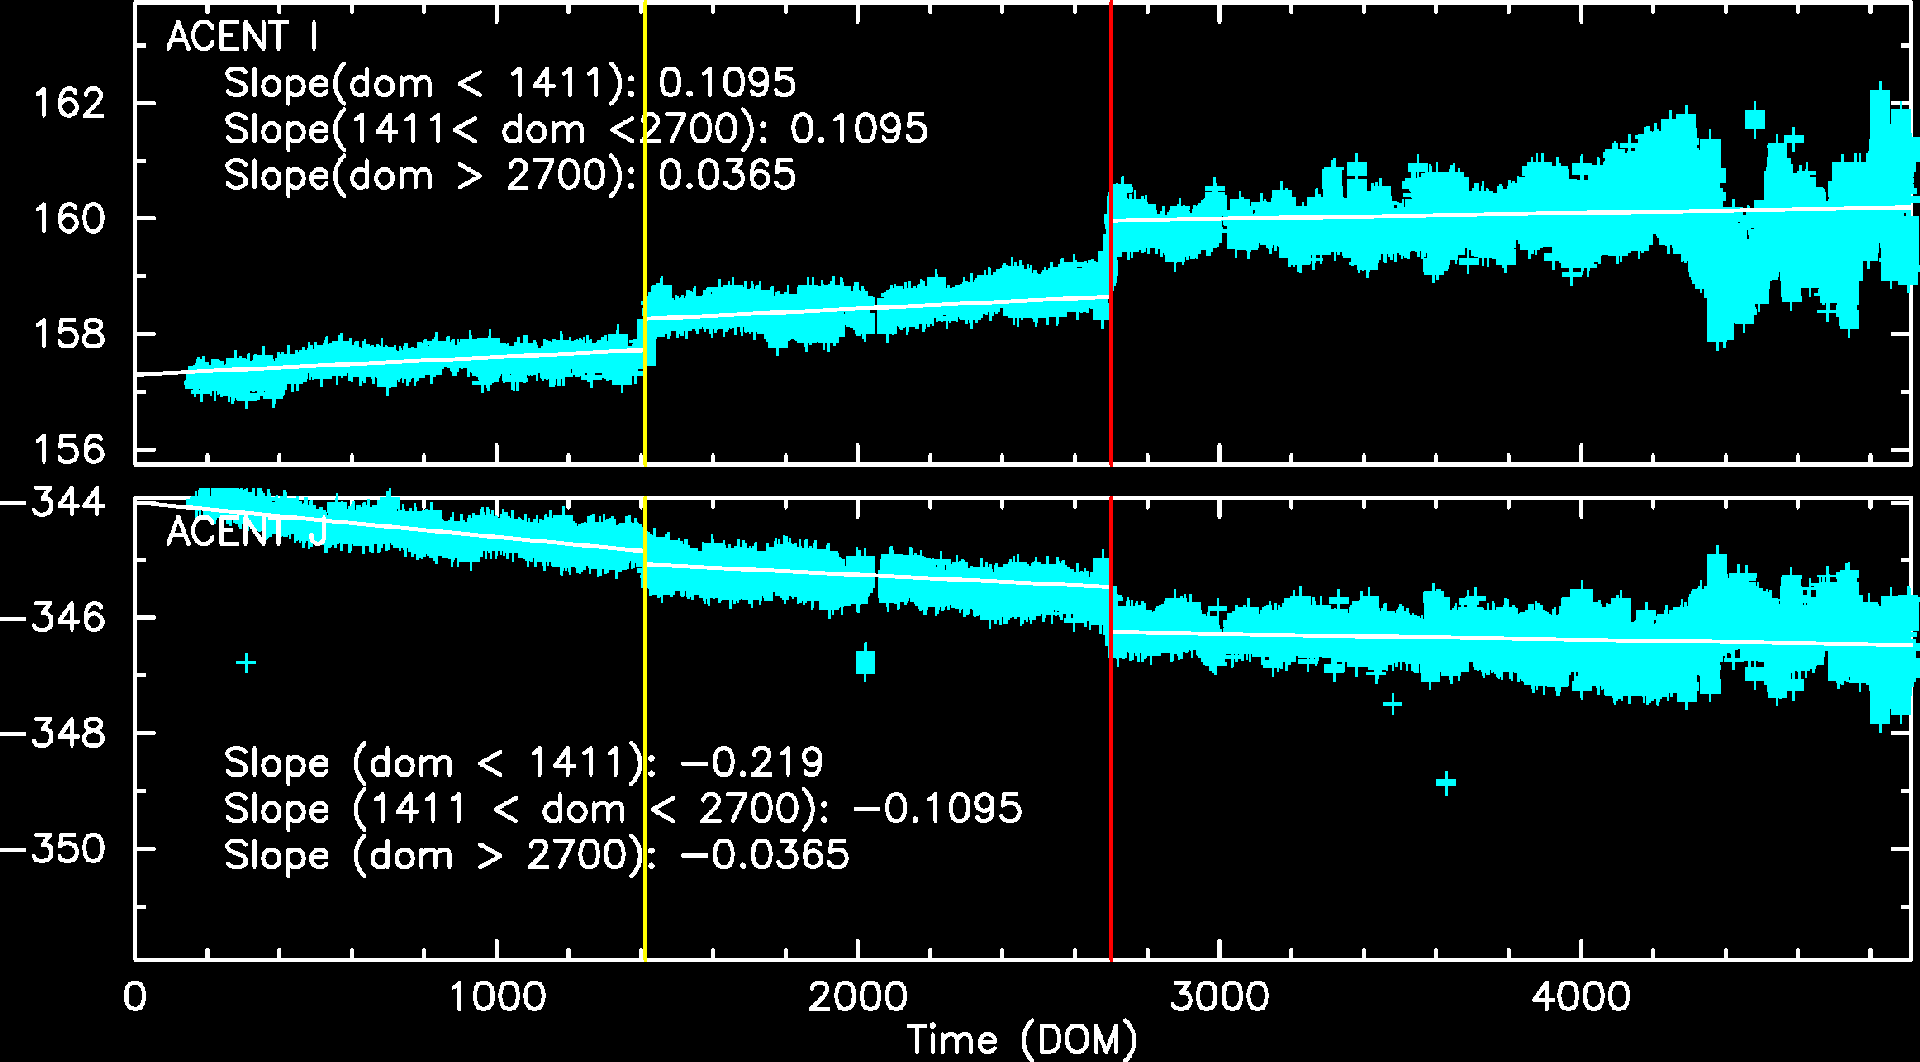
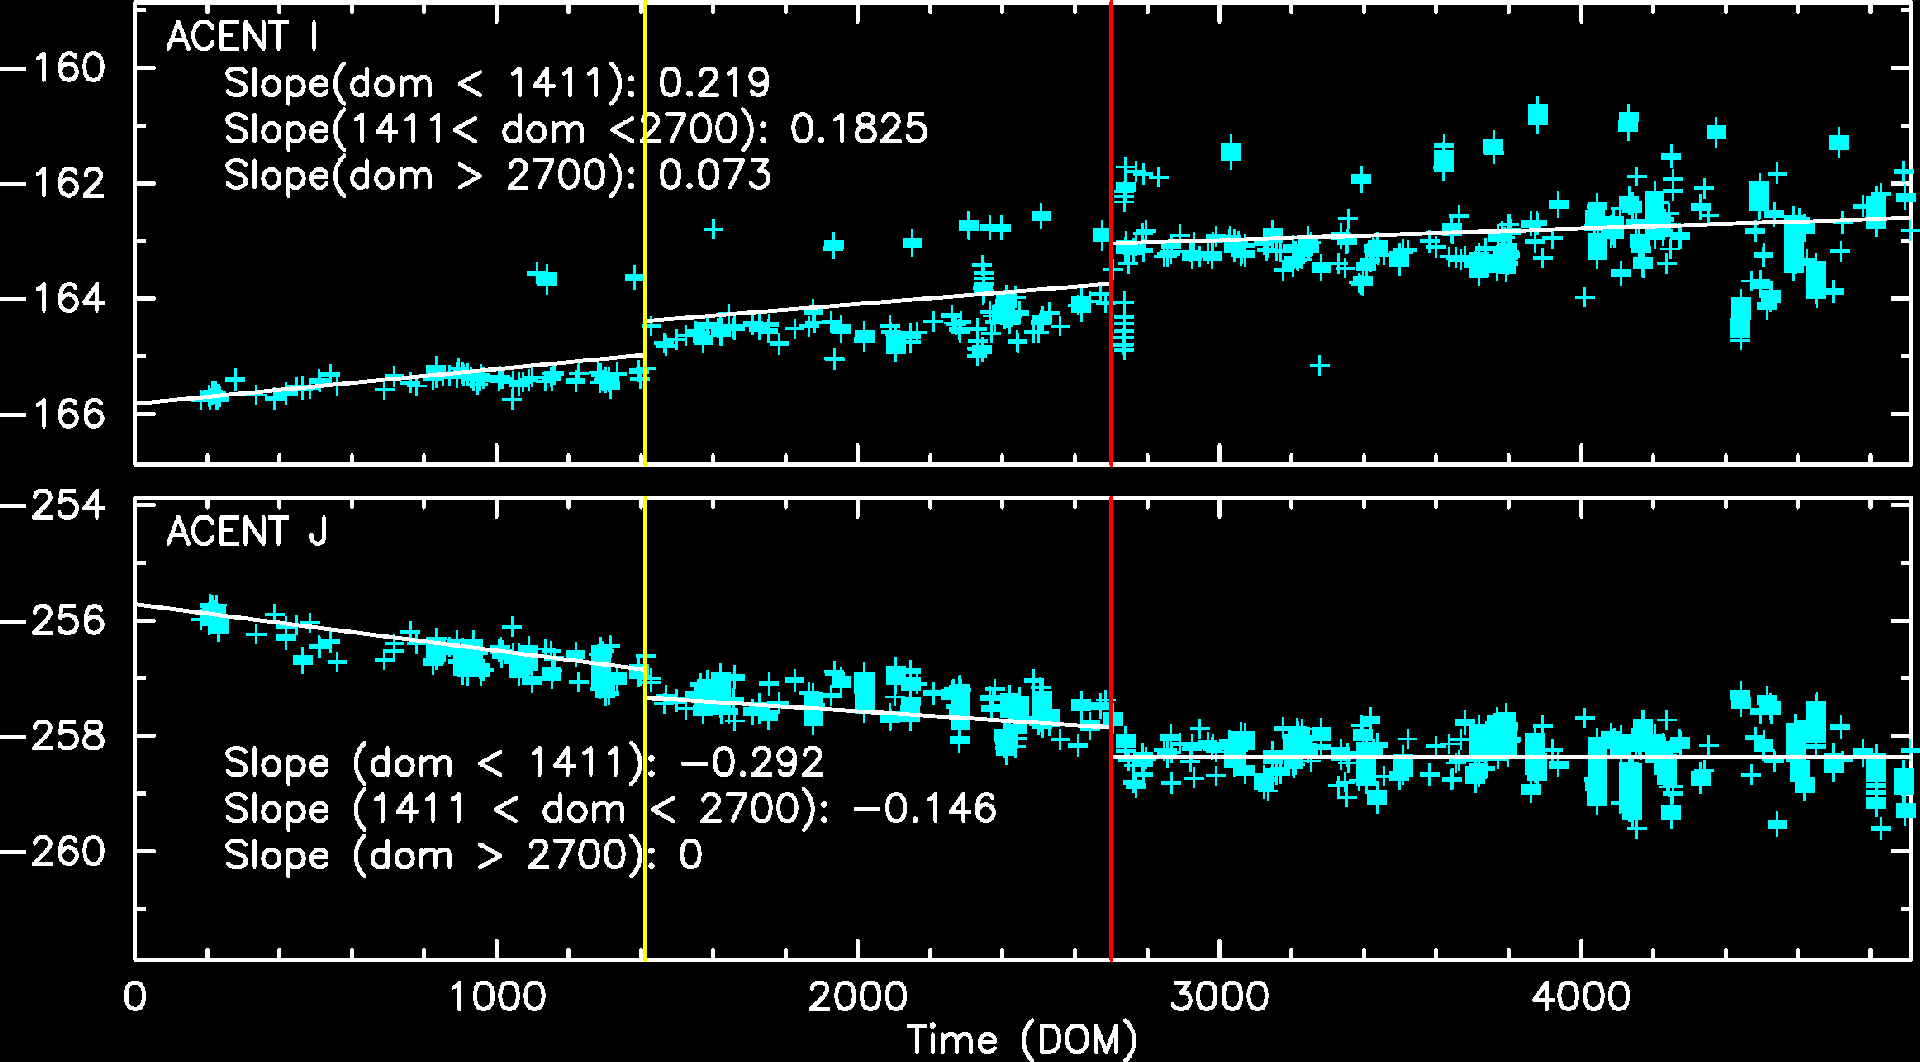
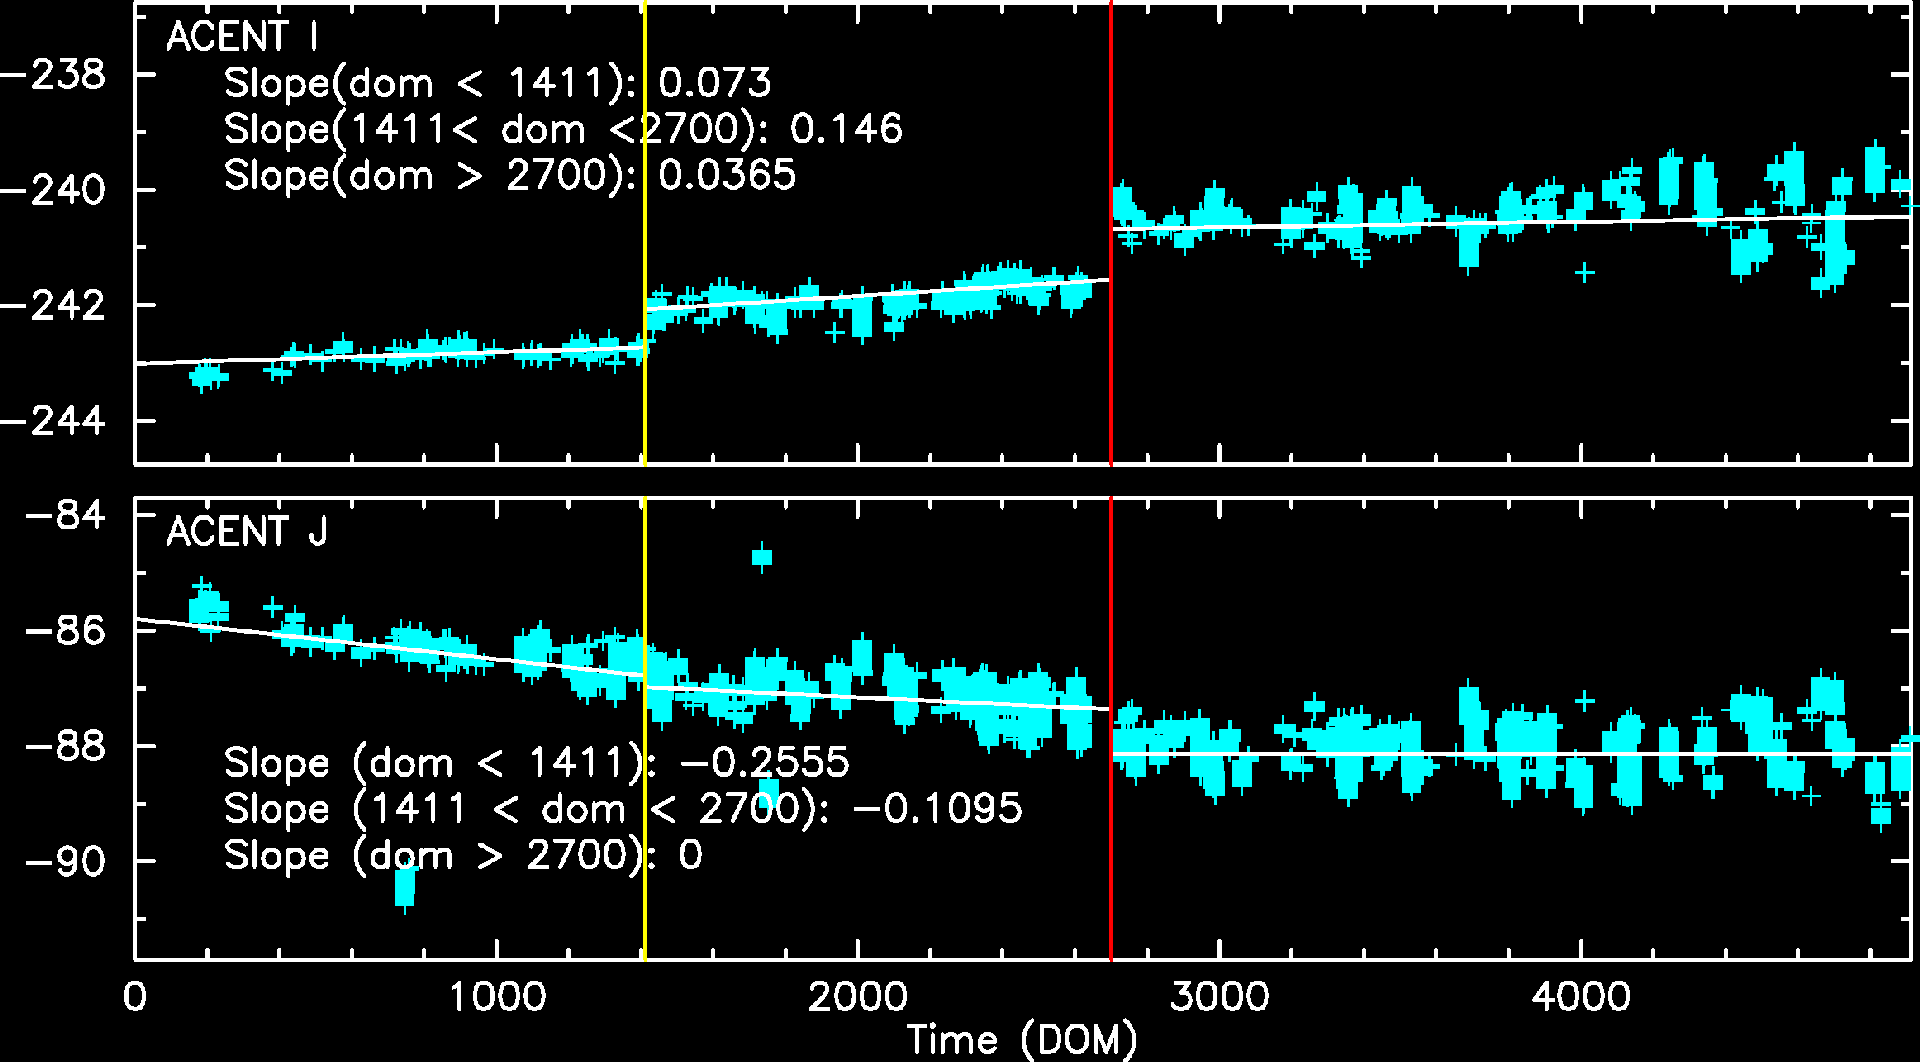
Fid Light Drift
Fid light positions on ACA drift with time. The drift trends of Fid light 2 with ACIS-I and ACIS-S configurations are shown below.
The top panel shows Fid light 2 drift in ACENT I (app. along with -Y axis), and the
bottom panel shows that in ACENT J (app. along with Z axis). The unit is a pixel, and
one pixel is approximately 0.5 arcsec. The slope listed at the top right corner is
the change in a position per year (arcsec/yr). The vertical line on DOM = 1411 (Jun 1, 2003)
indicates a transition date of use of IRU-1 to IRU-2.
See also Tom Aldcroft's updated page:
https://cxc.cfa.harvard.edu/mta/ASPECT/fid_drift
Fid 2 (ACIS-I)
Fid 2 (ACIS-S)
Fid 8 (HRC-I)
Fid 12 (HRC-S)
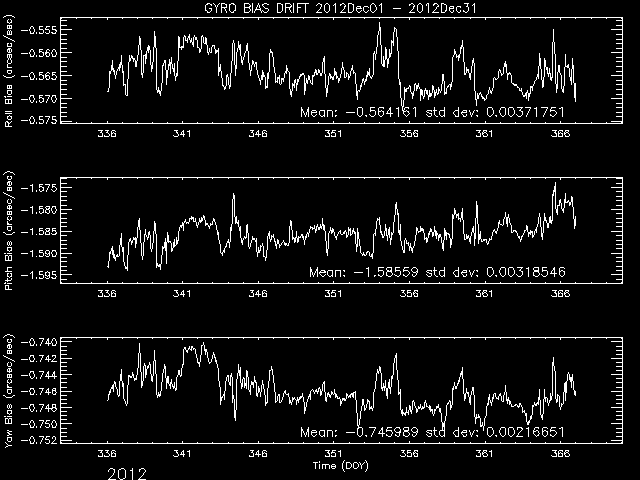
Gyro Bias Drift
Radiation History
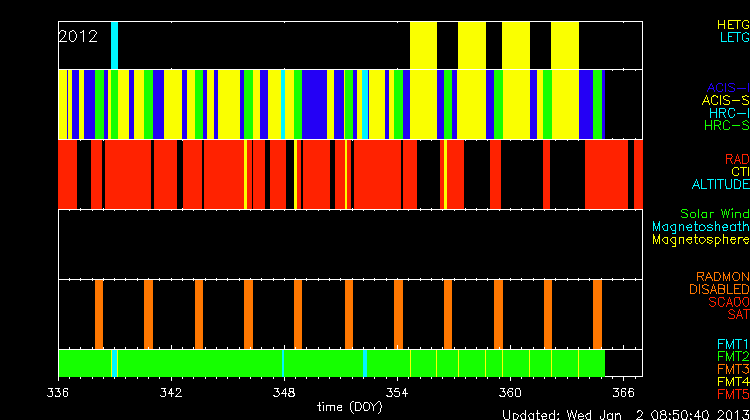
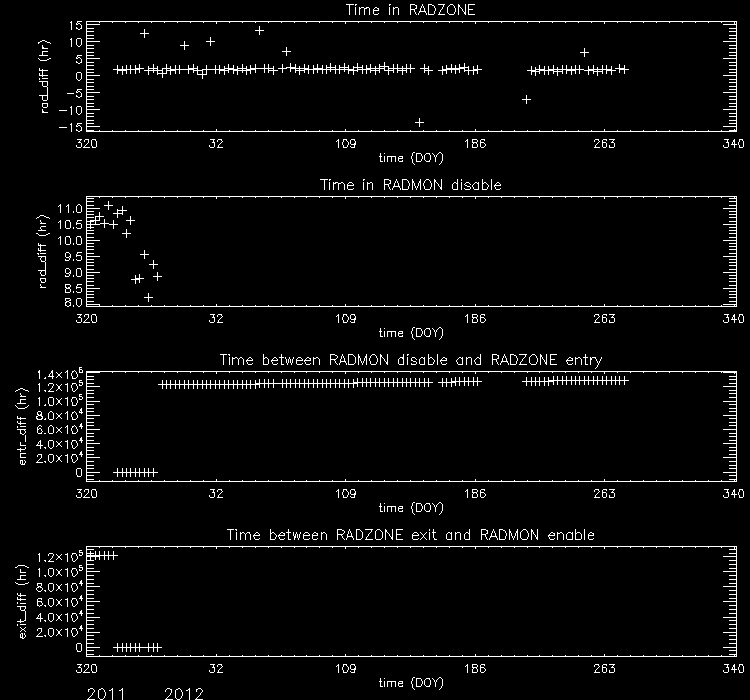
Radiation Zone Timing
Plotted below are radiation zone timing plots based on the following definitions of radiation zone:
- RADZONE - Ephin levels (in any of the E1300,P4GM,P41GM channels) are more than 1/3 of RADMON safing thresholds.
- RADMON - Radmon is disabled for radiation zone (as commanded based on OFLS model, for comparison with actual radiation levels).
- PERIGEE - Time of closest earth approach (for comparison)
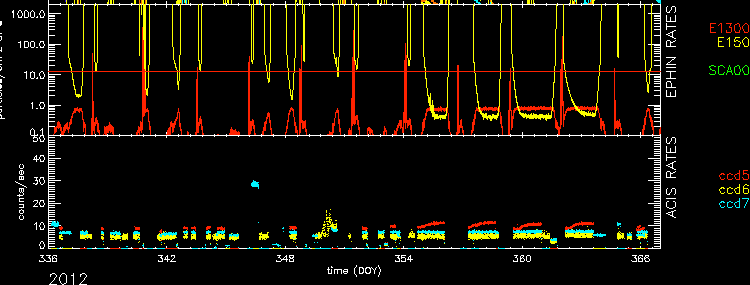
Radiation Count Rates of Dec 2012
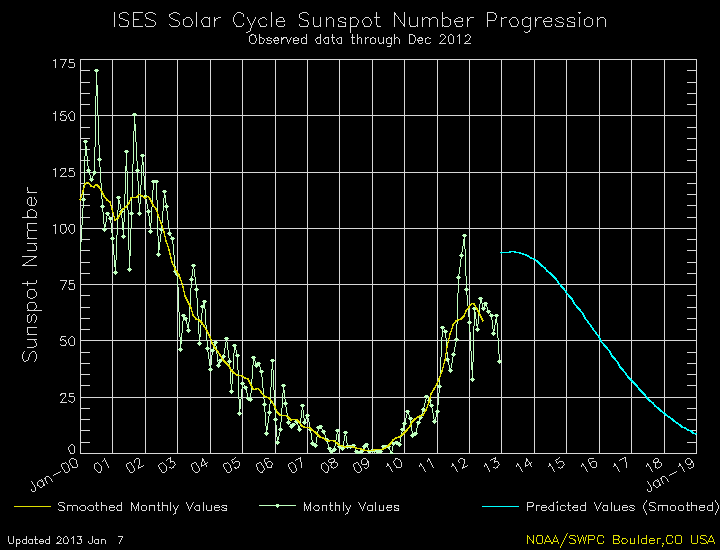
Sun Spot History
Trending
Critical Trends
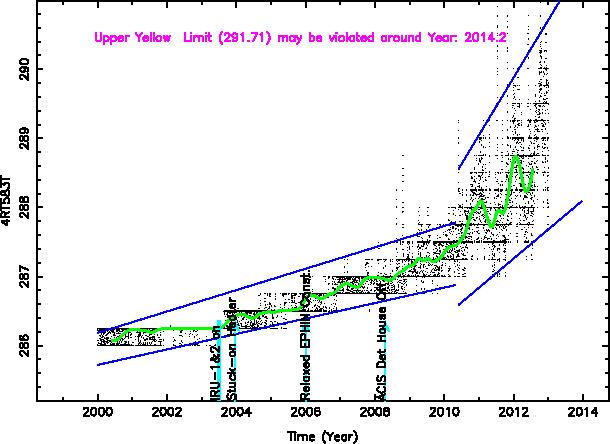
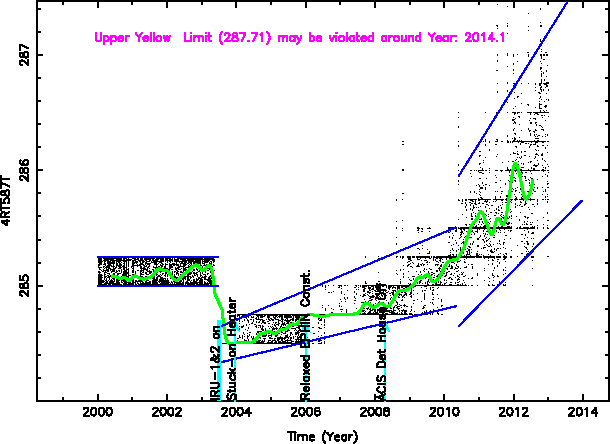
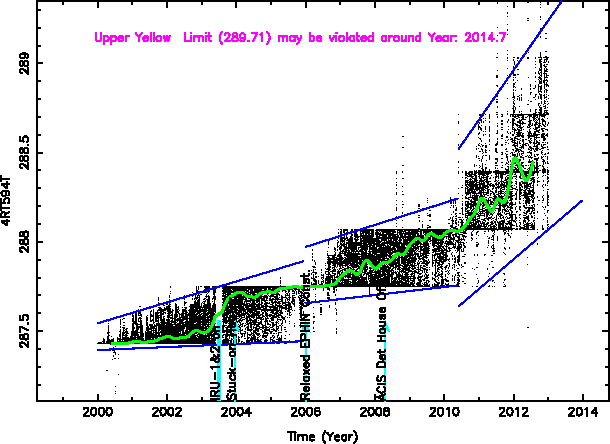
| ACIS Temperatures - Daily Maximums | ||||||
|---|---|---|---|---|---|---|
| MSID | MEAN | RMS | DELTA/YR | DELTA/YR/YR | UNITS | DESCRIPTION |
| MSID | MEAN | RMS | DELTA/YR | DELTA/YR/YR | UNITS | DESCRIPTION |
| 1PDEAAT | 305.48 | 9.15 | -5.366e-01 | 9.739e-01 | K | PSMC DEA PS A TEMP |
| 1PIN1AT | 292.05 | 8.26 | -2.857e-01 | -2.619e-01 | K | PSMC TEMP 1A |
)
)
| HRMA Computed Averages - Daily Maximums | ||||||
|---|---|---|---|---|---|---|
| MSID | MEAN | RMS | DELTA/YR | DELTA/YR/YR | UNITS | DESCRIPTION |
| OBAAVG | 285.21 | 1.47 | 3.603e-01 | 7.370e-02 | K | OBA/TFTE TEMP |
)
| EPHIN Temperatures - Daily Maximums | ||||||
|---|---|---|---|---|---|---|
| MSID | MEAN | RMS | DELTA/YR | DELTA/YR/YR | UNITS | DESCRIPTION |
| TEIO | 321.47 | 21.02 | 1.133e+01 | -1.275e+01 | K | EPHIN ELECTRONICS HOUSING TEMP |
| TEPHIN | 322.33 | 6.33 | 4.597e+00 | 1.485e+00 | K | EPHIN SENSOR HOUSING TEMP |
)
)
| S/C Main Temperatures - Daily Maximums | ||||||
|---|---|---|---|---|---|---|
| MSID | MEAN | RMS | DELTA/YR | DELTA/YR/YR | UNITS | DESCRIPTION |
| TCYLFMZM | 303.18 | 26.36 | 1.052e+00 | 9.458e-01 | K | CNT CYL TEMP:-Z SIDE UNDER LAE-1 | 305.47 | 25.19 | 1.080e+00 | 1.404e+00 | K | CNT CYL TEMP:-Z SIDE UNDER LAE-2 |
)
| S/C Ancillary Temperatures - Daily Maximums | ||||||
|---|---|---|---|---|---|---|
| MSID | MEAN | RMS | DELTA/YR | DELTA/YR/YR | UNITS | DESCRIPTION |
| TFSSBKT1 | 333.11 | 20.02 | 5.557e+00 | -1.369e+01 | K | FSS BRACKET-1 TEMP (+Y) |
| TFSSBKT2 | 326.63 | 28.17 | 7.930e+00 | -3.566e+00 | K | FSS BRACKET-2 TEMP (+Y) |
| TSCTSF1 | 295.25 | 3.80 | 1.460e+00 | 1.955e+00 | K | SC-TS FITTING -1 TEMP |
| TSCTSF6 | 296.13 | 4.19 | 1.797e+00 | 2.032e+00 | K | SC-TS FITTING -6 TEMP |
)
)
)
)
| MUPS - Daily Maximums | ||||||
|---|---|---|---|---|---|---|
| MSID | MEAN | RMS | DELTA/YR | DELTA/YR/YR | UNITS | DESCRIPTION |
| PM1THV1T | 333.47 | 8.23 | -2.762e-01 | -1.892e+02 | K | MUPS 1 THRUSTER VALVE 01 TEMP |
| PLINE02T | 318.00 | 10.92 | 1.888e+00 | -3.203e+00 | K | PROP LINE TEMP 02 |
| PLINE03T | 317.37 | 13.59 | 1.465e+00 | -3.190e+00 | K | PROP LINE TEMP 03 |
| PLINE04T | 302.46 | 12.64 | 1.525e+00 | -1.085e+00 | K | PROP LINE TEMP 04 |
)
)
)
)
Quarterly Trends
- DEAHK Temperature
| Previous Quarter | ||||||
| MSID | MEAN | RMS | DELTA/YR | DELTA/YR/YR | UNITS | DESCRIPTION |
| DEAHK1 | 19.34 | 6.86 | 3.426e+01 | 3.395e+02 | C | DPA Thermistor 1 - BEP PC Board |
| DEAHK4 | 17.14 | 8.00 | 3.507e+01 | 3.693e+02 | C | DPA Thermistor 7 - FEP 0 Frame Buf. |
| DEAHK8 | 24.18 | 7.48 | 3.586e+01 | 3.596e+02 | C | DPA Thermistor 8 - FEP 1 Mongoose |
)
)
)
- Ephin Temperature and Voltage
| Previous Quarter | ||||||
| MSID | MEAN | RMS | DELTA/YR | DELTA/YR/YR | UNITS | DESCRIPTION |
| 5EIOT | 351.09 | 19.15 | -7.657e+01 | -4.086e+02 | K | EIO TEMP |
| 5EPHINT | 325.23 | 4.98 | -2.166e+00 | 3.775e+01 | K | EPHIN TEMP |
| HKEBOXTEMP | 330.22 | 5.20 | -5.042e+00 | 2.065e+01 | K | EPHIN HOUSEKEEPING EBOX: TEMPERATURE (5EHSE300) |
| TEIO | 325.95 | 21.51 | -8.773e+01 | -5.183e+02 | K | EPHIN ELECTRONICS HOUSING TEMP |
| TEPHIN | 325.67 | 5.32 | -7.816e+00 | 8.210e+00 | K | EPHIN SENSOR HOUSING TEMP |
)
)
)
)
)
- Pcad Temperature
| Previous Quarter | ||||||
| MSID | MEAN | RMS | DELTA/YR | DELTA/YR/YR | UNITS | DESCRIPTION |
| AACBPRT | 298.84 | 0.83 | -2.264e+00 | 3.827e+01 | K | AC BASEPLATE TEMP (RDNT) |
| AACCCDPT | 255.46 | 0.89 | -2.333e+00 | 3.879e+01 | K | AC CCD TEMP (PRI) |
| AACCCDRT | 298.80 | 0.88 | -2.524e+00 | 3.730e+01 | K | AC CCD TEMP (RDNT) |
| AACH1T | 295.98 | 0.93 | -2.654e+00 | 3.862e+01 | K | AC HOUSING TEMP (ACH1) |
)
)
)
)
Envelope Trending
EPS Battery
Spacecraft Motions
|
|
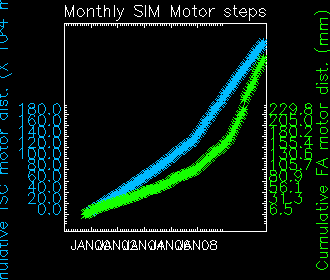
Reaction Wheel Rotations
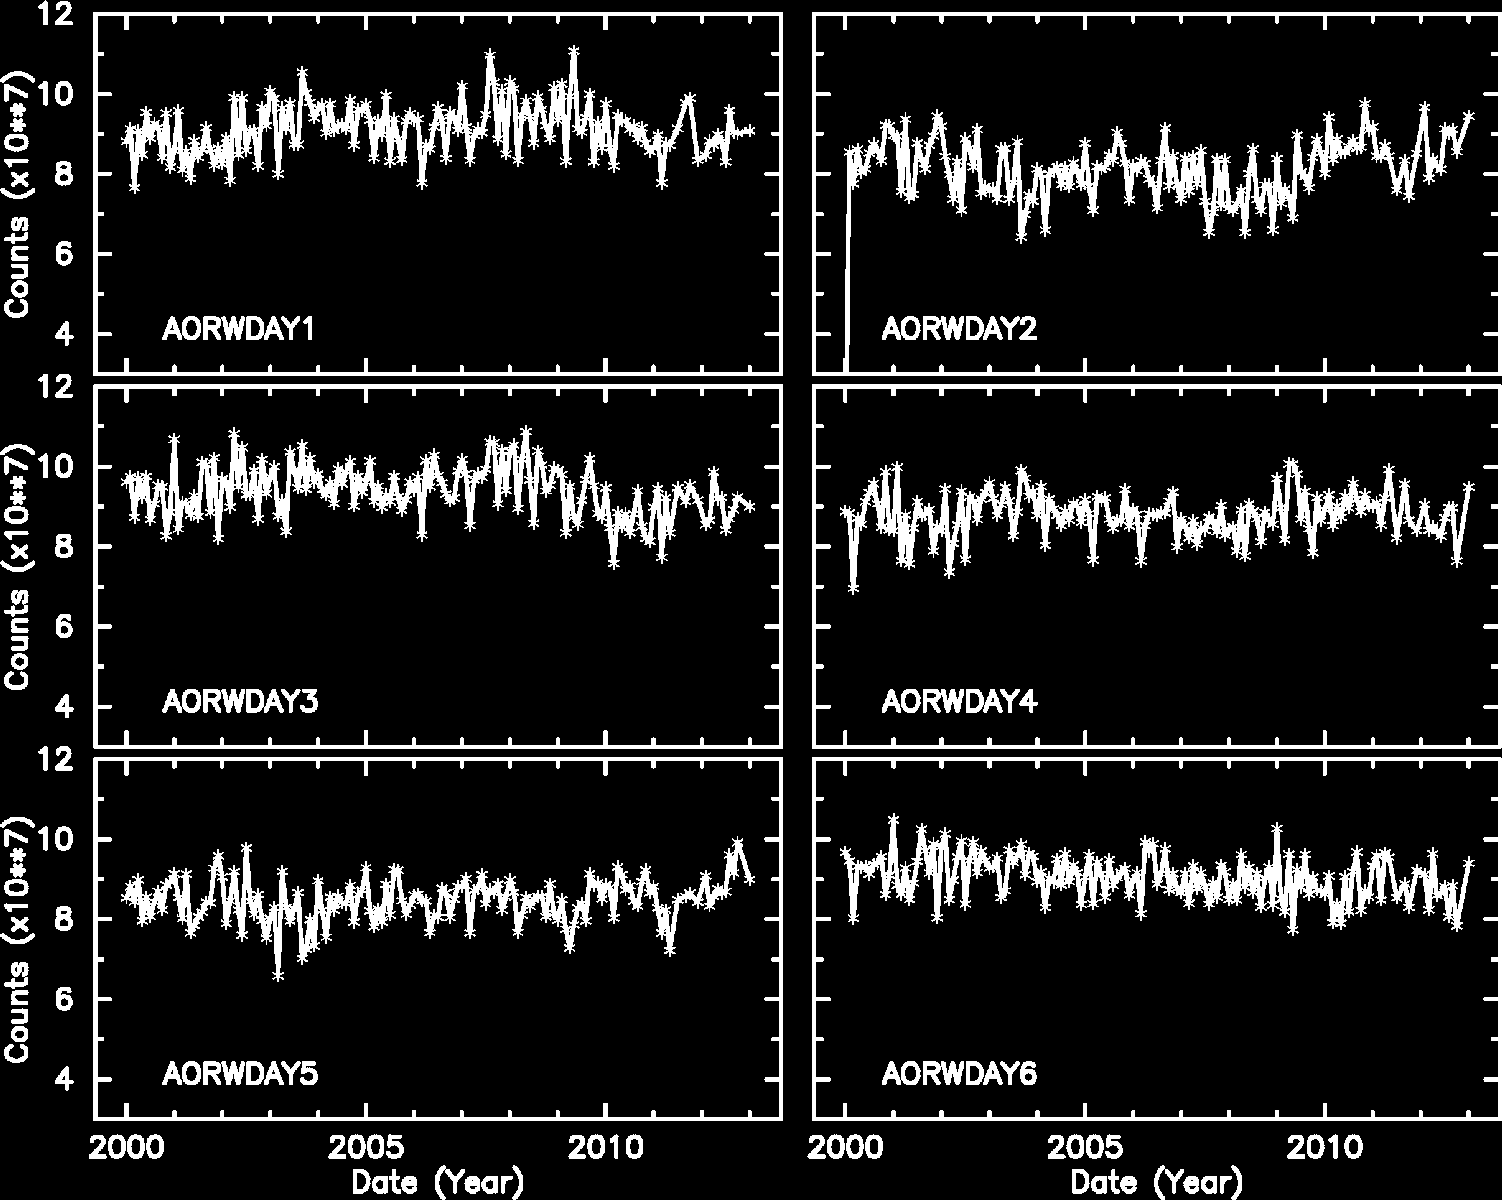
Note: From Feb 2010, the computation of reaction wheel rotations are slightly modified.
Links to Past Monthly Reports
| Year | Month | |||||||||||
|---|---|---|---|---|---|---|---|---|---|---|---|---|
| 1999 | Jul | Aug | Sep | Oct | Nov | Dec | ||||||
| 2000 | Jan | Feb | Mar | Apr | May | Jun | Jul | Aug | Sep | Oct | Nov | Dec |
| 2001 | Jan | Feb | Mar | Apr | May | Jun | Jul | Aug | Sep | Oct | Nov | Dec |
| 2002 | Jan | Feb | Mar | Apr | May | Jun | Jul | Aug | Sep | Oct | Nov | Dec |
| 2003 | Jan | Feb | Mar | Apr | May | Jun | Jul | Aug | Sep | Oct | Nov | Dec |
| 2004 | Jan | Feb | Mar | Apr | May | Jun | Jul | Aug | Sep | Oct | Nov | Dec |
| 2005 | Jan | Feb | Mar | Apr | May | Jun | Jul | Aug | Sep | Oct | Nov | Dec |
| 2006 | Jan | Feb | Mar | Apr | May | Jun | Jul | Aug | Sep | Oct | Nov | Dec |
| 2007 | Jan | Feb | Mar | Apr | May | Jun | Jul | Aug | Sep | Oct | Nov | Dec |
| 2008 | Jan | Feb | Mar | Apr | May | Jun | Jul | Aug | Sep | Oct | Nov | Dec |
| 2009 | Jan | Feb | Mar | Apr | May | Jun | Jul | Aug | Sep | Oct | Nov | Dec |
| 2010 | Jan | Feb | Mar | Apr | May | Jun | Jul | Aug | Sep | Oct | Nov | Dec |
| 2011 | Jan | Feb | Mar | Apr | May | Jun | Jul | Aug | Sep | Oct | Nov | Dec |
| 2012 | Jan | Feb | Mar | Apr | May | Jun | Jul | Aug | Sep | Oct | Nov | |