ACIS
ACIS DOSE Registered-Photon-Map
The steps we took to compute the dose map are;
- Level 1 Event files for a specified month are obtained from archive.
- Image data including I2, I3, S2, S3 CCDs are extracted from all event files.
- All the extracted image data were merged to create a month long exposure map for the month.
- The exposure map is opened with ds9, and check a distribution of count rates against energy. From this, estimate the upper threshold value. Any events beyond this upper threshold are assumed erroneous events such as bad pixels.
- Using this upper threshold, the data is filtered, and create a cleaned exposure map for the month.
- The exposure map from each month from the Sep 1999 is added up to create a cumulative exposure map for each month.
- Using fimgstatistic, we compute count rate statistics for each CCDs.
- For observations with high data drop rates (e.g., Crab nebula, Cas A), we corrected the observations by adding events.
-
Note: Counts and RMS's of Cumulative maps are lower than the previous months.
This is because we excluded extreme outliers.
Please check more detail plots at Telemetered Photon Dose Trend page.
)
)
)
Statistics:
# IMAGE     NPIX        MEAN           RMS              MIN     MAX
ACIS_may13 6004901       9.000         16.816           0.0     5600


I2 node 0  262654   7.339146    3.165329    0.0  43.0
I2 node 1  262654   7.794422    3.911250    0.0 329.0
I2 node 2  262654   7.553684    3.128886    0.0  72.0
I2 node 3  262654   7.529374    3.532870    0.0 393.0

I3 node 0  262654   7.528347    3.272069    0.0  85.0
I3 node 1  262654   7.800900    7.427392    0.0 1418.0
I3 node 2  262654   7.129418    2.996735    0.0  61.0
I3 node 3  262654   7.290085    5.051934    0.0 2045.0

S2 node 0  262654   7.347645    3.118027    0.0 119.0
S2 node 1  262654   7.508827    3.383202    0.0  55.0
S2 node 2  262654   7.780220    3.994643    0.0 724.0
S2 node 3  262654   7.770815    3.177979    0.0 388.0

S3 node 0  262654   18.584444   17.830044   0.0 198.0
S3 node 1  262654   45.856081   40.309052   0.0 290.0
S3 node 2  262654   26.657924   25.196132   0.0 215.0
S3 node 3  262654   10.769728   3.854173    0.0  47.0
)
)
)
Statistics:
 IMAGE        NPIX      MEAN             RMS            MIN    MAX
ACIS_total   6004901       1716.272         2267.388           0.0   100853


I2 node 0  262654   1437.868954 283.259056     0.0   8883.0
I2 node 1  262654   1511.987599 379.806032     0.0  33571.0
I2 node 2  262654   1541.197662 330.885176     0.0   6607.0
I2 node 3  262654   1536.394031 389.587006     0.0   9334.0

I3 node 0  262654   1613.332768 395.142375     0.0   6378.0
I3 node 1  262654   1693.383469 1285.224812    0.0  32806.0
I3 node 2  262654   1477.055486 272.798450     0.0   7243.0
I3 node 3  262654   1462.852753 290.551754     0.0  25542.0

S2 node 0  262654   2065.592080 315.497724  1076.0  28604.0
S2 node 1  262654   2202.871755 483.664928  1121.0  12144.0
S2 node 2  262654   2439.014848 478.163379  1465.0  42089.0
S2 node 3  262654   2373.450727 363.468760  1401.0  38992.0

S3 node 0  262654   3596.795489 1714.298212 1485.0  12757.0
S3 node 1  262654   4704.223755 1919.391265    0.0  13007.0
S3 node 2  262654   3625.466199 923.644593  1451.0   9088.0
S3 node 3  262654   2832.574514 447.806337  1610.0   9268.0
)
|
)
|
)
|
)
|
| Feb 2013 | Nov 2012 | Aug 2012 | May 2012 |
|---|
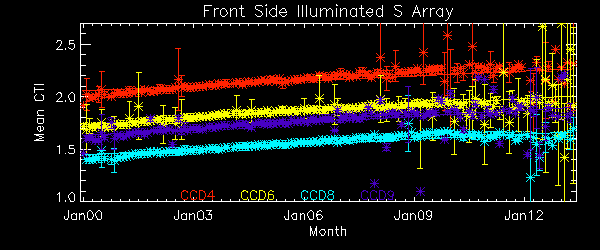
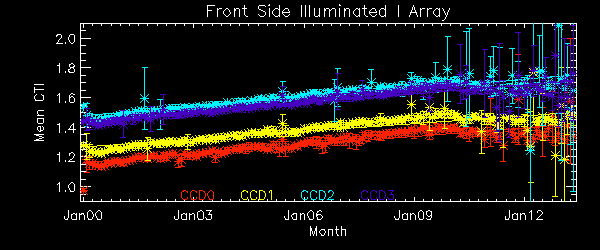
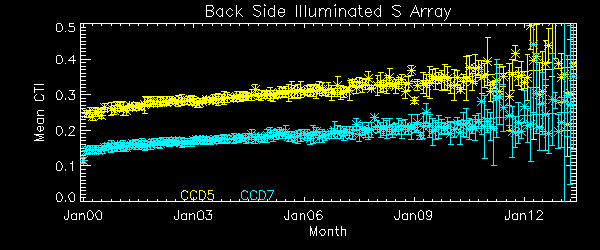
The Mean Detrended CTI
We report CTIs with a refined data definition. CTIs were computed for the temperature dependency corrected data. Please see CTI page for detailed explanation. CTI's are computed for Mn K alpha, and defined as slope/intercept x10^4 of row # vs ADU. Data file: here
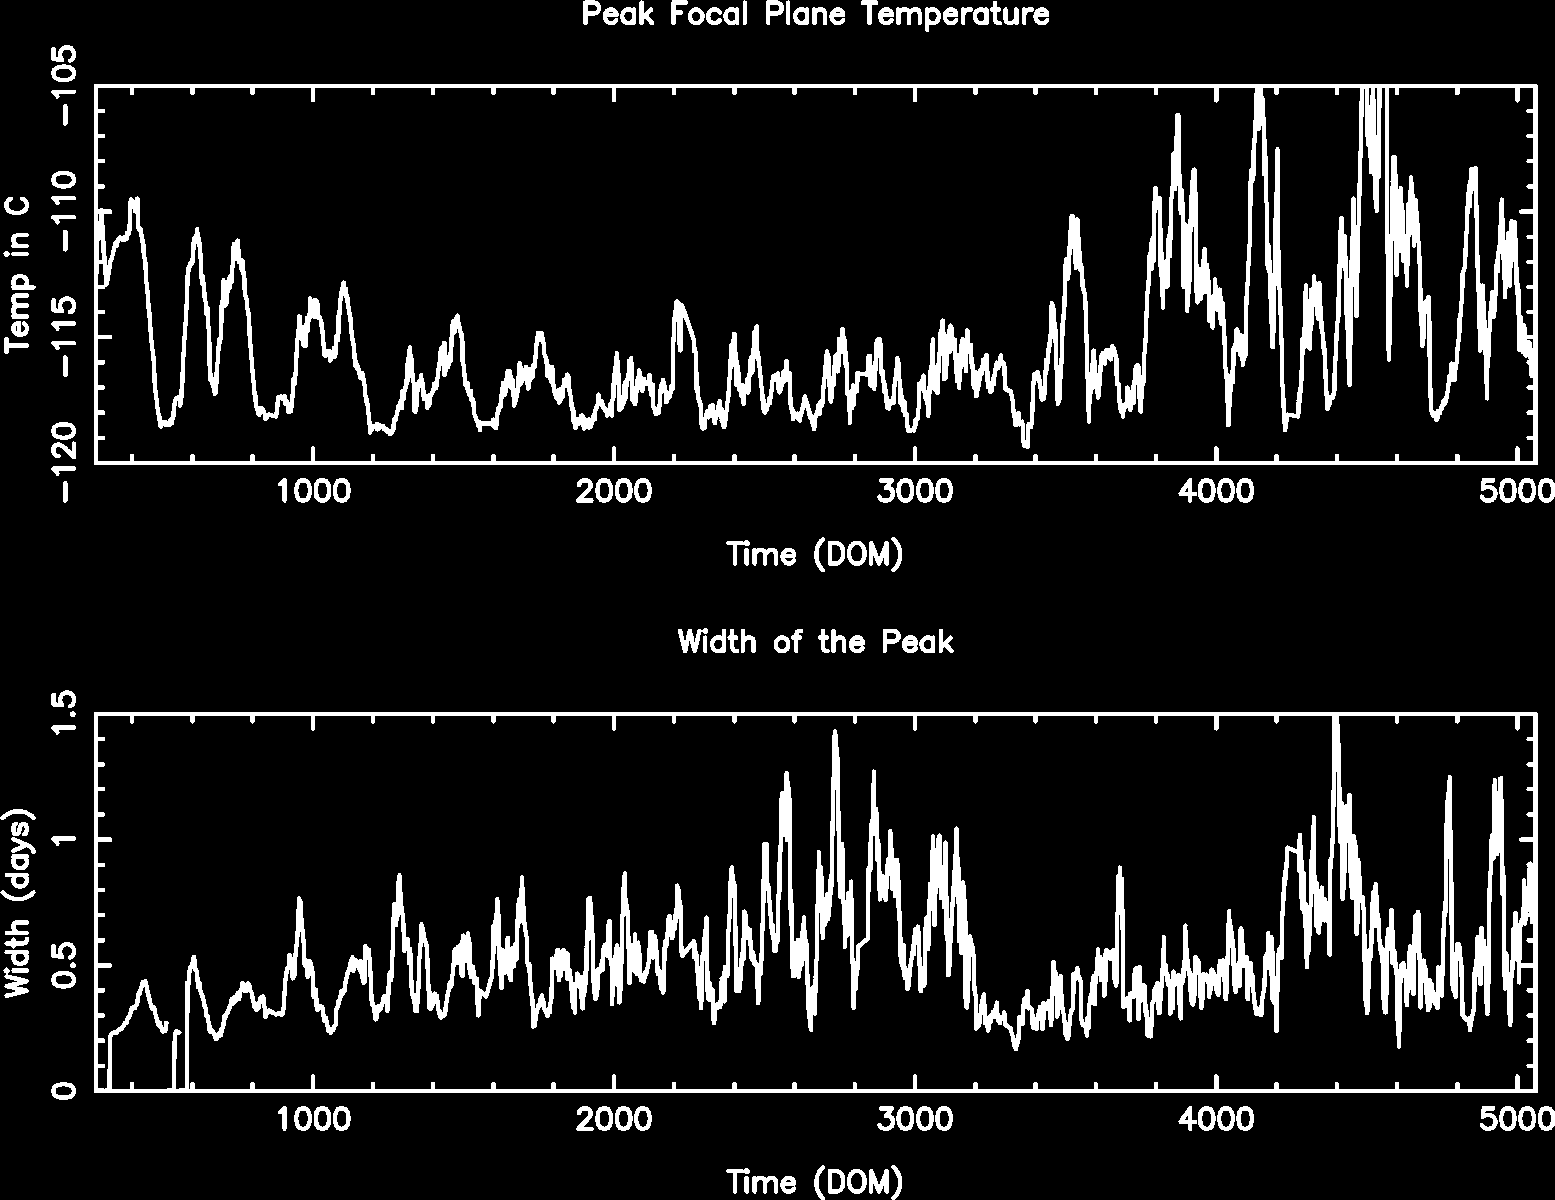
Focal Plane Temperature
May 2013 Focal Temperature
| The Mean (max) FPT: | |
|---|---|
| -107.47 | +/- 3.11 C |
| Mean Width: | |
| 0.74 | +/- 0.56 days |
Averaged Focal Plane Temperature
We are using 10 period moving averages to show trends of peak temperatures and peak widths. Note, the gaps in the width plot are due to missing/corrupted data.
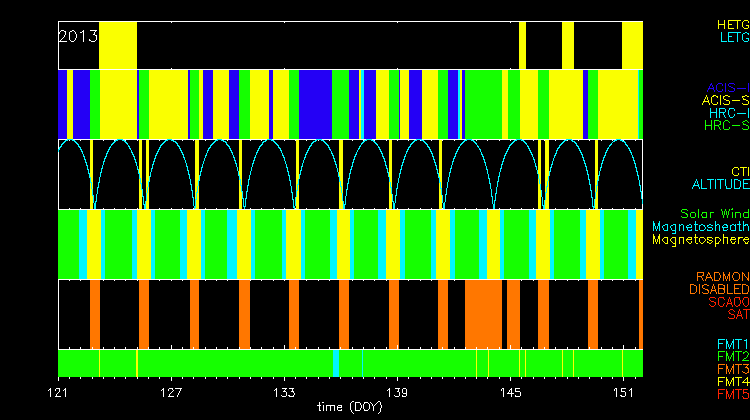
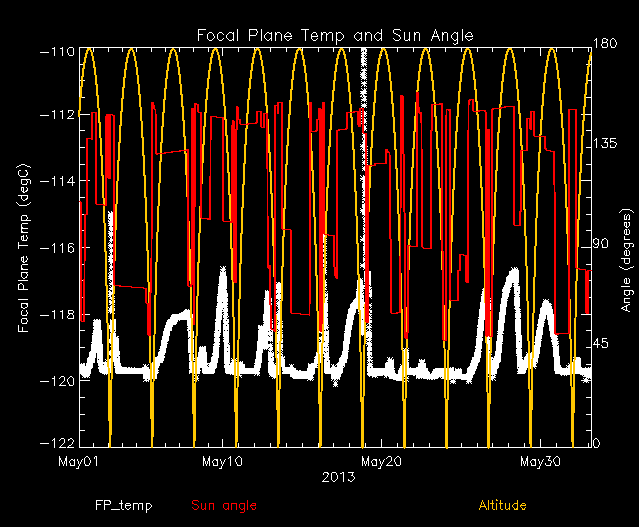
Focal Plane Temperature, Sun Angle and Altitude
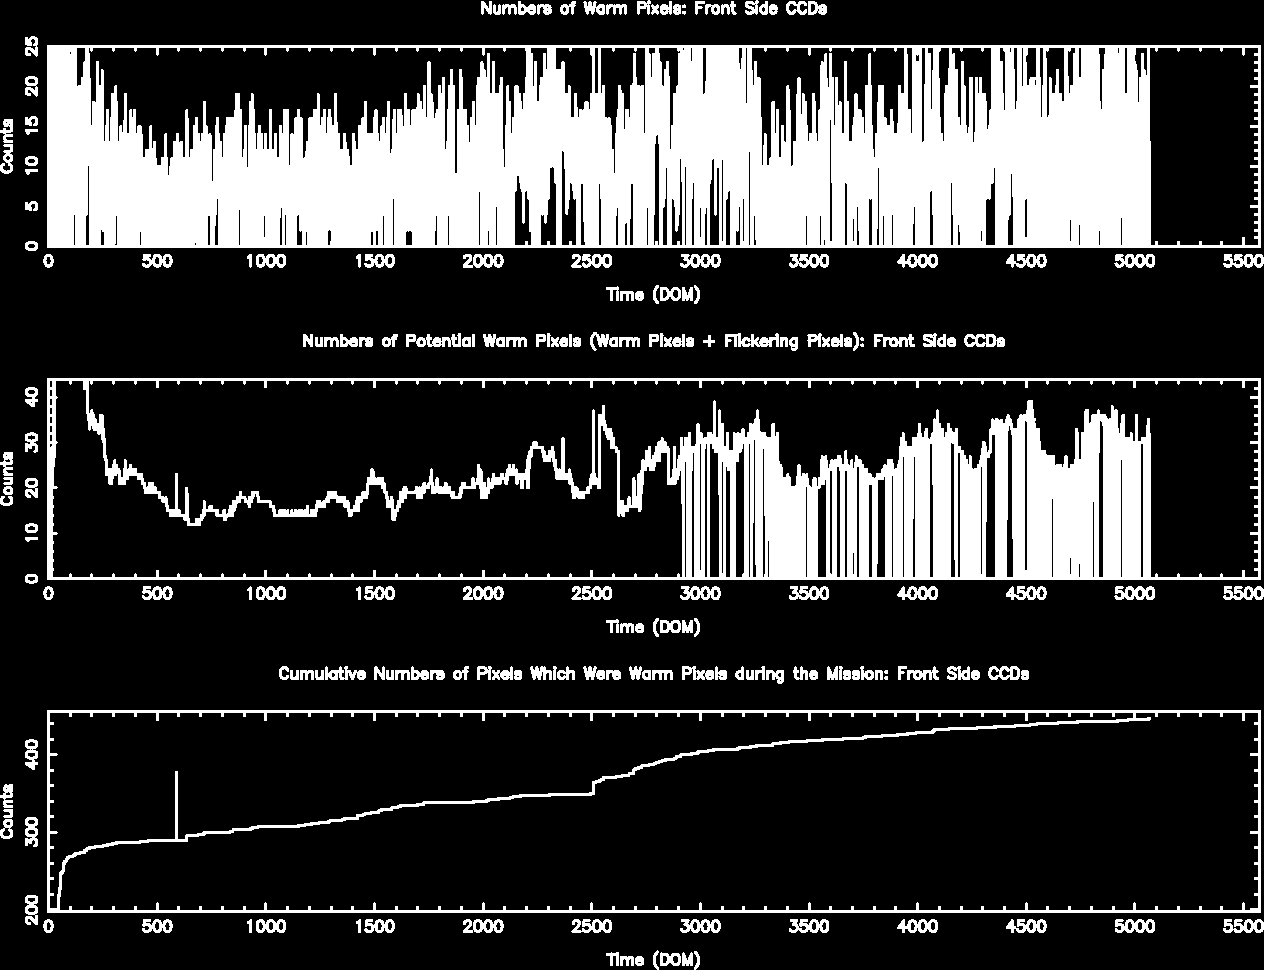
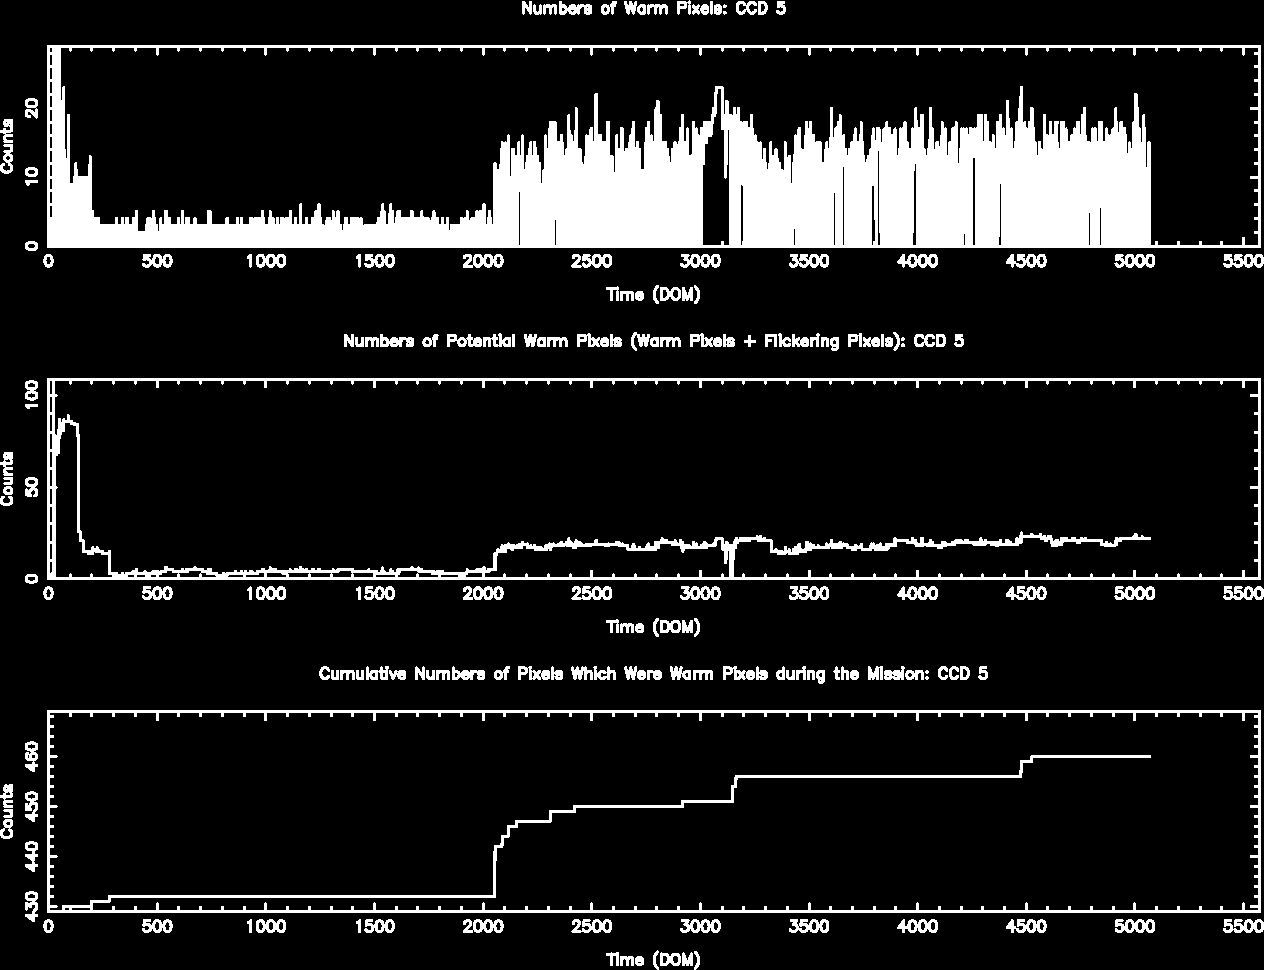
Bad Pixels
The plots below were generated with a new warm pixel finding script. Please see Acis Bad Pixel Page for details.
Front Side CCDs
Back Side CCD (CCD5)
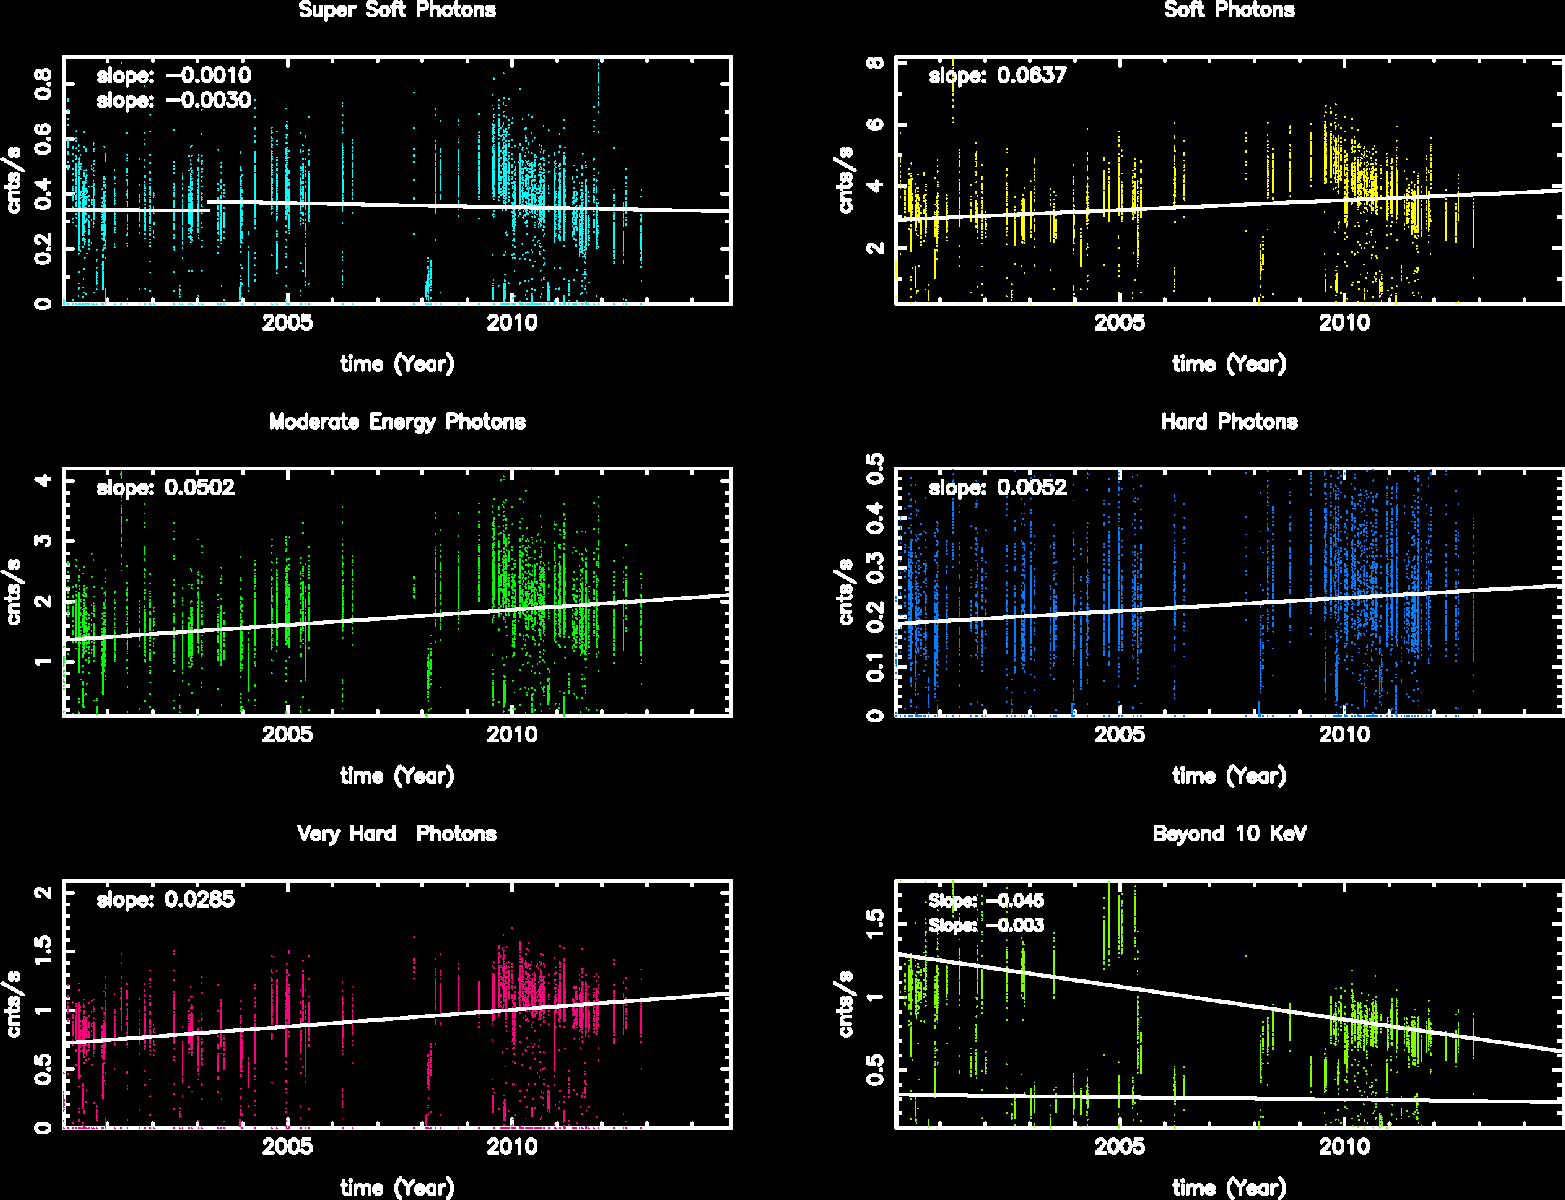
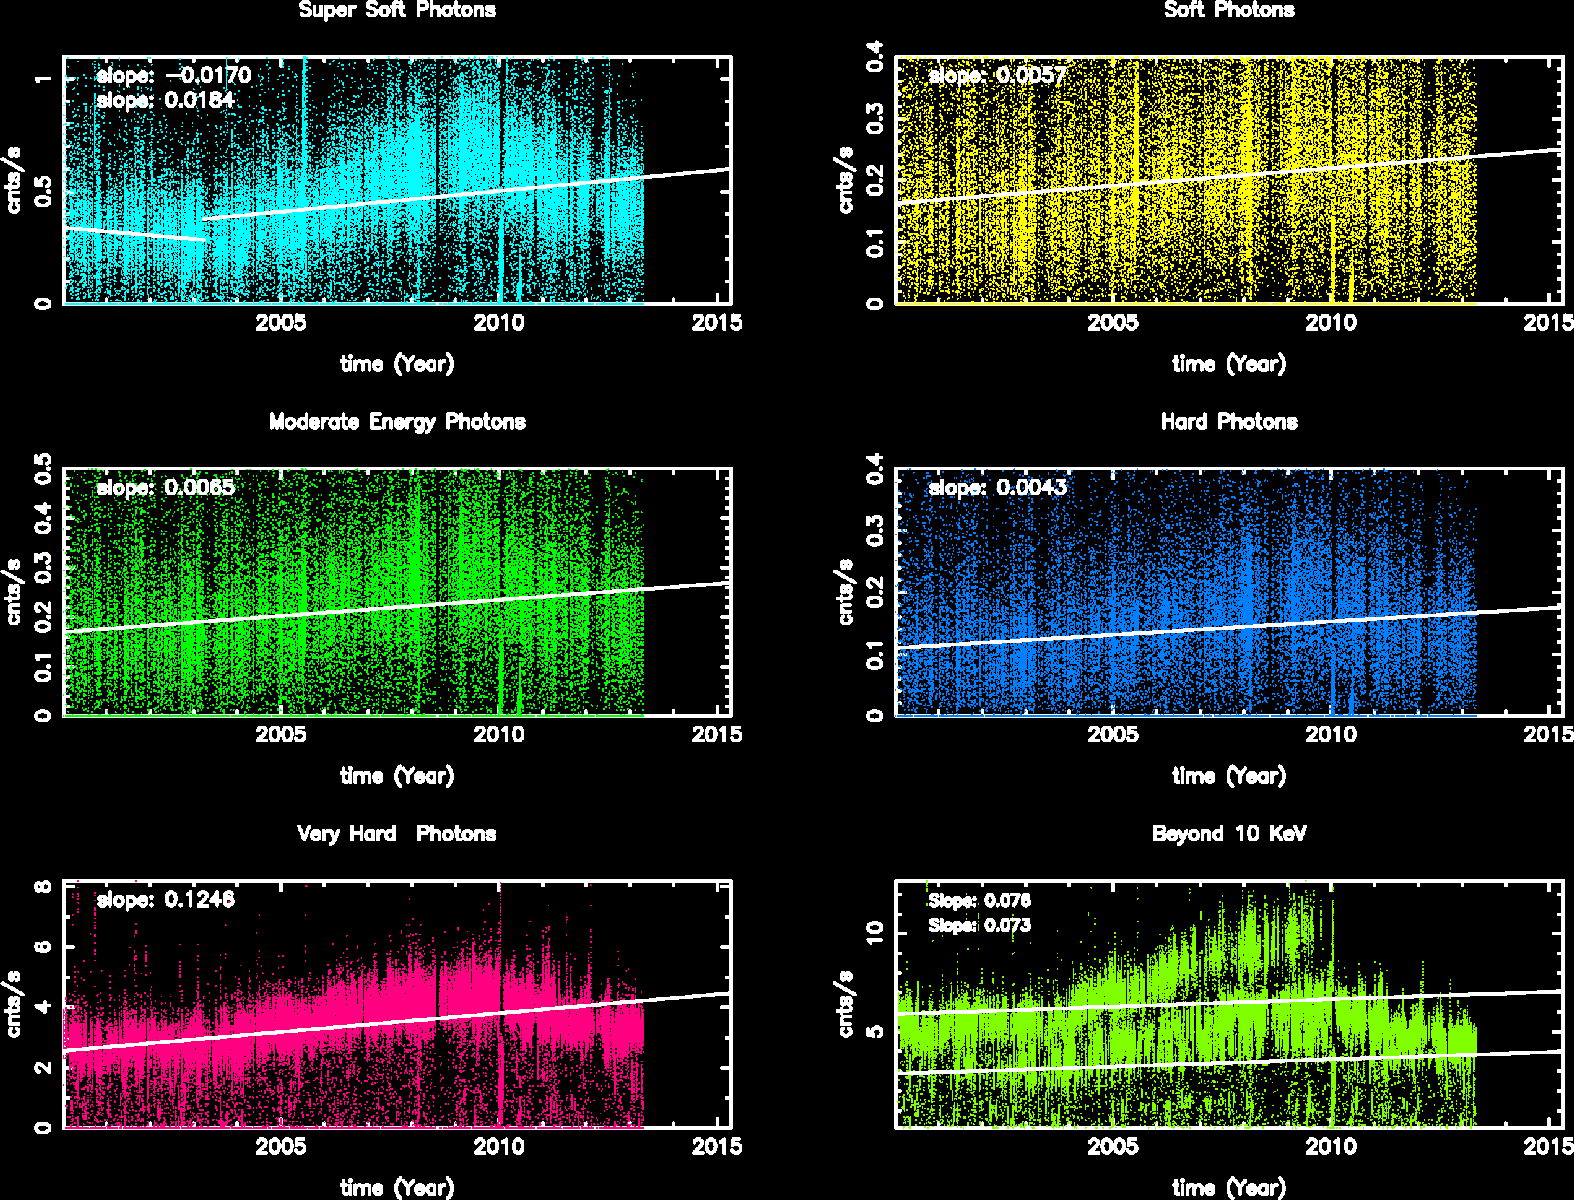
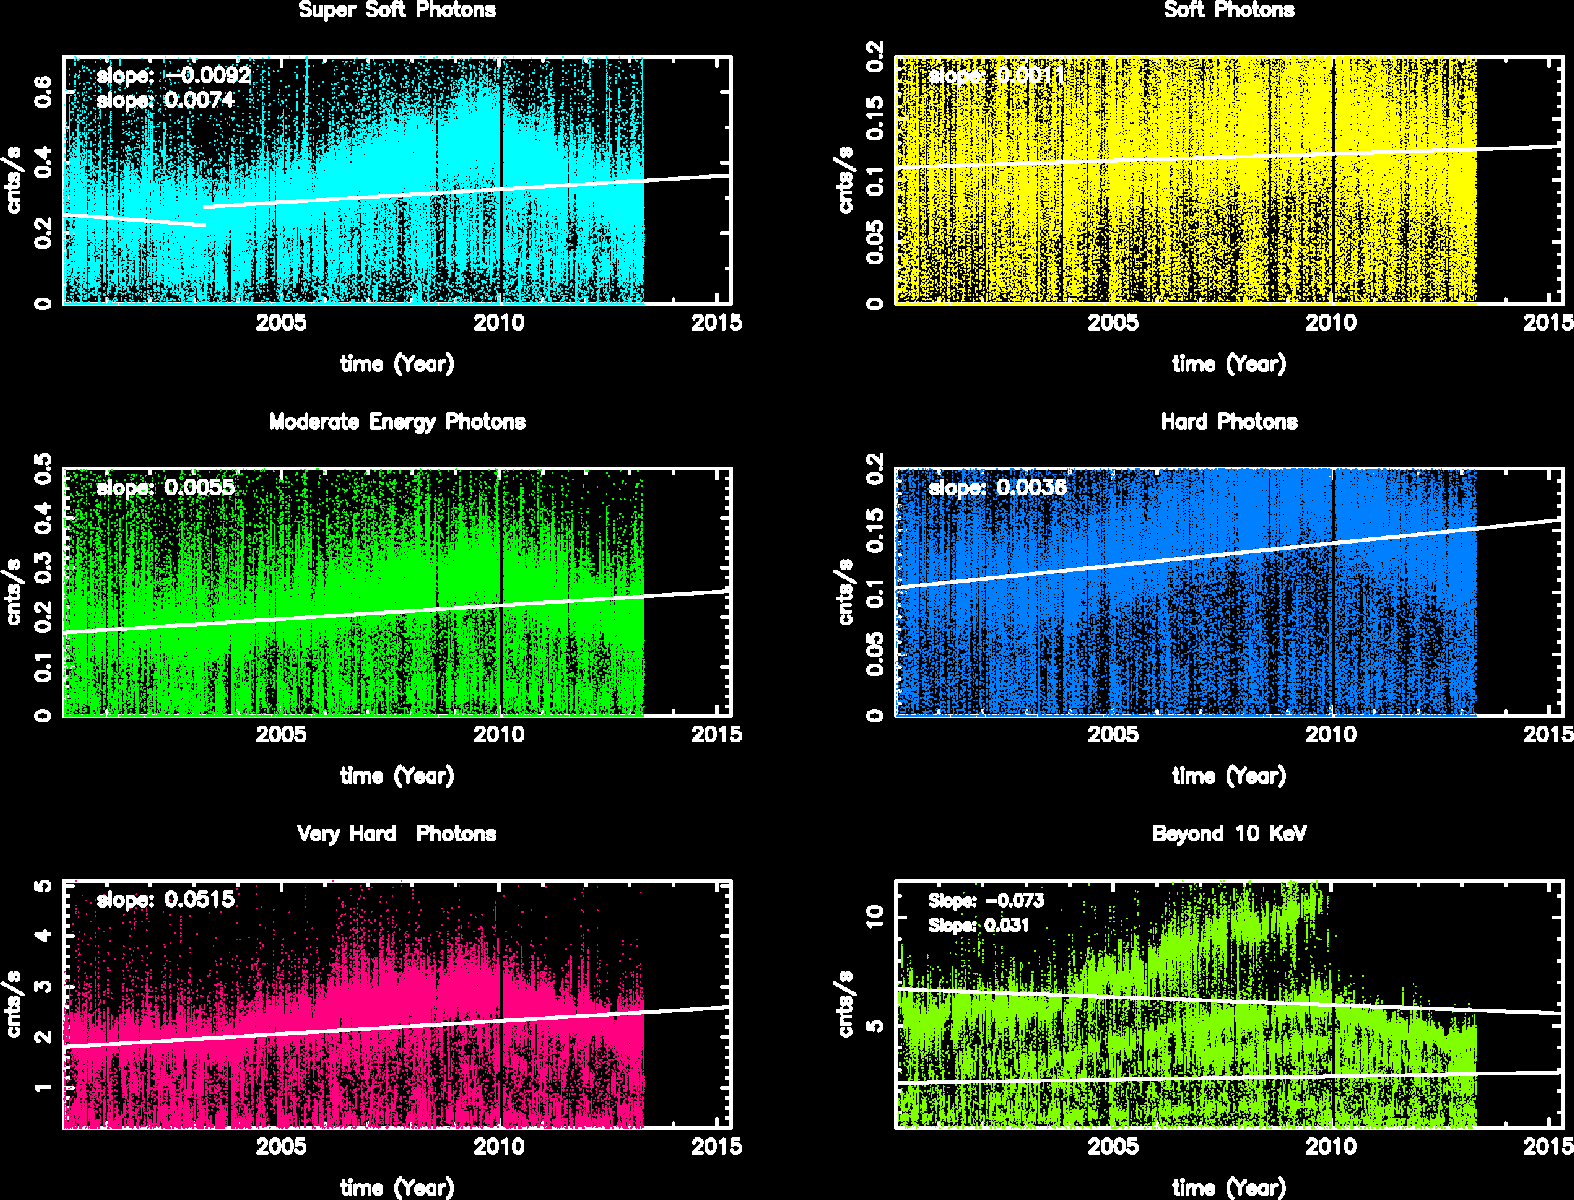
Science Instrument Background Rates
| Name | Low (keV) | High(KeV) | Description |
|---|---|---|---|
| SSoft | 0.00 | 0.50 | Super soft photons |
| Soft | 0.50 | 1.00 | Soft photons |
| Med | 1.00 | 3.00 | Moderate energy photons |
| Hard | 3.00 | 5.00 | Hard Photons |
| Harder | 5.00 | 10.00 | Very Hard photons |
| Hardest | 10.00 | Beyond 10 keV |
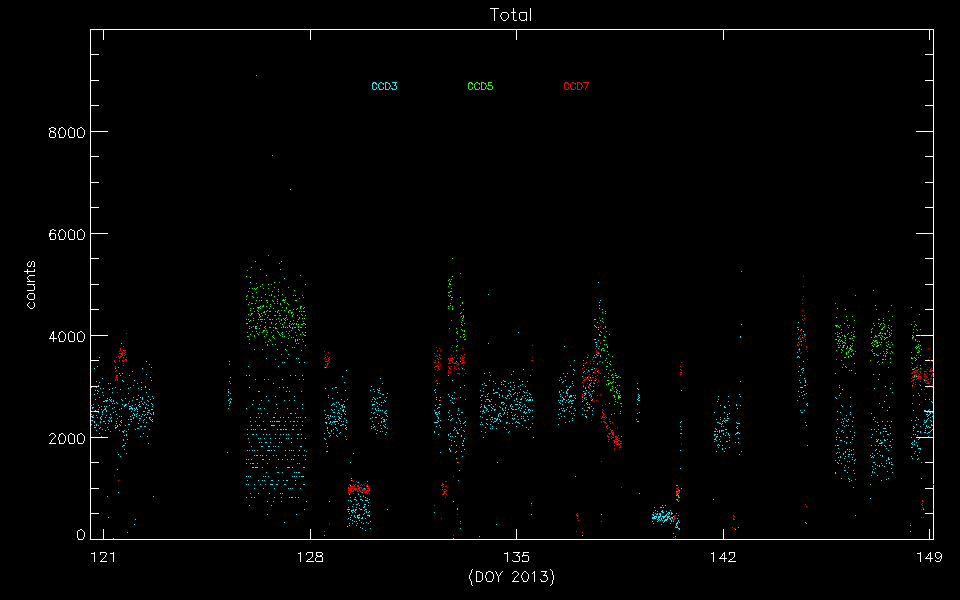
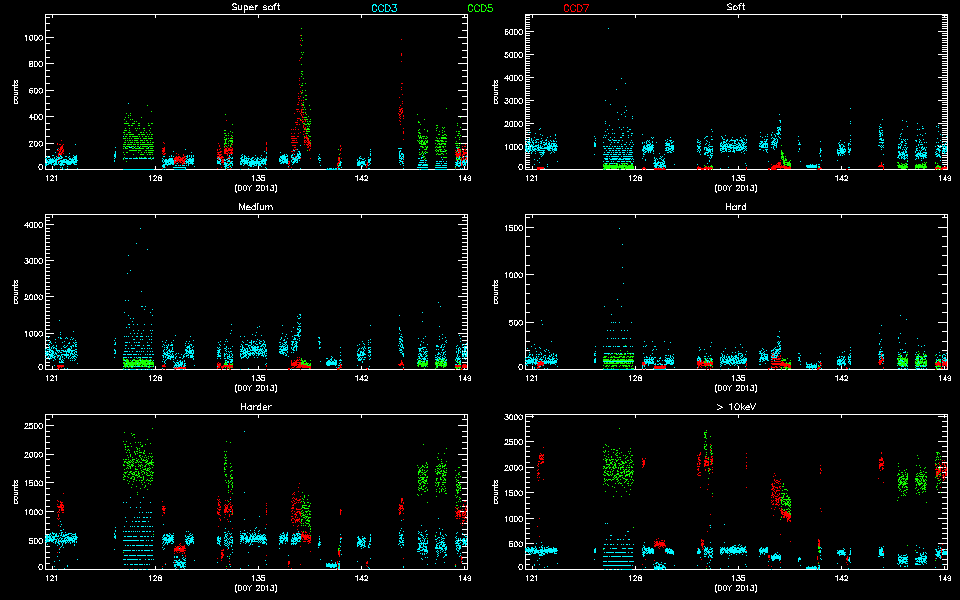
The following three plots show trends of SIB from year 2000. CCDs shown here are CCD3, CCD5, and CCD7. Fitted lines are linear fit after eliminating extreme outliers. For >10 keV plots, 2 lines are fit. One is with a 13 keV filter, and another without.
CCD 3
CCD 5
CCD 7
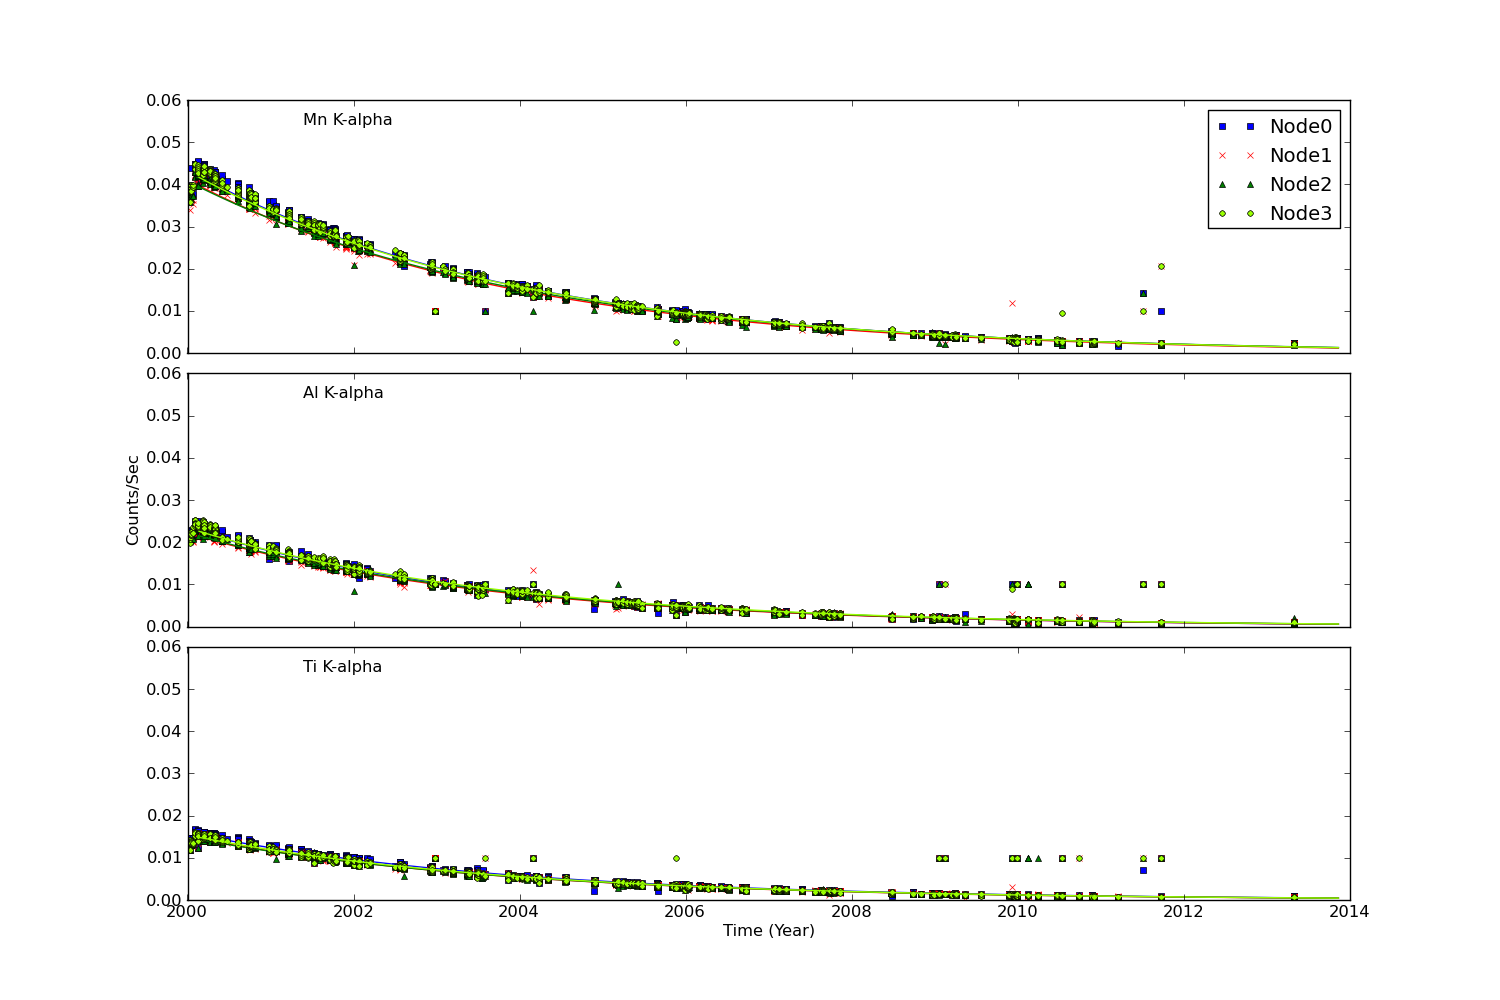
ACIS Histogram Mode Trends
We collected data from acis histogram mode data, and created trend plots of peak portions and peak widths against time (DOM). The peaks were estimated by fitting a simple Gaussian on three peaks (Al, Ti, and Mn), and the widths were estimated by a width at the half max from the peak.
All histogram data are taken under TIMED and GRADED_HIST mode, SIM position is at an external calibration source position, the focal temperature is around -119.7 C, and parameter settings in aciselec, acistemp are set to about same for all.
CCD 3, Peak Position
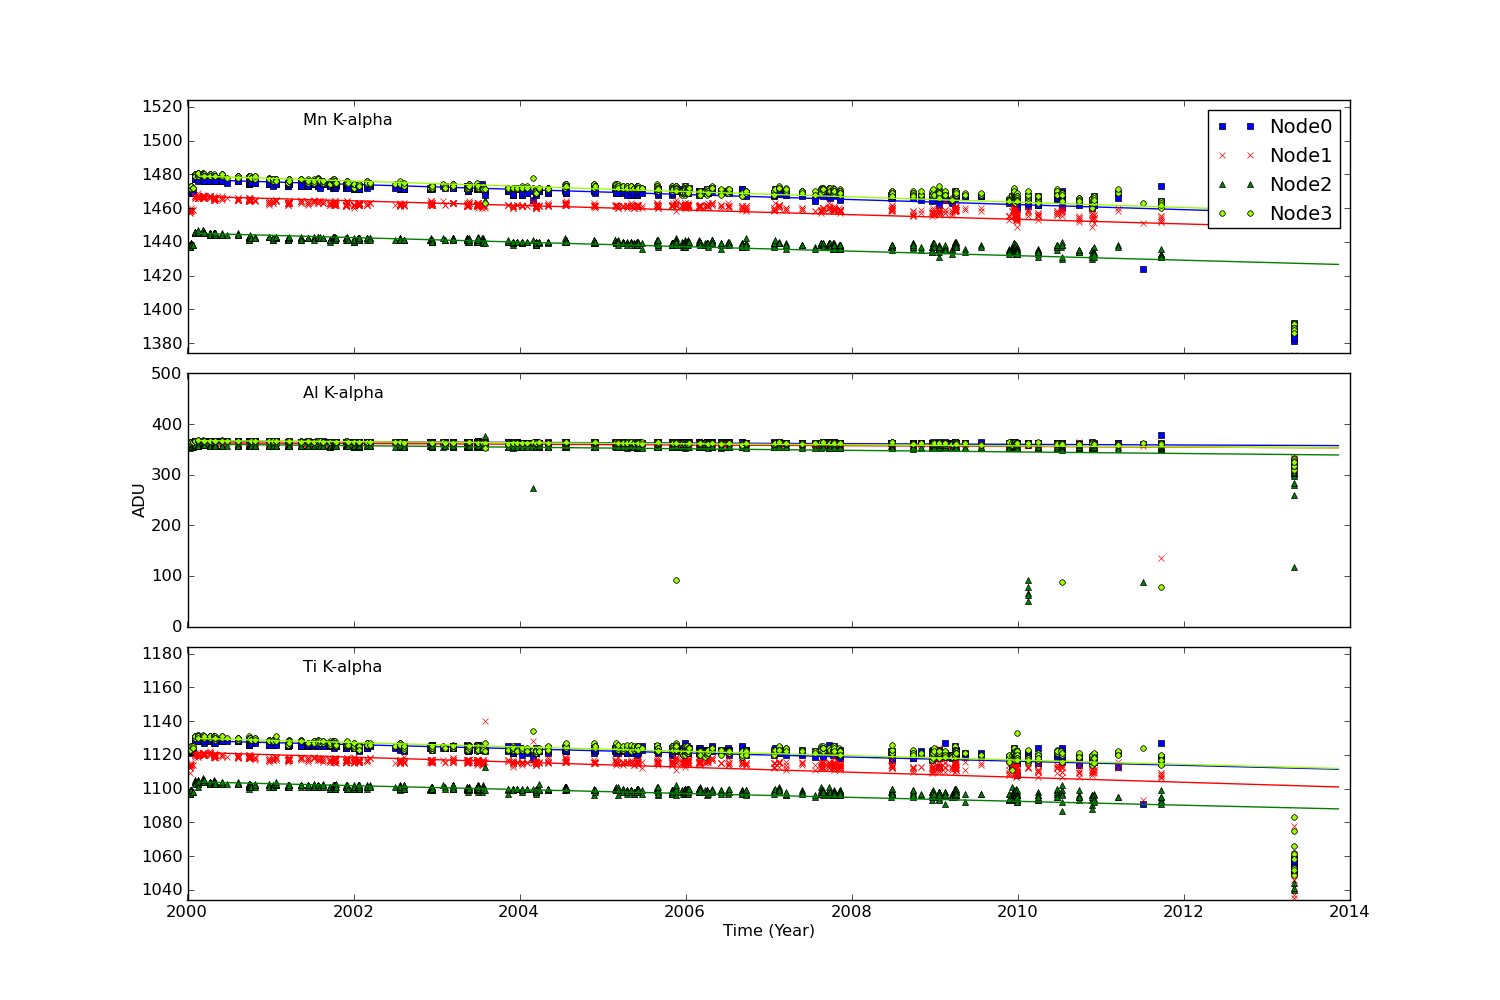
CCD 3, Peak Widths
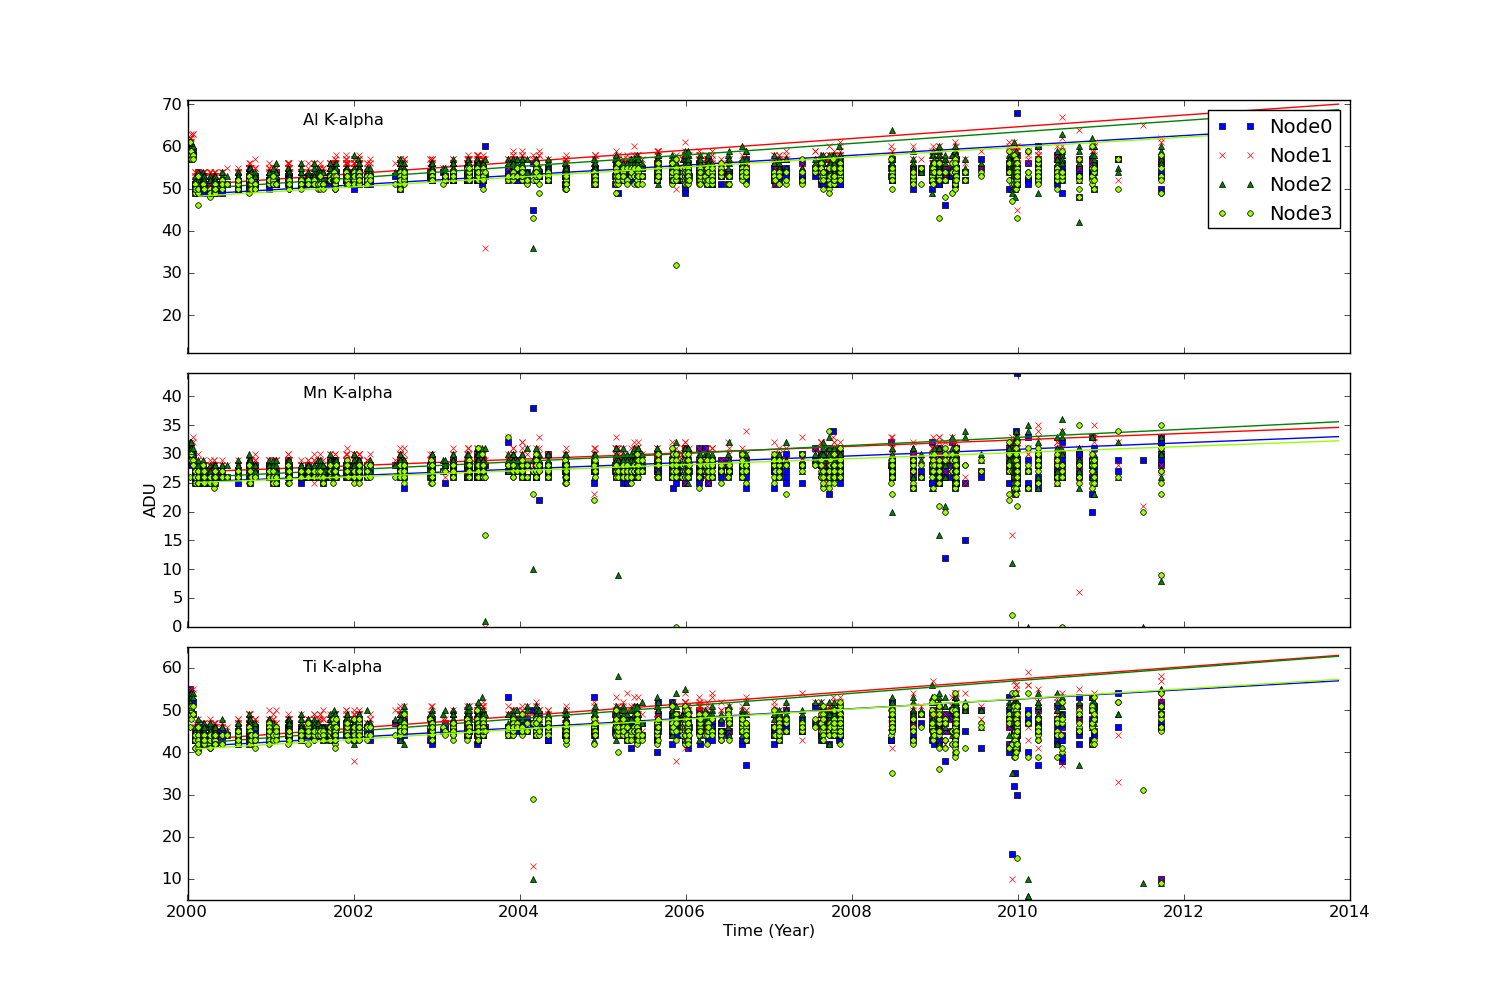
CCD 3, Count Rates
HRC
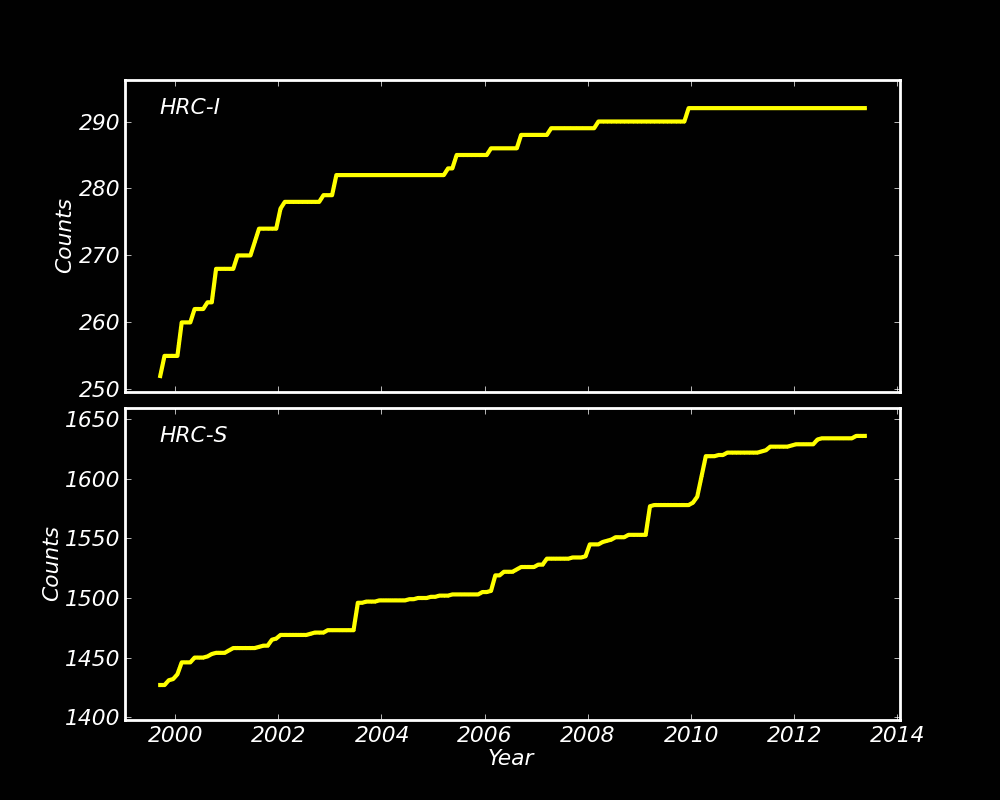
DOSE of Central 4K Pore-Pairs
Please refer to Maximum Dose Trends for more details.
)
        IMAGE                NPIX      MEAN    STDDEV      MIN       MAX
HRCI_05_2013.fits          16777216   0.007    0.0866      0.0       3.0
)
        IMAGE                NPIX      MEAN    STDDEV      MIN       MAX
HRCI_08_1999_05_2013.fits  16777216   3.985    4.777       0.0       292.0
)
         IMAGE                NPIX      MEAN    STDDEV      MIN       MAX
HRCS_05_2013.fits          16777216   0.027    0.166       0.0         4.0
)
        IMAGE                NPIX     MEAN      STDDEV      MIN      MAX
HRCS_08_1999_05_2013.fits  16777216  14.564      24.332      0.0      1636.0
|
|
Max dose trend plots corrected for events that "pile-up"
in the center of the taps due to bad position information.
|
)
|
)
|
)
|
)
|
| Feb 2013 | Nov 2012 | Aug 2012 | May 2012 |
|---|
)
|
)
|
)
|
)
|
| Feb 2013 | Nov 2012 | Aug 2012 | May 2012 |
|---|
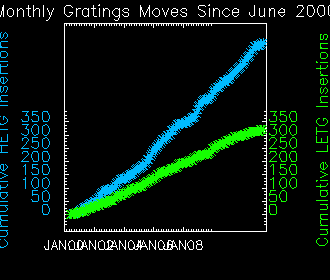
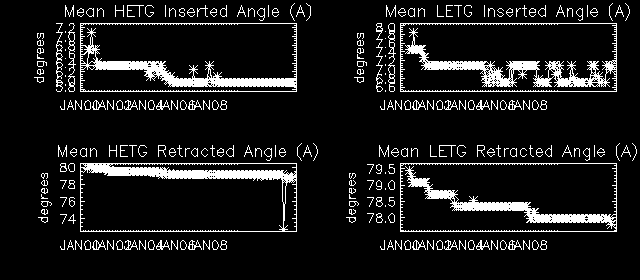
Gratings
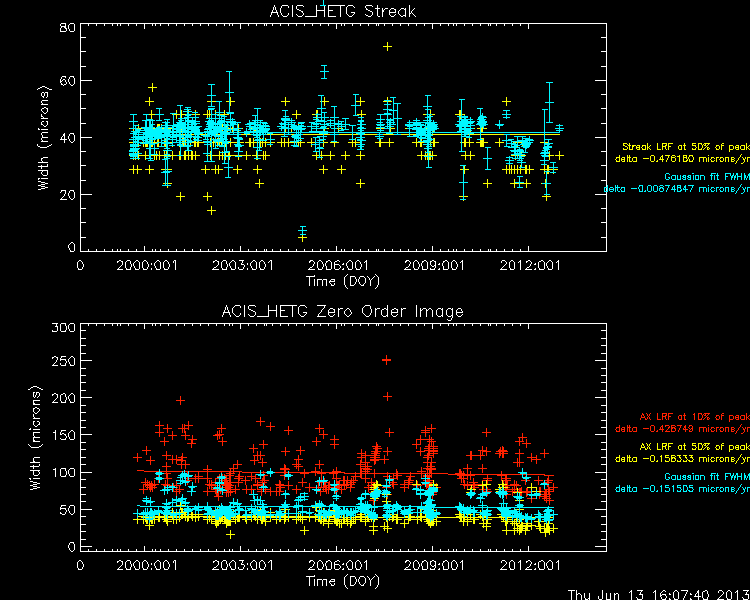
Focus
We plot the width of the zero order streak of ACIS/HETG observations and the width of the zero order image for HRC/LETG observations of point sources. No significant defocusing trend is seen at this time. See Gratings Focus pages.
PCAD
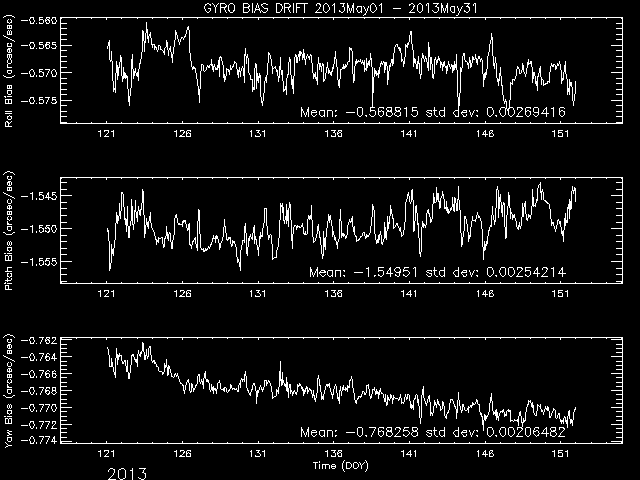
ACA Trending
Gyro Bias Drift
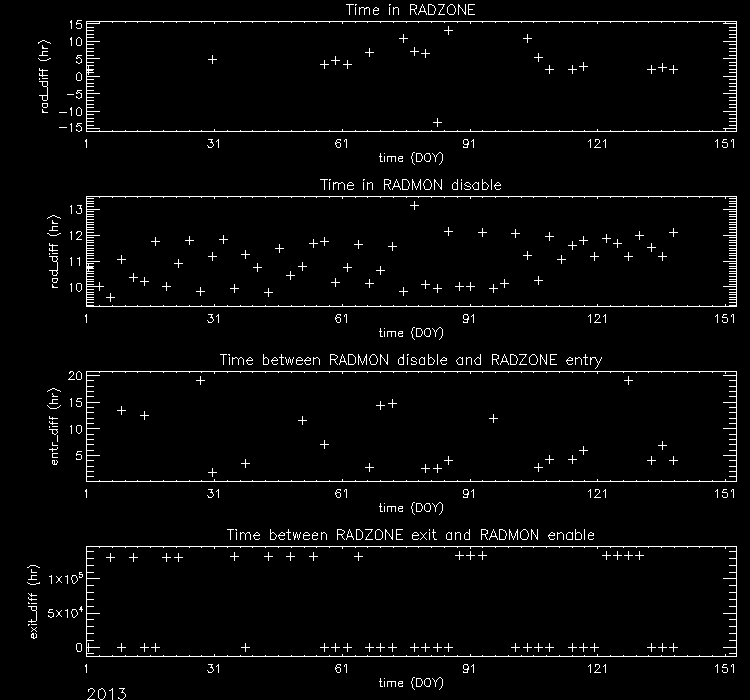
Radiation History
Radiation Zone Timing
Plotted below are radiation zone timing plots based on the following definitions of radiation zone:
- RADZONE - Ephin levels (in any of the E1300,P4GM,P41GM channels) are more than 1/3 of RADMON safing thresholds.
- RADMON - Radmon is disabled for radiation zone (as commanded based on OFLS model, for comparison with actual radiation levels).
- PERIGEE - Time of closest earth approach (for comparison)
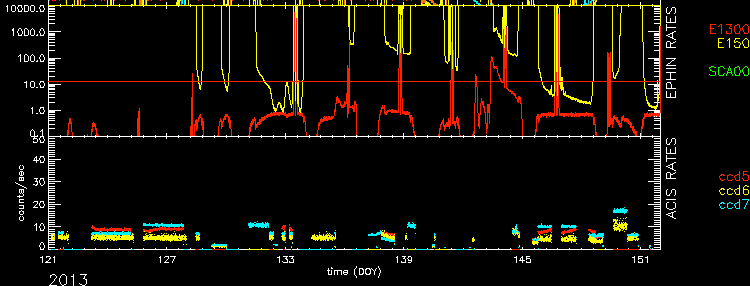
Radiation Count Rates of May 2013
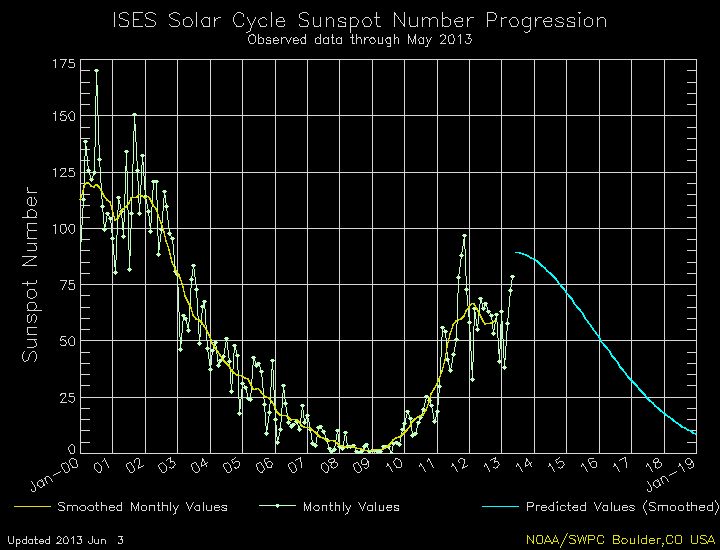
Sun Spot History
Trending
Critical Trends
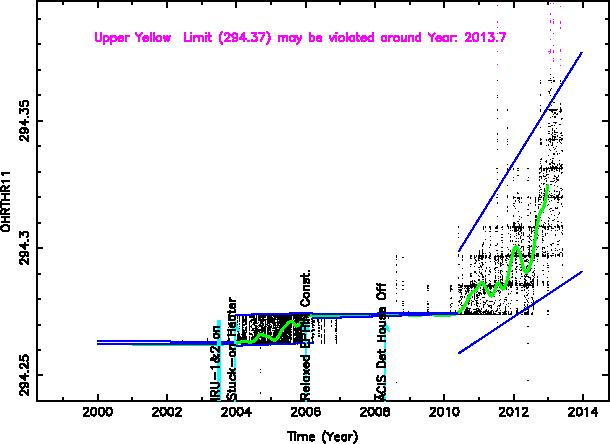
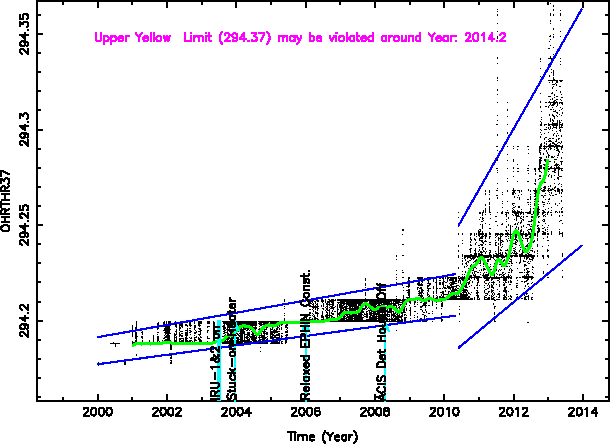
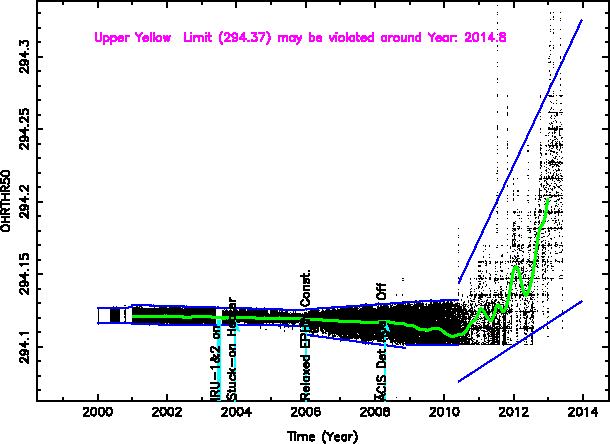
| ACIS Temperatures - Daily Maximums | ||||||
|---|---|---|---|---|---|---|
| MSID | MEAN | RMS | DELTA/YR | DELTA/YR/YR | UNITS | DESCRIPTION |
| 1PDEAAT | 305.21 | 9.00 | -6.202e-01 | -2.214e+00 | K | PSMC DEA PS A TEMP |
| 1PIN1AT | 291.93 | 8.13 | -4.397e-01 | -2.470e+00 | K | PSMC TEMP 1A |
)
)
| HRMA Computed Averages - Daily Maximums | ||||||
|---|---|---|---|---|---|---|
| MSID | MEAN | RMS | DELTA/YR | DELTA/YR/YR | UNITS | DESCRIPTION |
| OBAAVG | 285.36 | 1.66 | 3.933e-01 | 9.959e-02 | K | OBA/TFTE TEMP |
)
| EPHIN Temperatures - Daily Maximums | ||||||
|---|---|---|---|---|---|---|
| MSID | MEAN | RMS | DELTA/YR | DELTA/YR/YR | UNITS | DESCRIPTION |
| TEIO | 323.92 | 20.60 | 7.343e+00 | 5.069e+01 | K | EPHIN ELECTRONICS HOUSING TEMP |
| TEPHIN | 323.64 | 6.79 | 4.950e+00 | 1.254e+01 | K | EPHIN SENSOR HOUSING TEMP |
)
)
| S/C Main Temperatures - Daily Maximums | ||||||
|---|---|---|---|---|---|---|
| MSID | MEAN | RMS | DELTA/YR | DELTA/YR/YR | UNITS | DESCRIPTION |
| TCYLFMZM | 304.46 | 26.61 | 1.182e+00 | 1.371e+01 | K | CNT CYL TEMP:-Z SIDE UNDER LAE-1 |
| TCYLFMZP | 306.49 | 25.32 | 1.249e+00 | 1.307e+01 | K | CNT CYL TEMP:-Z SIDE UNDER LAE-2 |
)
)
| S/C Ancillary Temperatures - Daily Maximums | ||||||
|---|---|---|---|---|---|---|
| MSID | MEAN | RMS | DELTA/YR | DELTA/YR/YR | UNITS | DESCRIPTION |
| TFSSBKT1 | 334.29 | 19.10 | 4.673e+00 | -2.971e+01 | K | FSS BRACKET-1 TEMP (+Y) |
| TFSSBKT2 | 327.59 | 27.03 | 6.016e+00 | -3.700e+01 | K | FSS BRACKET-2 TEMP (+Y) |
| TSCTSF1 | 295.71 | 3.86 | 1.640e+00 | 5.526e-02 | K | SC-TS FITTING -1 TEMP |
| TSCTSF6 | 296.72 | 4.38 | 2.033e+00 | -6.494e-03 | K | SC-TS FITTING -6 TEMP |
)
)
)
)
| MUPS - Daily Maximums | ||||||
|---|---|---|---|---|---|---|
| MSID | MEAN | RMS | DELTA/YR | DELTA/YR/YR | UNITS | DESCRIPTION |
| PM1THV1T | 333.47 | 8.23 | -2.762e-01 | -1.892e+02 | K | MUPS 1 THRUSTER VALVE 01 TEMP |
| PLINE02T | 318.58 | 10.69 | 1.932e+00 | 2.815e+00 | K | PROP LINE TEMP 02 |
| PLINE03T | 317.85 | 13.22 | 1.429e+00 | 3.664e+00 | K | PROP LINE TEMP 03 |
| PLINE04T | 302.96 | 12.38 | 1.542e+00 | 3.898e+00 | K | PROP LINE TEMP 04 |
)
)
)
)
Quarterly Trends
- Ephin Thermal and Voltage
| Previous Quarter | ||||||
| MSID | MEAN | RMS | DELTA/YR | DELTA/YR/YR | UNITS | DESCRIPTION |
| 5EIOT | 352.64 | 16.38 | -7.677e+00 | 4.874e+02 | K | EIO TEMP |
| 5EPHINT | 327.53 | 4.71 | 2.056e-01 | -1.602e+02 | K | EPHIN TEMP |
)
)
- ACA Thermal
| Previous Quarter | ||||||
| MSID | MEAN | RMS | DELTA/YR | DELTA/YR/YR | UNITS | DESCRIPTION |
| AACBPPT | 304.58 | 0.86 | -5.573e-01 | -8.588e+01 | K | AC BASEPLATE TEMP (PRIME) |
| AACBPRT | 299.46 | 0.85 | -5.340e-01 | -8.494e+01 | K | AC BASEPLATE TEMP (RDNT) |
| AACCCDPT | 256.10 | 0.84 | -6.965e-01 | -8.655e+01 | K | AC CCD TEMP (PRI) |
| AACCCDRT | 299.48 | 0.93 | -5.662e-01 | -9.316e+01 | K | AC CCD TEMP (RDNT) |
)
)
)
)
- Spacecraft Electronics
| Previous Quarter | ||||||
| MSID | MEAN | RMS | DELTA/YR | DELTA/YR/YR | UNITS | DESCRIPTION |
| ELBI | 57.14 | 1.28 | 5.651e-01 | 4.695e+01 | AMP | LOAD BUS CURRENT |
| ELBV | 28.78 | 0.18 | 1.903e+00 | -5.179e+00 | V | LOAD BUS VOLTAGE |
| OHRMAPWR | 55.93 | 2.30 | -2.490e+00 | 3.340e+02 | W | HRMA COMPUTED TOTAL POWER |
| OOBAPWR | 48.93 | 2.21 | -1.762e+00 | 2.366e+02 | W | OBA COMPUTED TOTAL POWER |
)
)
)
)
Envelope Trending
EPS Battery
HARMA Heaters
Spacecraft Motions
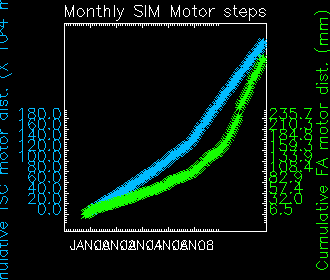
|
|
Reaction Wheel Rotations
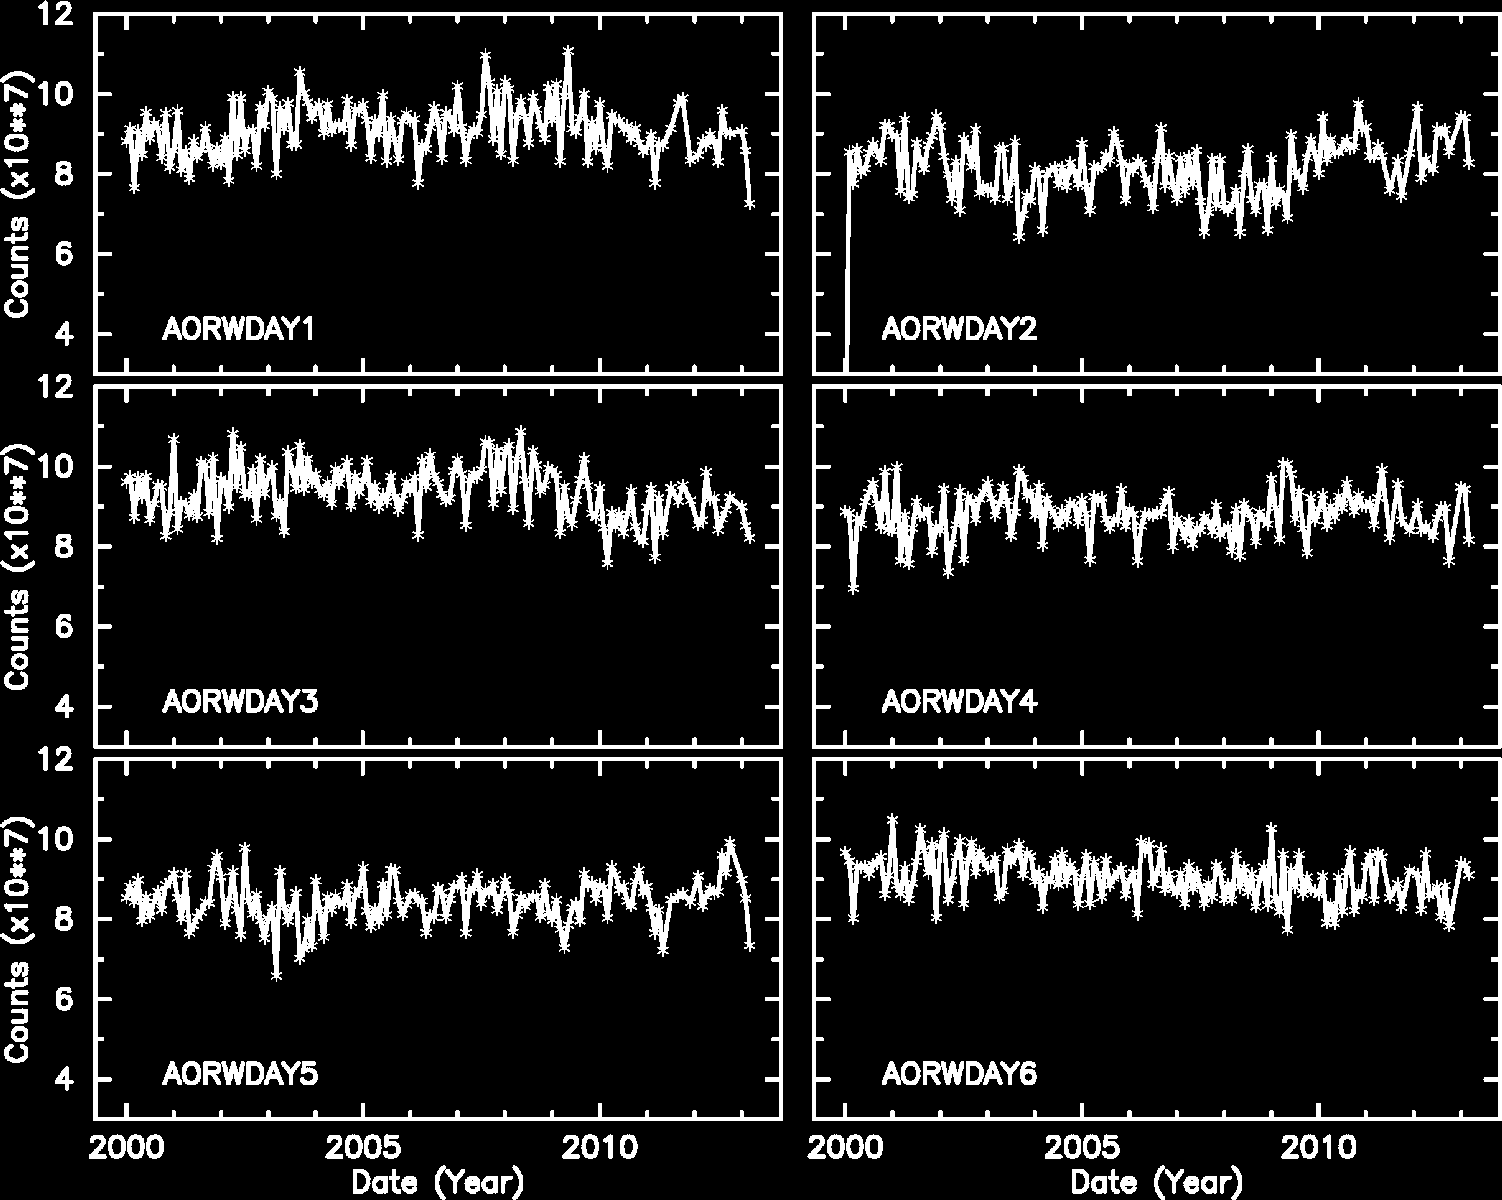
Note: From Feb 2010, the computation of reaction wheel rotations are slightly modified.
Links to Past Monthly Reports
| Year | Month | |||||||||||
|---|---|---|---|---|---|---|---|---|---|---|---|---|
| 1999 | Jul | Aug | Sep | Oct | Nov | Dec | ||||||
| 2000 | Jan | Feb | Mar | Apr | May | Jun | Jul | Aug | Sep | Oct | Nov | Dec |
| 2001 | Jan | Feb | Mar | Apr | May | Jun | Jul | Aug | Sep | Oct | Nov | Dec |
| 2002 | Jan | Feb | Mar | Apr | May | Jun | Jul | Aug | Sep | Oct | Nov | Dec |
| 2003 | Jan | Feb | Mar | Apr | May | Jun | Jul | Aug | Sep | Oct | Nov | Dec |
| 2004 | Jan | Feb | Mar | Apr | May | Jun | Jul | Aug | Sep | Oct | Nov | Dec |
| 2005 | Jan | Feb | Mar | Apr | May | Jun | Jul | Aug | Sep | Oct | Nov | Dec |
| 2006 | Jan | Feb | Mar | Apr | May | Jun | Jul | Aug | Sep | Oct | Nov | Dec |
| 2007 | Jan | Feb | Mar | Apr | May | Jun | Jul | Aug | Sep | Oct | Nov | Dec |
| 2008 | Jan | Feb | Mar | Apr | May | Jun | Jul | Aug | Sep | Oct | Nov | Dec |
| 2009 | Jan | Feb | Mar | Apr | May | Jun | Jul | Aug | Sep | Oct | Nov | Dec |
| 2010 | Jan | Feb | Mar | Apr | May | Jun | Jul | Aug | Sep | Oct | Nov | Dec |
| 2011 | Jan | Feb | Mar | Apr | May | Jun | Jul | Aug | Sep | Oct | Nov | Dec |
| 2012 | Jan | Feb | Mar | Apr | May | Jun | Jul | Aug | Sep | Oct | Nov | Dec |
| 2013 | Jan | Feb | Mar | Apr | ||||||||