ACIS
ACIS DOSE Registered-Photon-Map
The steps we took to compute the dose map are;
- Level 1 Event files for a specified month are obtained from archive.
- Image data including I2, I3, S2, S3 CCDs are extracted from all event files.
- All the extracted image data were merged to create a month long exposure map for the month.
- The exposure map is opened with ds9, and check a distribution of count rates against energy. From this, estimate the upper threshold value. Any events beyond this upper threshold are assumed erroneous events such as bad pixels.
- Using this upper threshold, the data is filtered, and create a cleaned exposure map for the month.
- The exposure map from each month from the Sep 1999 is added up to create a cumulative exposure map for each month.
- Using fimgstatistic, we compute count rate statistics for each CCDs.
- For observations with high data drop rates (e.g., Crab nebula, Cas A), we corrected the observations by adding events.
-
Note: Counts and RMS's of Cumulative maps are lower than the previous months.
This is because we excluded extreme outliers.
Please check more detail plots at Telemetered Photon Dose Trend page.
)
)
)
Statistics:
# IMAGE     NPIX        MEAN           RMS              MIN     MAX
ACIS_jun13 6004901       5.644         8.544           0.0      459


I2 node 0  262654   7.660618    3.400864    0.0  40.0
I2 node 1  262654   7.938593    4.008661    0.0 337.0
I2 node 2  262654   7.766567    3.361365    0.0  81.0
I2 node 3  262654   7.741827    3.736010    0.0 418.0

I3 node 0  262654   8.070561    3.653362    0.0  41.0
I3 node 1  262654   8.510654    7.337230    0.0 155.0
I3 node 2  262654   7.386715    3.223885    0.0  75.0
I3 node 3  262654   7.443520    3.285380    0.0 119.0

S2 node 0  262654   6.134252    2.855781    0.0  74.0
S2 node 1  262654   6.124444    3.141271    0.0  48.0
S2 node 2  262654   6.416617    3.229428    0.0  69.0
S2 node 3  262654   6.453047    3.207987    0.0 328.0

S3 node 0  262654   7.475820    6.103814    0.0 220.0
S3 node 1  262654   7.857894    3.407659    0.0  65.0
S3 node 2  262654   7.615070    2.934160    0.0  44.0
S3 node 3  262654   7.108221    2.997203    0.0  31.0
)
)
)
Statistics:
 IMAGE        NPIX      MEAN             RMS            MIN    MAX
ACIS_total   6004901    1721.915         2274.454       0.0   101134


I2 node 0  262654   1445.529571 284.959415  0.0     8895.0
I2 node 1  262654   1519.926192 382.456736  0.0    33908.0
I2 node 2  262654   1548.964230 332.468778  0.0     6631.0
I2 node 3  262654   1544.135858 391.701143  0.0     9343.0

I3 node 0  262654   1621.403328 397.086509  0.0     6409.0
I3 node 1  262654   1701.894123 1291.830482 0.0    32961.0
I3 node 2  262654   1484.442201 274.285359  0.0     7318.0
I3 node 3  262654   1470.296272 292.106955  0.0    25661.0

S2 node 0  262654   2071.726333 316.494735  1079.0 28618.0
S2 node 1  262654   2208.996199 485.174851  1124.0 12185.0
S2 node 2  262654   2445.431464 479.336144  1471.0 42108.0
S2 node 3  262654   2379.903773 364.119480  1406.0 39155.0

S3 node 0  262654   3604.271308 1715.012579 1489.0 12771.0
S3 node 1  262654   4712.081649 1919.954866 0.0    13021.0
S3 node 2  262654   3633.081269 923.674638  1454.0  9105.0
S3 node 3  262654   2839.682734 448.017061  1615.0  9288.0
)
|
)
|
)
|
)
|
| Mar 2013 | Dec 2012 | Sep 2012 | Jun 2012 |
|---|
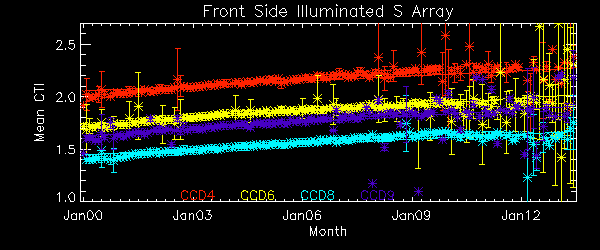
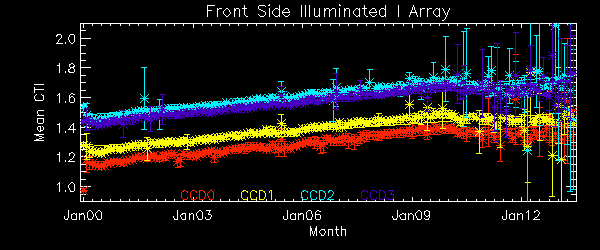
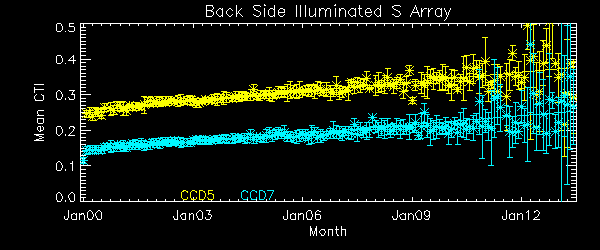
The Mean Detrended CTI
We report CTIs with a refined data definition. CTIs were computed for the temperature dependency corrected data. Please see CTI page for detailed explanation. CTI's are computed for Mn K alpha, and defined as slope/intercept x10^4 of row # vs ADU. Data file: here
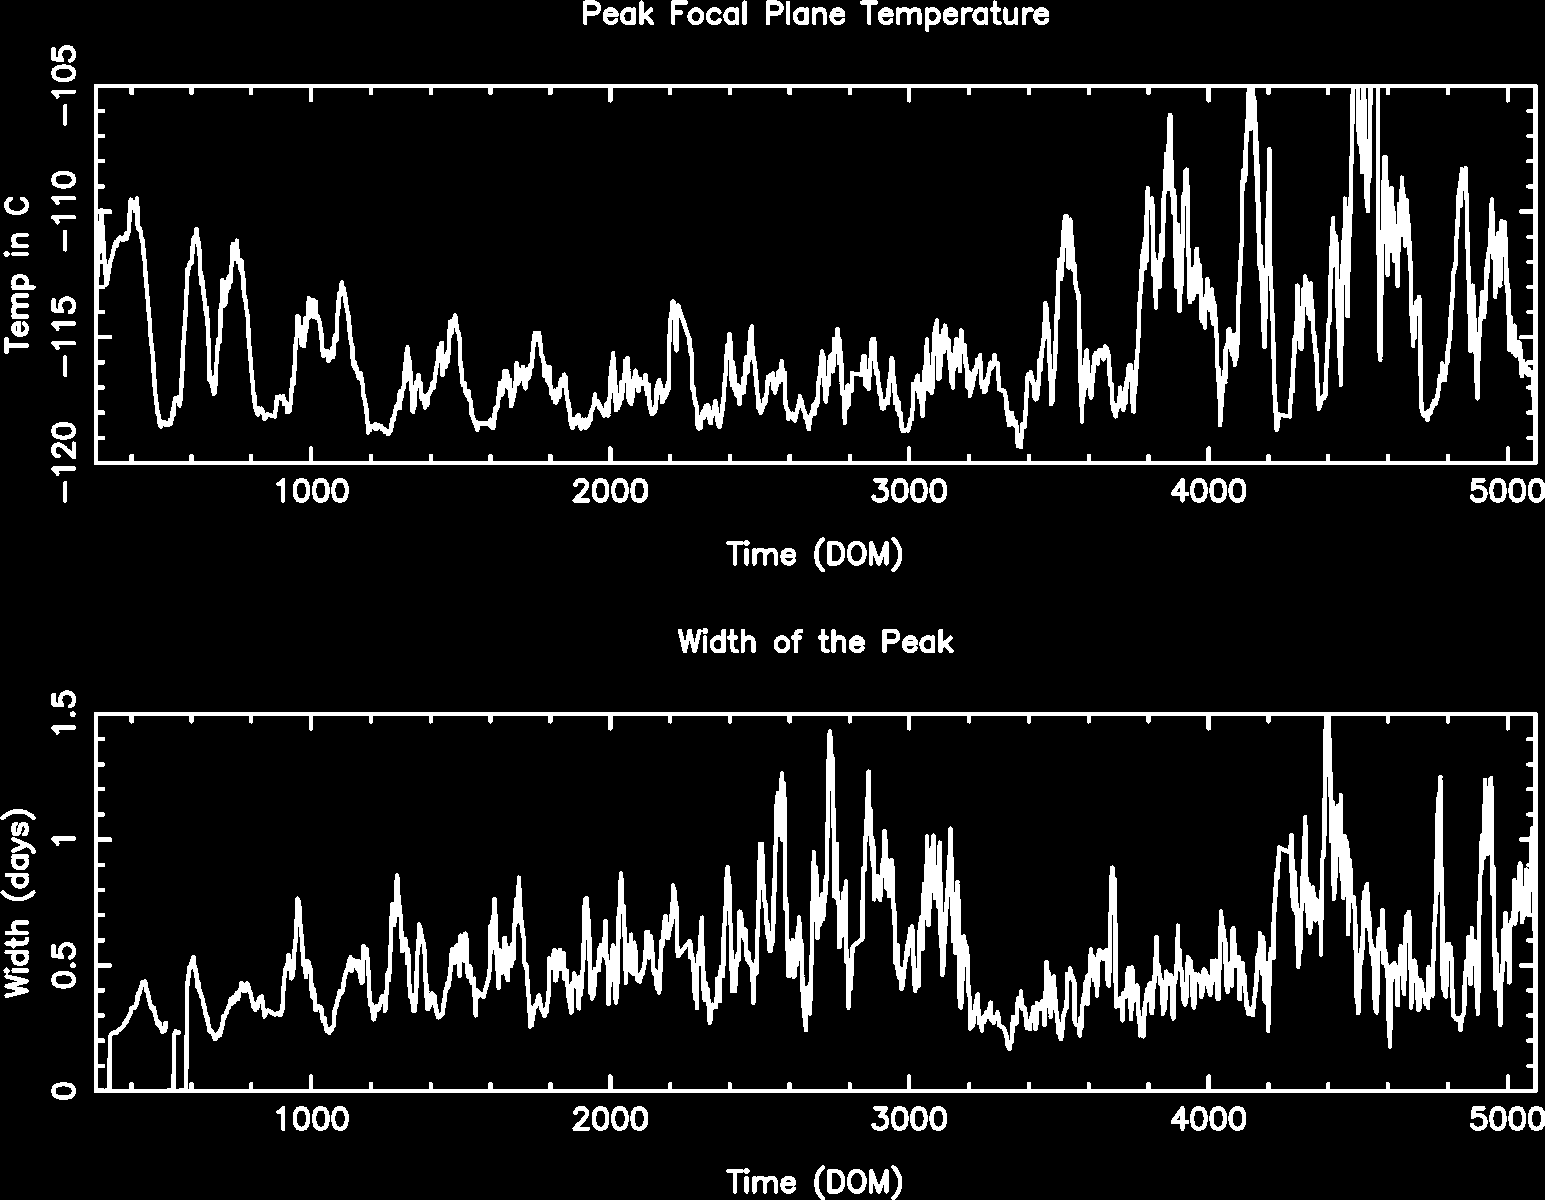
Focal Plane Temperature
Jun 2013 Focal Temperature
| The Mean (max) FPT: | |
|---|---|
| -117.82 | +/- 1.12 C |
| Mean Width: | |
| 0.57 | +/- 0.62 days |
Averaged Focal Plane Temperature
We are using 10 period moving averages to show trends of peak temperatures and peak widths. Note, the gaps in the width plot are due to missing/corrupted data.
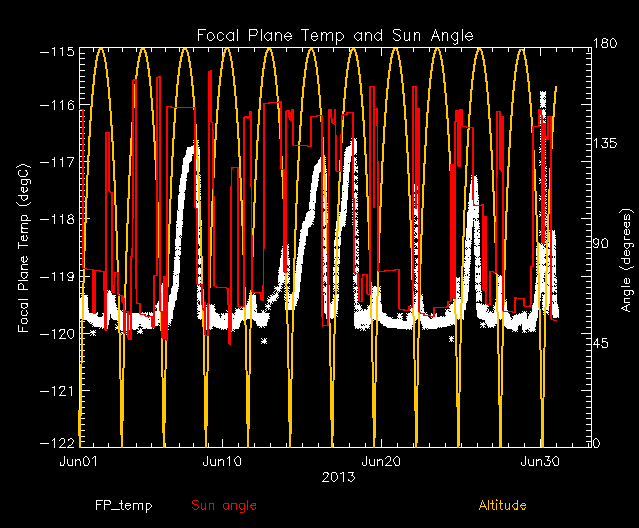
Focal Plane Temperature, Sun Angle and Altitude
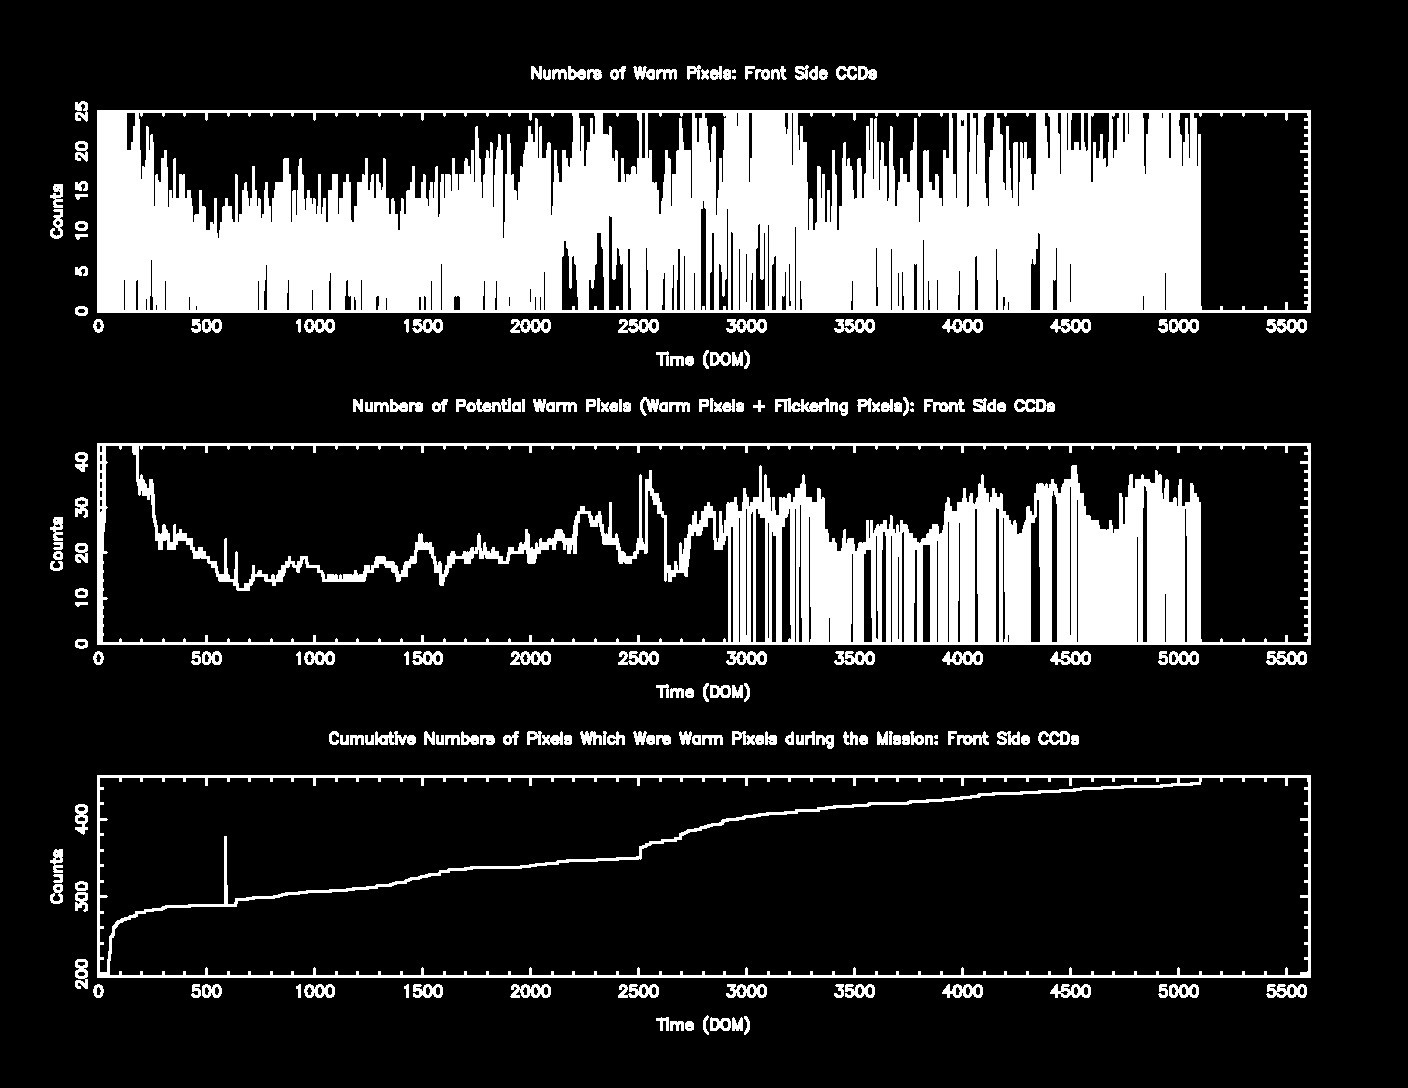
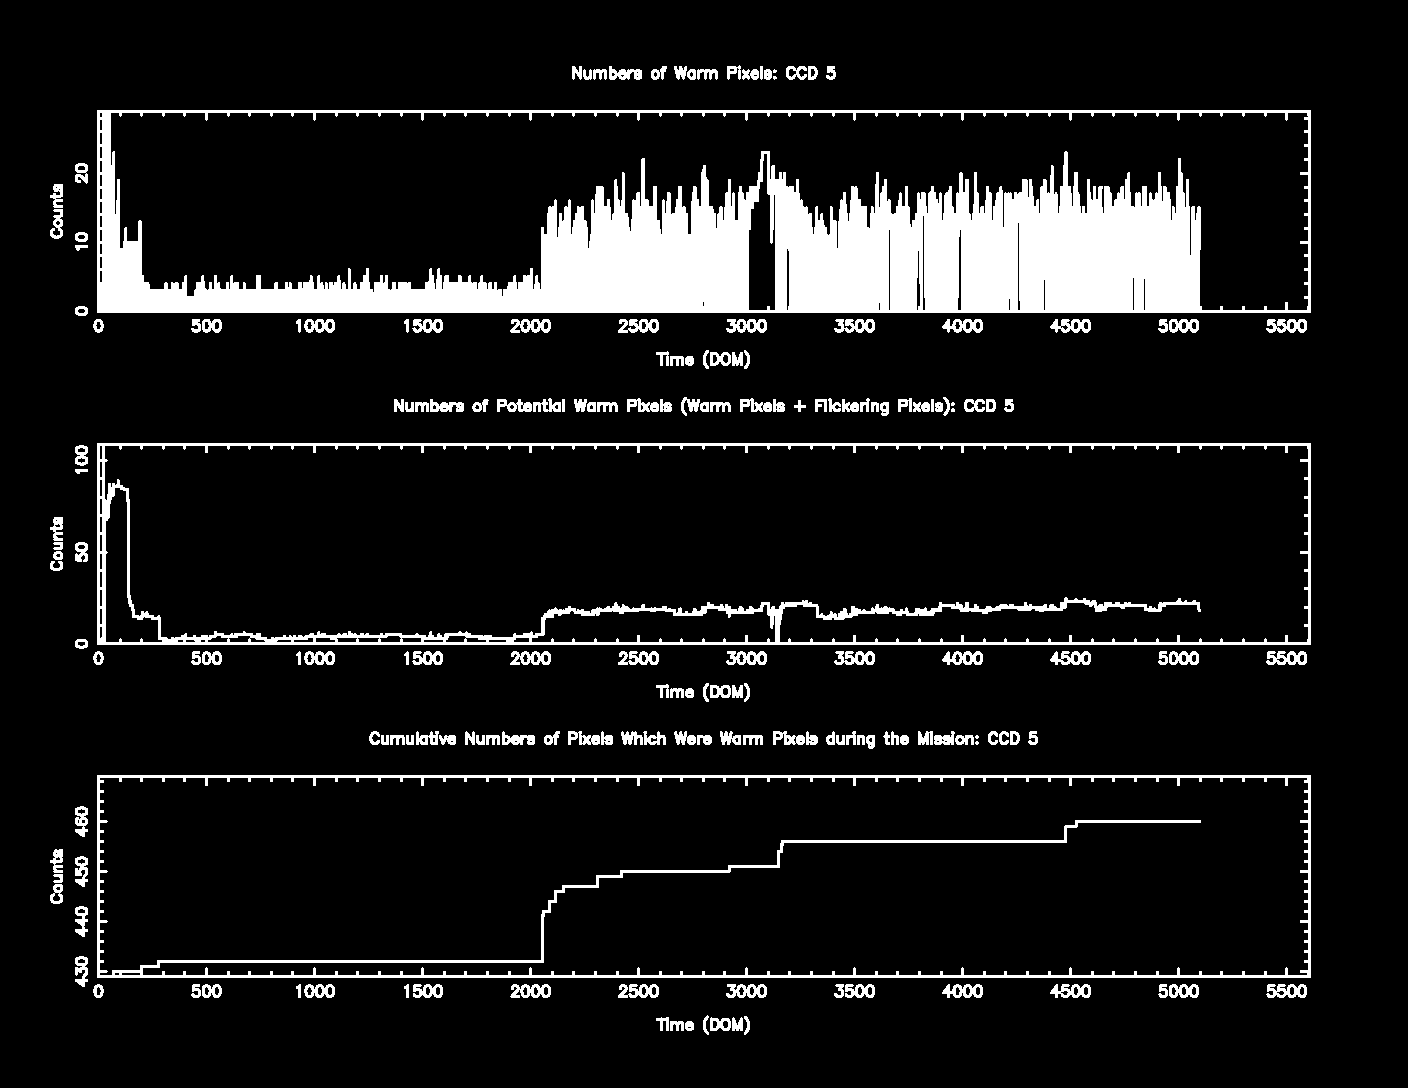
Bad Pixels
The plots below were generated with a new warm pixel finding script. Please see Acis Bad Pixel Page for details.
Front Side CCDs
Back Side CCD (CCD5)
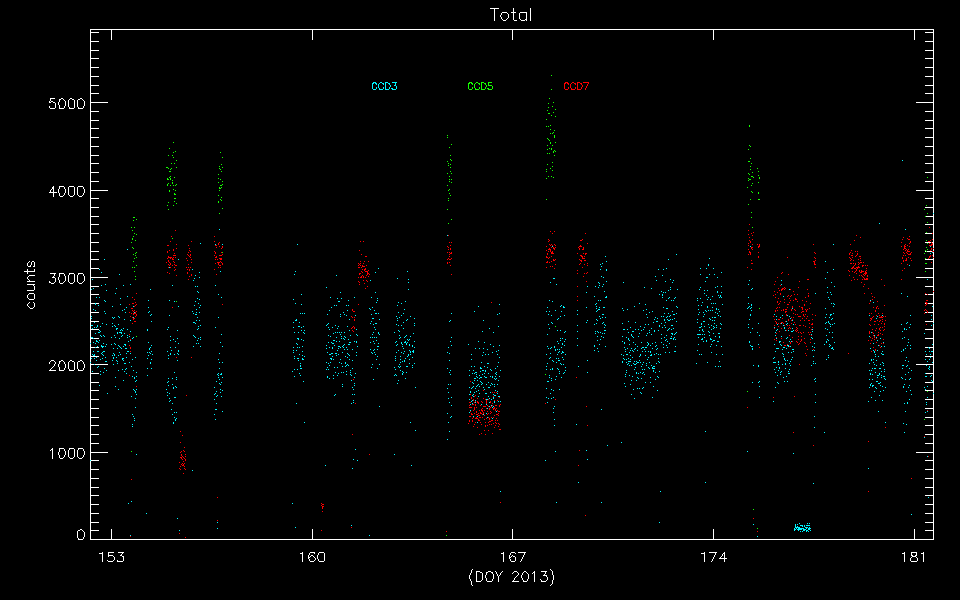
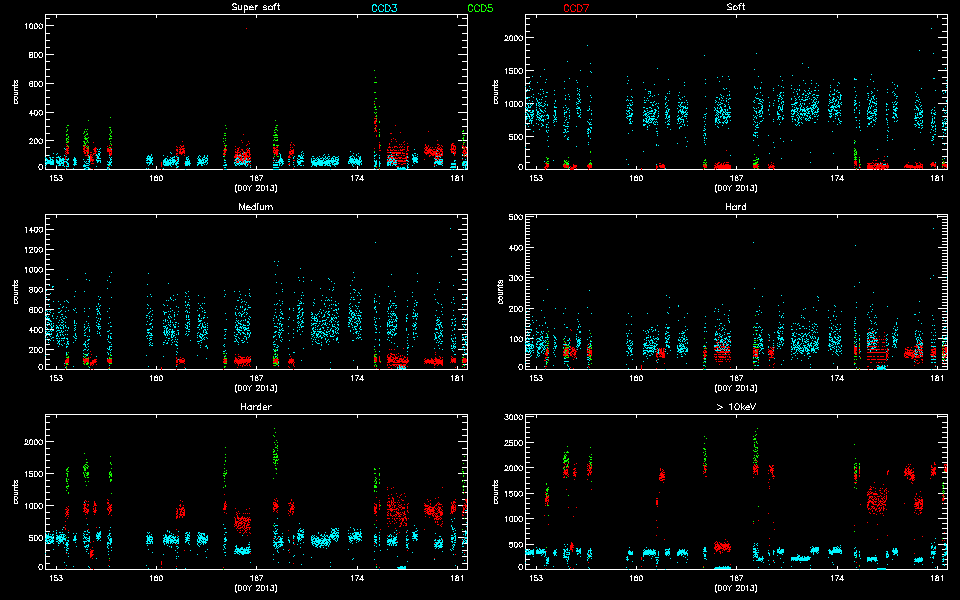
Science Instrument Background Rates
| Name | Low (keV) | High(KeV) | Description |
|---|---|---|---|
| SSoft | 0.00 | 0.50 | Super soft photons |
| Soft | 0.50 | 1.00 | Soft photons |
| Med | 1.00 | 3.00 | Moderate energy photons |
| Hard | 3.00 | 5.00 | Hard Photons |
| Harder | 5.00 | 10.00 | Very Hard photons |
| Hardest | 10.00 | Beyond 10 keV |
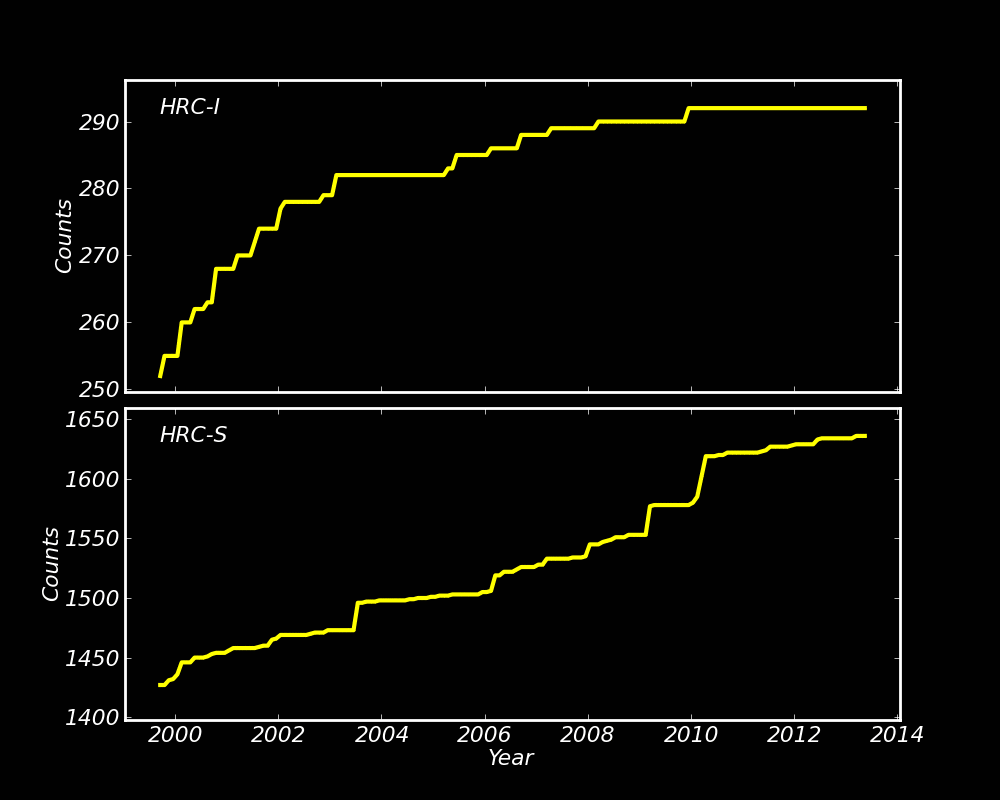
HRC
DOSE of Central 4K Pore-Pairs
Please refer to Maximum Dose Trends for more details.
)
        IMAGE                NPIX      MEAN    STDDEV      MIN       MAX
HRCI_06_2013.fits          16777216   0.008    0.0957      0.0       8.0
)
        IMAGE                NPIX      MEAN    STDDEV      MIN       MAX
HRCI_08_1999_06_2013.fits  16777216   3.993    4.788       0.0       292.0
)
         IMAGE                NPIX      MEAN    STDDEV      MIN       MAX
HRCS_06_2013.fits          16777216   0.046    0.3008      0.0        33.0
)
        IMAGE                NPIX     MEAN      STDDEV      MIN      MAX
HRCS_08_1999_06_2013.fits  16777216  14.610      24.429      0.0      1640.0
|
|
Max dose trend plots corrected for events that "pile-up"
in the center of the taps due to bad position information.
|
)
|
)
|
)
|
)
|
| Mar 2013 | Dec 2012 | Sep 2012 | Jun 2012 |
|---|
)
|
)
|
)
|
)
|
| Mar 2013 | Dec 2012 | Sep 2012 | Jun 2012 |
|---|
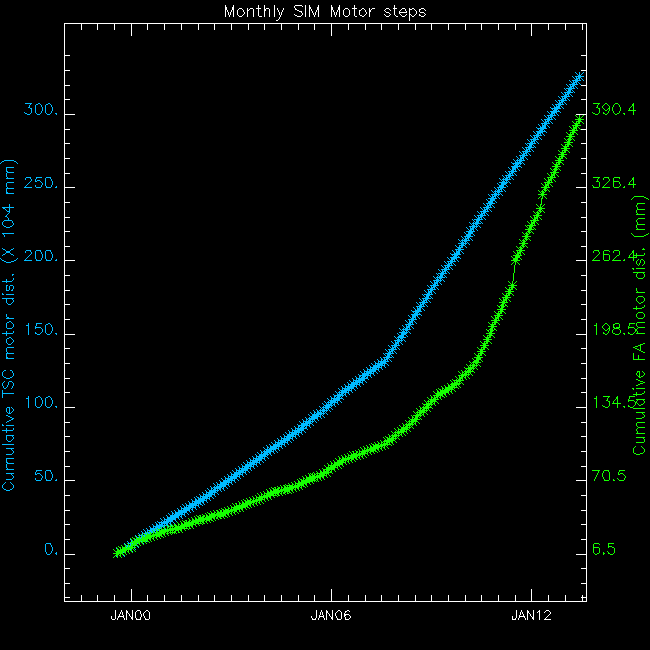
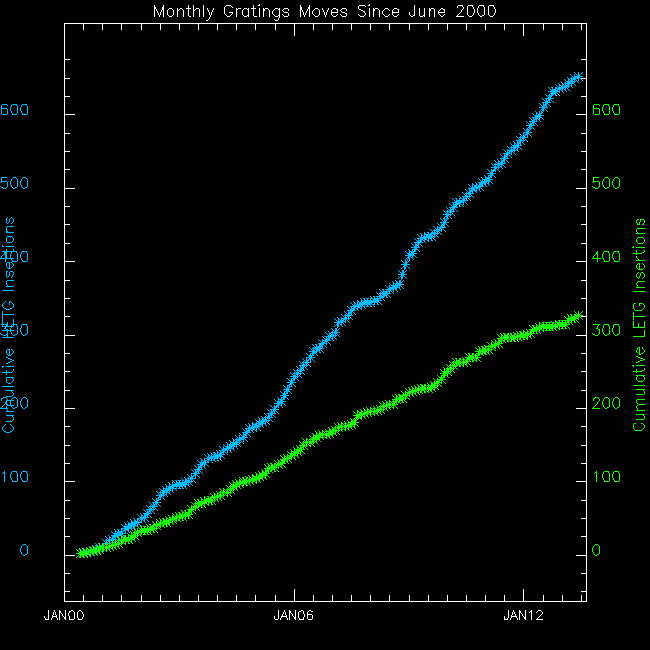
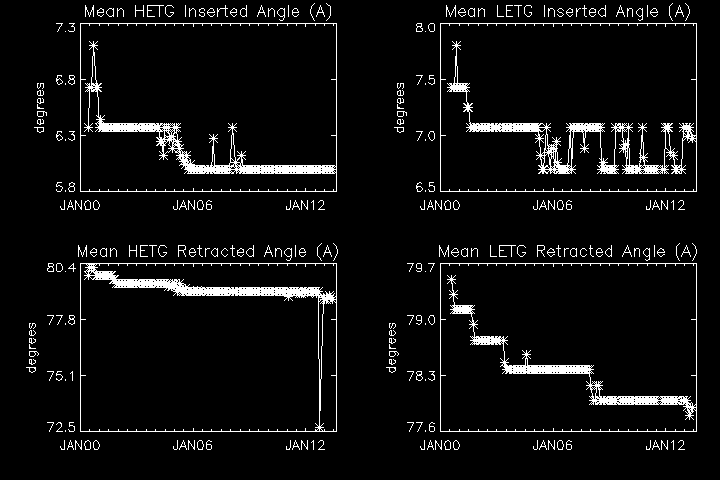
Gratings
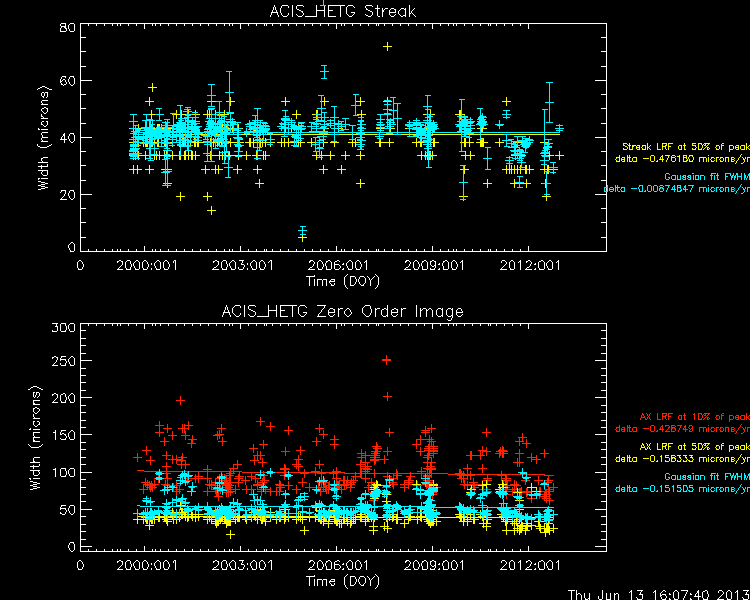
Focus
We plot the width of the zero order streak of ACIS/HETG observations and the width of the zero order image for HRC/LETG observations of point sources. No significant defocusing trend is seen at this time. See Gratings Focus pages.
PCAD
ACA Trending
Fid Light Drift
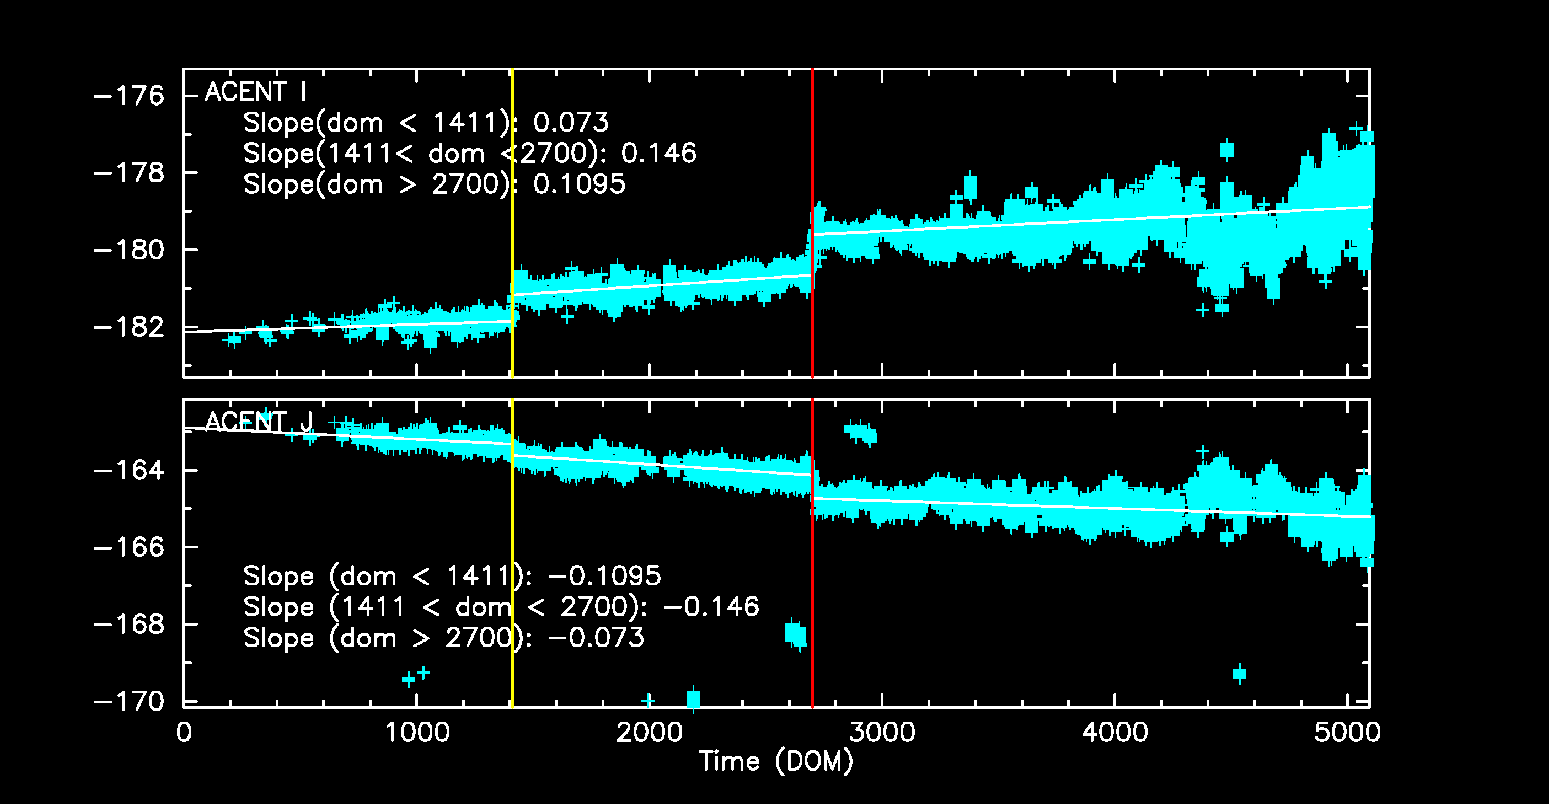
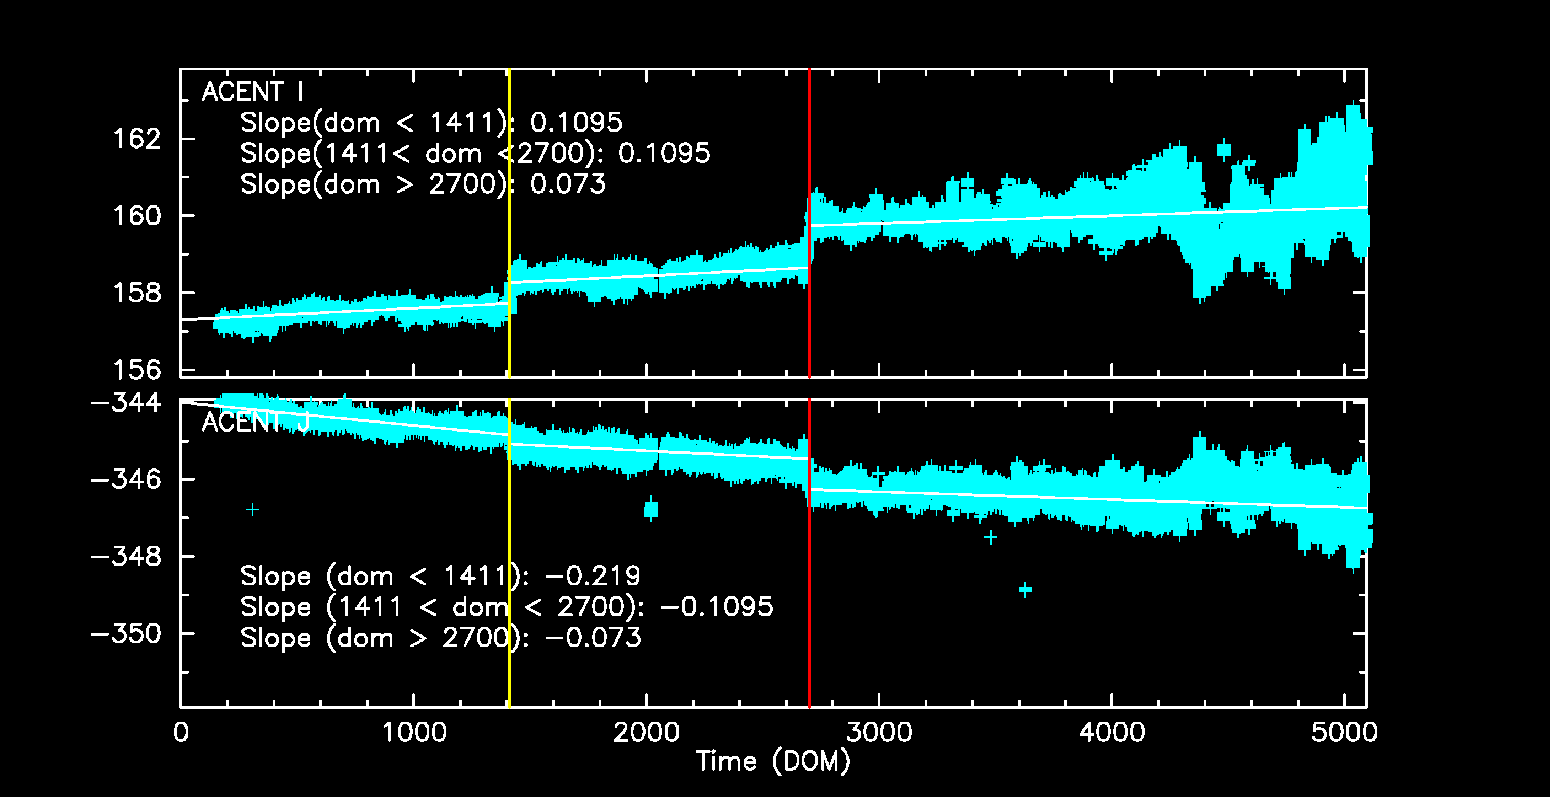
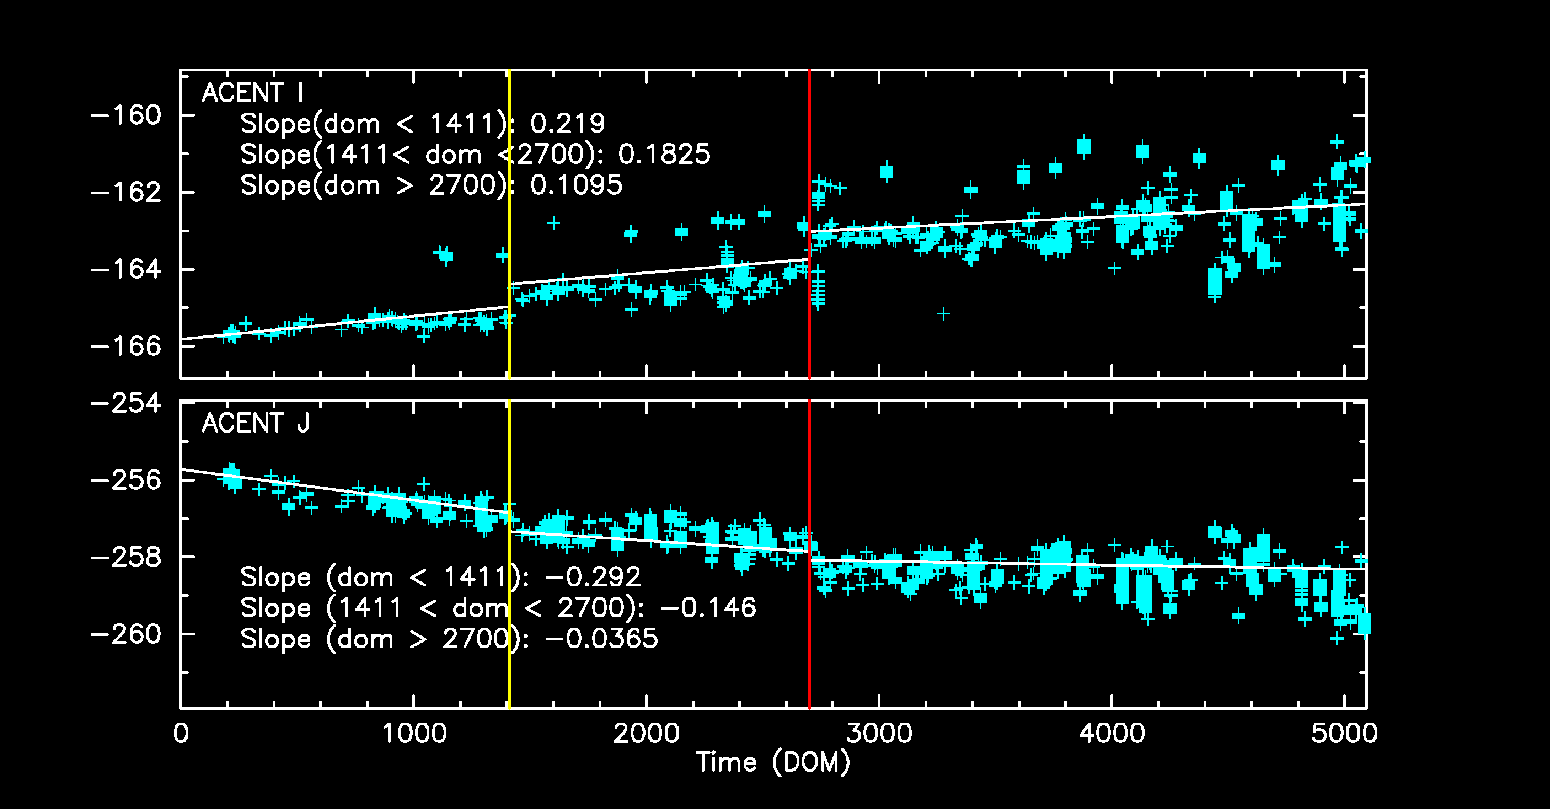
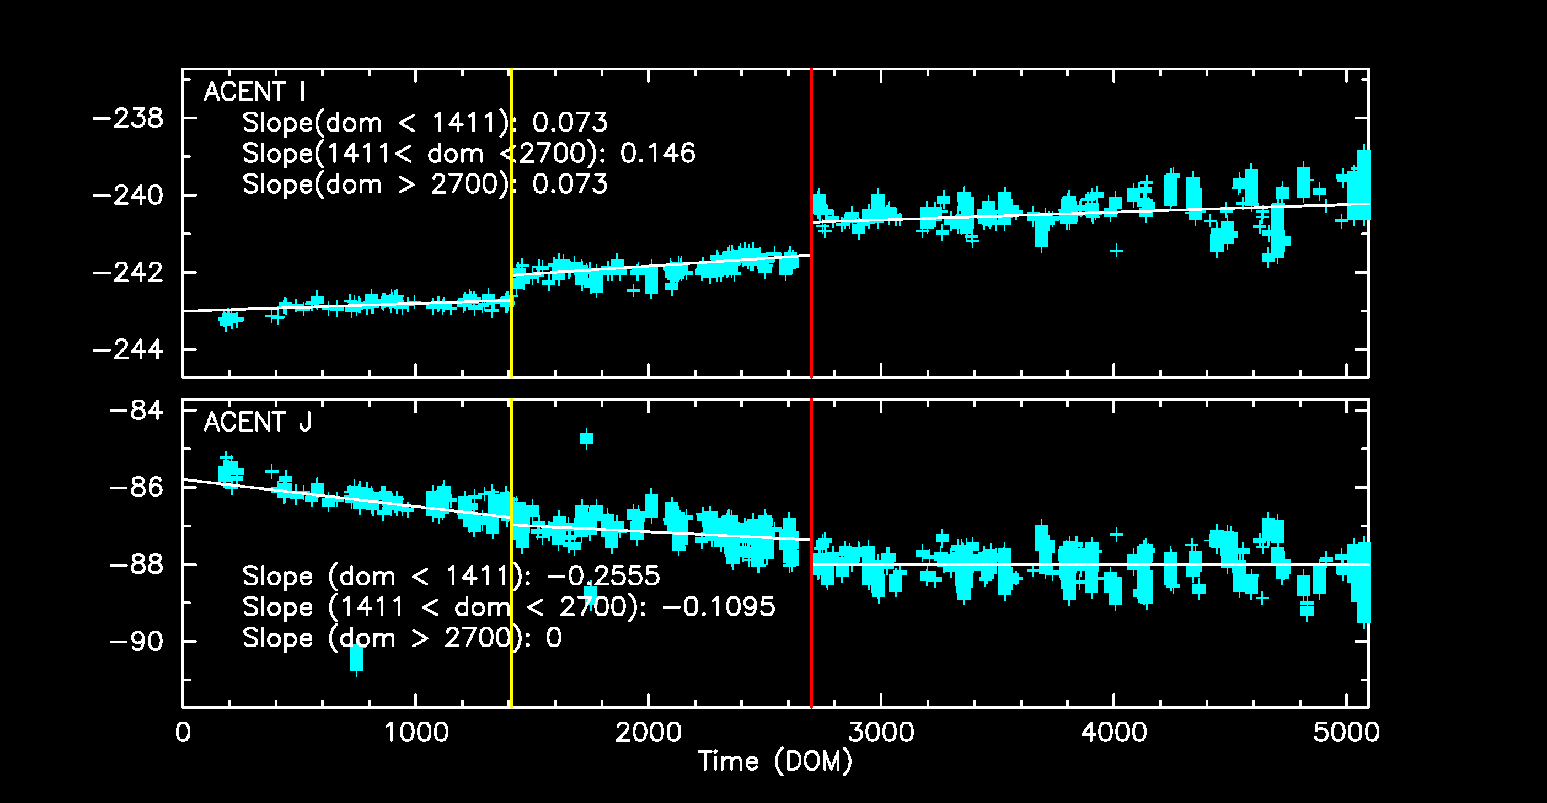
Fid light positions on ACA drift with time. The drift trends of Fid light 2 with ACIS-I and ACIS-S configurations are shown below.
The top panel shows Fid light 2 drift in ACENT I (app. along with -Y axis), and the
bottom panel shows that in ACENT J (app. along with Z axis). The unit is a pixel, and
one pixel is approximately 0.5 arcsec. The slope listed at the top right corner is
the change in a position per year (arcsec/yr). The vertical line on DOM = 1411 (Jun 1, 2003)
indicates a transition date of use of IRU-1 to IRU-2.
See also Tom Aldcroft's updated page:
https://cxc.cfa.harvard.edu/mta/ASPECT/fid_drift
Fid 2 (ACIS-I)
Fid 2 (ACIS-S)
Fid 8 (HRC-I)
Fid 12 (HRC-S)
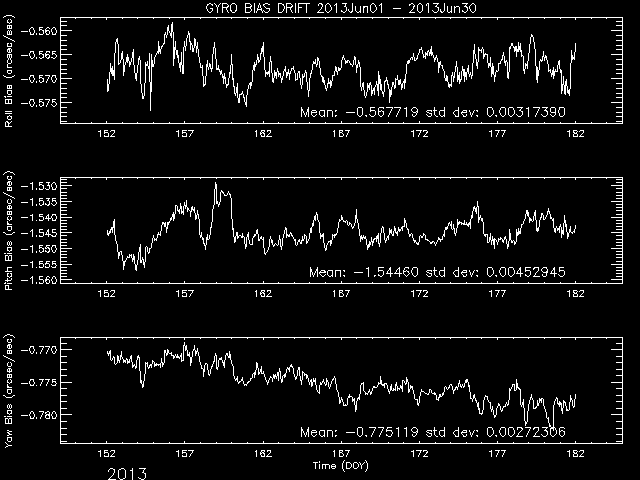
Gyro Bias Drift
Radiation History
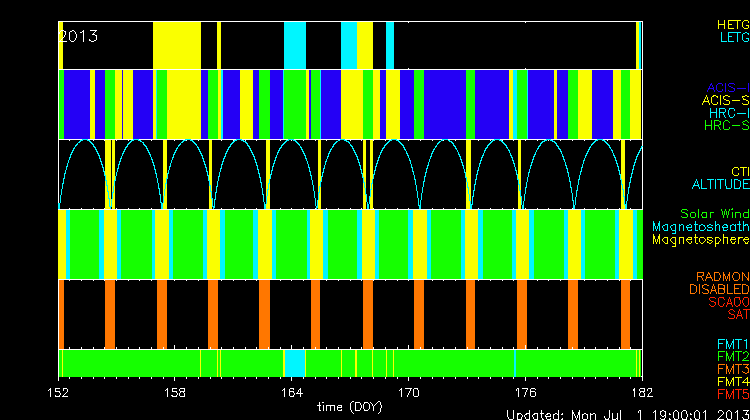
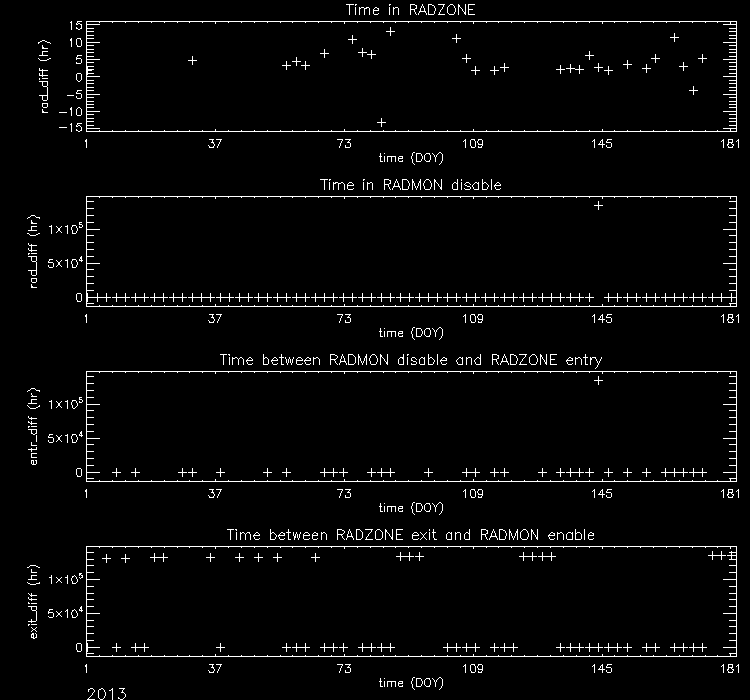
Radiation Zone Timing
Plotted below are radiation zone timing plots based on the following definitions of radiation zone:
- RADZONE - Ephin levels (in any of the E1300,P4GM,P41GM channels) are more than 1/3 of RADMON safing thresholds.
- RADMON - Radmon is disabled for radiation zone (as commanded based on OFLS model, for comparison with actual radiation levels).
- PERIGEE - Time of closest earth approach (for comparison)
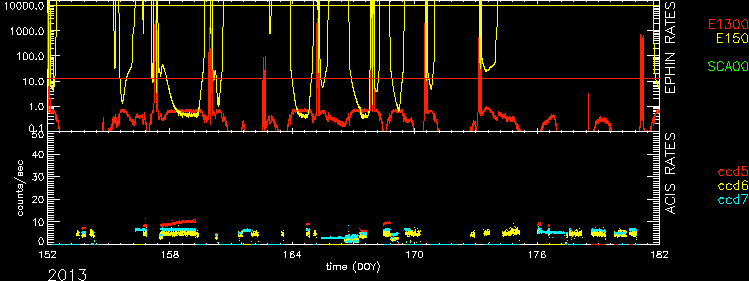
Radiation Count Rates of Jun 2013
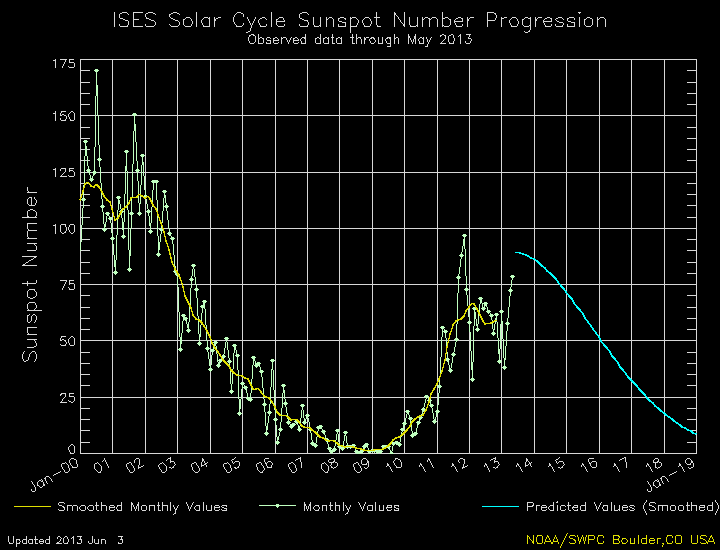
Sun Spot History
Trending
Quarterly Trends
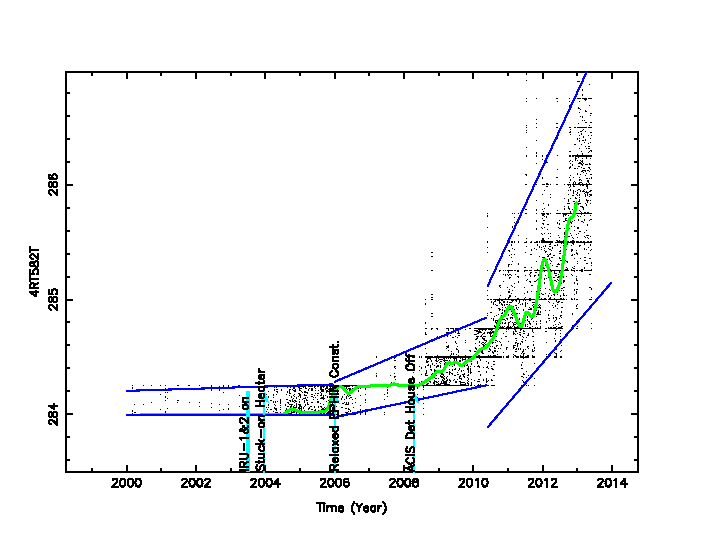
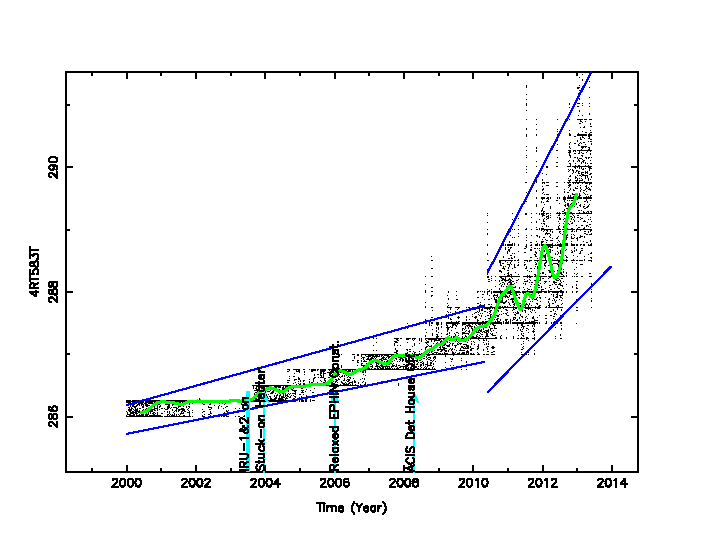
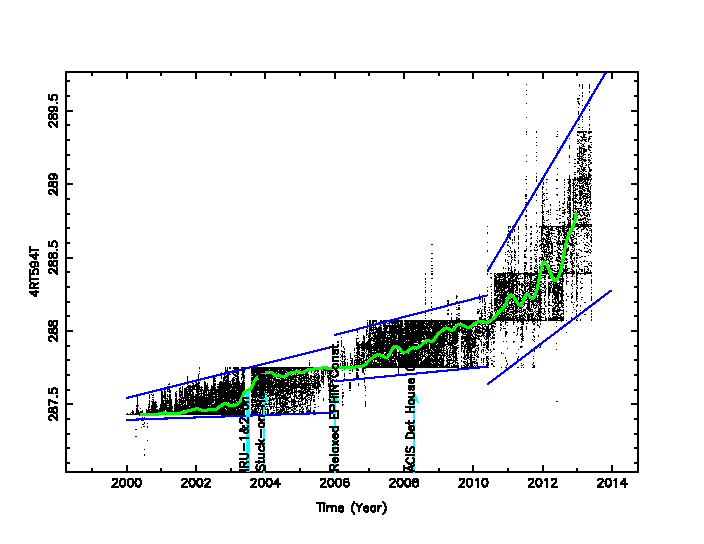
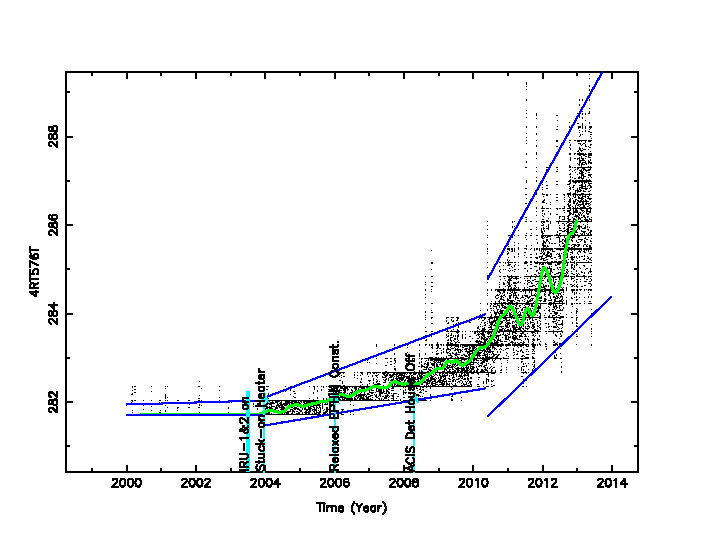
- ACIS Temperature
| Previous Quarter | ||||||
| MSID | MEAN | RMS | DELTA/YR | DELTA/YR/YR | UNITS | DESCRIPTION |
| 1CBAT | 205.96 | 1.96 | -5.764e+00 | 6.004e+01 | K | CAMERA BODY TEMP. A |
| 1CBBT | 206.60 | 1.90 | -3.903e+00 | 4.849e+01 | K | CAMERA BODY TEMP. B |
| 1CRAT | 146.33 | 1.41 | -3.033e+00 | -1.383e+01 | K | COLD RADIATOR TEMP. A |
| 1CRBT | 146.97 | 1.74 | -3.634e+00 | -4.123e+01 | K | COLD RADIATOR TEMP. B |
| 1DACTBT | 256.25 | 2.24 | -2.496e-01 | 1.209e+02 | K | DA COLLIMATOR TEMP. B |
)
)
)
)
)
- ACIS Electronics Side A
| Previous Quarter | ||||||
| MSID | MEAN | RMS | DELTA/YR | DELTA/YR/YR | UNITS | DESCRIPTION |
| 1DAHHAVO | 1.523e-04 | 6.485e-04 | 1.594e-03 | 6.861e-04 | V | DA HOUSING HTR +28V INPUT A |
| 1DE28AVO | 27.97 | 0.20 | 1.728e+00 | -1.028e+01 | V | DEA +28V INPUT A |
| 1DP28AVO | 27.99 | 0.20 | 1.730e+00 | -1.003e+01 | V | DPA +28V INPUT A |
| 1DPICACU | 1.15 | 0.22 | -4.005e-01 | 5.932e+00 | AMP | DPA INPUT CURRENT A |
)
)
)
)
- ACIS Electronics Side B
| Previous Quarter | ||||||
| MSID | MEAN | RMS | DELTA/YR | DELTA/YR/YR | UNITS | DESCRIPTION |
| 1DE28BVO | 28.35 | 0.19 | 1.658e+00 | -8.809e+00 | V | DEA +28V INPUT B |
| 1DP28BVO | 28.37 | 0.18 | 1.652e+00 | -8.421e+00 | V | DPA +28V INPUT B |
)
)
- ACIS Mechanical
| Previous Quarter | ||||||
| MSID | MEAN | RMS | DELTA/YR | DELTA/YR/YR | UNITS | DESCRIPTION |
| 1HOPRAPR | -2.81 | 2.651e-03 | 3.069e-02 | 1.145e-01 | Torr | DIFFERENTIAL HOUSING PRESSURE A |
)
Envelope Trending
HARMA Struts
HARMA Thermal
Spacecraft Motions
|
|
Reaction Wheel Rotations
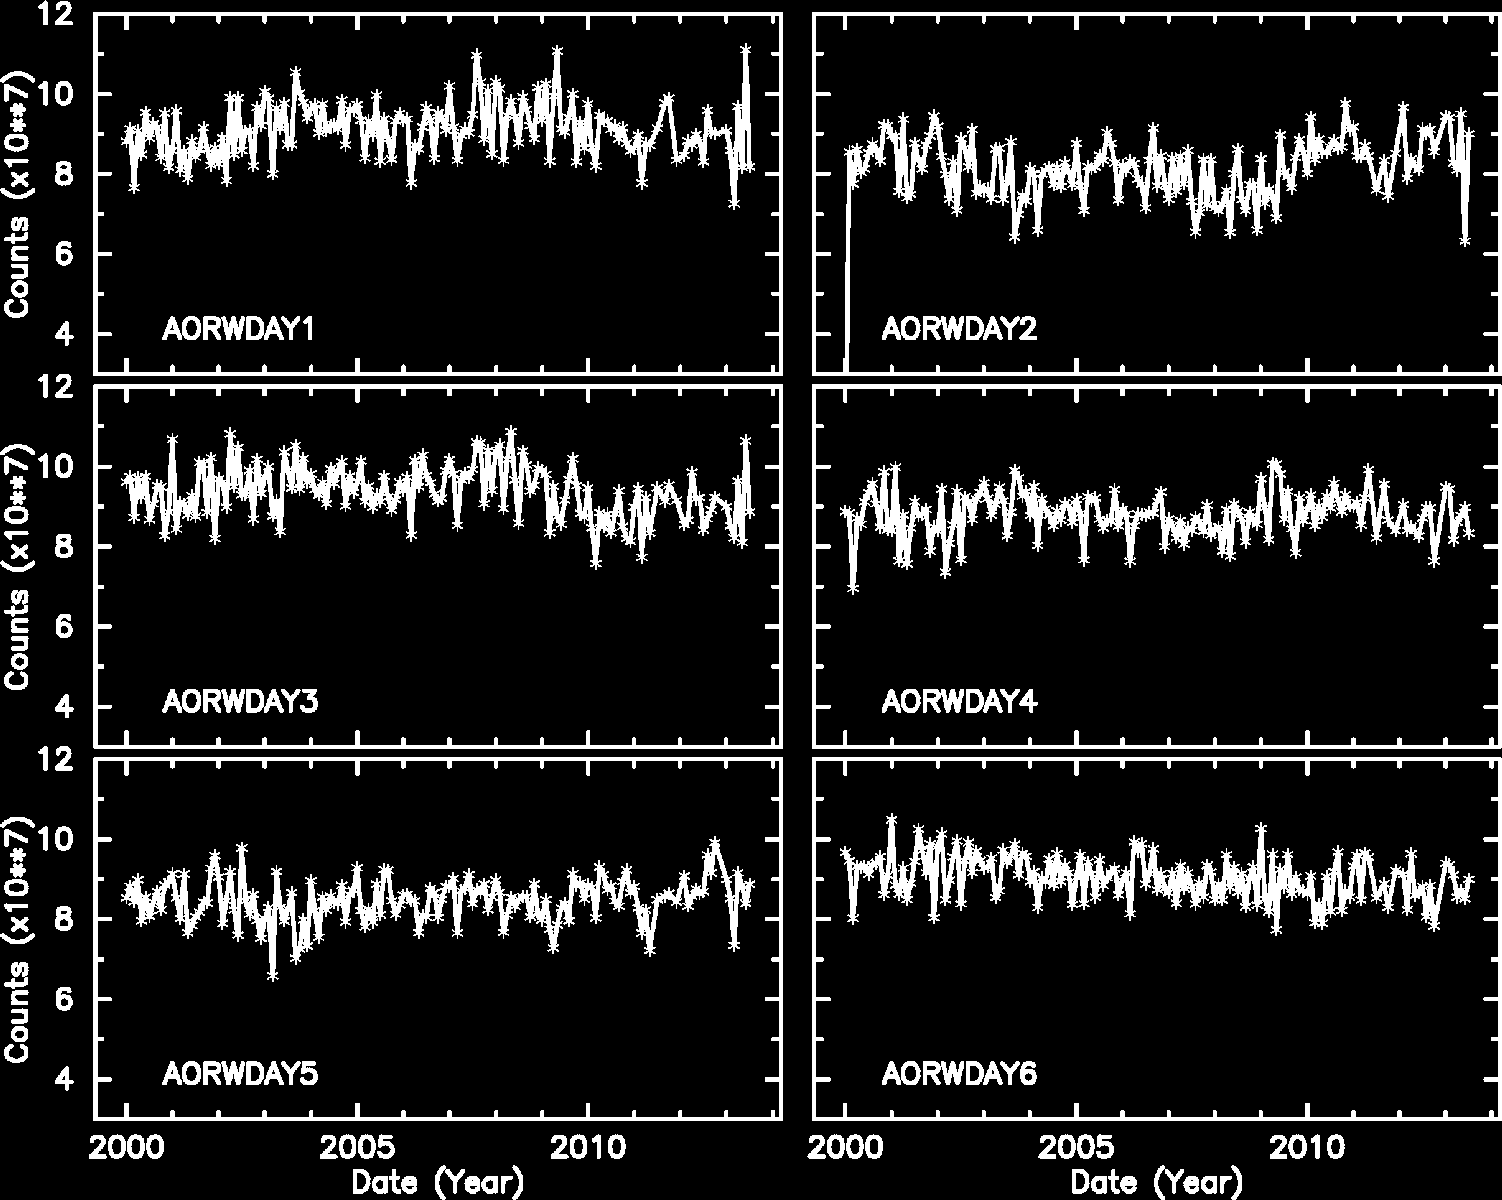
Note: From Feb 2010, the computation of reaction wheel rotations are slightly modified.
Links to Past Monthly Reports
| Year | Month | |||||||||||
|---|---|---|---|---|---|---|---|---|---|---|---|---|
| 1999 | Jul | Aug | Sep | Oct | Nov | Dec | ||||||
| 2000 | Jan | Feb | Mar | Apr | May | Jun | Jul | Aug | Sep | Oct | Nov | Dec |
| 2001 | Jan | Feb | Mar | Apr | May | Jun | Jul | Aug | Sep | Oct | Nov | Dec |
| 2002 | Jan | Feb | Mar | Apr | May | Jun | Jul | Aug | Sep | Oct | Nov | Dec |
| 2003 | Jan | Feb | Mar | Apr | May | Jun | Jul | Aug | Sep | Oct | Nov | Dec |
| 2004 | Jan | Feb | Mar | Apr | May | Jun | Jul | Aug | Sep | Oct | Nov | Dec |
| 2005 | Jan | Feb | Mar | Apr | May | Jun | Jul | Aug | Sep | Oct | Nov | Dec |
| 2006 | Jan | Feb | Mar | Apr | May | Jun | Jul | Aug | Sep | Oct | Nov | Dec |
| 2007 | Jan | Feb | Mar | Apr | May | Jun | Jul | Aug | Sep | Oct | Nov | Dec |
| 2008 | Jan | Feb | Mar | Apr | May | Jun | Jul | Aug | Sep | Oct | Nov | Dec |
| 2009 | Jan | Feb | Mar | Apr | May | Jun | Jul | Aug | Sep | Oct | Nov | Dec |
| 2010 | Jan | Feb | Mar | Apr | May | Jun | Jul | Aug | Sep | Oct | Nov | Dec |
| 2011 | Jan | Feb | Mar | Apr | May | Jun | Jul | Aug | Sep | Oct | Nov | Dec |
| 2012 | Jan | Feb | Mar | Apr | May | Jun | Jul | Aug | Sep | Oct | Nov | Dec |
| 2013 | Jan | Feb | Mar | Apr | May | |||||||