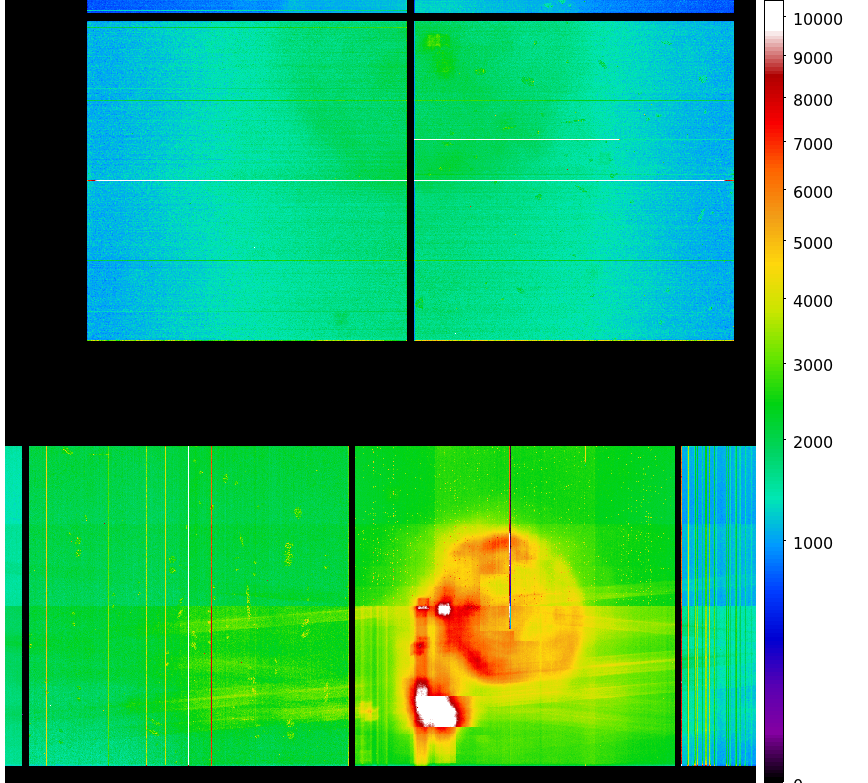
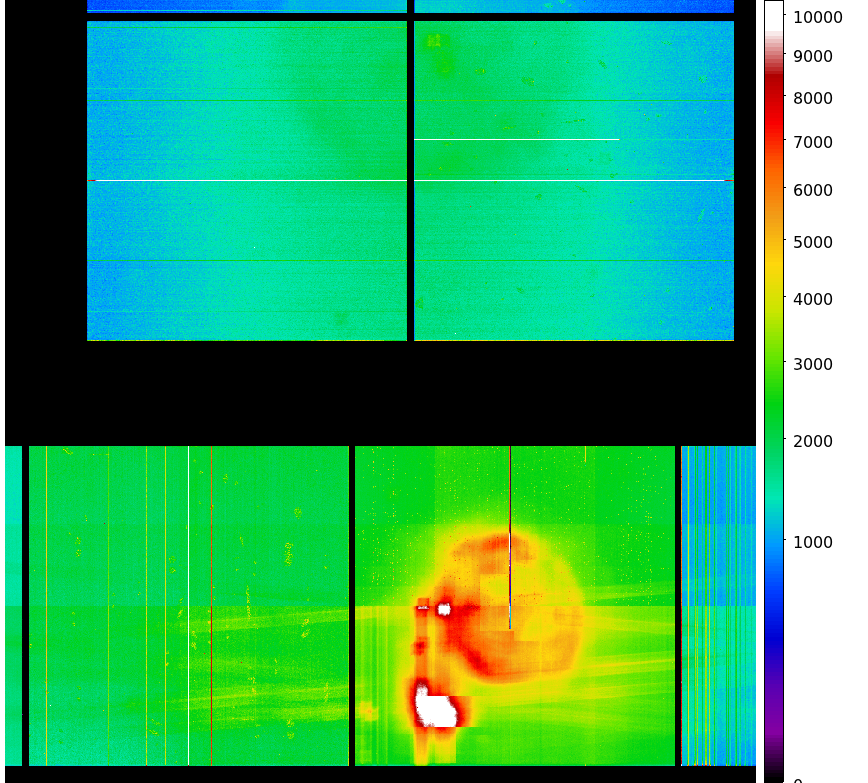
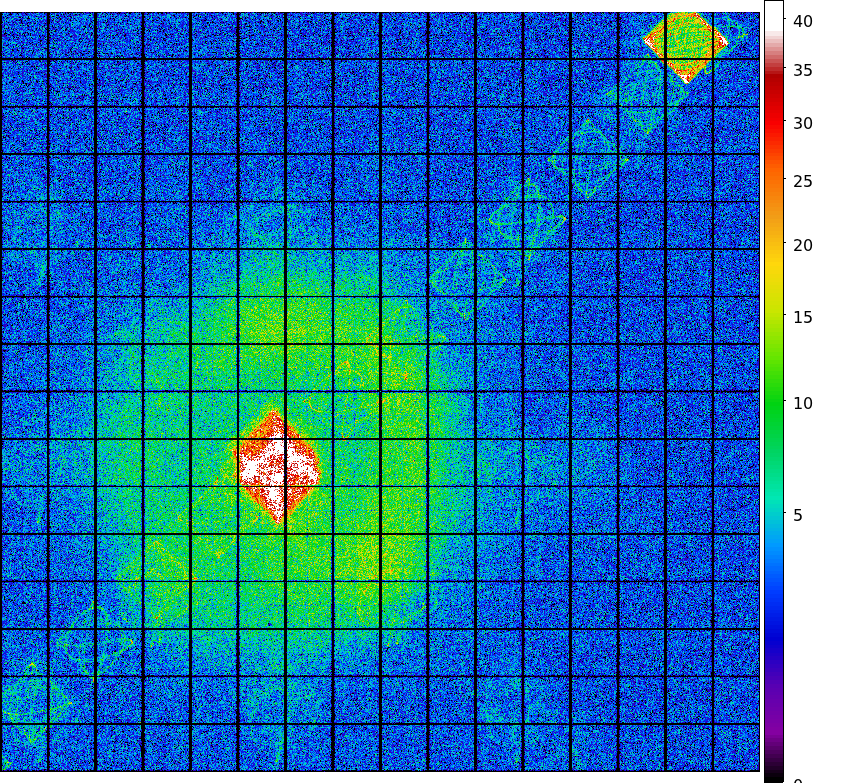
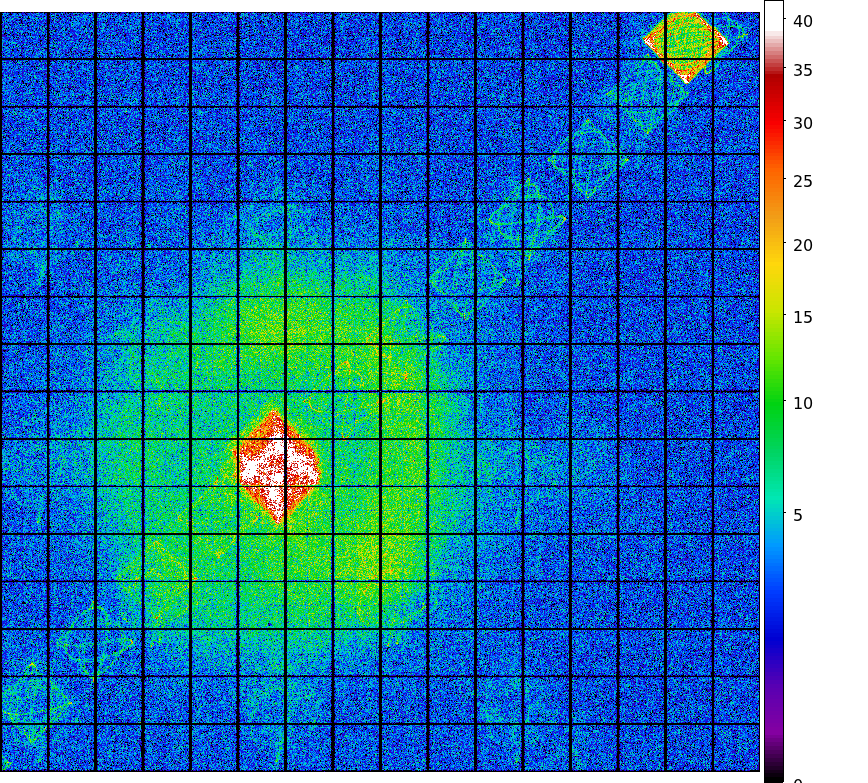
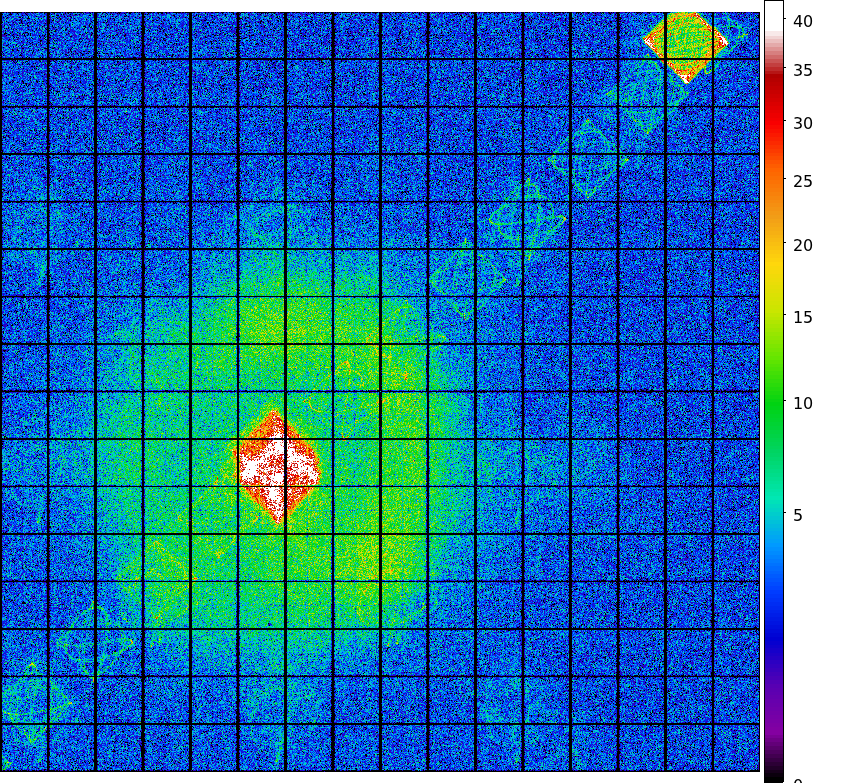
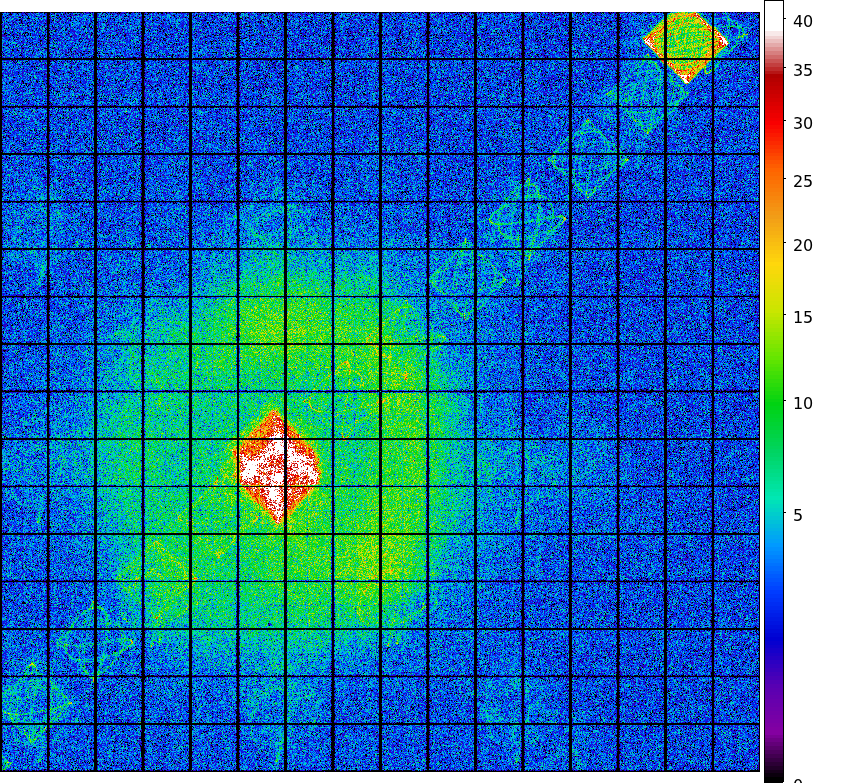
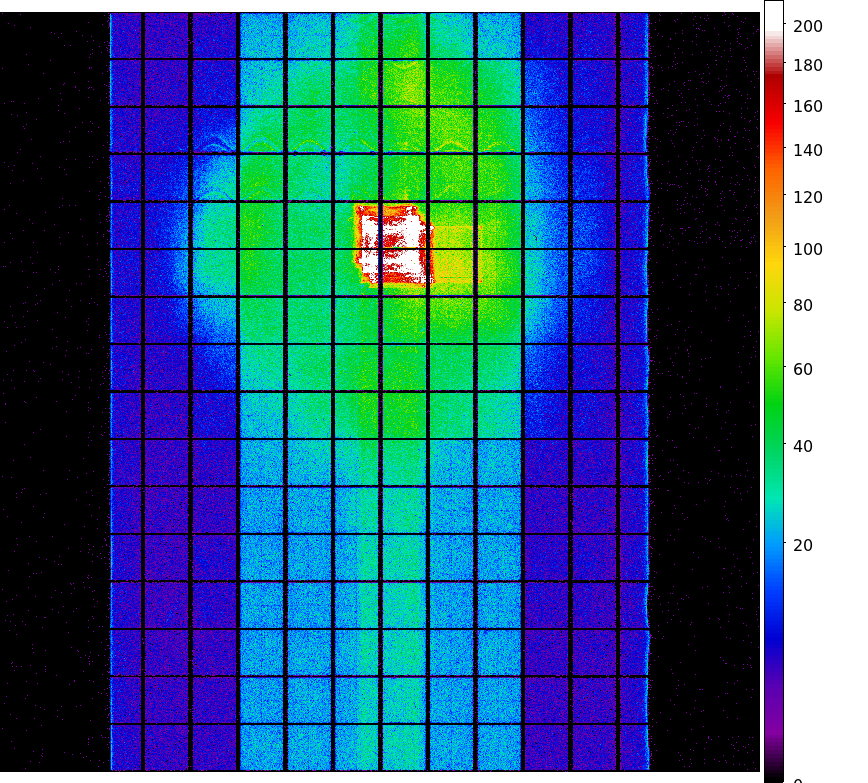
Sep Dose Map
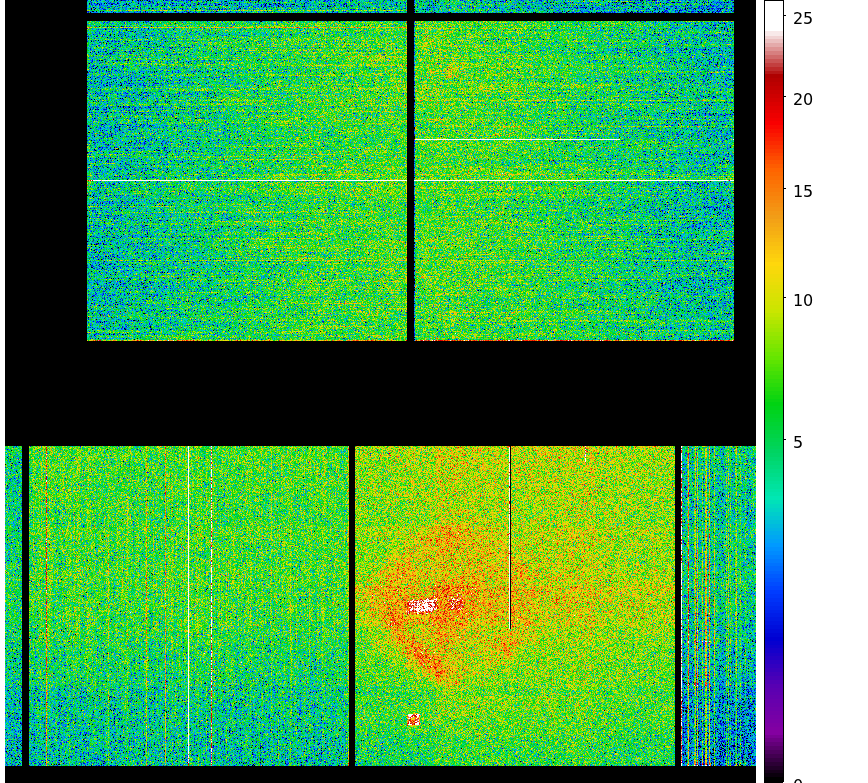
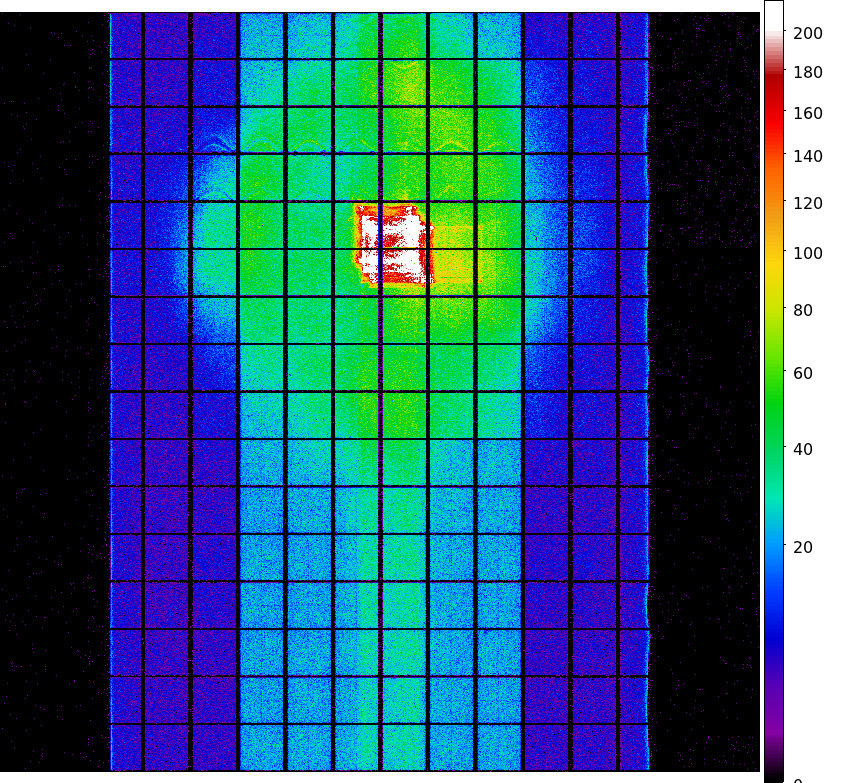
TOTAL
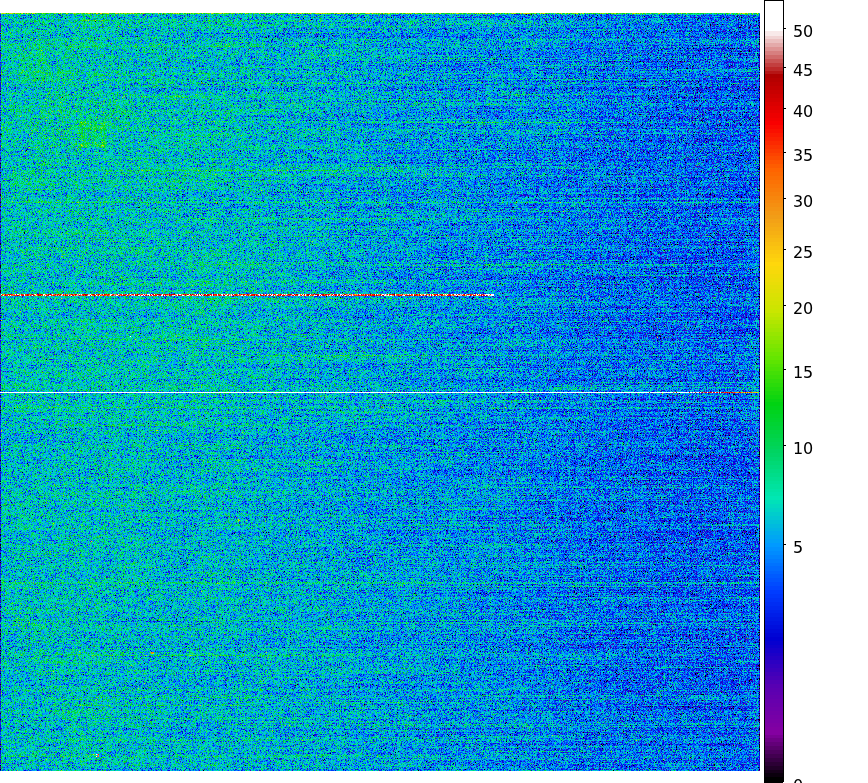
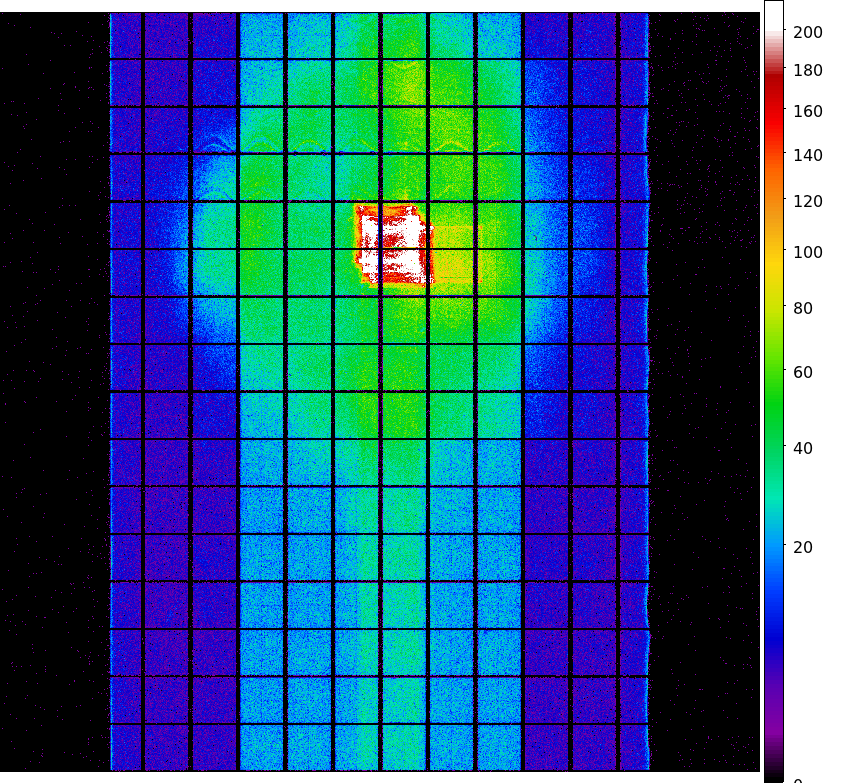
CCD I3
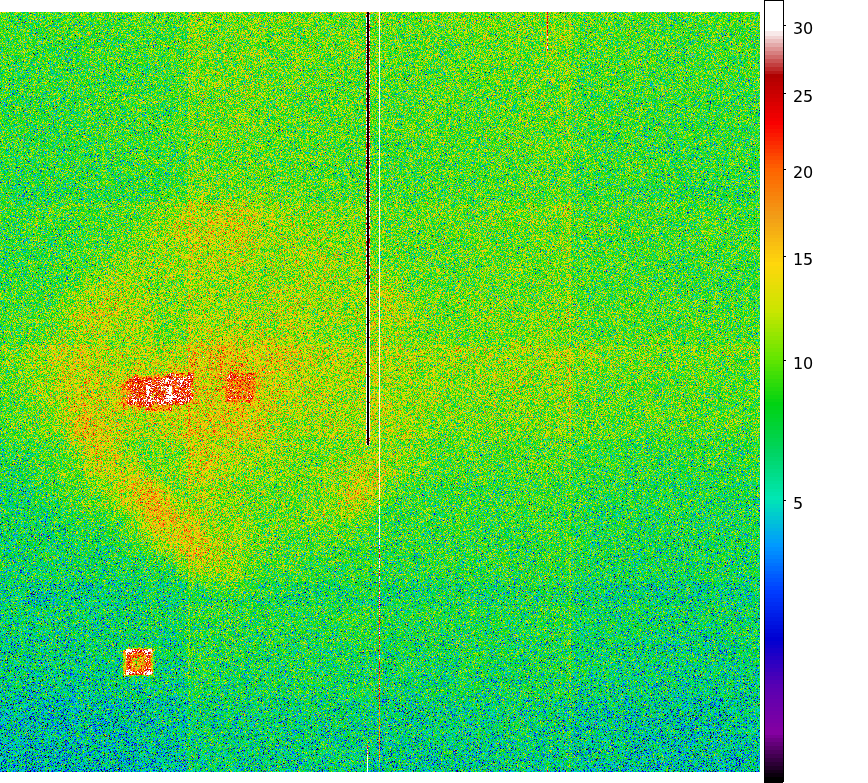
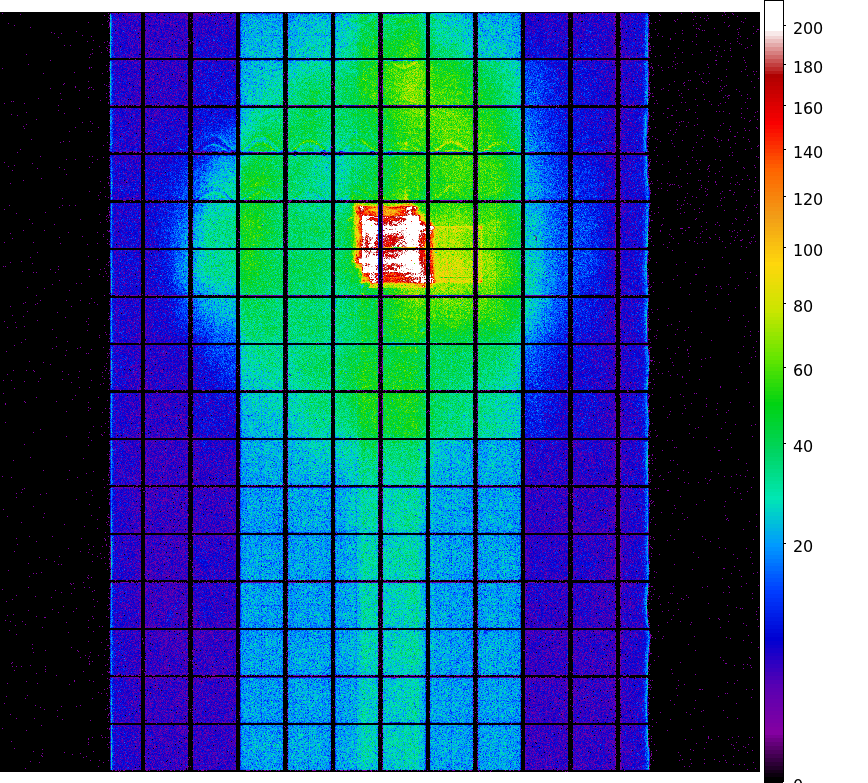
CCD S3
The steps we took to compute the dose map are;
Please check more detail plots at Telemetered Photon Dose Trend page.
Statistics:
# IMAGE     NPIX        MEAN           RMS              MIN     MAX
ACIS_sep13 6004901      5.066          7.051            0.0     935


I2 node 0  262654   5.417881    2.729164    0.0  35.0
I2 node 1  262654   5.645822    2.980630    0.0 243.0
I2 node 2  262654   5.509964    2.714113    0.0  42.0
I2 node 3  262654   5.534005    2.879677    0.0  50.0

I3 node 0  262654   5.862843    2.899806    0.0  29.0
I3 node 1  262654   6.141220    5.622471    0.0 119.0
I3 node 2  262654   5.552936    2.699484    0.0  49.0
I3 node 3  262654   5.593246    2.731027    0.0  72.0

S2 node 0  262654   5.928722    2.821745    0.0  31.0
S2 node 1  262654   5.960516    3.115238    0.0  43.0
S2 node 2  262654   6.060271    2.972673    0.0  65.0
S2 node 3  262654   5.956101    2.838332    0.0 269.0

S3 node 0  262654   9.172802    4.346045    0.0  59.0
S3 node 1  262654   10.111566   4.262409    0.0 203.0
S3 node 2  262654   9.083705    3.360872    0.0  39.0
S3 node 3  262654   8.171001    3.120386    0.0  41.0
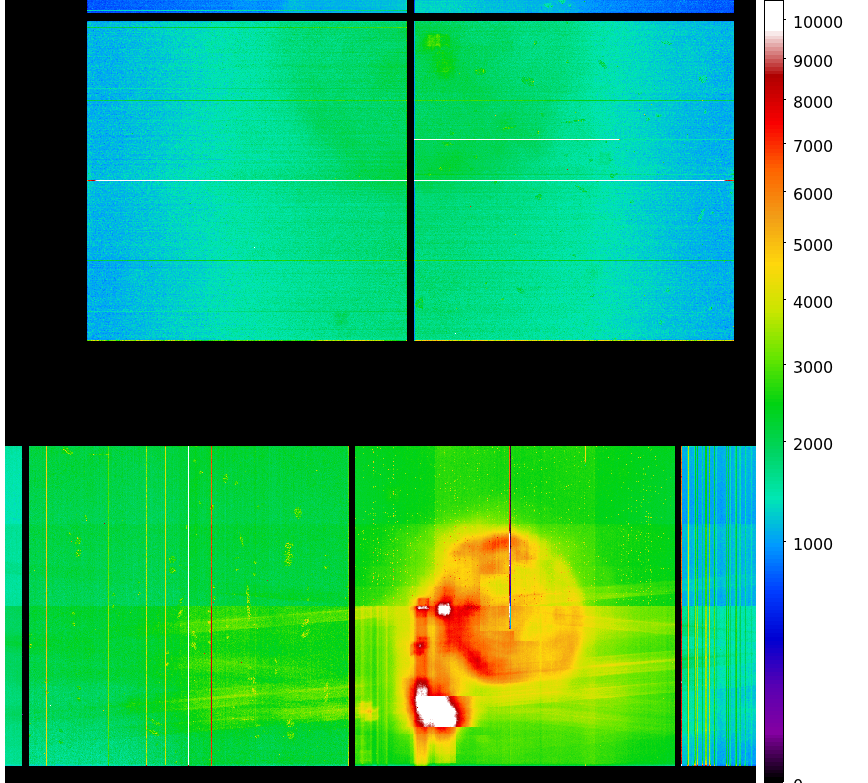
Statistics:
 IMAGE        NPIX      MEAN             RMS            MIN    MAX
ACIS_total   6004901   1739.385         2295.944        0.0   102118


I2 node 0  262654   1464.730305 289.049857     0.0   8922.0
I2 node 1  262654   1539.886010 387.973535     0.0  34851.0
I2 node 2  262654   1568.568863 336.343118     0.0   6694.0
I2 node 3  262654   1564.873217 396.677032     0.0   9372.0

I3 node 0  262654   1641.631406 401.535586     0.0   6474.0
I3 node 1  262654   1723.140415 1308.706719    0.0  33358.0
I3 node 2  262654   1503.602965 278.173245     0.0   7461.0
I3 node 3  262654   1489.454384 296.123414     0.0  25921.0

S2 node 0  262654   2092.484773 319.862663  1093.0  28645.0
S2 node 1  262654   2230.103408 490.449409  1143.0  12313.0
S2 node 2  262654   2467.179396 481.967711  1480.0  42168.0
S2 node 3  262654   2401.231529 365.066438  1422.0  39751.0

S3 node 0  262654   3638.955001 1722.004889 1507.0  12800.0
S3 node 1  262654   4743.385489 1923.191869    0.0  13072.0
S3 node 2  262654   3661.915127 924.401733  1472.0   9178.0
S3 node 3  262654   2865.754003 447.942623  1632.0   9354.0

|
|
|
|
| Jun 2013 | Mar 2013 | Dec 2012 | Sep 2012 |
|---|
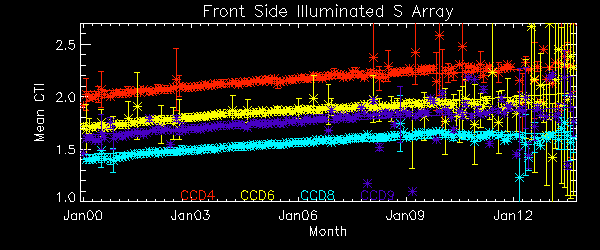
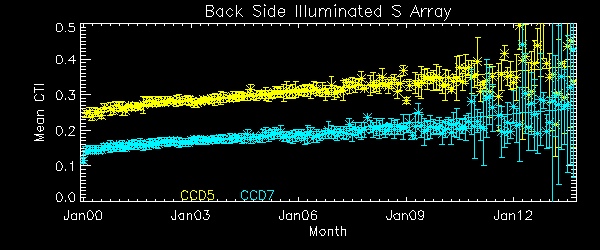
We report CTIs with a refined data definition. CTIs were computed for the temperature dependency corrected data. Please see CTI page for detailed explanation. CTI's are computed for Mn K alpha, and defined as slope/intercept x10^4 of row # vs ADU. Data file: here

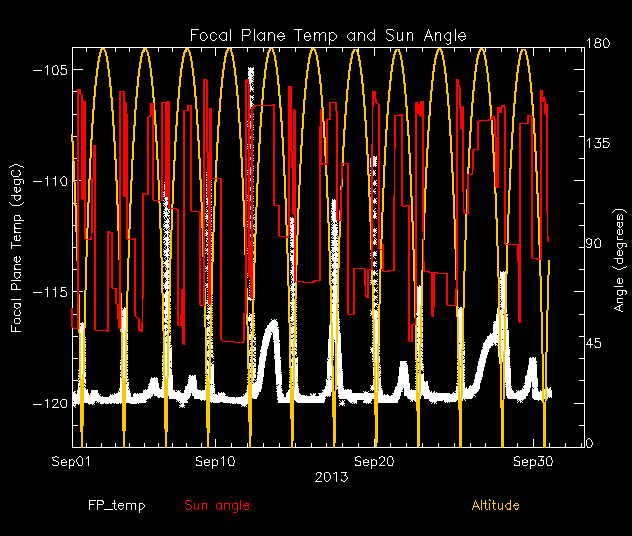
| The Mean (max) FPT: | |
|---|---|
| -114.58 | +/- 4.09 C |
| Mean Width: | |
| 0.43 | +/- 0.48 days |
We are using 10 period moving averages to show trends of peak temperatures and peak widths. Note, the gaps in the width plot are due to missing/corrupted data.

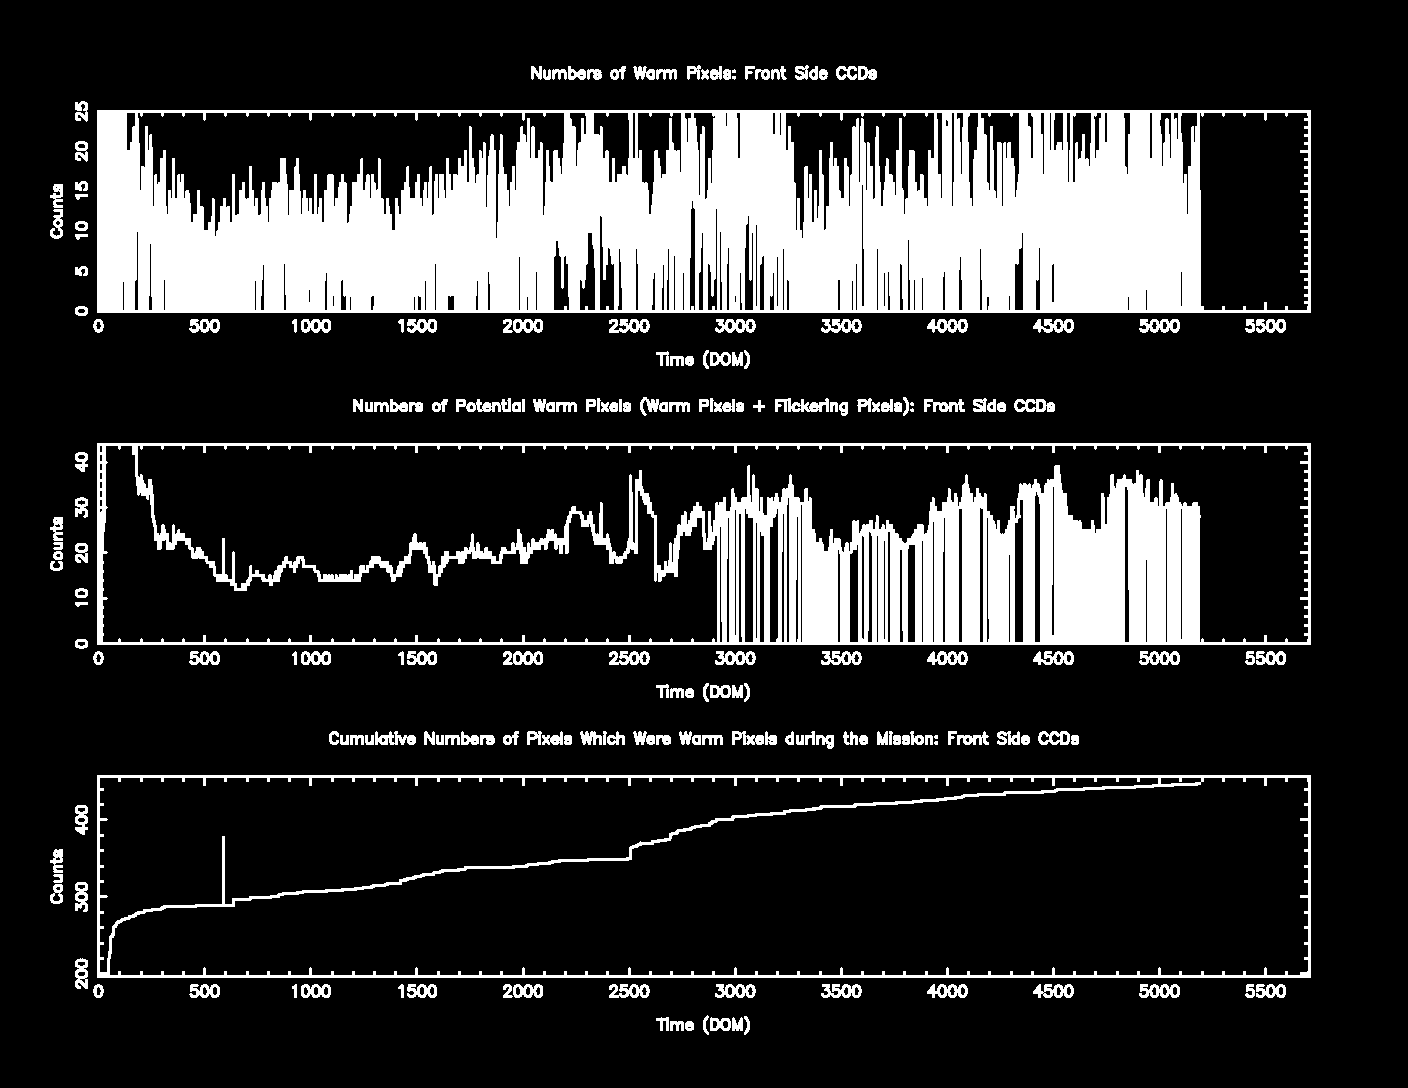
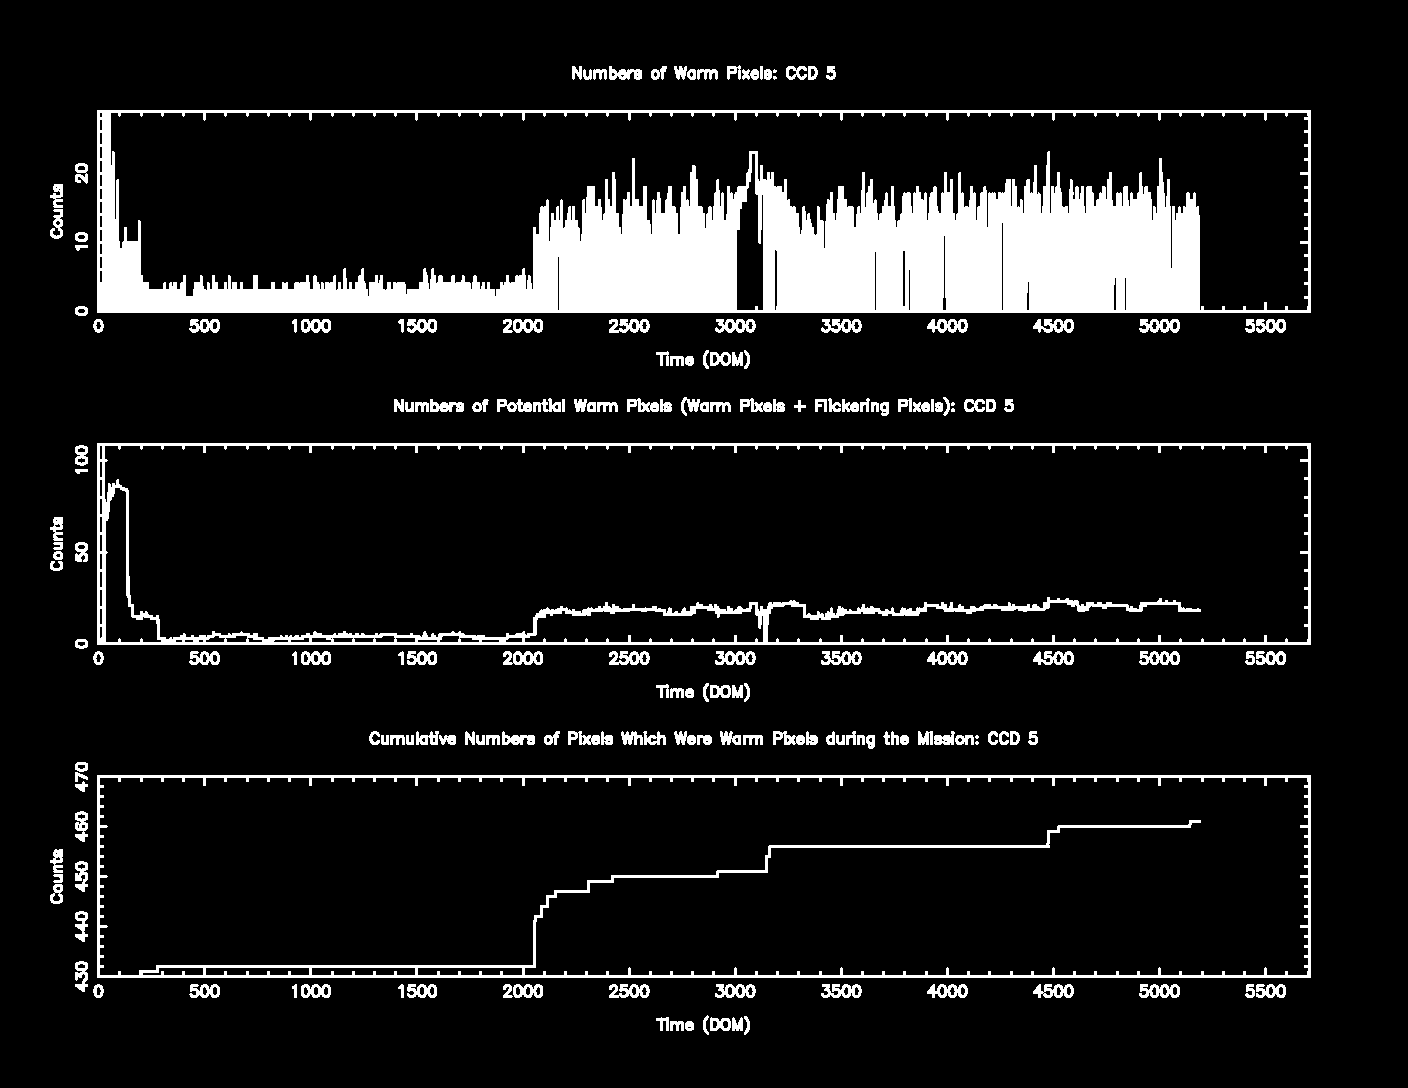
The plots below were generated with a new warm pixel finding script. Please see Acis Bad Pixel Page for details.
| Name | Low (keV) | High(KeV) | Description |
|---|---|---|---|
| SSoft | 0.00 | 0.50 | Super soft photons |
| Soft | 0.50 | 1.00 | Soft photons |
| Med | 1.00 | 3.00 | Moderate energy photons |
| Hard | 3.00 | 5.00 | Hard Photons |
| Harder | 5.00 | 10.00 | Very Hard photons |
| Hardest | 10.00 | Beyond 10 keV |
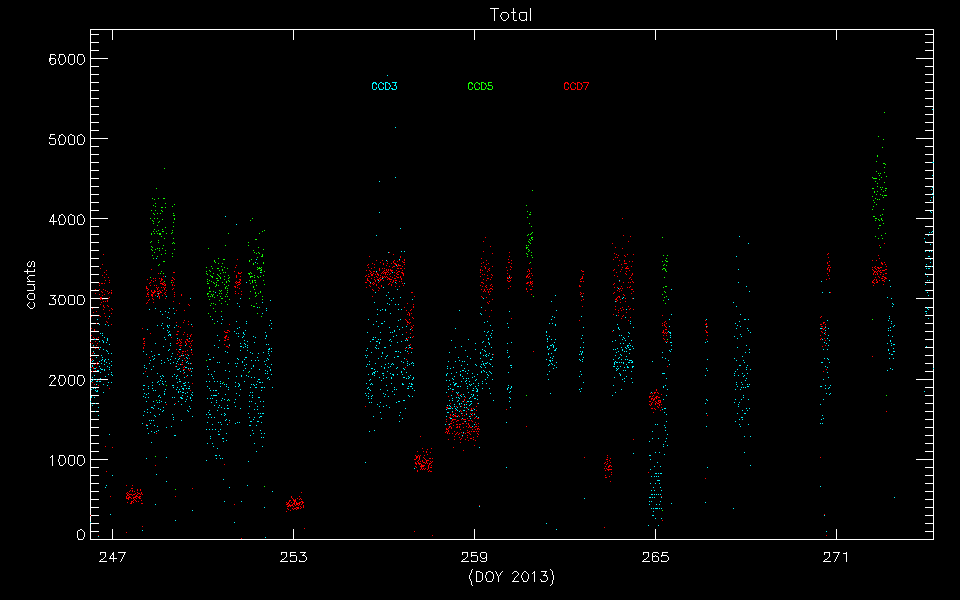
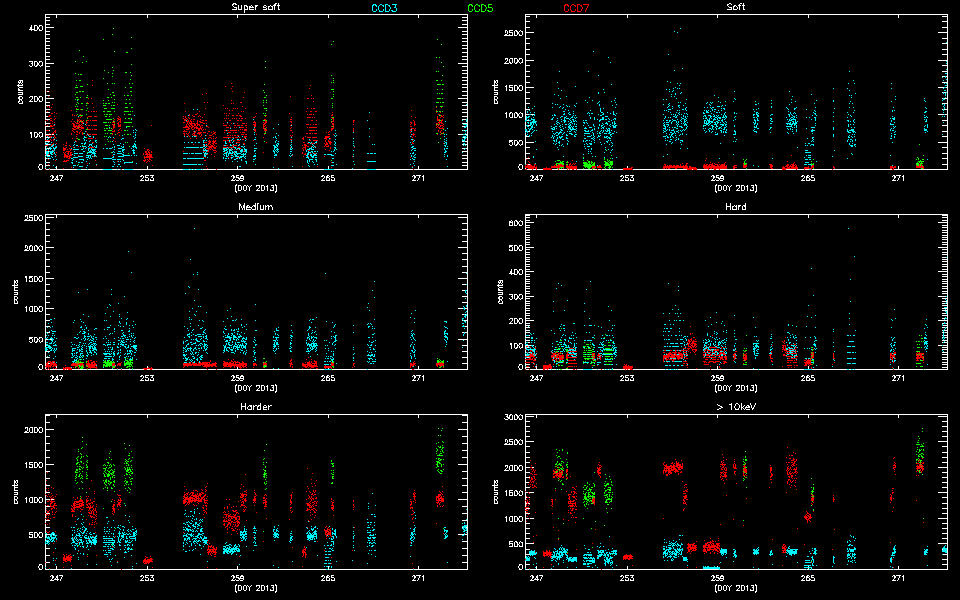
Please refer to Maximum Dose Trends for more details.
        IMAGE                NPIX      MEAN    STDDEV      MIN       MAX
HRCI_09_2013.fits          16777216   0.026    0.1680      0.0       13.0
        IMAGE                NPIX      MEAN    STDDEV      MIN       MAX
HRCI_08_1999_09_2013.fits  16777216   4.026    4.799       0.0       292.0
         IMAGE                NPIX      MEAN    STDDEV      MIN       MAX
HRCS_09_2013.fits          16777216   0.097    0.3370      0.0        13.0
        IMAGE                NPIX     MEAN      STDDEV      MIN      MAX
HRCS_08_1999_09_2013.fits  16777216  14.857      24.833      0.0      1655.0

|
|
Max dose trend plots corrected for events that "pile-up"
in the center of the taps due to bad position information.
|
|
|
|
|
| Jun 2013 | Mar 2013 | Dec 2012 | Sep 2012 |
|---|
|
|
|
|
| Jun 2013 | Mar 2013 | Dec 2012 | Sep 2012 |
|---|
We plot the width of the zero order streak of ACIS/HETG observations and the width of the zero order image for HRC/LETG observations of point sources. No significant defocusing trend is seen at this time. See Gratings Focus pages.

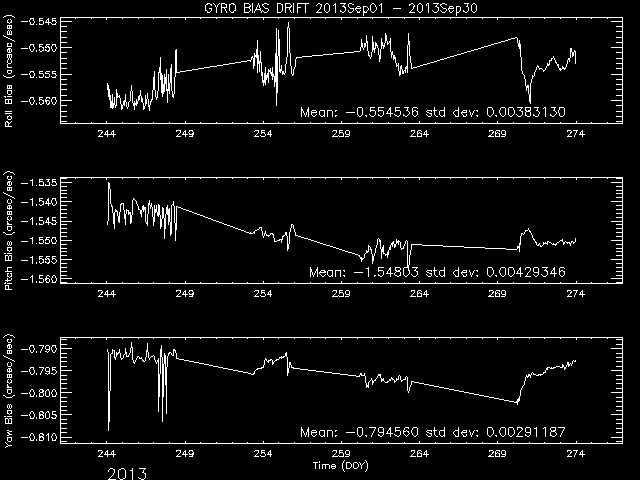
Plotted below are radiation zone timing plots based on the following definitions of radiation zone:
| ACIS Temperatures - Daily Maximums | ||||||
|---|---|---|---|---|---|---|
| MSID | MEAN | RMS | DELTA/YR | DELTA/YR/YR | UNITS | DESCRIPTION |
| 1PDEAAT | 305.05 | 9.15 | -4.397e-01 | 2.434e+00 | K | PSMC DEA PS A TEMP |
| 1PIN1AT | 291.78 | 8.19 | -2.326e-01 | 2.007e+00 | K | PSMC TEMP 1A |
| HRMA Computed Averages - Daily Maximums | ||||||
|---|---|---|---|---|---|---|
| MSID | MEAN | RMS | DELTA/YR | DELTA/YR/YR | UNITS | DESCRIPTION |
| OBAAVG | 285.48 | 1.83 | 4.199e-01 | 1.259e-01 | K | OBA/TFTE TEMP |
| EPHIN Temperatures - Daily Maximums | ||||||
|---|---|---|---|---|---|---|
| MSID | MEAN | RMS | DELTA/YR | DELTA/YR/YR | UNITS | DESCRIPTION |
| TEIO | 324.68 | 21.13 | 1.114e+01 | -1.146e+01 | K | EPHIN ELECTRONICS HOUSING TEMP |
| TEPHIN | 324.16 | 7.01 | 5.246e+00 | -2.685e+00 | K | EPHIN SENSOR HOUSING TEMP |
| S/C Main Temperatures - Daily Maximums | ||||||
|---|---|---|---|---|---|---|
| MSID | MEAN | RMS | DELTA/YR | DELTA/YR/YR | UNITS | DESCRIPTION |
| TCYLFMZM | 304.49 | 26.57 | 2.198e+00 | -2.615e-01 | K | CNT CYL TEMP:-Z SIDE UNDER LAE-1 |
| TCYLFMZP | 306.63 | 25.32 | 2.104e+00 | -2.280e-01 | K | CNT CYL TEMP:-Z SIDE UNDER LAE-2 |
| S/C Ancillary Temperatures - Daily Maximums | ||||||
|---|---|---|---|---|---|---|
| MSID | MEAN | RMS | DELTA/YR | DELTA/YR/YR | UNITS | DESCRIPTION |
| TFSSBKT1 | 336.42 | 19.95 | 5.355e+00 | 2.628e+00 | K | FSS BRACKET-1 TEMP (+Y) |
| TFSSBKT2 | 330.53 | 27.35 | 7.614e+00 | -4.305e+00 | K | FSS BRACKET-2 TEMP (+Y) |
| TSCTSF1 | 296.17 | 4.11 | 1.855e+00 | 1.333e+00 | K | SC-TS FITTING -1 TEMP |
| TSCTSF6 | 297.27 | 4.65 | 2.280e+00 | 1.186e+00 | K | SC-TS FITTING -6 TEMP |
| MUPS - Daily Maximums | ||||||
|---|---|---|---|---|---|---|
| MSID | MEAN | RMS | DELTA/YR | DELTA/YR/YR | UNITS | DESCRIPTION |
| PM1THV1T | 333.47 | 8.23 | -2.762e-01 | -1.892e+02 | K | MUPS 1 THRUSTER VALVE 01 TEMP |
| PLINE02T | 317.64 | 11.13 | 3.347e+00 | 5.826e+00 | K | PROP LINE TEMP 02 |
| PLINE03T | 316.64 | 13.64 | 3.278e+00 | 7.846e+00 | K | PROP LINE TEMP 03 |
| PLINE04T | 302.24 | 12.73 | 3.233e+00 | 7.055e+00 | K | PROP LINE TEMP 04 |
| Previous Quarter | ||||||
| MSID | MEAN | RMS | DELTA/YR | DELTA/YR/YR | UNITS | DESCRIPTION |
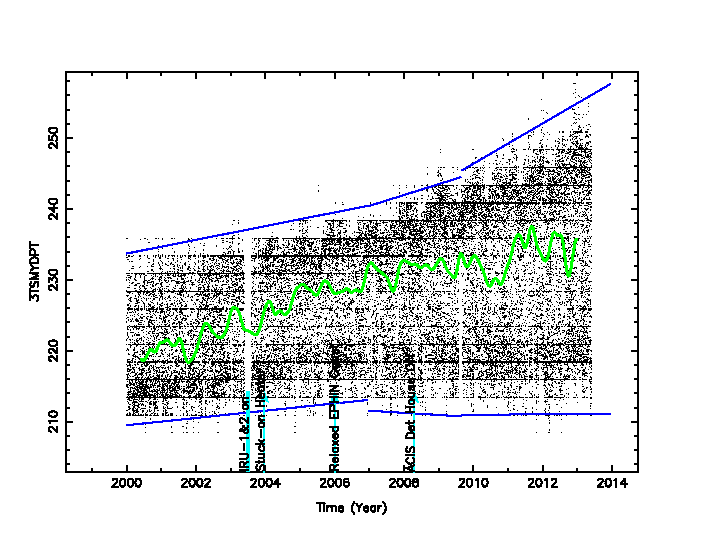
| 3TSMXSPT | 261.19 | 28.93 | 2.140e+01 | -6.202e-12 | K | -X TURTLE SHELL NR ACIS SS |
| BOXTEMP | 282.60 | 1.38 | -3.217e+00 | 4.890e-13 | K | SEA box temperature (3FASEAAT) |
| FAMTRTEMP | 272.54 | 2.69 | -4.895e+00 | 5.839e-13 | K | FA motor temperature |
| FLEXATEMP | 270.71 | 2.75 | -4.193e+00 | 7.765e-13 | K | Flexure A temperature (3FAFLAAT) |
| PSUTEMP | 311.93 | 1.15 | -3.571e+00 | 2.275e-13 | K | SEA power supply temperature (3FAPSAT) |
| TSCMTRTEMP | 281.86 | 20.72 | -3.238e+01 | 3.296e-12 | K | TSC motor temperature |
| Previous Quarter | ||||||
| MSID | MEAN | RMS | DELTA/YR | DELTA/YR/YR | UNITS | DESCRIPTION |
| AGRNDADC | 2.758e-04 | 1.971e-04 | 1.885e-04 | -1.071e-02 | V | Analog ground A/D convert reading |
| FATABADC | 5.00 | 2.496e-03 | 5.587e-03 | -2.608e-01 | Converter | FA Tab Position Sensor A/D |
| N15VADC | -15.01 | 5.769e-04 | 2.903e-04 | -3.335e-02 | Reading | -15V Power Supply A/D Converter |
| P15VADC | 14.96 | 5.050e-04 | 4.857e-04 | -6.237e-02 | Reading | +15V Power Supply A/D Converter |
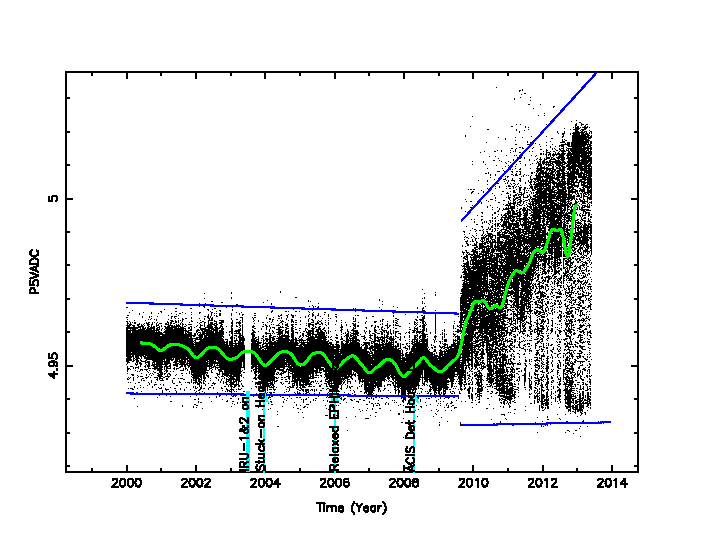
| P5VADC | 4.99 | 2.510e-02 | 6.808e-02 | -3.112e+00 | Reading | +5V Power Supply A/D Converter |
| TSCTABADC | 5.00 | 4.541e-03 | 1.192e-02 | -5.554e-01 | converter | TSC Tab Position Sensor A/D |
| Previous Quarter | ||||||
| MSID | MEAN | RMS | DELTA/YR | DELTA/YR/YR | UNITS | DESCRIPTION |
| EOECNV1C | 0.38 | 0.97 | -1.217e-01 | -5.468e+00 | (ECNV1V) | PCU CONVERTER 1: +15V OUTPUT - ANALOG |
| EOECNV2C | 0.37 | 0.97 | -1.220e-01 | -5.426e+00 | (ECNV2V) | PCU CONVERTER 2: +15V OUTPUT - ANALOG |
| EOECNV3C | 0.39 | 1.00 | -1.252e-01 | -5.601e+00 | (ECNV3V) | PCU CONVERTER 3: +15V OUTPUT - ANALOG |
| EOESAC1C | 0.31 | 0.80 | -1.161e-01 | -4.439e+00 | (ESAMYI) | -Y SOLAR ARRAY CURRENT - COUNTS |
| EOESAC2C | 0.31 | 0.81 | -1.199e-01 | -4.604e+00 | (ESAPYI) | +Y SOLAR ARRAY CURRENT - COUNTS |
|
|

Note: From Feb 2010, the computation of reaction wheel rotations are slightly modified.
| Year | Month | |||||||||||
|---|---|---|---|---|---|---|---|---|---|---|---|---|
| 1999 | Jul | Aug | Sep | Oct | Nov | Dec | ||||||
| 2000 | Jan | Feb | Mar | Apr | May | Jun | Jul | Aug | Sep | Oct | Nov | Dec |
| 2001 | Jan | Feb | Mar | Apr | May | Jun | Jul | Aug | Sep | Oct | Nov | Dec |
| 2002 | Jan | Feb | Mar | Apr | May | Jun | Jul | Aug | Sep | Oct | Nov | Dec |
| 2003 | Jan | Feb | Mar | Apr | May | Jun | Jul | Aug | Sep | Oct | Nov | Dec |
| 2004 | Jan | Feb | Mar | Apr | May | Jun | Jul | Aug | Sep | Oct | Nov | Dec |
| 2005 | Jan | Feb | Mar | Apr | May | Jun | Jul | Aug | Sep | Oct | Nov | Dec |
| 2006 | Jan | Feb | Mar | Apr | May | Jun | Jul | Aug | Sep | Oct | Nov | Dec |
| 2007 | Jan | Feb | Mar | Apr | May | Jun | Jul | Aug | Sep | Oct | Nov | Dec |
| 2008 | Jan | Feb | Mar | Apr | May | Jun | Jul | Aug | Sep | Oct | Nov | Dec |
| 2009 | Jan | Feb | Mar | Apr | May | Jun | Jul | Aug | Sep | Oct | Nov | Dec |
| 2010 | Jan | Feb | Mar | Apr | May | Jun | Jul | Aug | Sep | Oct | Nov | Dec |
| 2011 | Jan | Feb | Mar | Apr | May | Jun | Jul | Aug | Sep | Oct | Nov | Dec |
| 2012 | Jan | Feb | Mar | Apr | May | Jun | Jul | Aug | Sep | Oct | Nov | Dec |
| 2013 | Jan | Feb | Mar | Apr | May | Jun | Jul | Aug | ||||