
Science observations were manually interrupted on Oct 1, 10:04PM EDT.
(see details:
Radiation Count Rate Plots for Periods Which Interrupted Science Runs).

The steps we took to compute the dose map are;
Please check more detail plots at Telemetered Photon Dose Trend page.
Statistics:
# IMAGE     NPIX        MEAN           RMS              MIN     MAX
ACIS_oct13 6004901      6.195         15.098            0.0     3019


I2 node 0  262654   5.221161    2.779951    0.0  48.0
I2 node 1  262654   5.440302    4.418455    0.0 756.0
I2 node 2  262654   5.164371    3.080317    0.0 725.0
I2 node 3  262654   5.316127    7.314813    0.0 761.0

I3 node 0  262654   5.096943    2.669052    0.0  38.0
I3 node 1  262654   5.369282    9.512252    0.0 2365.0
I3 node 2  262654   4.830501    2.506447    0.0  51.0
I3 node 3  262654   5.164726    8.584370    0.0 1816.0

S2 node 0  262654   6.698790    4.572837    0.0 1694.0
S2 node 1  262654   6.838838    3.438362    0.0  51.0
S2 node 2  262654   7.083724    6.986952    0.0 3019.0
S2 node 3  262654   6.778533    3.186007    0.0 396.0

S3 node 0  262654   29.657564   56.451908   0.0 395.0
S3 node 1  262654   11.802218   9.879224    0.0 168.0
S3 node 2  262654   9.562167    4.561976    0.0 1497.0
S3 node 3  262654   8.611543    3.291536    0.0  46.0
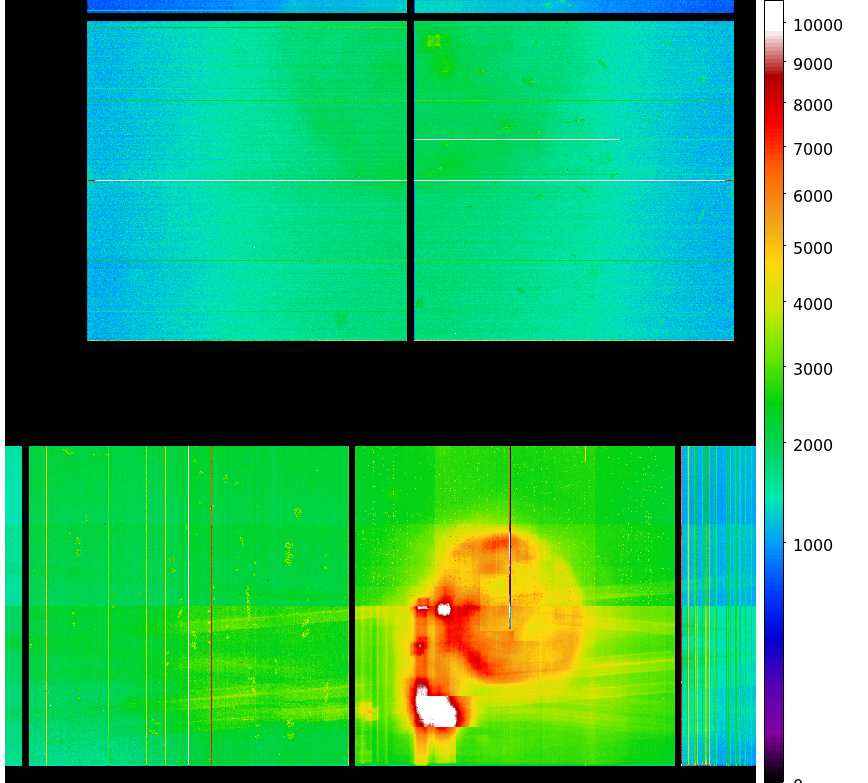
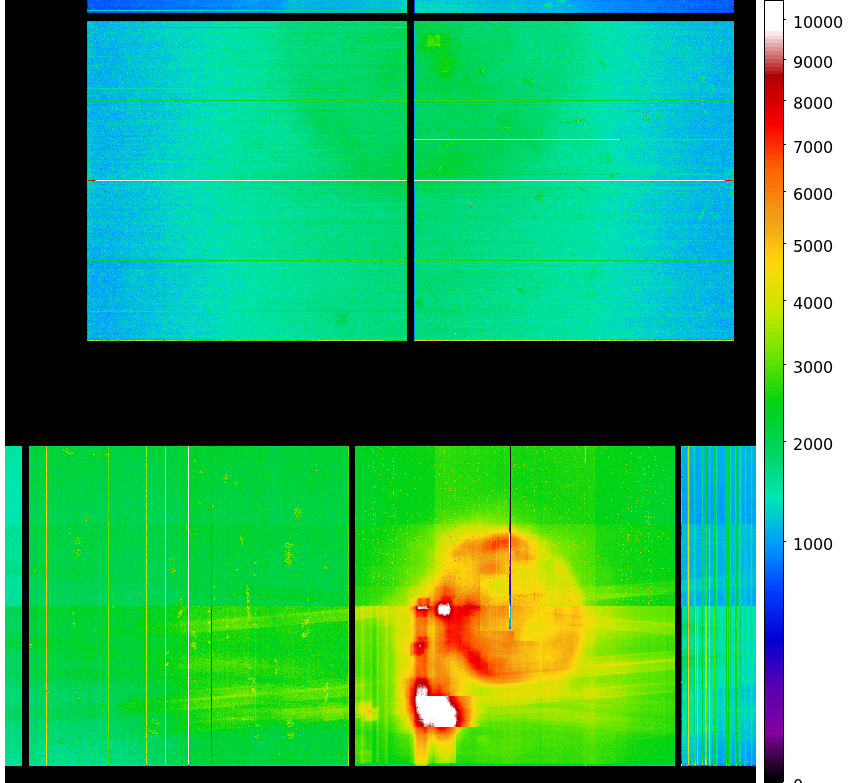
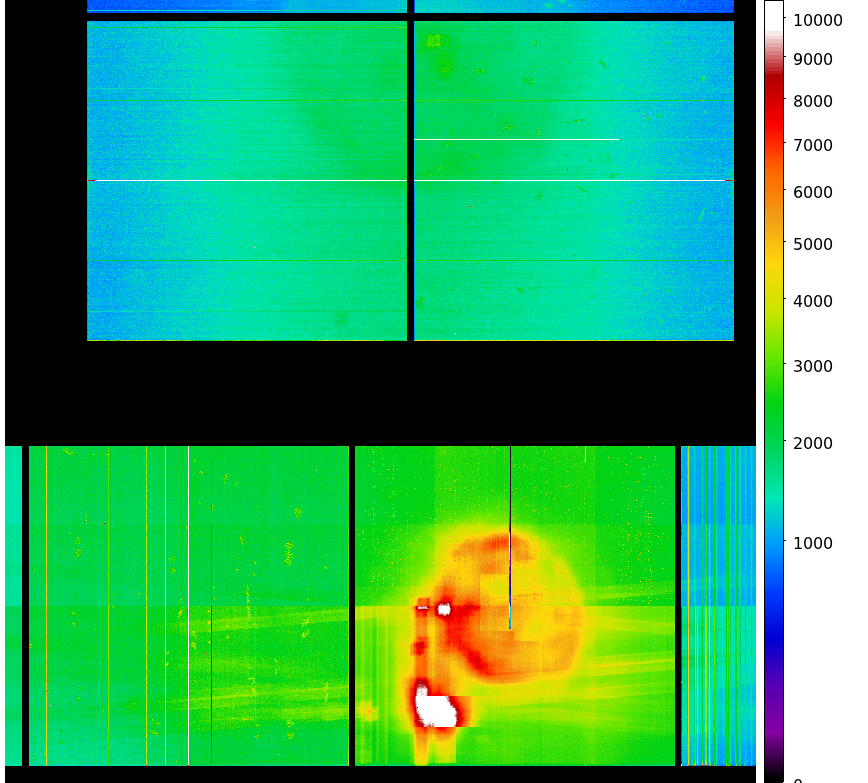
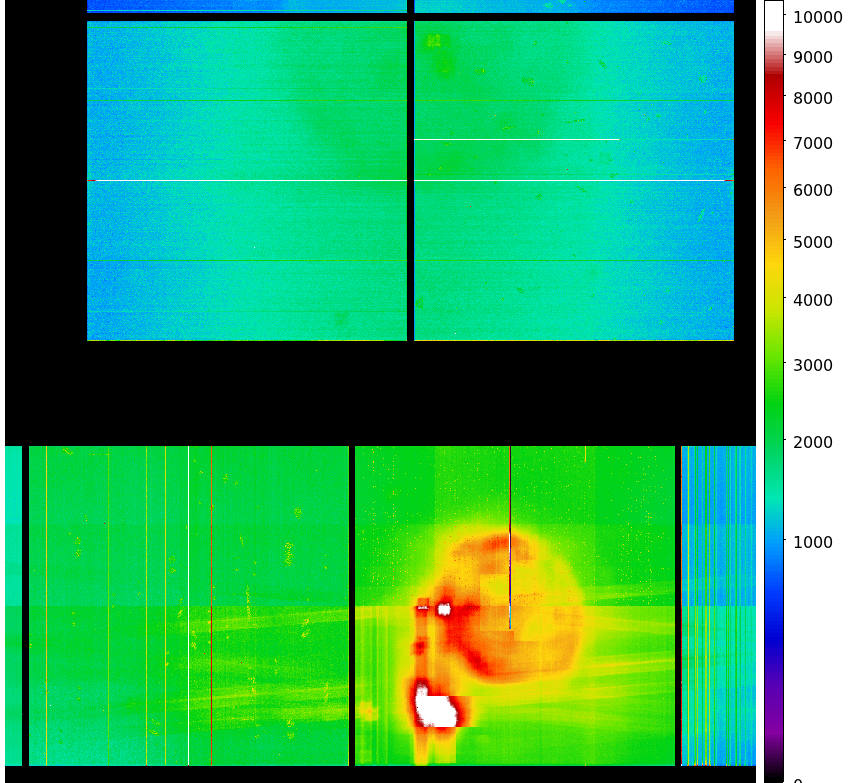
Statistics:
 IMAGE        NPIX      MEAN             RMS            MIN    MAX
ACIS_total   6004901    1745.581         2303.503       0.0   102455


I2 node 0  262654   1469.951466 290.359582     0.0  8931.0
I2 node 1  262654   1545.326311 390.514188     0.0 35140.0
I2 node 2  262654   1573.733234 337.441686     0.0  6712.0
I2 node 3  262654   1570.189345 398.377258     0.0  9376.0

I3 node 0  262654   1646.728349 402.668202     0.0  6487.0
I3 node 1  262654   1728.509697 1312.894756    0.0 33447.0
I3 node 2  262654   1508.433466 279.157190     0.0  7508.0
I3 node 3  262654   1494.619110 297.245978     0.0 25985.0

S2 node 0  262654   2099.183563 321.151655  1096.0 28647.0
S2 node 1  262654   2236.942246 492.136249  1149.0 12352.0
S2 node 2  262654   2474.263120 483.330768  1482.0 42194.0
S2 node 3  262654   2408.010062 365.221485  1425.0 40008.0

S3 node 0  262654   3668.612565 1738.818884 1508.0 12805.0
S3 node 1  262654   4755.187706 1925.603778    0.0 13080.0
S3 node 2  262654   3671.477294 924.795254  1479.0  9207.0
S3 node 3  262654   2874.365546 447.921744  1641.0  9374.0
|
|
|
|
| Jul 2013 | Apr 2013 | Jan 2013 | Oct 2012 |
|---|
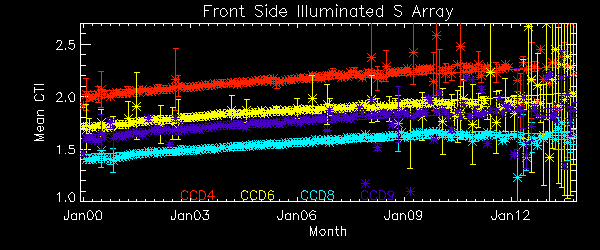
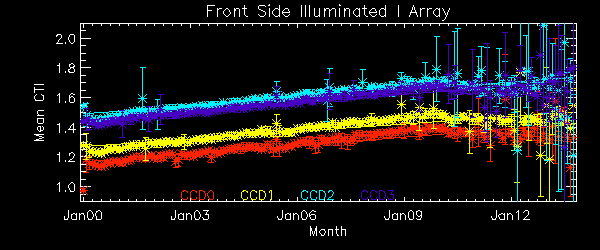
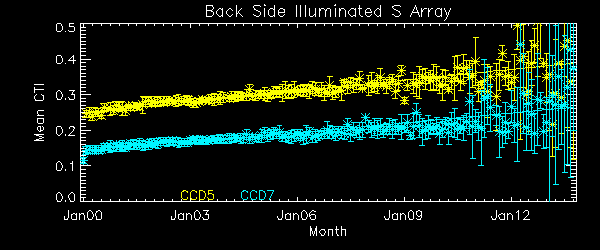
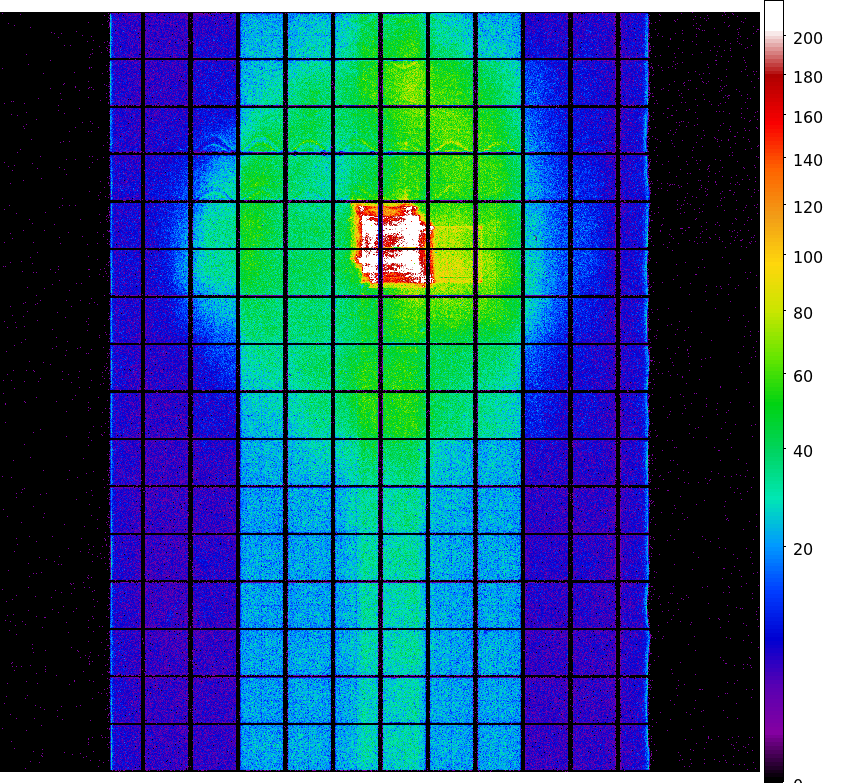
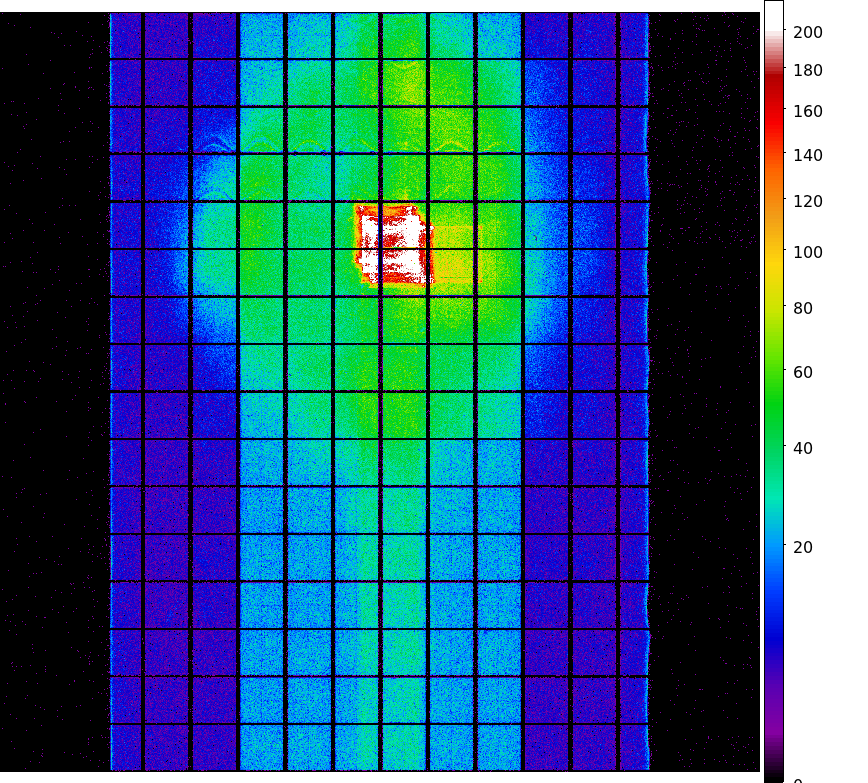
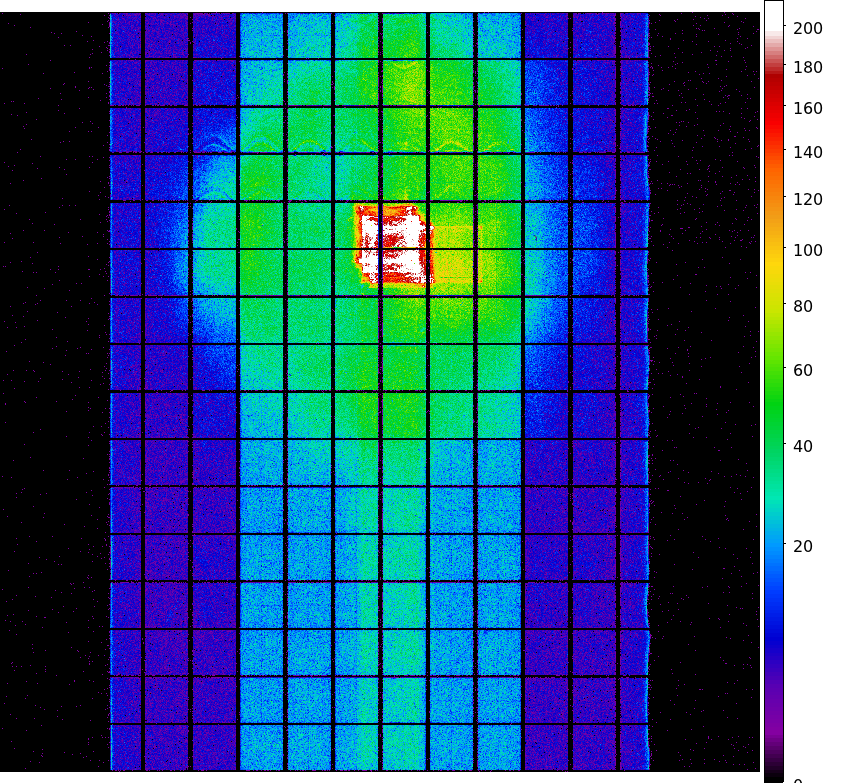
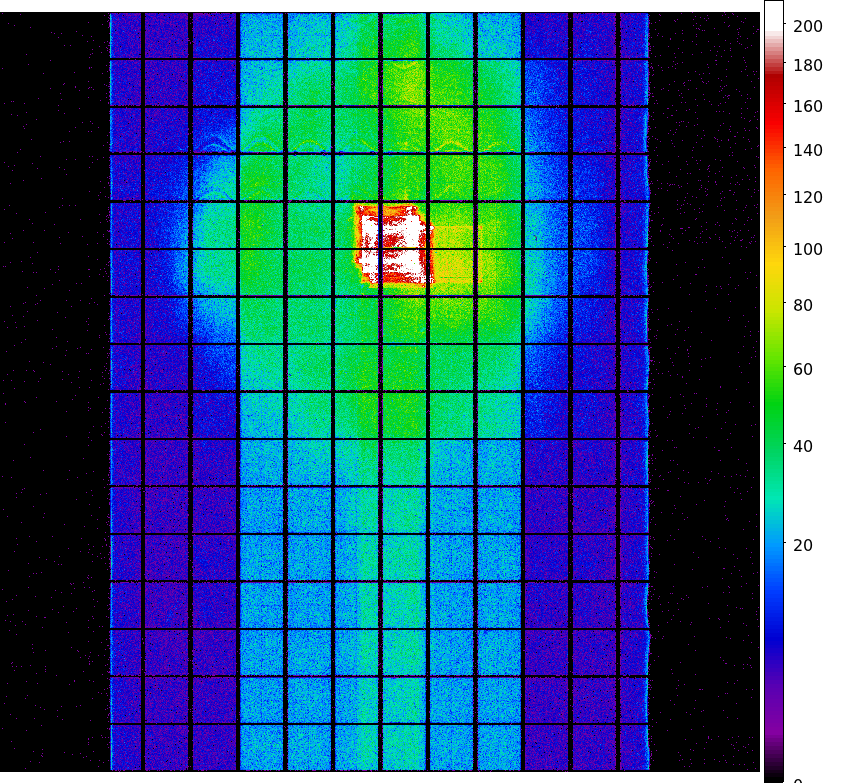
We report CTIs with a refined data definition. CTIs were computed for the temperature dependency corrected data. Please see CTI page for detailed explanation. CTI's are computed for Mn K alpha, and defined as slope/intercept x10^4 of row # vs ADU. Data file: here
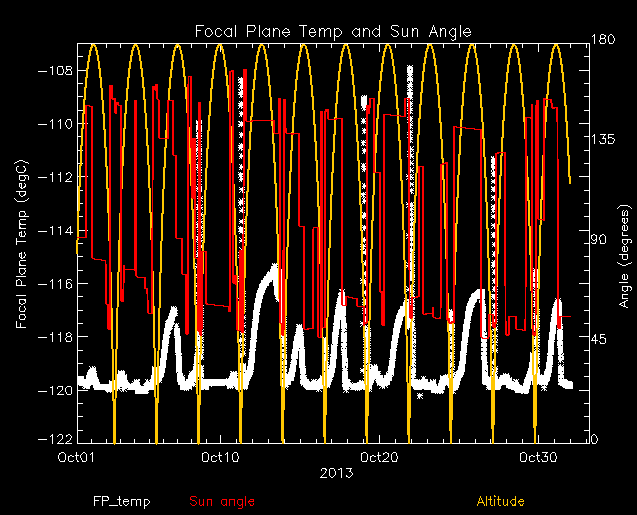
| The Mean (max) FPT: | |
|---|---|
| -114.83 | +/- 3.74 C |
| Mean Width: | |
| 0.58 | +/- 0.60 days |
We are using 10 period moving averages to show trends of peak temperatures and peak widths. Note, the gaps in the width plot are due to missing/corrupted data.

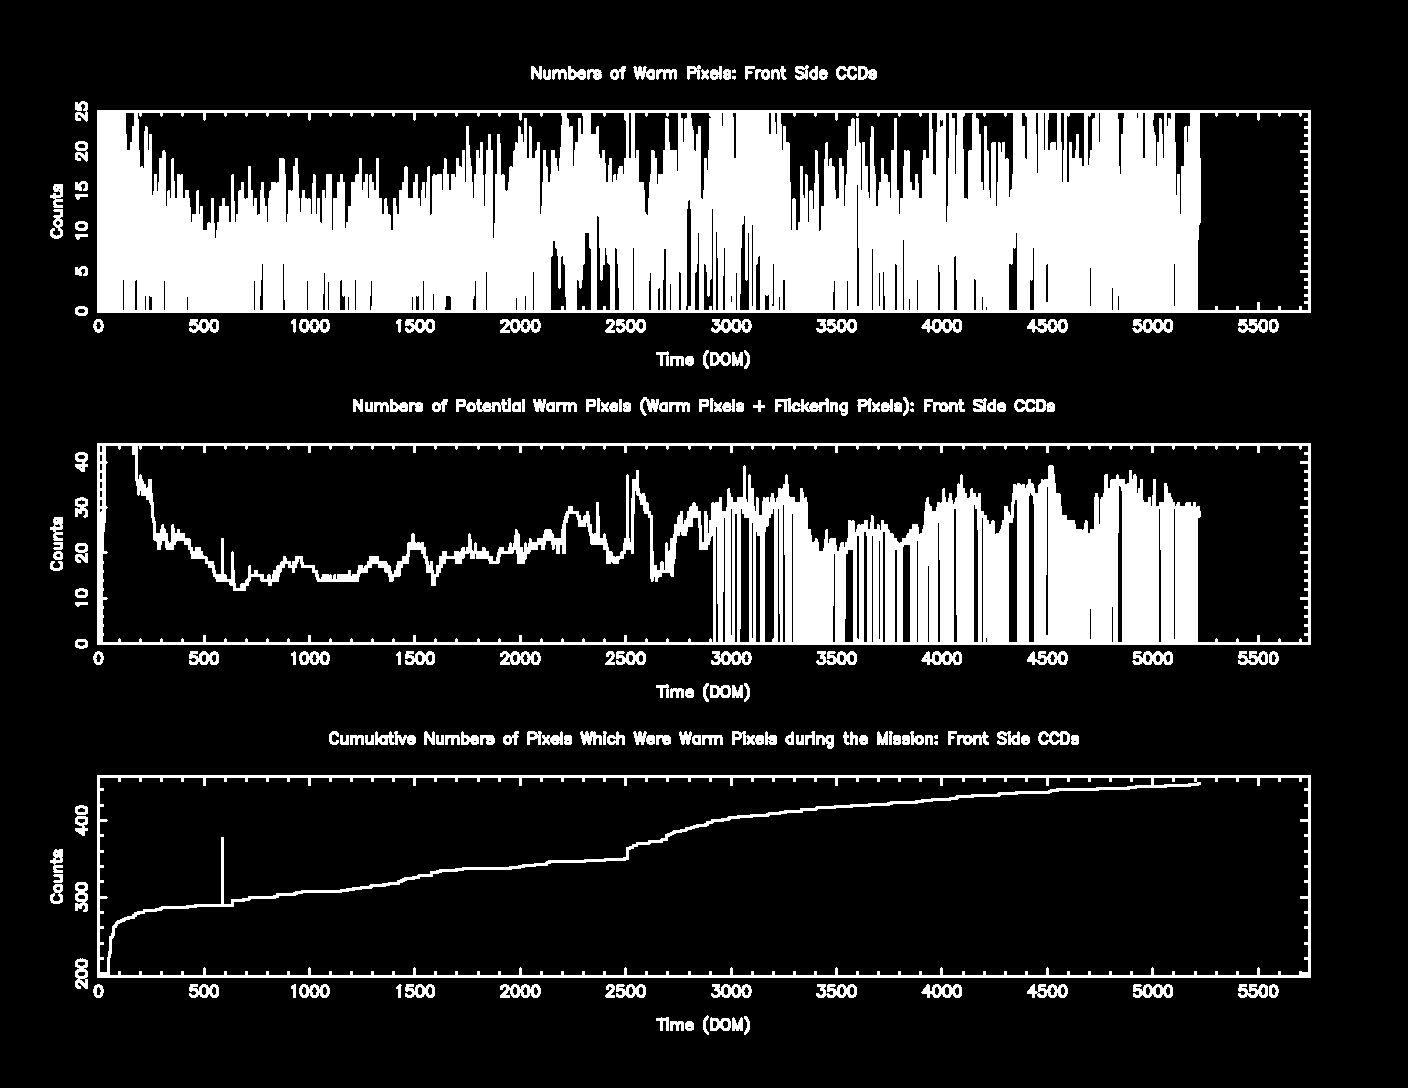
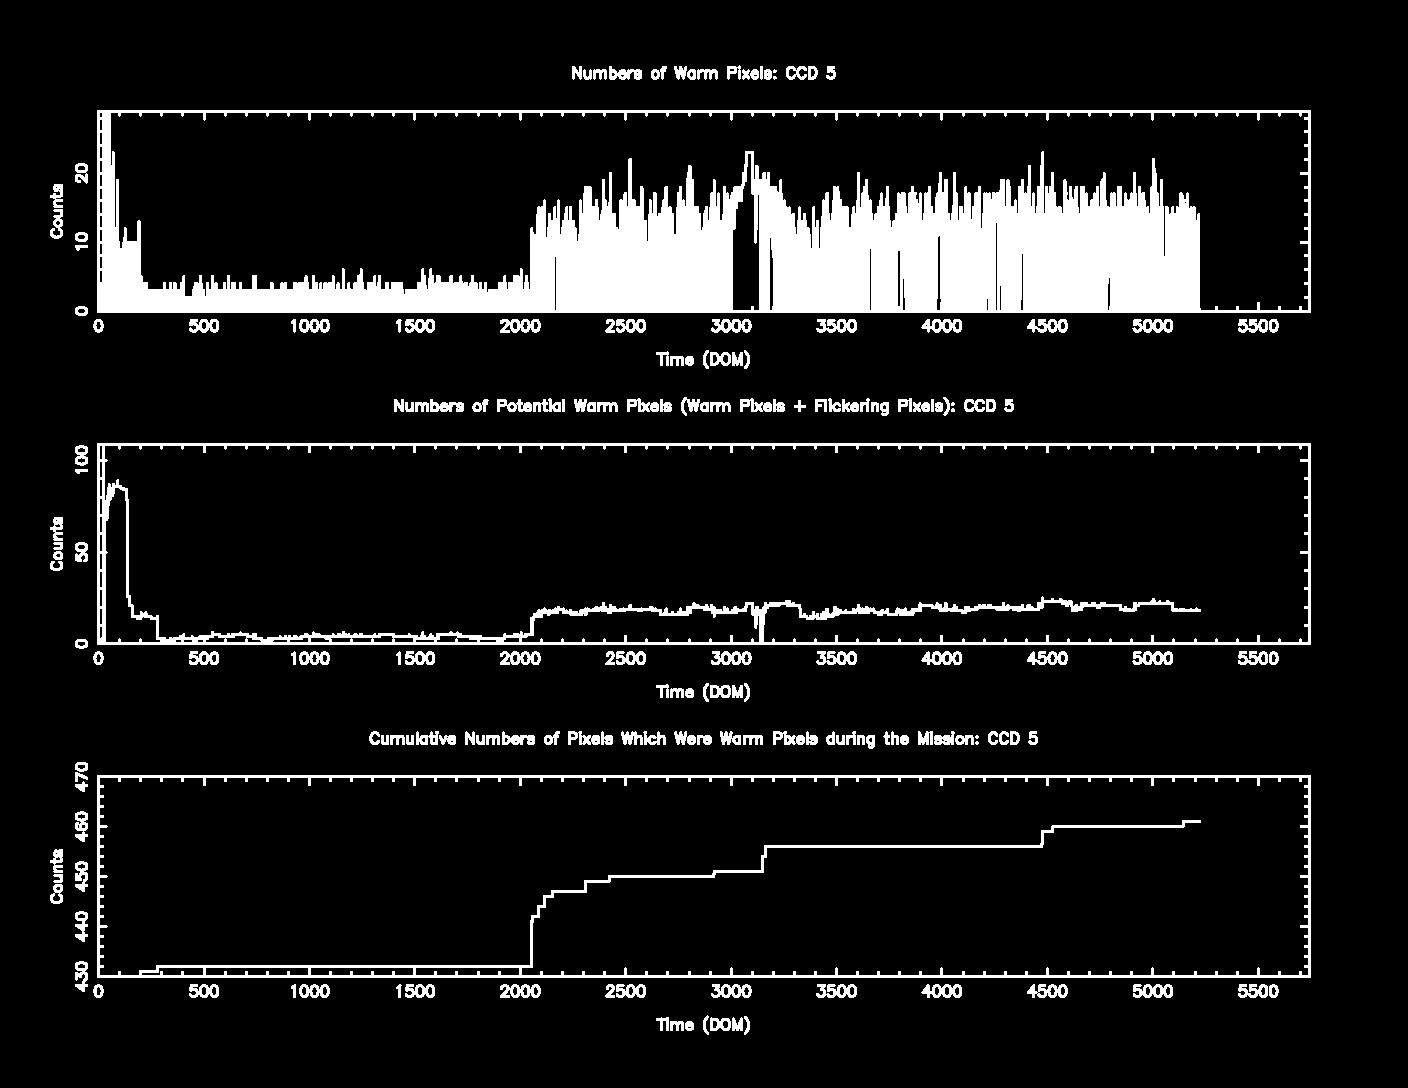
The plots below were generated with a new warm pixel finding script. Please see Acis Bad Pixel Page for details.
| Name | Low (keV) | High(KeV) | Description |
|---|---|---|---|
| SSoft | 0.00 | 0.50 | Super soft photons |
| Soft | 0.50 | 1.00 | Soft photons |
| Med | 1.00 | 3.00 | Moderate energy photons |
| Hard | 3.00 | 5.00 | Hard Photons |
| Harder | 5.00 | 10.00 | Very Hard photons |
| Hardest | 10.00 | Beyond 10 keV |
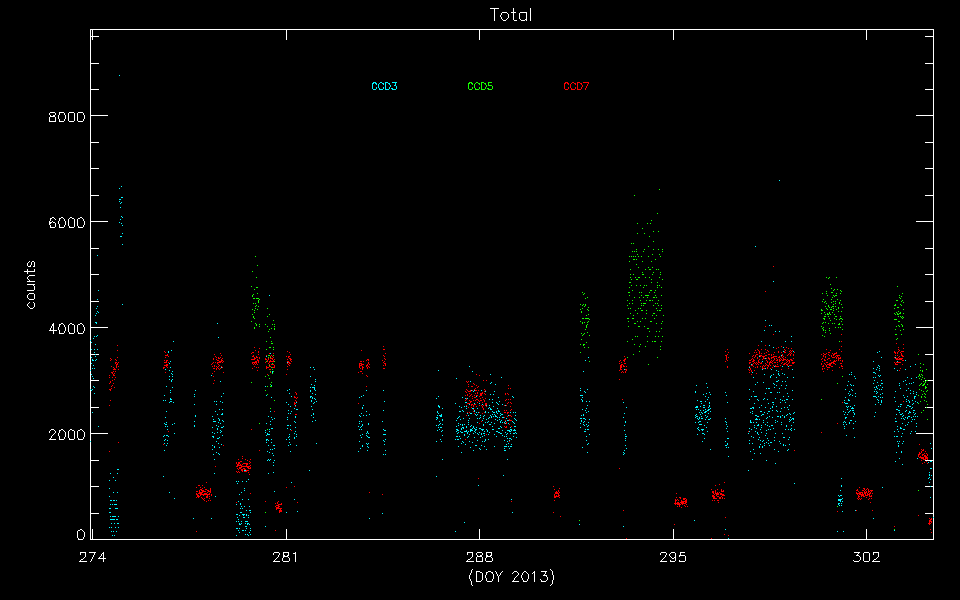
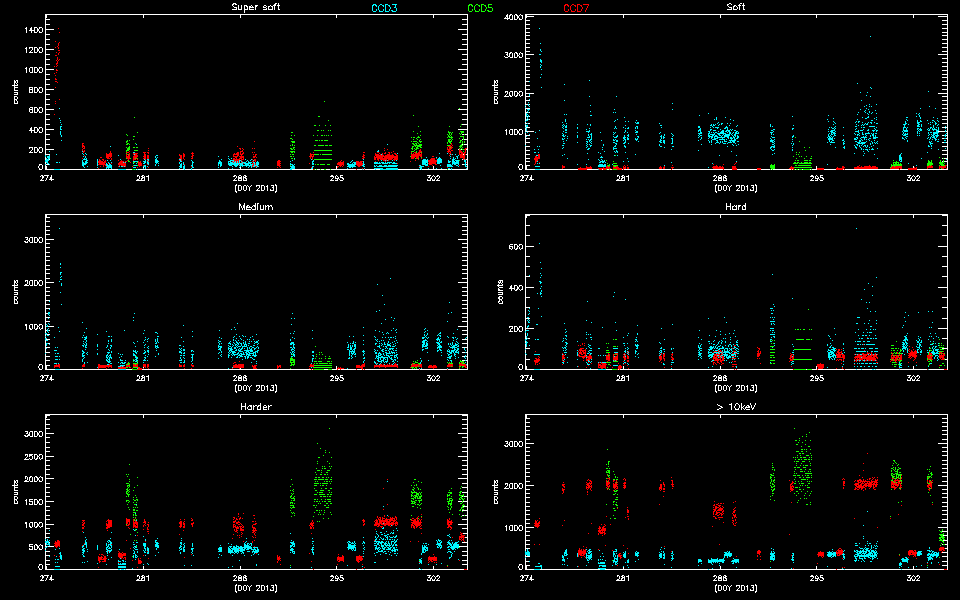
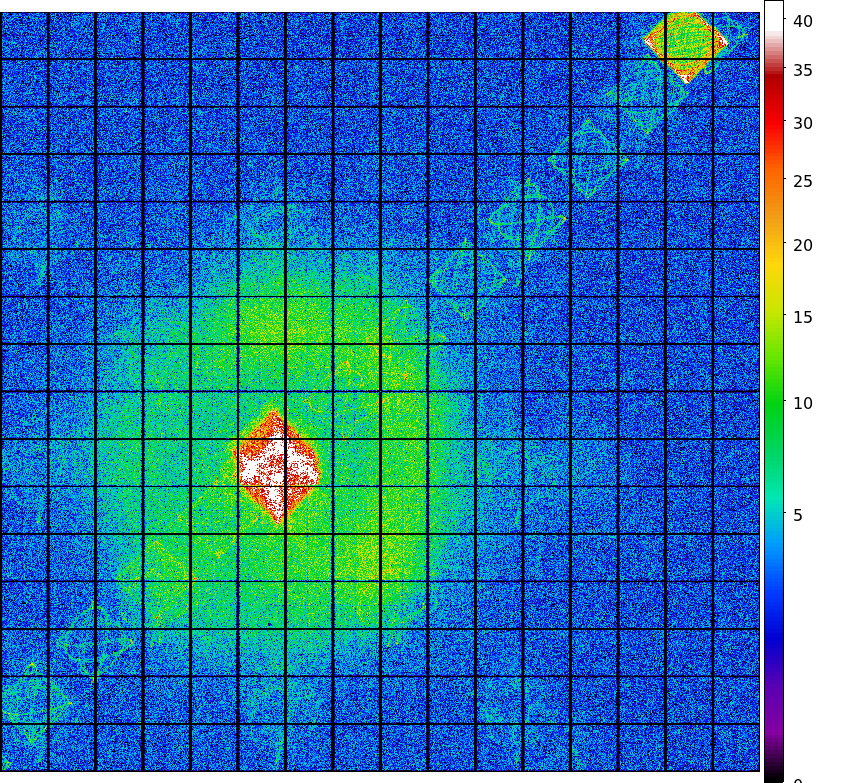
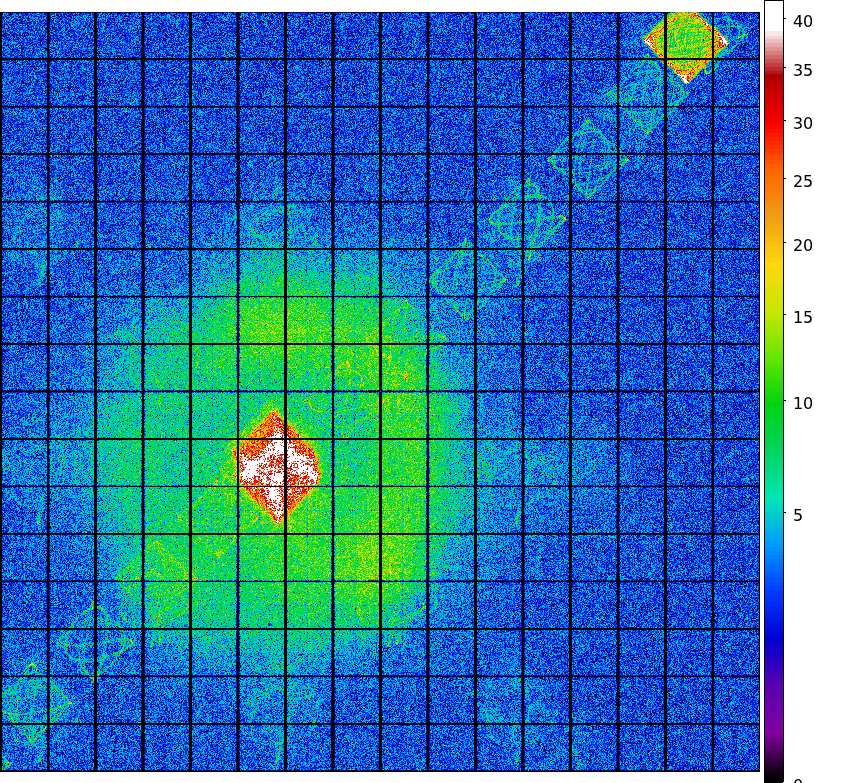
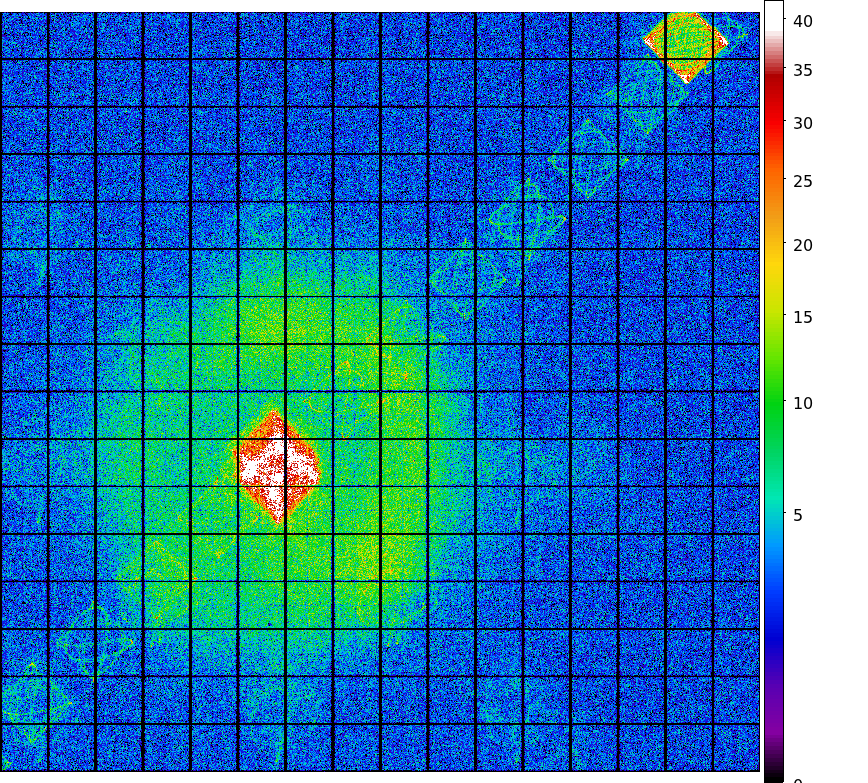
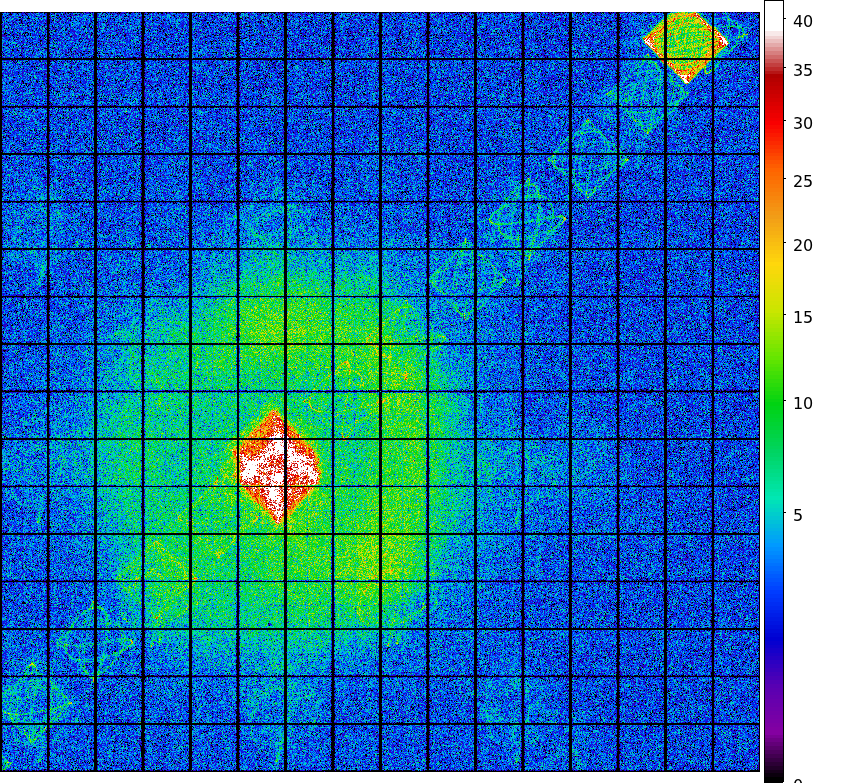
Please refer to Maximum Dose Trends for more details.
        IMAGE                NPIX      MEAN    STDDEV      MIN       MAX
HRCI_10_2013.fits          16777216   0.049    0.2226      0.0       4.0
        IMAGE                NPIX      MEAN    STDDEV      MIN       MAX
HRCI_08_1999_10_2013.fits  16777216   4.076    4.808       0.0       292.0
         IMAGE                NPIX      MEAN    STDDEV      MIN       MAX
HRCS_10_2013.fits          16777216   0.231    0.8790      0.0        62.0
        IMAGE                NPIX     MEAN      STDDEV      MIN      MAX
HRCS_08_1999_10_2013.fits  16777216  15.088      25.197      0.0      1655.0

|
|
Max dose trend plots corrected for events that "pile-up"
in the center of the taps due to bad position information.
|
|
|
|
|
| Jul 2013 | Apr 2013 | Jan 2013 | Oct 2012 |
|---|
|
|
|
|
| Jul 2013 | Apr 2013 | Jan 2013 | Oct 2012 |
|---|
We plot the width of the zero order streak of ACIS/HETG observations and the width of the zero order image for HRC/LETG observations of point sources. No significant defocusing trend is seen at this time. See Gratings Focus pages.

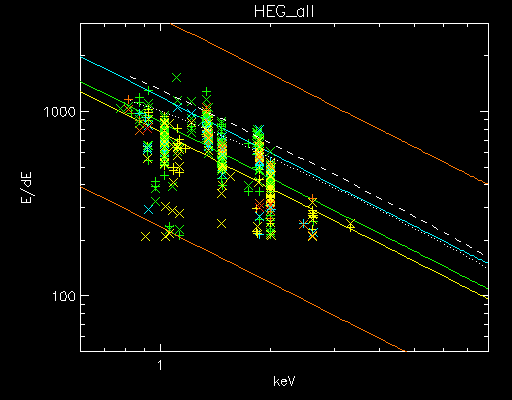
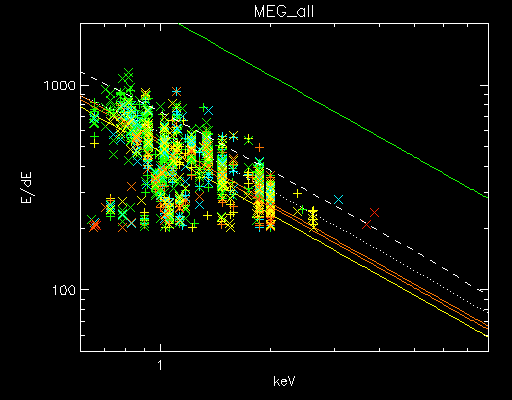
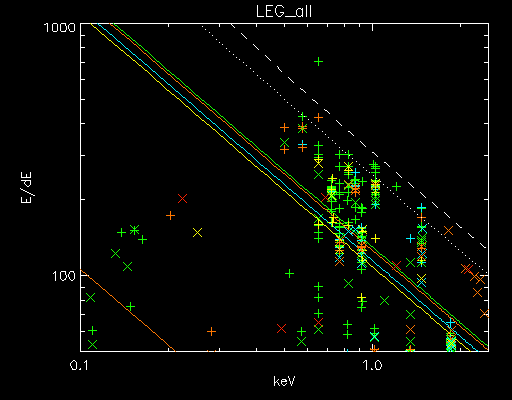
We plot E/dE vs. E for fits to detected lines with fwhm_error/fwhm less than 0.15 for the plus and minus arms of HEG, MEG, and LEG. Also shown are conservative (dotted line) and optimistic (dashed line) pre-launch resolving power expectations.
We have selected only calibration observations of Capella, HR1099, and Sigma Gem. See MIT technotes for a parallel analysis.
| Plot symbol indicates dispersion arm: | Color indicates observation date: |
Minus side = cross (x) |
A002-2004 blue 2005-2006 yellow 2007-2009 orange |
Plotted below are radiation zone timing plots based on the following definitions of radiation zone:
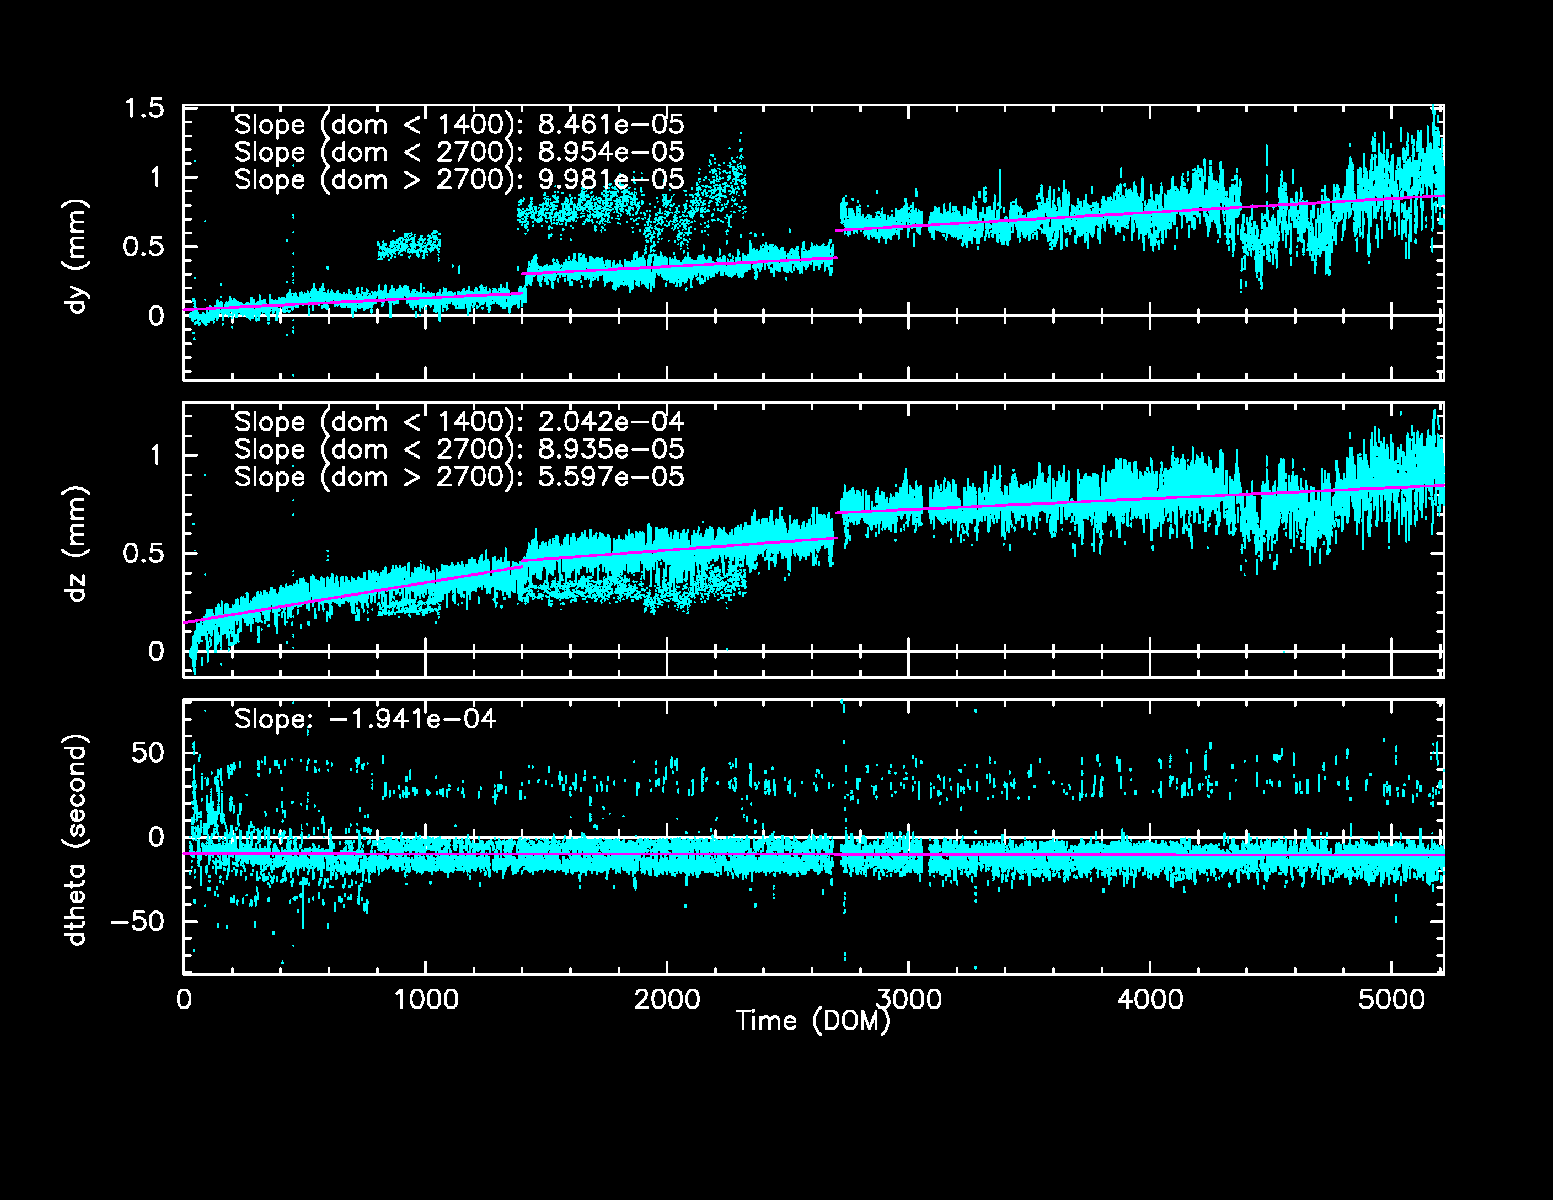
SIM Shift and Twist Trend The following plots show trends of SIM shifts (dy and dz) and twist (dtheta). All quantities are directly taken from pcaf*_asol1.fits files. The units are mm for dy and dz, and degree for dtheta. We fit three lines separated before and after (Days of Mission)= 1400 (May 21, 2003), and 2700 (Dec 11, 2006). The unit of slopes are mm per day or degree per day.
The sudden shift around DOM = 1400 and 2700 are due to fid light drift (see a memo by Aldcroft fiducial light drift). On the dtheta plot, two tracks are clearly observed. The track around 0.01 is due to HRC-I, and all others are clustered around -0.002. For more detail, please see SIM Shift and Twist Trend page
| Previous Quarter | ||||||
| MSID | MEAN | RMS | DELTA/YR | DELTA/YR/YR | UNITS | DESCRIPTION |
| TATECDRT | 288.72 | 0.89 | 1.958e+00 | -6.581e+01 | K | TEC DRIVER RDNT TEMP |
| TBOLTCUT | 236.91 | 14.51 | 1.719e+00 | 2.864e+02 | K | DOOR BOLT-CUTTER TEMP |
| TFSSBKT1 | 340.80 | 19.76 | -8.448e+00 | 4.449e+01 | K | FSS BRACKET-1 TEMP (+Y) |
| TFSSBKT2 | 335.58 | 27.19 | -2.681e+01 | 2.395e+01 | K | FSS BRACKET-2 TEMP (+Y) |
| Previous Quarter | ||||||
| MSID | MEAN | RMS | DELTA/YR | DELTA/YR/YR | UNITS | DESCRIPTION |
| ELBV | 28.84 | 0.19 | -2.076e+00 | -4.765e+00 | V | LOAD BUS VOLTAGE |
| OHRMAPWR | 53.40 | 2.44 | 3.977e+00 | 2.193e+02 | W | HRMA COMPUTED TOTAL POWER |
| OOBAPWR | 47.07 | 2.35 | 3.527e+00 | 9.008e+01 | W | OBA COMPUTED TOTAL POWER |
| Previous Quarter | ||||||
| MSID | MEAN | RMS | DELTA/YR | DELTA/YR/YR | UNITS | DESCRIPTION |
| CPA1PWR | 3.04 | 8.60 | -9.794e+00 | 4.223e+01 | DBM | POWER AMP-1 OUTPUT POWER |
| CPA1V | 0.30 | 0.85 | -9.494e-01 | 2.905e+00 | V | POWER AMP-1 SECONDARY VOLTAGE |
| CPA2PWR | 2.27 | 7.49 | 7.800e+00 | -9.762e-01 | DBM | POWER AMP-2 OUTPUT POWER |
| CPA2V | 0.22 | 0.73 | 7.274e-01 | -2.901e+00 | V | POWER AMP-2 SECONDARY VOLTAGE |
|
|

Note: From Feb 2010, the computation of reaction wheel rotations are slightly modified.
| Year | Month | |||||||||||
|---|---|---|---|---|---|---|---|---|---|---|---|---|
| 1999 | Jul | Aug | Sep | Oct | Nov | Dec | ||||||
| 2000 | Jan | Feb | Mar | Apr | May | Jun | Jul | Aug | Sep | Oct | Nov | Dec |
| 2001 | Jan | Feb | Mar | Apr | May | Jun | Jul | Aug | Sep | Oct | Nov | Dec |
| 2002 | Jan | Feb | Mar | Apr | May | Jun | Jul | Aug | Sep | Oct | Nov | Dec |
| 2003 | Jan | Feb | Mar | Apr | May | Jun | Jul | Aug | Sep | Oct | Nov | Dec |
| 2004 | Jan | Feb | Mar | Apr | May | Jun | Jul | Aug | Sep | Oct | Nov | Dec |
| 2005 | Jan | Feb | Mar | Apr | May | Jun | Jul | Aug | Sep | Oct | Nov | Dec |
| 2006 | Jan | Feb | Mar | Apr | May | Jun | Jul | Aug | Sep | Oct | Nov | Dec |
| 2007 | Jan | Feb | Mar | Apr | May | Jun | Jul | Aug | Sep | Oct | Nov | Dec |
| 2008 | Jan | Feb | Mar | Apr | May | Jun | Jul | Aug | Sep | Oct | Nov | Dec |
| 2009 | Jan | Feb | Mar | Apr | May | Jun | Jul | Aug | Sep | Oct | Nov | Dec |
| 2010 | Jan | Feb | Mar | Apr | May | Jun | Jul | Aug | Sep | Oct | Nov | Dec |
| 2011 | Jan | Feb | Mar | Apr | May | Jun | Jul | Aug | Sep | Oct | Nov | Dec |
| 2012 | Jan | Feb | Mar | Apr | May | Jun | Jul | Aug | Sep | Oct | Nov | Dec |
| 2013 | Jan | Feb | Mar | Apr | May | Jun | Jul | Aug | Sep | |||