Nov Dose Map
)
TOTAL
)
CCD I3
)
CCD S3
The steps we took to compute the dose map are;
Please check more detail plots at Telemetered Photon Dose Trend page.
Statistics:
# IMAGE     NPIX        MEAN           RMS              MIN     MAX
ACIS_nov13 6004901       6.428         12.585           0.0     1588


I2 node 0  262654   9.092484    3.786394    0.0  56.0
I2 node 1  262654   9.587274    4.450175    0.0 627.0
I2 node 2  262654   9.360607    3.822973    0.0  83.0
I2 node 3  262654   9.368943    5.127393    0.0 1588.0

I3 node 0  262654   8.782521    3.833681    0.0  44.0
I3 node 1  262654   9.592995    8.445735    0.0 190.0
I3 node 2  262654   8.466258    3.611743    0.0  82.0
I3 node 3  262654   8.261356    3.589362    0.0 116.0

S2 node 0  262654   5.492168    2.689810    0.0 111.0
S2 node 1  262654   5.671709    2.990645    0.0  41.0
S2 node 2  262654   5.794213    2.889405    0.0  66.0
S2 node 3  262654   5.519471    2.790483    0.0 280.0

S3 node 0  262654   19.717463   38.218459   0.0 271.0
S3 node 1  262654   8.053175    7.776861    0.0 147.0
S3 node 2  262654   6.599655    2.756156    0.0  32.0
S3 node 3  262654   6.022296    2.615680    0.0  29.0
Statistics:
 IMAGE        NPIX      MEAN             RMS            MIN    MAX
ACIS_total   6004901    1752.008         2311.384       0.0   102750


I2 node 0  262654   1479.043949 292.405207     0.0  8942.0
I2 node 1  262654   1554.913586 393.439569     0.0 35767.0
I2 node 2  262654   1583.093842 339.484040     0.0  6740.0
I2 node 3  262654   1579.558288 400.855785     0.0  9386.0

I3 node 0  262654   1655.510870 404.862815     0.0  6526.0
I3 node 1  262654   1738.102692 1320.644966    0.0 33613.0
I3 node 2  262654   1516.899724 281.078864     0.0  7590.0
I3 node 3  262654   1502.880467 299.121015     0.0 26101.0

S2 node 0  262654   2104.675731 321.976403  1098.0 28657.0
S2 node 1  262654   2242.613955 493.436563  1150.0 12380.0
S2 node 2  262654   2480.057334 483.870823  1486.0 42215.0
S2 node 3  262654   2413.529533 365.222791  1429.0 40231.0

S3 node 0  262654   3688.330028 1741.002549 1512.0 12809.0
S3 node 1  262654   4763.240881 1926.574431    0.0 13090.0
S3 node 2  262654   3678.076949 924.589349  1486.0  9221.0
S3 node 3  262654   2880.387842 447.582014  1646.0  9383.0
)
|
)
|
)
|
)
|
| Aug 2013 | May 2013 | Feb 2013 | Nov 2012 |
|---|
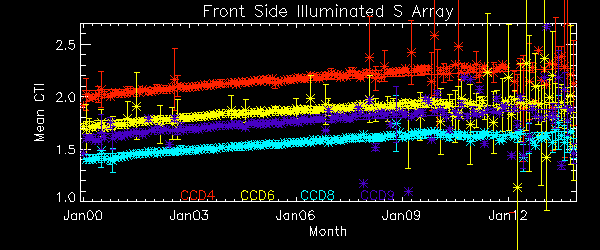
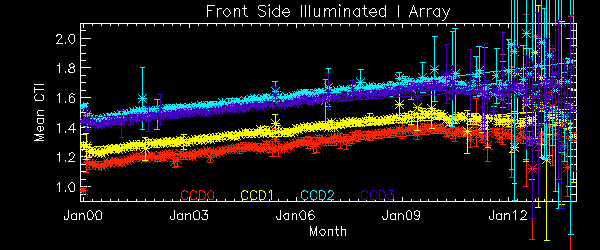
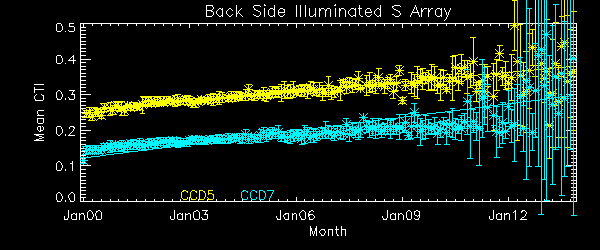
We report CTIs with a refined data definition. CTIs were computed for the temperature dependency corrected data. Please see CTI page for detailed explanation. CTI's are computed for Mn K alpha, and defined as slope/intercept x10^4 of row # vs ADU. Data file: here
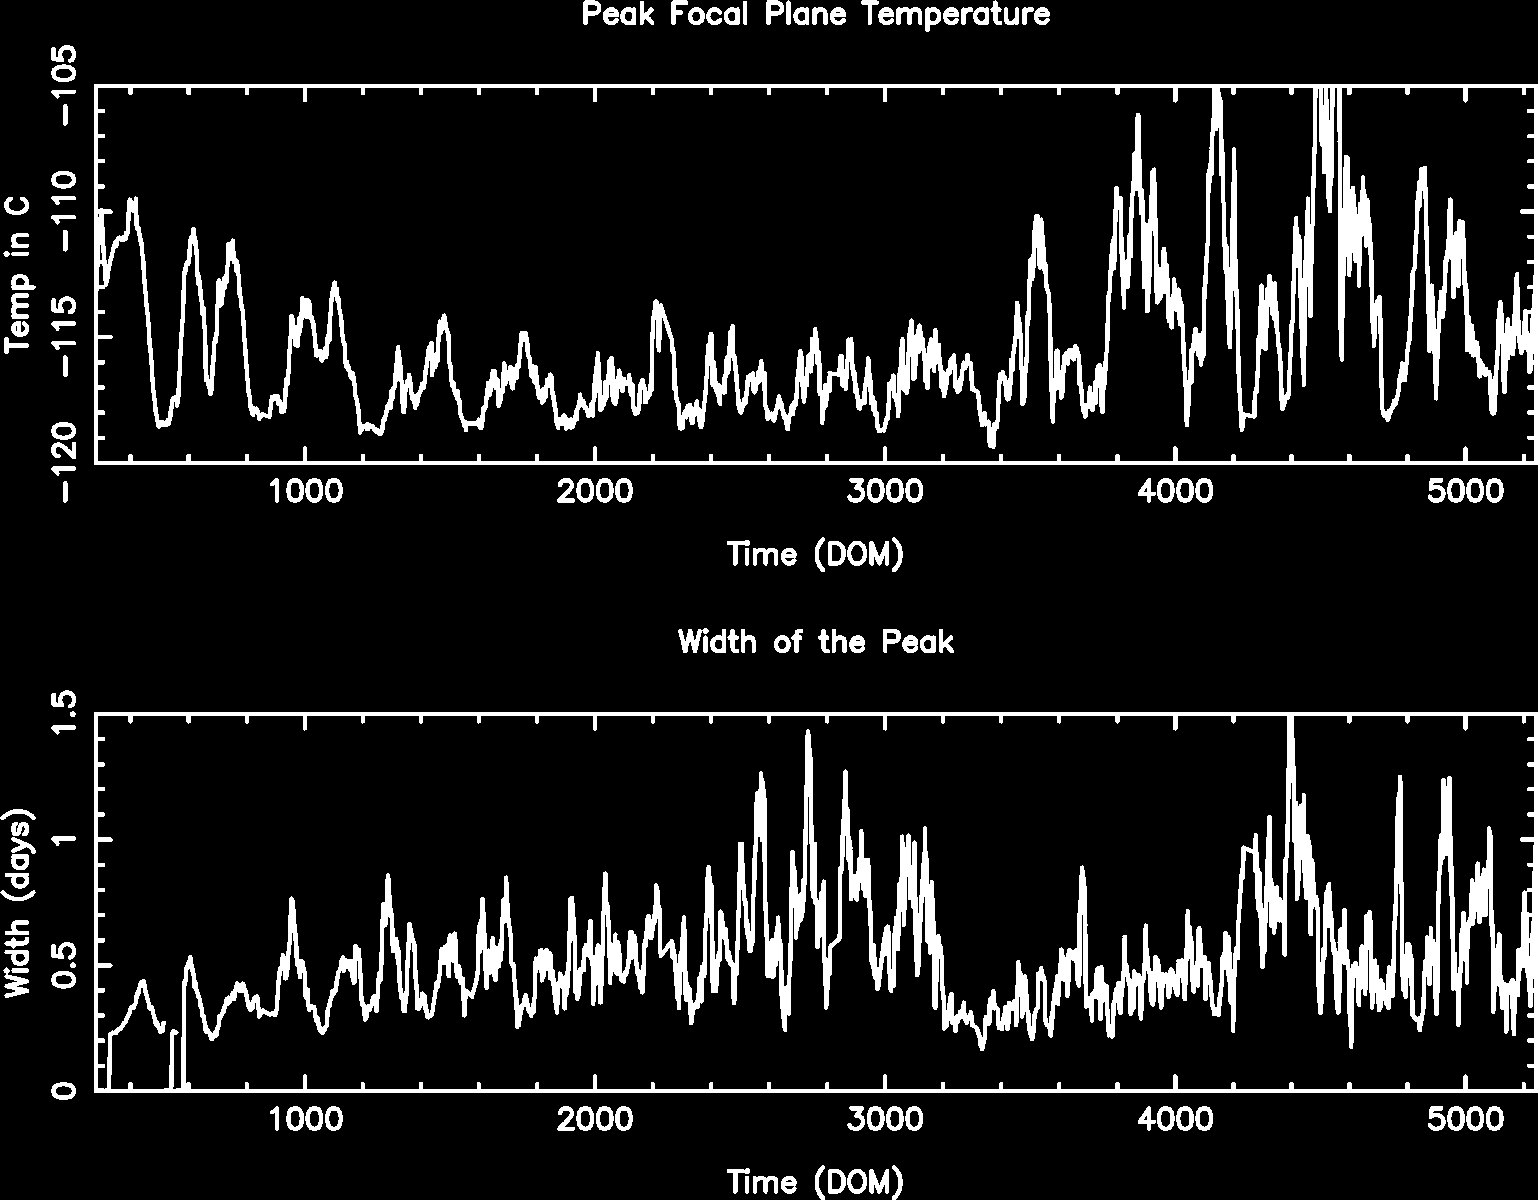
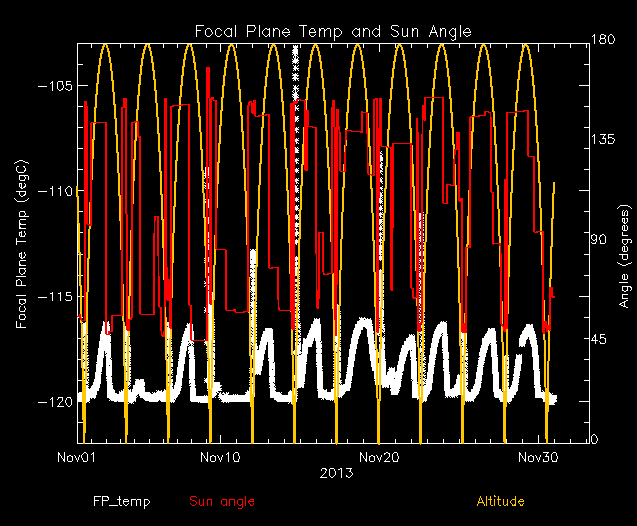
| The Mean (max) FPT: | |
|---|---|
| -114.76 | +/- 3.98 C |
| Mean Width: | |
| 0.73 | +/- 0.72 days |
We are using 10 period moving averages to show trends of peak temperatures and peak widths. Note, the gaps in the width plot are due to missing/corrupted data.
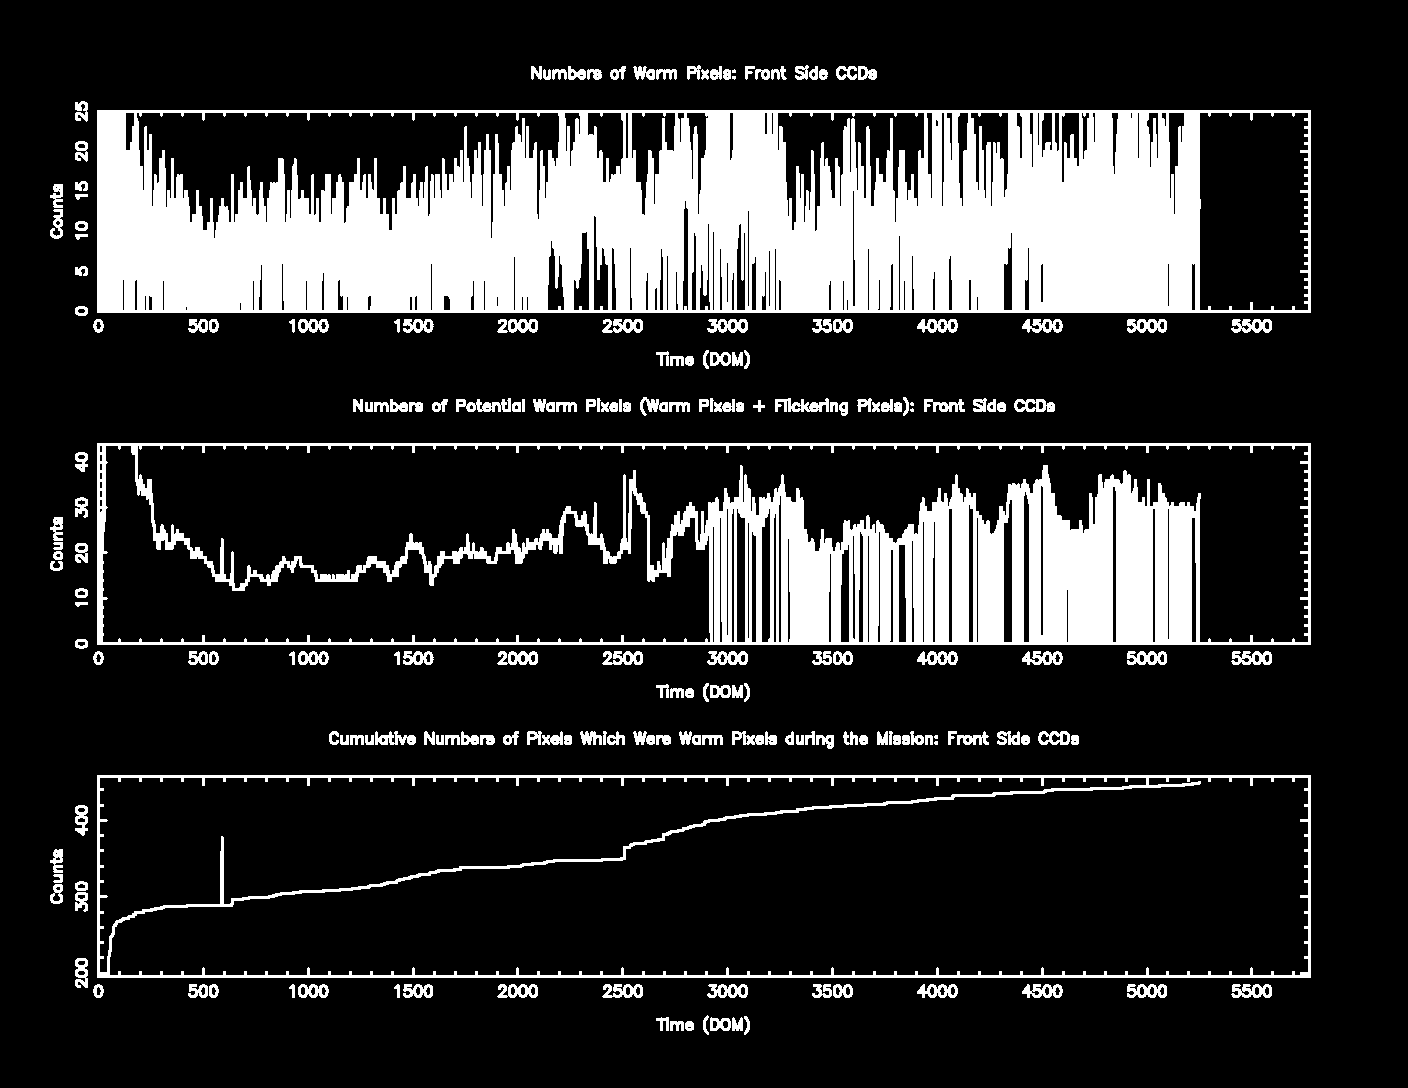
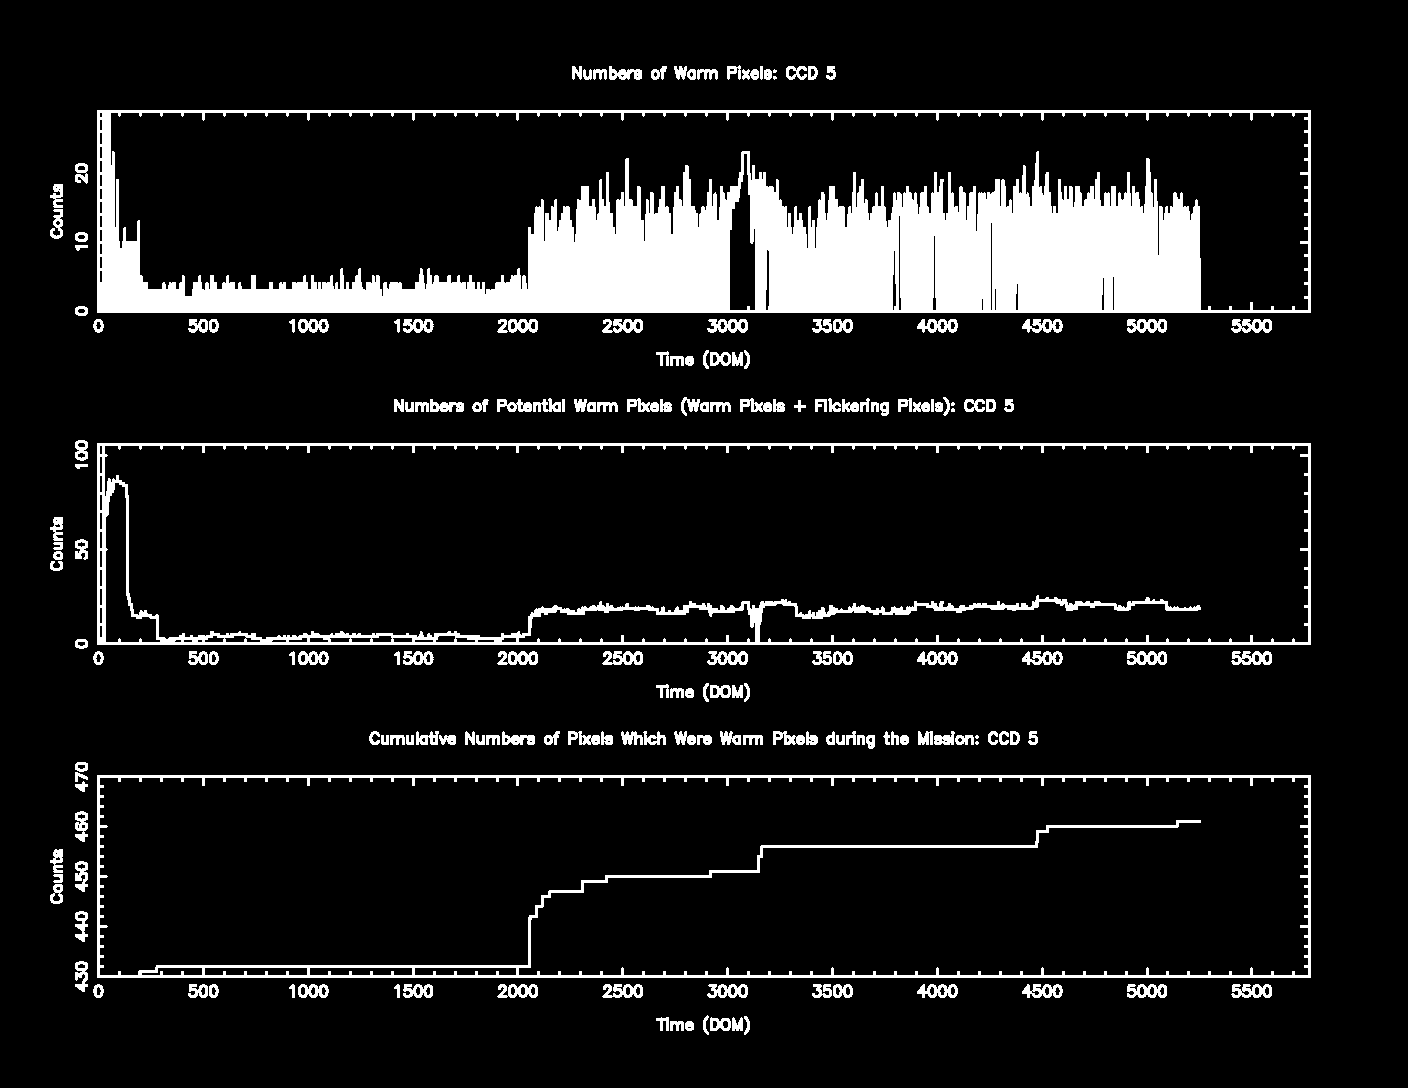
The plots below were generated with a new warm pixel finding script. Please see Acis Bad Pixel Page for details.
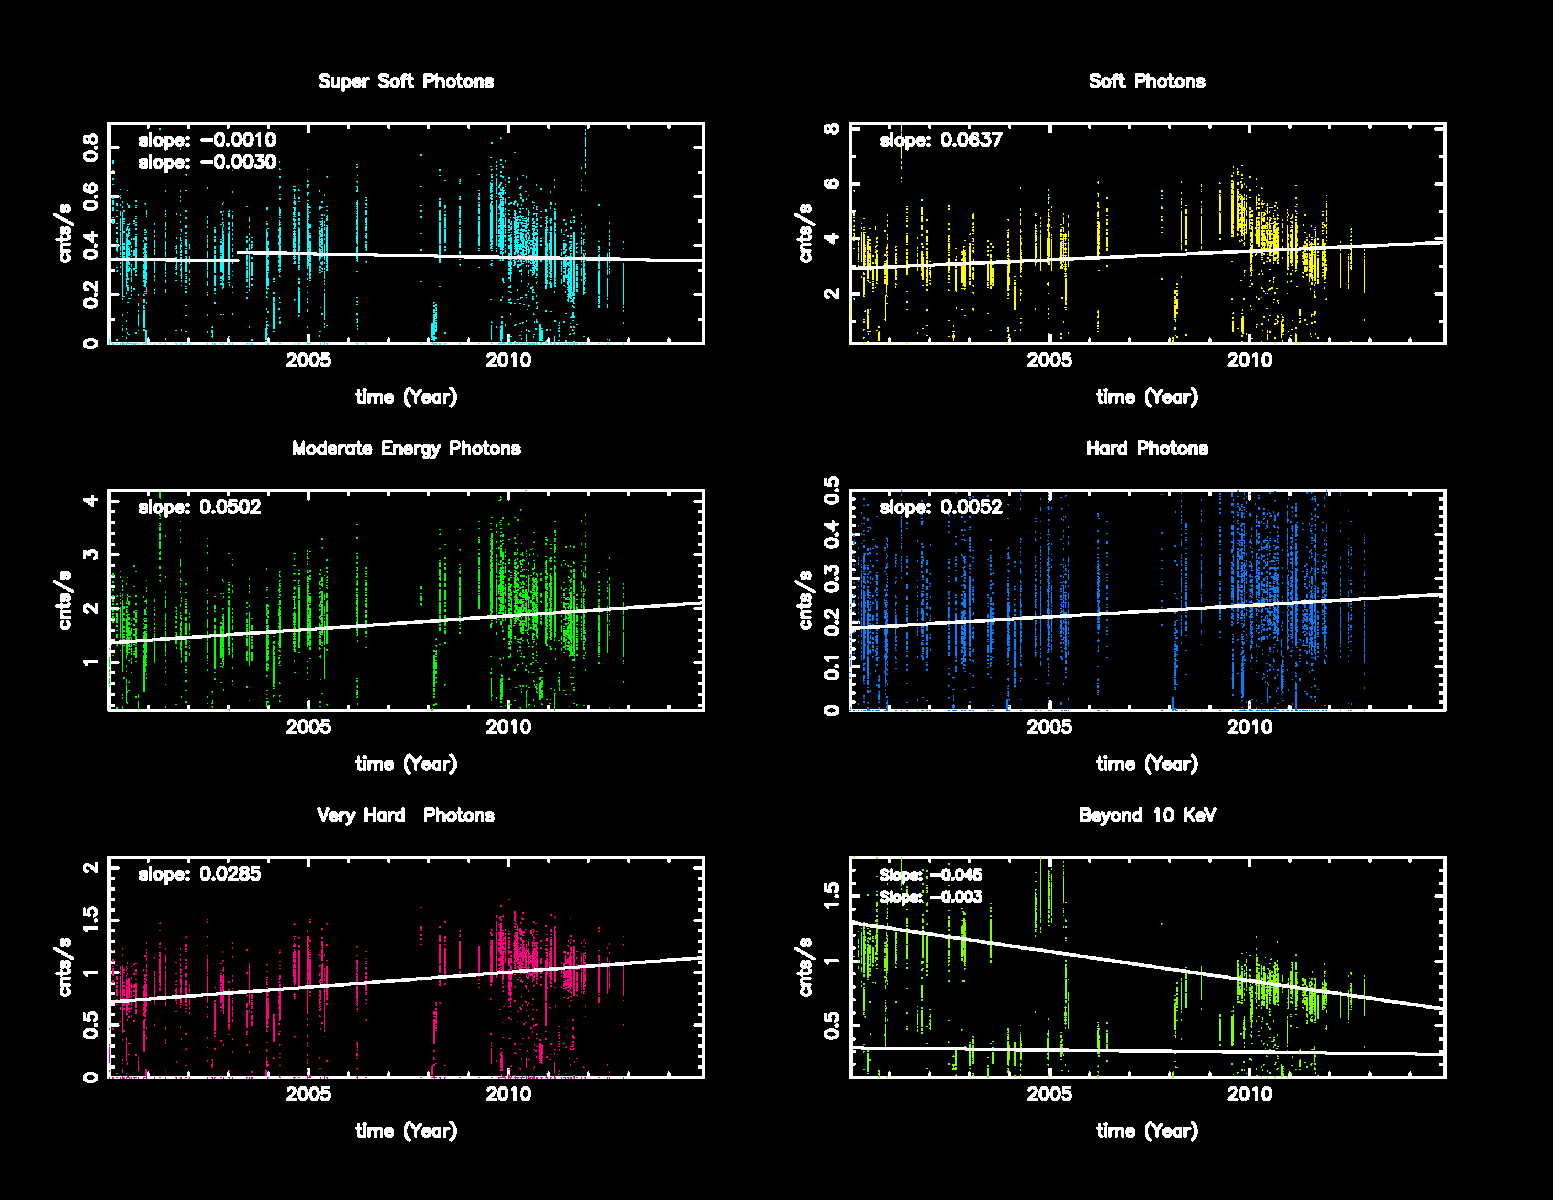
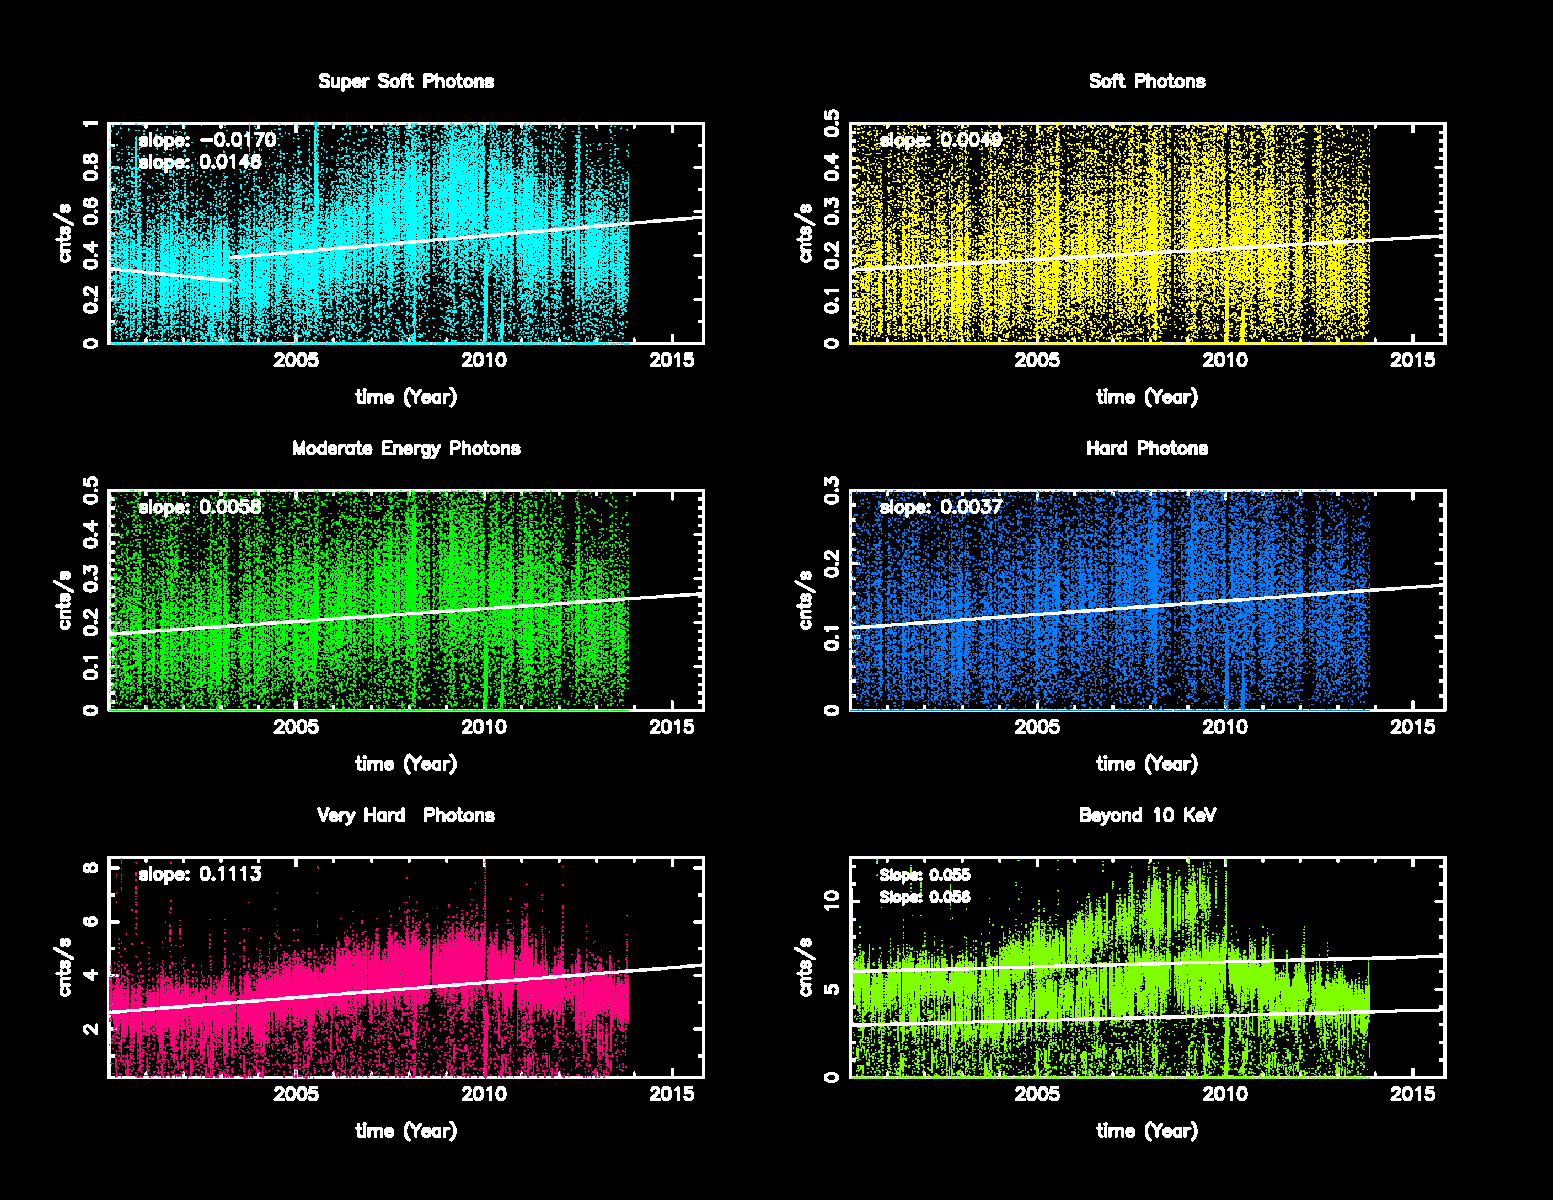
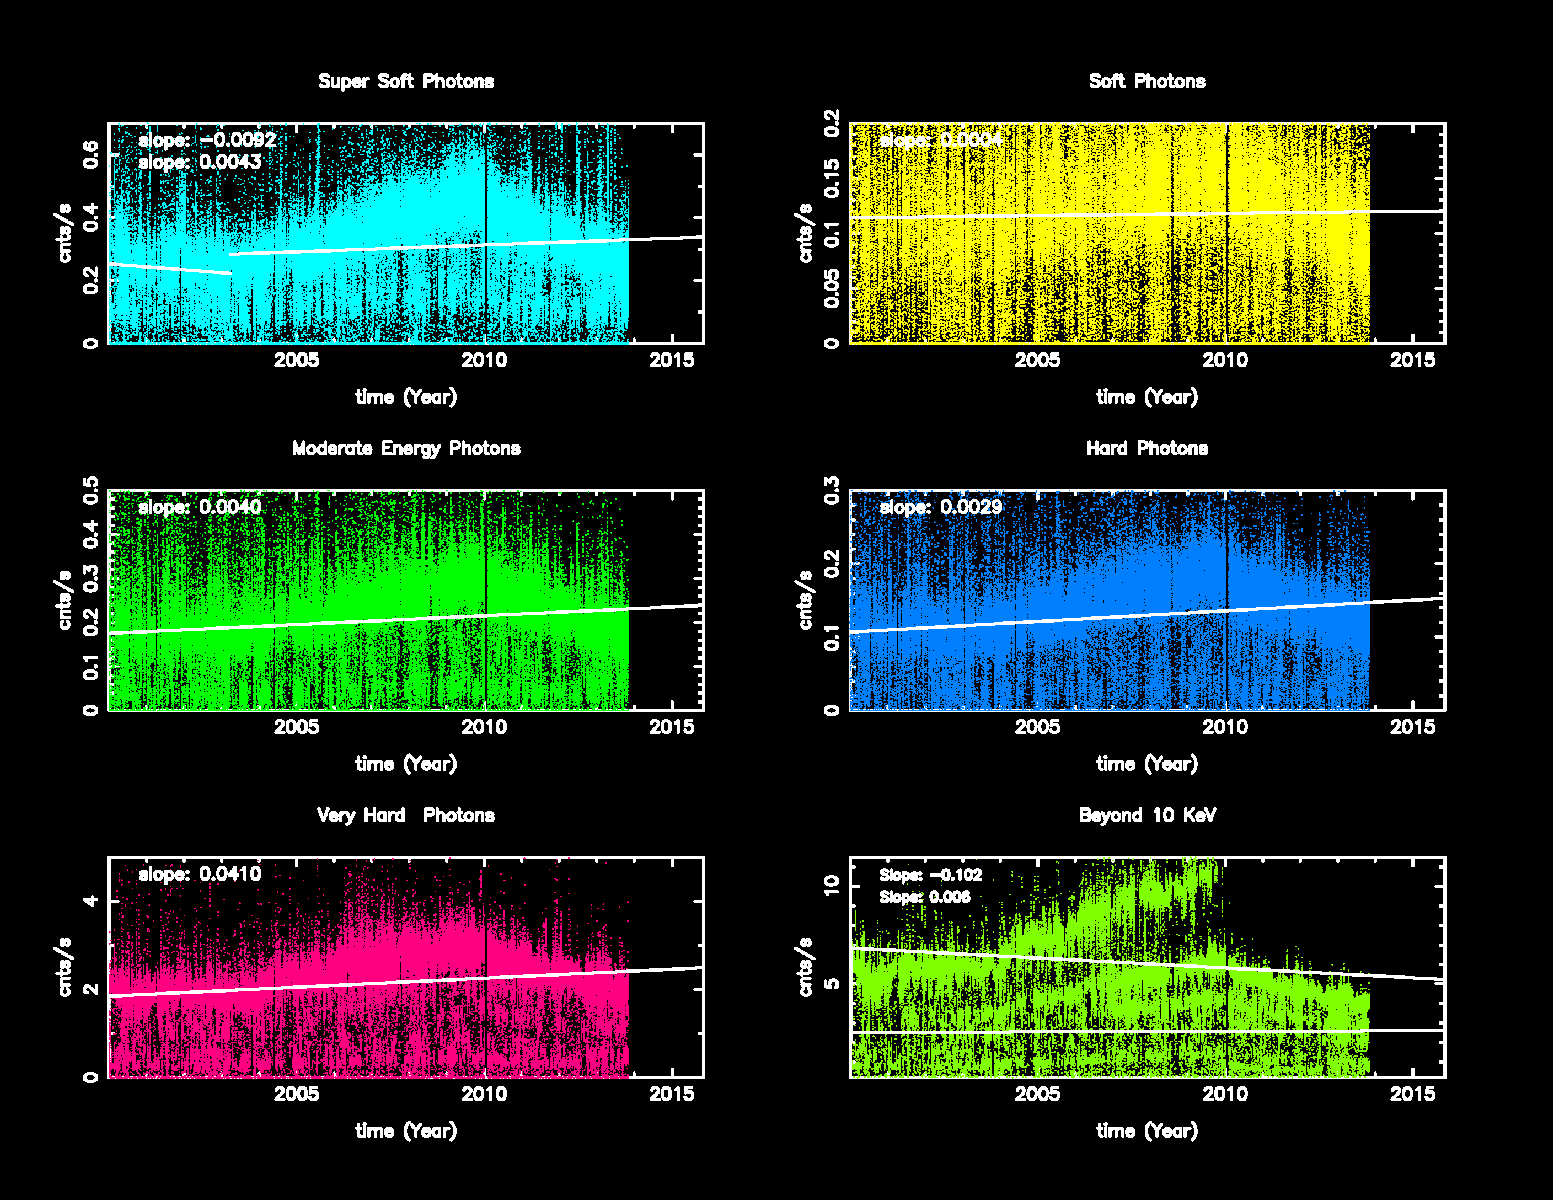
| Name | Low (keV) | High(KeV) | Description |
|---|---|---|---|
| SSoft | 0.00 | 0.50 | Super soft photons |
| Soft | 0.50 | 1.00 | Soft photons |
| Med | 1.00 | 3.00 | Moderate energy photons |
| Hard | 3.00 | 5.00 | Hard Photons |
| Harder | 5.00 | 10.00 | Very Hard photons |
| Hardest | 10.00 | Beyond 10 keV |
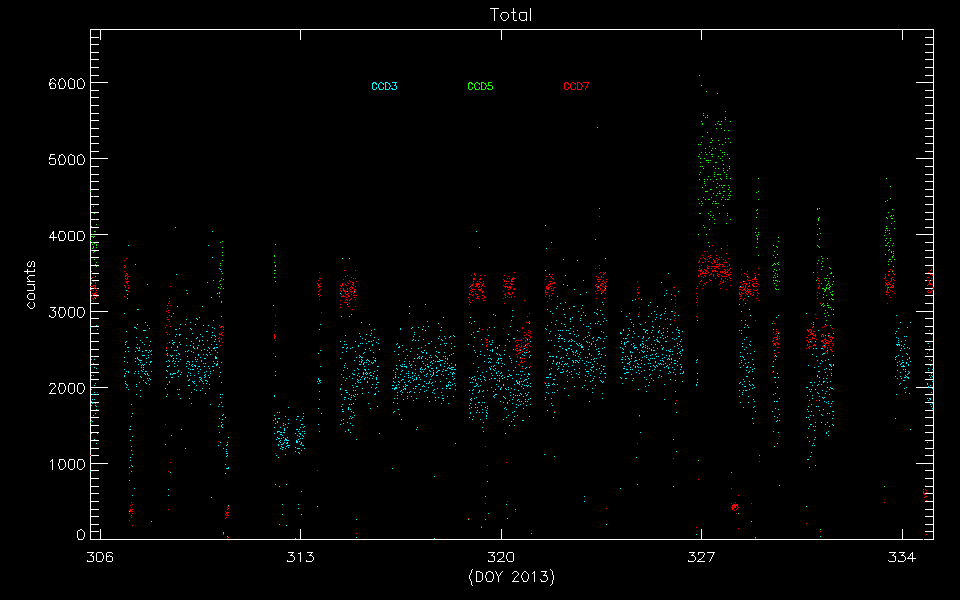
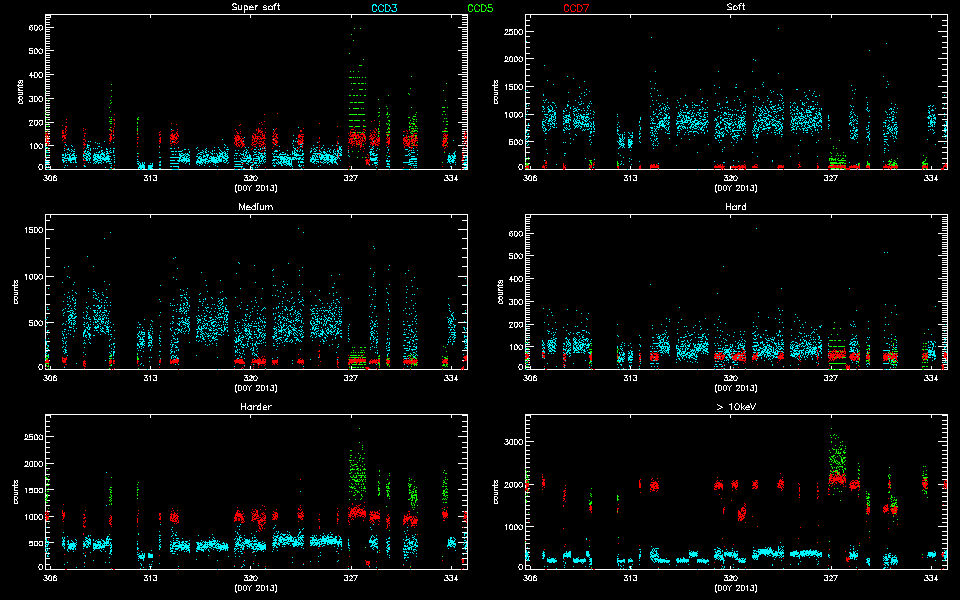
The following three plots show trends of SIB from year 2000. CCDs shown here are CCD3, CCD5, and CCD7. Fitted lines are linear fit after eliminating extreme outliers. For >10 keV plots, 2 lines are fit. One is with a 13 keV filter, and another without.
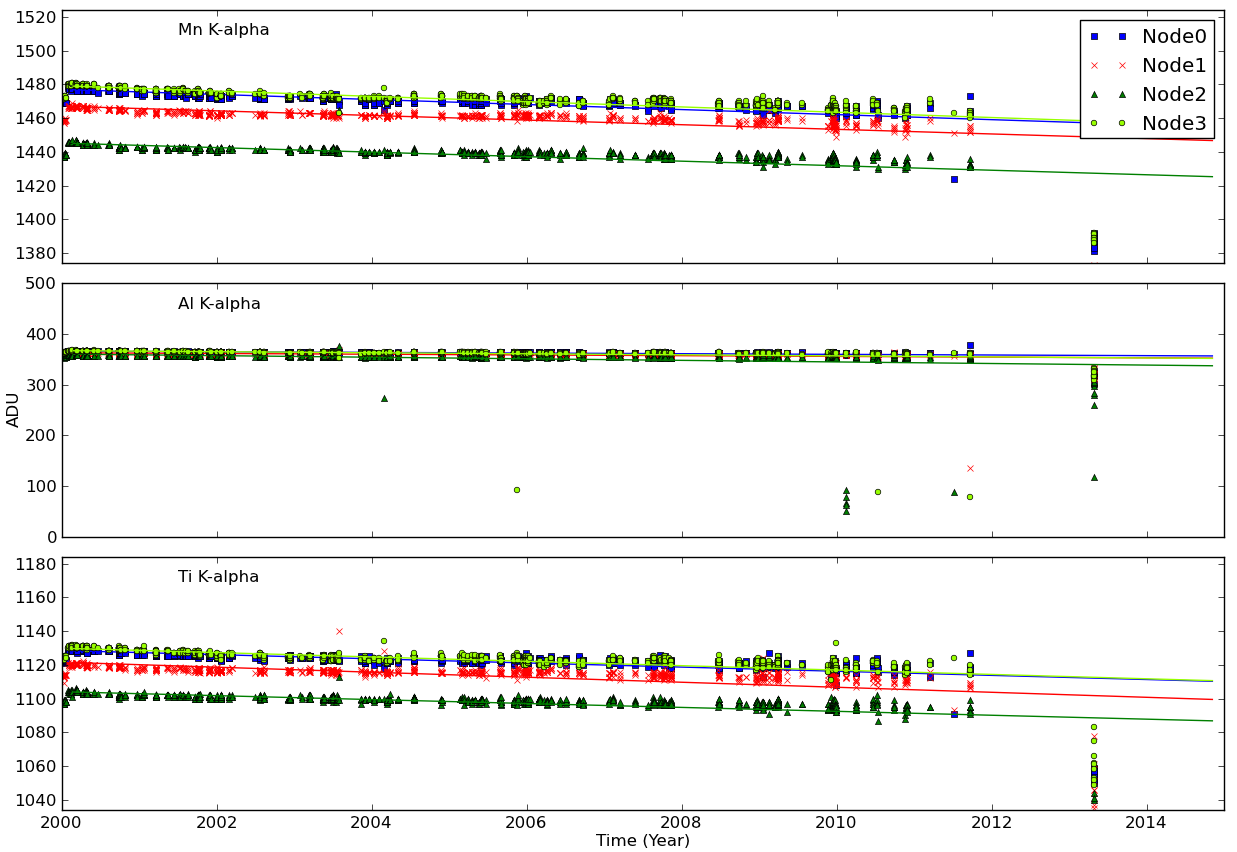
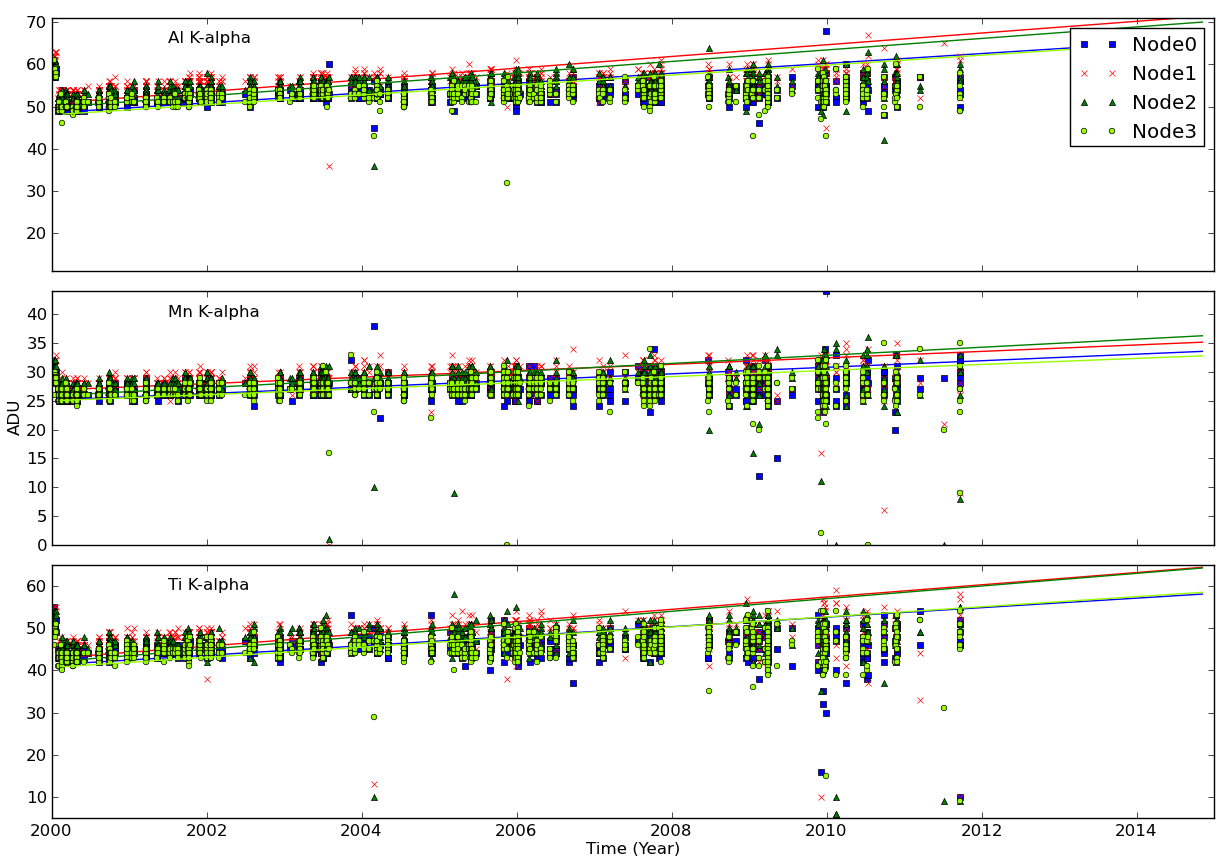
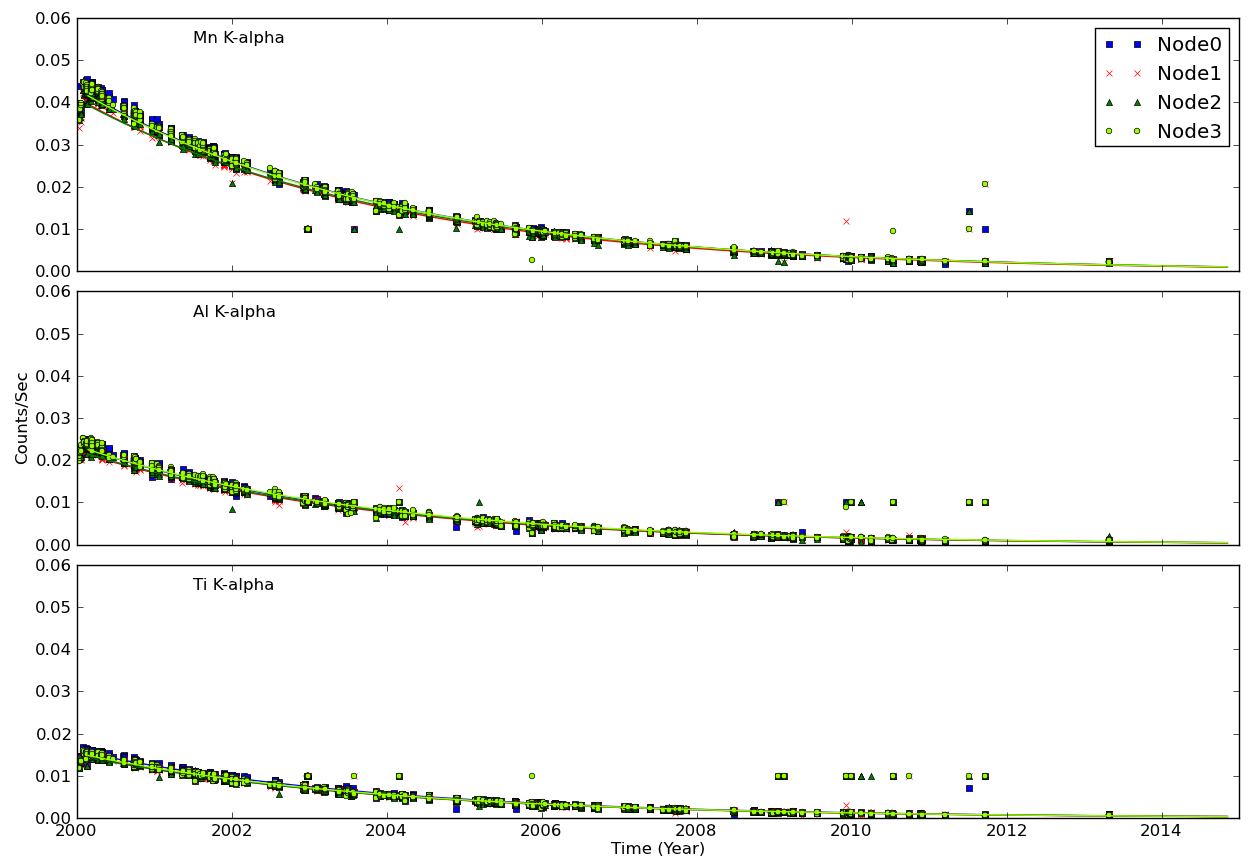
We collected data from acis histogram mode data, and created trend plots of peak portions and peak widths against time (DOM). The peaks were estimated by fitting a simple Gaussian on three peaks (Al, Ti, and Mn), and the widths were estimated by a width at the half max from the peak.
All histogram data are taken under TIMED and GRADED_HIST mode, SIM position is at an external calibration source position, the focal temperature is around -119.7 C, and parameter settings in aciselec, acistemp are set to about same for all.
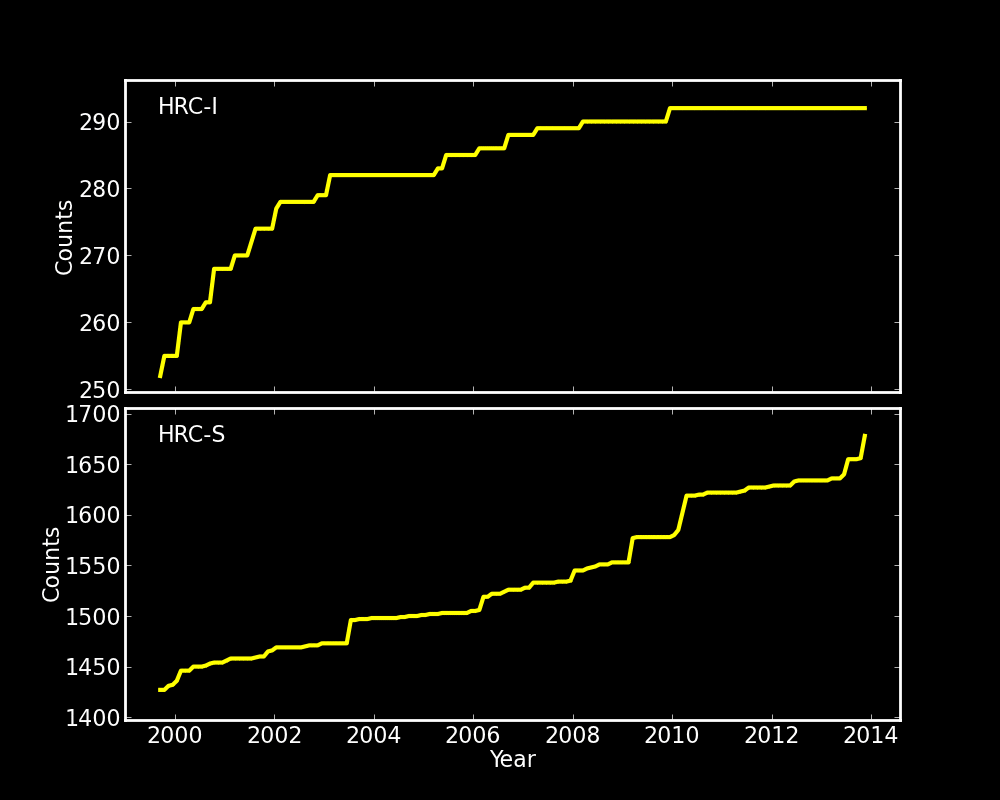
Please refer to Maximum Dose Trends for more details.
)
        IMAGE                NPIX      MEAN    STDDEV      MIN       MAX
HRCI_11_2013.fits          16777216   0.027    0.0517      0.0       2.0
)
        IMAGE                NPIX      MEAN    STDDEV      MIN       MAX
HRCI_08_1999_11_2013.fits  16777216   4.078    4.809       0.0       292.0
)
         IMAGE                NPIX      MEAN    STDDEV      MIN       MAX
HRCS_11_2013.fits          16777216   0.155    1.9712      0.0        142.0
)
        IMAGE                NPIX     MEAN      STDDEV      MIN      MAX
HRCS_08_1999_11_2013.fits  16777216  15.243      26.262      0.0     1678.0
|
|
Max dose trend plots corrected for events that "pile-up"
in the center of the taps due to bad position information.
|
)
|
)
|
)
|
)
|
| Aug 2013 | May 2013 | Feb 2013 | Nov 2012 |
|---|
)
|
)
|
)
|
)
|
| Aug 2013 | May 2013 | Feb 2013 | Nov 2012 |
|---|
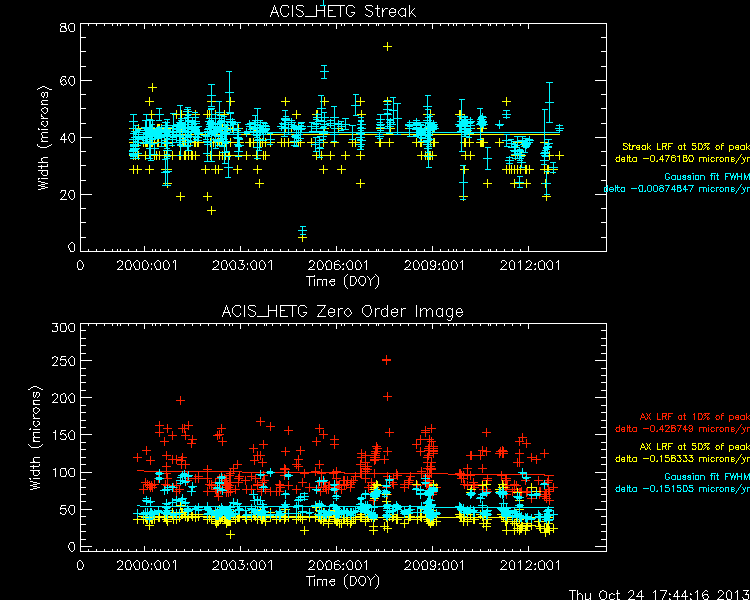
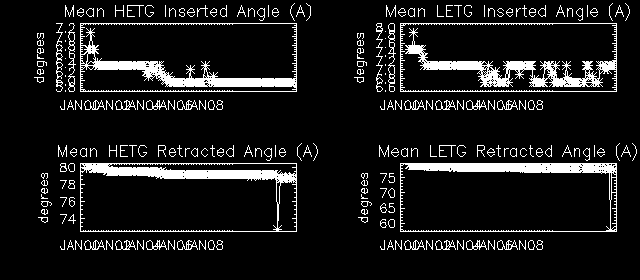
We plot the width of the zero order streak of ACIS/HETG observations and the width of the zero order image for HRC/LETG observations of point sources. No significant defocusing trend is seen at this time. See Gratings Focus pages.

| Previous Quarter | ||||||
| MSID | MEAN | RMS | DELTA/YR | DELTA/YR/YR | UNITS | DESCRIPTION |
| OOBTHR04 | 293.79 | 0.89 | -2.138e+00 | 3.001e+00 | K | RT 27: HRMA STRUT |
| OOBTHR09 | 292.80 | 1.56 | -3.298e+00 | -8.810e+00 | K | RT 32: OBA CONE |
| OOBTHR18 | 292.65 | 1.54 | -3.148e+00 | -1.124e+01 | K | RT 40: OBA CONE |
| OOBTHR45 | 297.23 | 1.67 | -3.077e+00 | 2.165e+01 | K | RT 67: TFTE COVER |
| OOBTHR58 | 293.80 | 1.50 | -3.358e+00 | -7.840e-01 | K | RT 151: OBA CONE |
| Previous Quarter | ||||||
| MSID | MEAN | RMS | DELTA/YR | DELTA/YR/YR | UNITS | DESCRIPTION |
| 4RT569T | 294.40 | 8.341e-02 | -2.314e-01 | -6.853e+00 | K | RT 569 - HRMA TEMP |
| 4RT575T | 294.26 | 1.47 | -3.095e+00 | 1.389e+00 | K | RT 575 - OB CONE TEMP |
| 4RT578T | 292.79 | 2.49 | -5.187e+00 | -5.107e+01 | K | RT 578 - OB CONE TEMP |
| Previous Quarter | ||||||
| MSID | MEAN | RMS | DELTA/YR | DELTA/YR/YR | UNITS | DESCRIPTION |
| 4RT584T | 293.83 | 0.86 | -2.110e+00 | 2.536e+00 | K | RT 584 - STRUT TEMP |
| 4RT585T | 293.93 | 0.83 | -1.889e+00 | -3.120e+00 | K | RT 585 - STRUT TEMP |
| 4RT586T | 291.25 | 0.71 | -1.578e+00 | -5.560e+00 | K | RT 586 - STRUT TEMP |
| 4RT597T | 295.94 | 1.82 | -3.271e+00 | 2.641e+01 | K | RT 597 - TFTE TEMP |
| 4RT598T | 295.49 | 1.79 | -3.239e+00 | 1.392e+01 | K | RT 598 - TFTE TEMP |
|
|
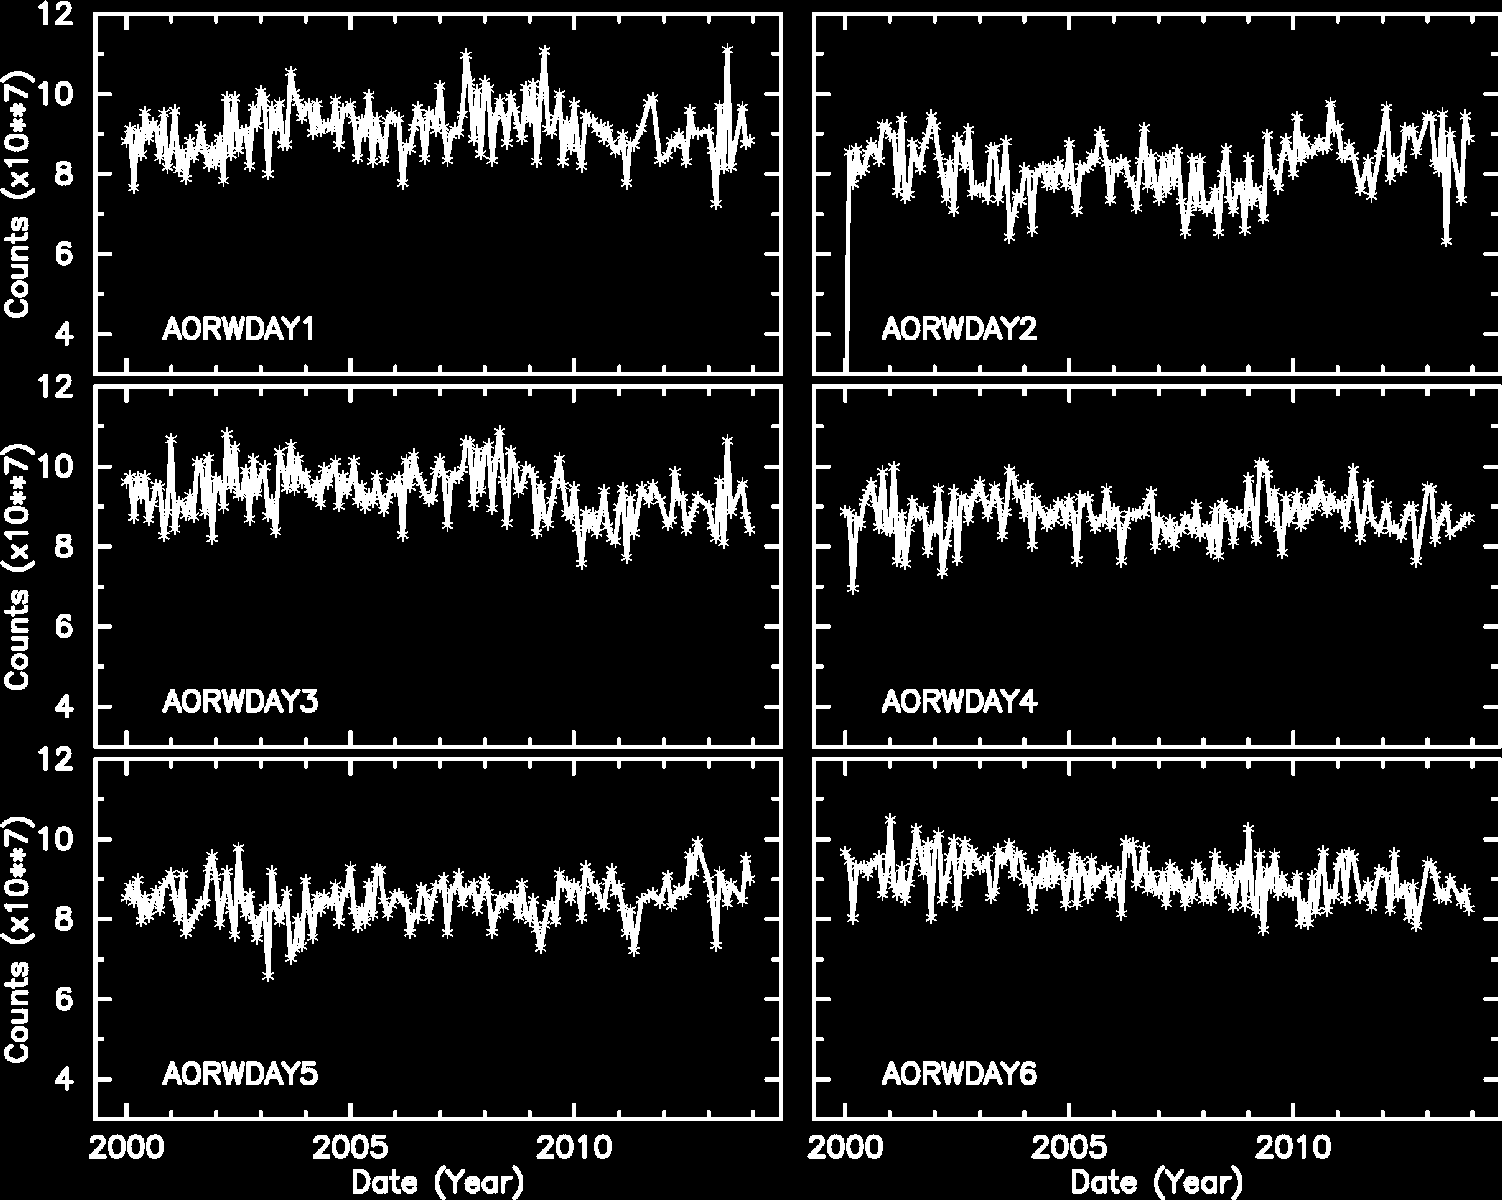
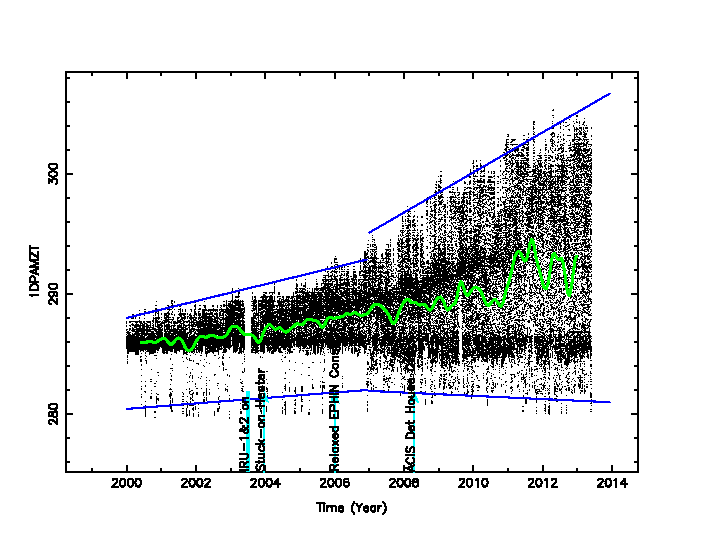
Note: From Feb 2010, the computation of reaction wheel rotations are slightly modified.
| Year | Month | |||||||||||
|---|---|---|---|---|---|---|---|---|---|---|---|---|
| 1999 | Jul | Aug | Sep | Oct | Nov | Dec | ||||||
| 2000 | Jan | Feb | Mar | Apr | May | Jun | Jul | Aug | Sep | Oct | Nov | Dec |
| 2001 | Jan | Feb | Mar | Apr | May | Jun | Jul | Aug | Sep | Oct | Nov | Dec |
| 2002 | Jan | Feb | Mar | Apr | May | Jun | Jul | Aug | Sep | Oct | Nov | Dec |
| 2003 | Jan | Feb | Mar | Apr | May | Jun | Jul | Aug | Sep | Oct | Nov | Dec |
| 2004 | Jan | Feb | Mar | Apr | May | Jun | Jul | Aug | Sep | Oct | Nov | Dec |
| 2005 | Jan | Feb | Mar | Apr | May | Jun | Jul | Aug | Sep | Oct | Nov | Dec |
| 2006 | Jan | Feb | Mar | Apr | May | Jun | Jul | Aug | Sep | Oct | Nov | Dec |
| 2007 | Jan | Feb | Mar | Apr | May | Jun | Jul | Aug | Sep | Oct | Nov | Dec |
| 2008 | Jan | Feb | Mar | Apr | May | Jun | Jul | Aug | Sep | Oct | Nov | Dec |
| 2009 | Jan | Feb | Mar | Apr | May | Jun | Jul | Aug | Sep | Oct | Nov | Dec |
| 2010 | Jan | Feb | Mar | Apr | May | Jun | Jul | Aug | Sep | Oct | Nov | Dec |
| 2011 | Jan | Feb | Mar | Apr | May | Jun | Jul | Aug | Sep | Oct | Nov | Dec |
| 2012 | Jan | Feb | Mar | Apr | May | Jun | Jul | Aug | Sep | Oct | Nov | Dec |
| 2013 | Jan | Feb | Mar | Apr | May | Jun | Jul | Aug | Sep | Oct | ||
)
)
)
)
)
)
)
)
)
)
)
)
)
)
)
)