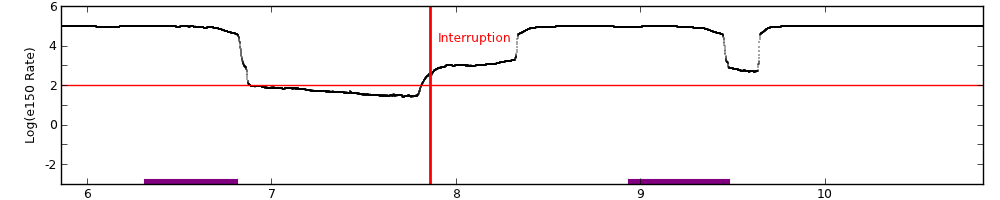
Science observations was interrupted on January 7, 20:39 (UT). Observations were restarted on January 12, with abou 365 ksec of science loss. (see details at Radiation Count Rate Plots for Periods Which Interrupted Science Runs).
The steps we took to compute the dose map are;
Please check more detail plots at Telemetered Photon Dose Trend page.
Statistics:
# IMAGE     NPIX        MEAN           RMS              MIN     MAX
ACIS_jan14 6004901       8.239         14.732           0.0     663


I2 node 0  262654   11.119968   4.319739    0.0  76.0
I2 node 1  262654   11.576397   4.930068    0.0 358.0
I2 node 2  262654   11.303730   4.183094    0.0  69.0
I2 node 3  262654   11.307726   4.674589    0.0 374.0

I3 node 0  262654   11.362739   4.737994    0.0  79.0
I3 node 1  262654   11.632931   9.826728    0.0 335.0
I3 node 2  262654   10.715933   4.032748    0.0  85.0
I3 node 3  262654   11.100468   4.309757    0.0 209.0

S2 node 0  262654   7.805067    3.308727    0.0  47.0
S2 node 1  262654   7.678128    3.455256    0.0  53.0
S2 node 2  262654   7.752018    3.396836    0.0  56.0
S2 node 3  262654   8.097879    3.451098    0.0 295.0

S3 node 0  262654   18.777639   32.564781   0.0 287.0
S3 node 1  262654   17.542523   25.555297   0.0 263.0
S3 node 2  262654   9.353366    3.327461    0.0  49.0
S3 node 3  262654   8.241441    3.039366    0.0  30.0
Statistics:
 IMAGE        NPIX      MEAN             RMS            MIN    MAX
ACIS_total   6004901    1765.767         2328.739       0.0   103461


I2 node 0  262654   1497.354324 296.359832     0.0   8980.0
I2 node 1  262654   1574.134638 398.921154     0.0  36393.0
I2 node 2  262654   1601.878502 343.172075     0.0   6851.0
I2 node 3  262654   1598.401778 405.706272     0.0   9404.0

I3 node 0  262654   1674.394086 409.272772     0.0   6585.0
I3 node 1  262654   1758.054306 1336.260234    0.0  33960.0
I3 node 2  262654   1534.896624 284.619003     0.0   7707.0
I3 node 3  262654   1521.292957 303.365994     0.0  26313.0

S2 node 0  262654   2118.501042 323.901346  1105.0  28672.0
S2 node 1  262654   2256.337169 496.477372  1153.0  12437.0
S2 node 2  262654   2494.206702 487.675215  1491.0  42240.0
S2 node 3  262654   2427.655168 365.586584  1440.0  40549.0

S3 node 0  262654   3714.285214 1743.024218 1521.0  12820.0
S3 node 1  262654   4788.773833 1931.143227    0.0  13112.0
S3 node 2  262654   3695.186814 924.860131  1498.0   9258.0
S3 node 3  262654   2895.722724 447.706286  1652.0   9418.0
)
|
)
|
)
|
)
|
| Oct 2013 | Jul 2013 | Apr 2013 | Jan 0213 |
|---|
We report CTIs with a refined data definition. CTIs were computed for the temperature dependency corrected data. Please see CTI page for detailed explanation. CTI's are computed for Mn K alpha, and defined as slope/intercept x10^4 of row # vs ADU. Data file: here
| The Mean (max) FPT: | |
|---|---|
| -111.29 | +/- 5.96 C |
| Mean Width: | |
| 0.05 | +/- 1.71 days |
We are using 10 period moving averages to show trends of peak temperatures and peak widths. Note, the gaps in the width plot are due to missing/corrupted data.
The plots below were generated with a new warm pixel finding script. Please see Acis Bad Pixel Page for details.
| Name | Low (keV) | High(KeV) | Description |
|---|---|---|---|
| SSoft | 0.00 | 0.50 | Super soft photons |
| Soft | 0.50 | 1.00 | Soft photons |
| Med | 1.00 | 3.00 | Moderate energy photons |
| Hard | 3.00 | 5.00 | Hard Photons |
| Harder | 5.00 | 10.00 | Very Hard photons |
| Hardest | 10.00 | Beyond 10 keV |
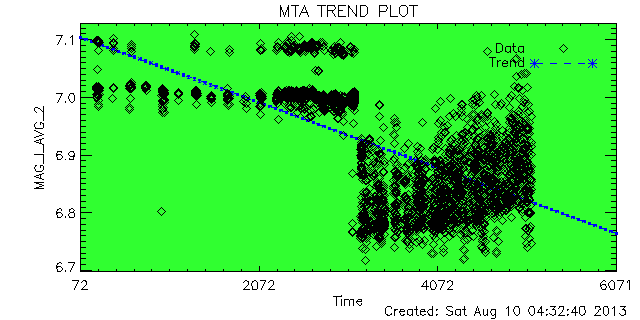
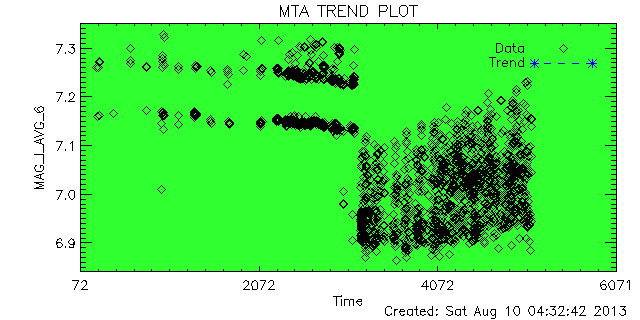
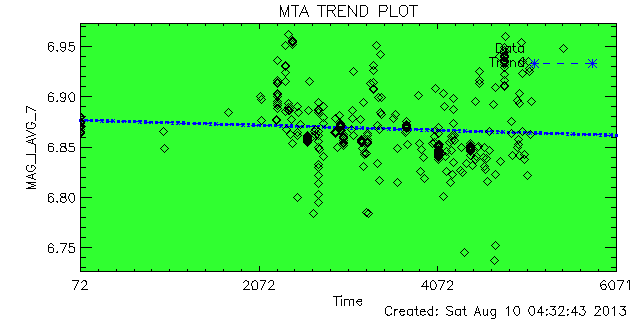
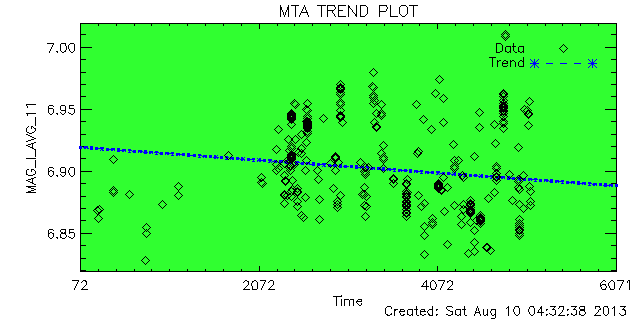
We plot the average corner pixel centroid slope and mean for ACIS observations. Separate plots are shown for FAINT MODE (3X3) and VFAINT MODE (5X5) observations. Metric is the centroid of a Gaussian fit to the histogram of corner pixel PHA values of detected events. Plus signs are FAINT observations, diamonds are VFAINT observations, and boxes are VFAINT observations with centroids computed using only the corner pixels of a 3X3 event island (referred to as AFAINT). We see a very small upward trend.
The bias plus overclock level was calculated as follows:
An example of Overclock values as reported in FITS file header:
An example of mean bias minus overclock value:
Please refer to Maximum Dose Trends for more details.
)
        IMAGE                NPIX      MEAN    STDDEV      MIN       MAX
HRCI_01_2014.fits          16777216   0.006    0.0793      0.0       4.0
)
        IMAGE                NPIX      MEAN    STDDEV      MIN       MAX
HRCI_08_1999_01_2014.fits  16777216   4.104    4.834       0.0       292.0
No Data
)
        IMAGE                NPIX     MEAN      STDDEV      MIN      MAX
HRCS_08_1999_01_2014.fits  16777216  15.363     26.873      0.0      1679.0
|
|
Max dose trend plots corrected for events that "pile-up"
in the center of the taps due to bad position information.
|
)
|
)
|
)
|
)
|
| Oct 2013 | Feb 2013 | Apr 2013 | Jan 2013 |
|---|
)
|
)
|
)
|
)
|
| Oct 2013 | Jul 2013 | Apr 2013 | Jan 2013 |
|---|
We plot the width of the zero order streak of ACIS/HETG observations and the width of the zero order image for HRC/LETG observations of point sources. No significant defocusing trend is seen at this time. See Gratings Focus pages.
| Previous Quarter | ||||||
| MSID | MEAN | RMS | DELTA/YR | DELTA/YR/YR | UNITS | DESCRIPTION |
| 5EIOT | 355.53 | 19.42 | 4.379e+00 | 1.315e+02 | K | EIO TEMP |
| 5EPHINT | 331.59 | 5.75 | 1.422e+01 | -4.496e+02 | K | EPHIN TEMP |
| HKEBOXTEMP | 336.71 | 6.05 | 1.458e+01 | -4.227e+02 | K | EPHIN HOUSEKEEPING EBOX: TEMPERATURE (5EHSE300) |
| TEIO | 329.89 | 20.77 | 1.735e-01 | 6.366e+01 | K | EPHIN ELECTRONICS HOUSING TEMP |
| TEPHIN | 332.07 | 6.28 | 1.415e+01 | -4.050e+02 | K | EPHIN SENSOR HOUSING TEMP |
|
|
Note: From Feb 2010, the computation of reaction wheel rotations are slightly modified.
| Year | Month | |||||||||||
|---|---|---|---|---|---|---|---|---|---|---|---|---|
| 1999 | Jul | Aug | Sep | Oct | Nov | Dec | ||||||
| 2000 | Jan | Feb | Mar | Apr | May | Jun | Jul | Aug | Sep | Oct | Nov | Dec |
| 2001 | Jan | Feb | Mar | Apr | May | Jun | Jul | Aug | Sep | Oct | Nov | Dec |
| 2002 | Jan | Feb | Mar | Apr | May | Jun | Jul | Aug | Sep | Oct | Nov | Dec |
| 2003 | Jan | Feb | Mar | Apr | May | Jun | Jul | Aug | Sep | Oct | Nov | Dec |
| 2004 | Jan | Feb | Mar | Apr | May | Jun | Jul | Aug | Sep | Oct | Nov | Dec |
| 2005 | Jan | Feb | Mar | Apr | May | Jun | Jul | Aug | Sep | Oct | Nov | Dec |
| 2006 | Jan | Feb | Mar | Apr | May | Jun | Jul | Aug | Sep | Oct | Nov | Dec |
| 2007 | Jan | Feb | Mar | Apr | May | Jun | Jul | Aug | Sep | Oct | Nov | Dec |
| 2008 | Jan | Feb | Mar | Apr | May | Jun | Jul | Aug | Sep | Oct | Nov | Dec |
| 2009 | Jan | Feb | Mar | Apr | May | Jun | Jul | Aug | Sep | Oct | Nov | Dec |
| 2010 | Jan | Feb | Mar | Apr | May | Jun | Jul | Aug | Sep | Oct | Nov | Dec |
| 2011 | Jan | Feb | Mar | Apr | May | Jun | Jul | Aug | Sep | Oct | Nov | Dec |
| 2012 | Jan | Feb | Mar | Apr | May | Jun | Jul | Aug | Sep | Oct | Nov | Dec |
| 2013 | Jan | Feb | Mar | Apr | May | Jun | Jul | Aug | Sep | Oct | Nov | Dec |
)
)
)
)
)
)
)
)
)
)
)