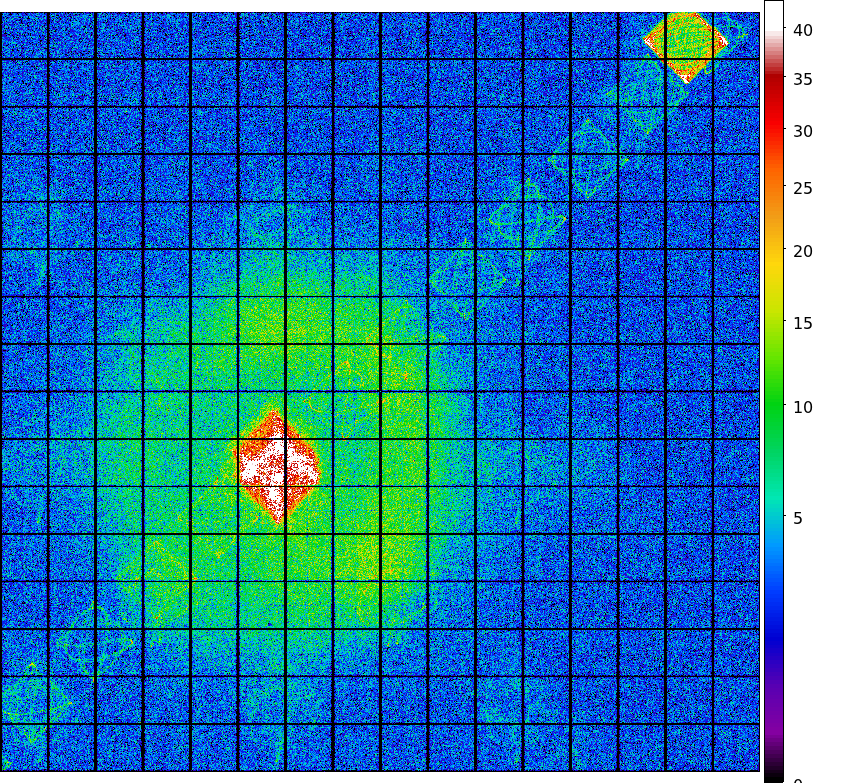
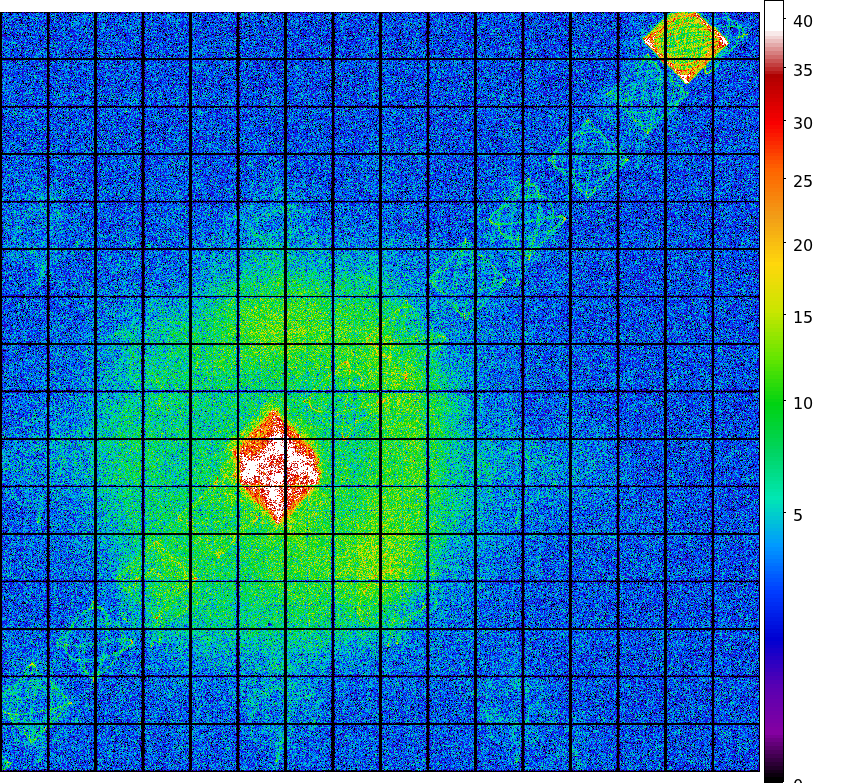
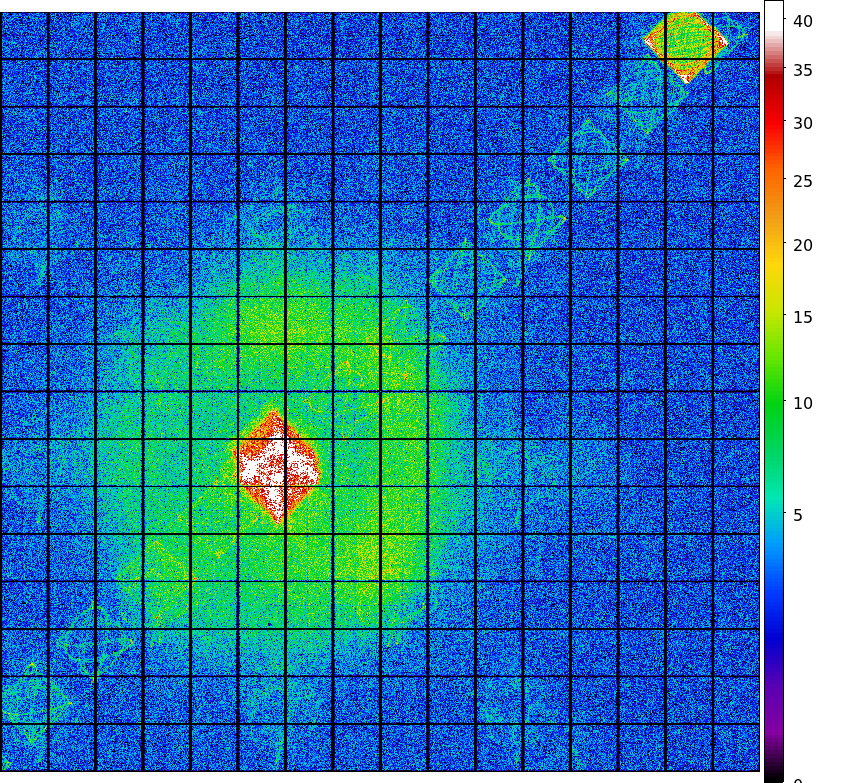
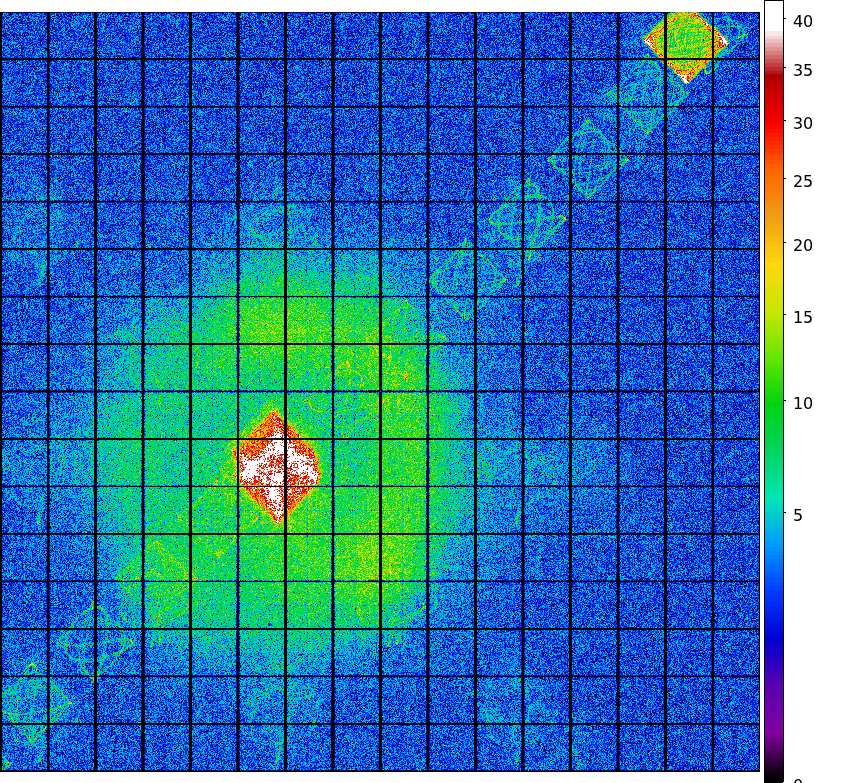
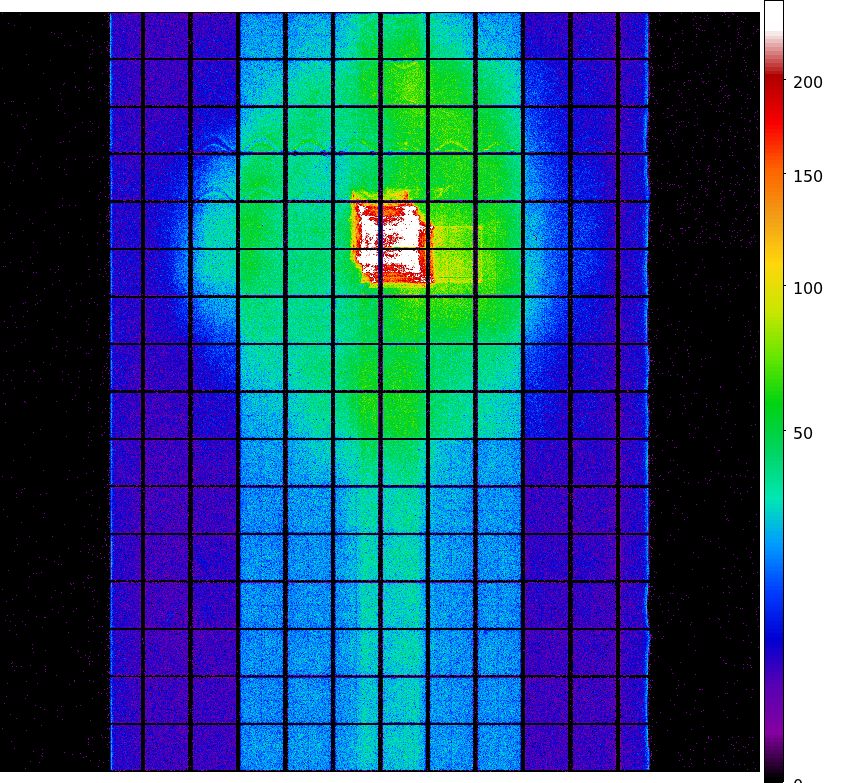
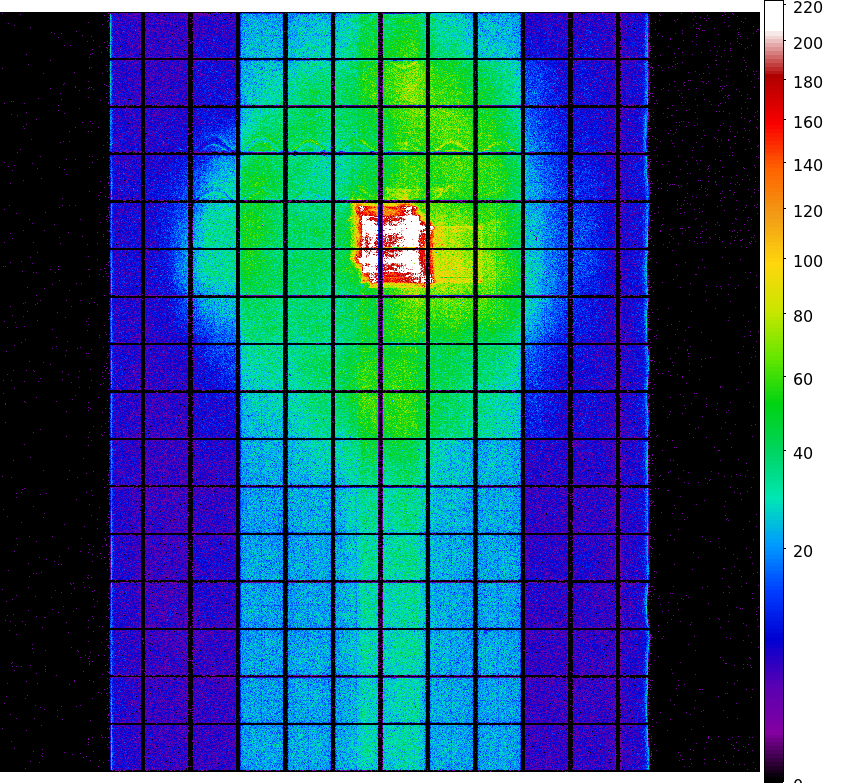
Apr Dose Map
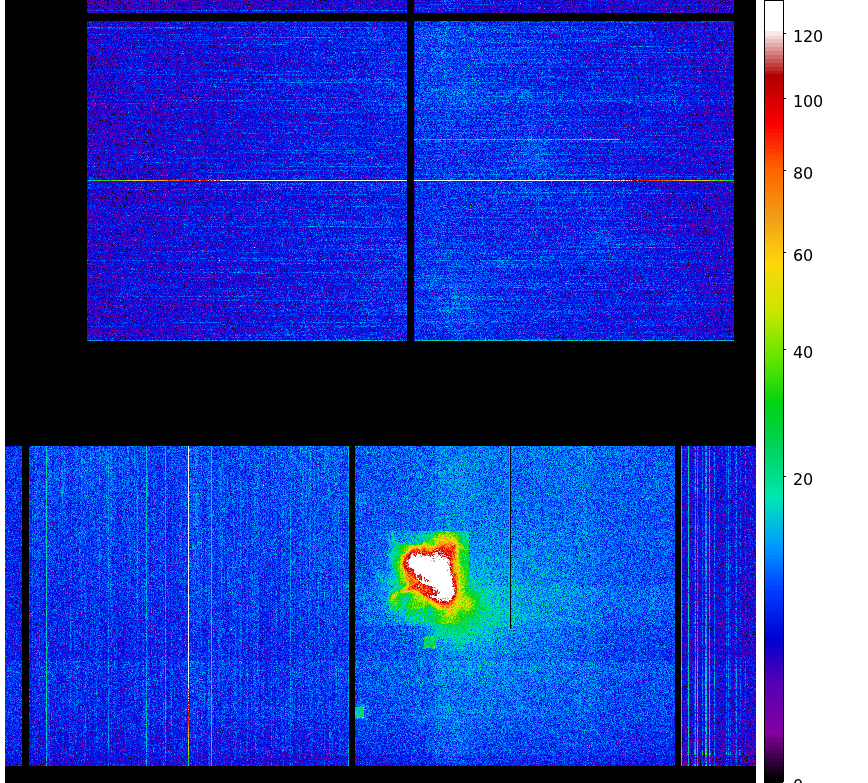
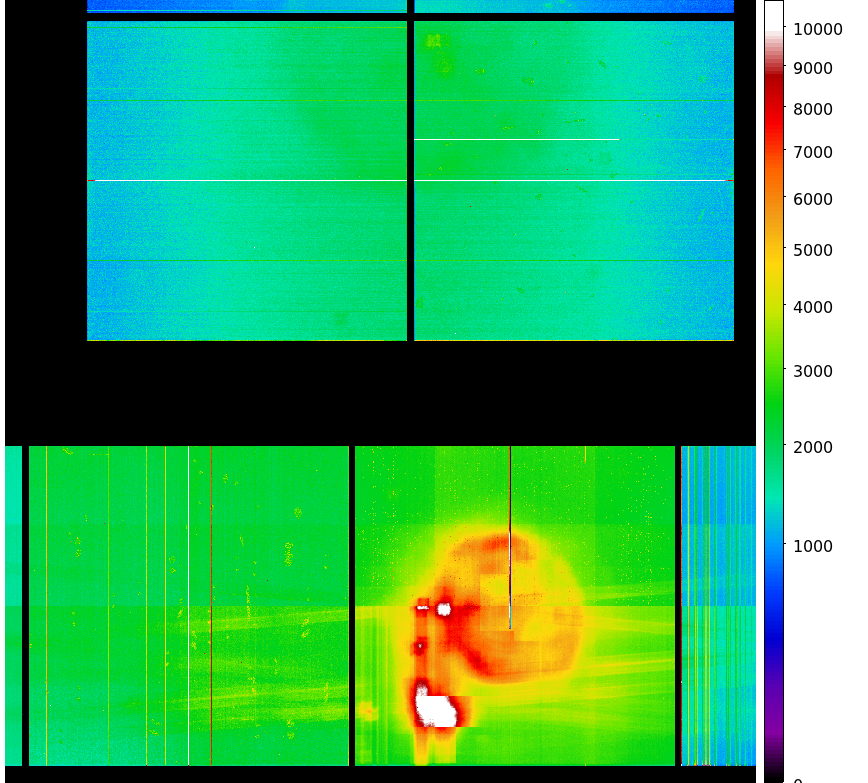
TOTAL
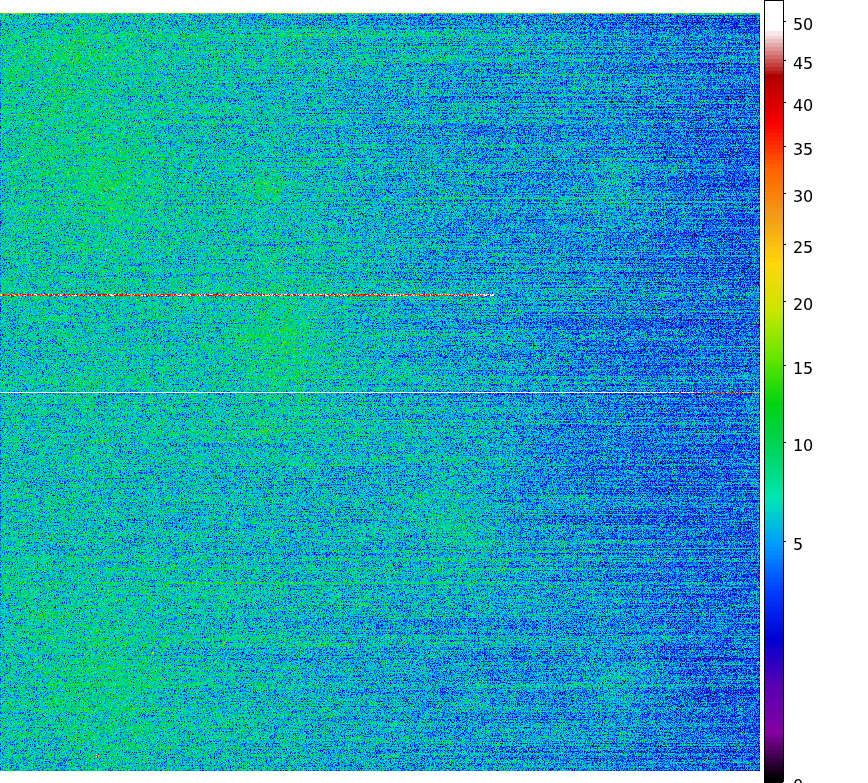
CCD I3
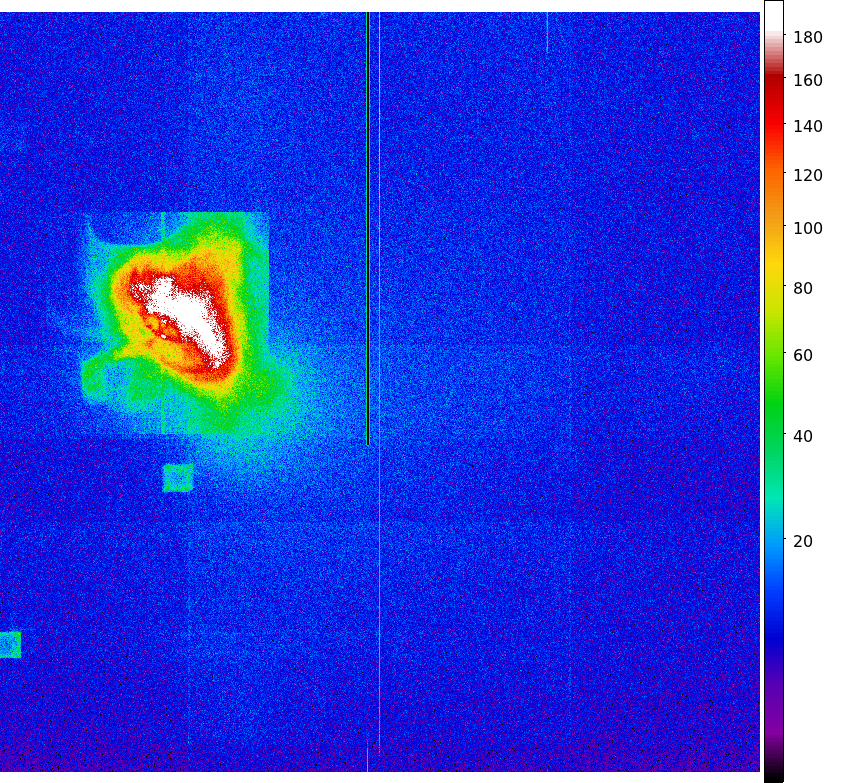
CCD S3
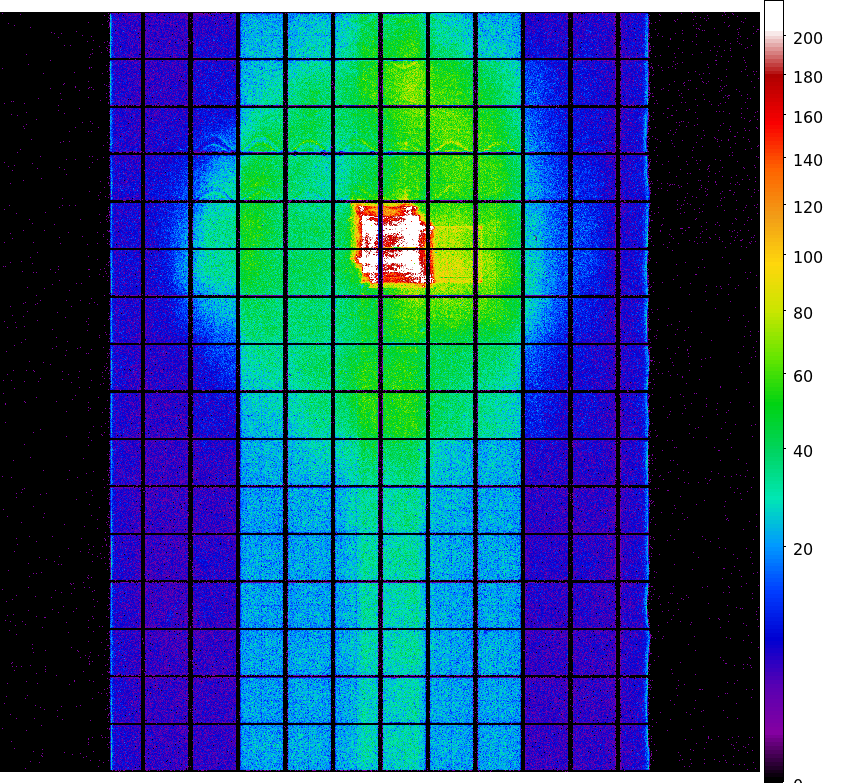
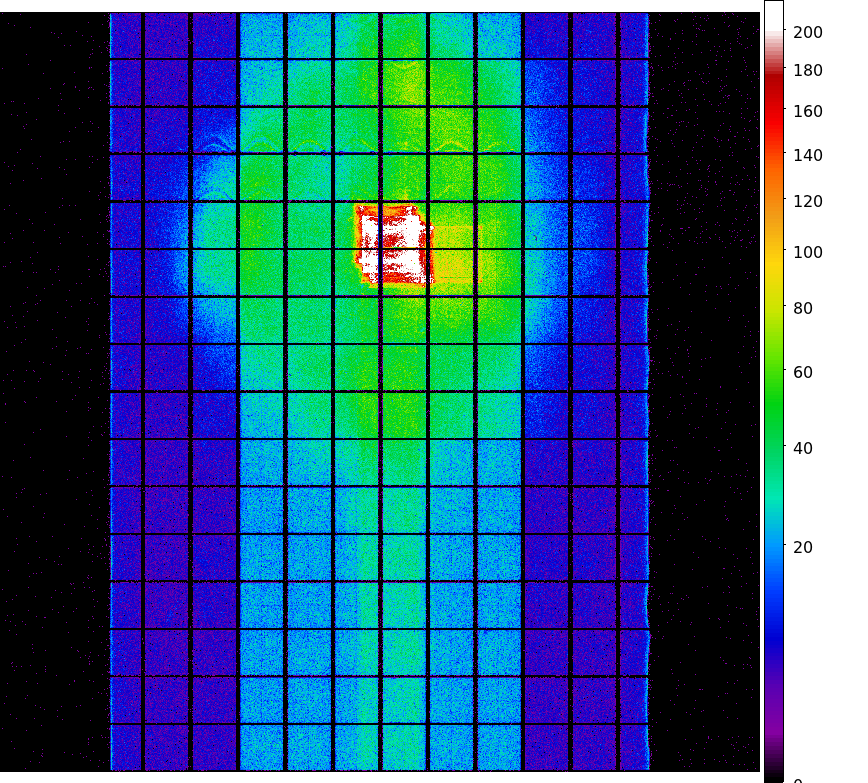
The steps we took to compute the dose map are;
Please check more detail plots at Telemetered Photon Dose Trend page.
Statistics:
# IMAGE     NPIX        MEAN           RMS              MIN     MAX
ACIS_apr14 6004901      6.117          11.690           0.0     1523


I2 node 0  262654   5.042107    3.932449    0.0 1523.0
I2 node 1  262654   5.143035    2.829947    0.0  307.0
I2 node 2  262654   5.015190    2.552085    0.0   40.0
I2 node 3  262654   5.145186    4.013764    0.0 1518.0

I3 node 0  262654   6.228551    2.986787    0.0   34.0
I3 node 1  262654   6.485146    5.311605    0.0  297.0
I3 node 2  262654   5.930261    2.775927    0.0   46.0
I3 node 3  262654   6.002621    2.860615    0.0  204.0

S2 node 0  262654   6.943616    3.004395    0.0   38.0
S2 node 1  262654   7.053754    3.292926    0.0   44.0
S2 node 2  262654   7.405779    5.510373    0.0 1512.0
S2 node 3  262654   7.416354    3.135740    0.0  344.0

S3 node 0  262654   17.358138   29.457278   0.0  293.0
S3 node 1  262654   19.608275   28.835145   0.0  289.0
S3 node 2  262654   9.885689    3.411069    0.0   35.0
S3 node 3  262654   8.335267    3.025413    0.0   25.0
Statistics:
 IMAGE        NPIX      MEAN             RMS            MIN    MAX
ACIS_total   6004901    1783.629         2350.005       0.0   104258


I2 node 0  262654   1515.059032 300.253727     0.0   9016.0
I2 node 1  262654   1592.613297 405.399440     0.0  37104.0
I2 node 2  262654   1619.730213 346.761242     0.0   7023.0
I2 node 3  262654   1616.611824 410.758174     0.0   9422.0

I3 node 0  262654   1694.547852 414.022899     0.0   6649.0
I3 node 1  262654   1779.362133 1351.445203    0.0  34321.0
I3 node 2  262654   1554.117459 288.553832     0.0   7837.0
I3 node 3  262654   1540.546818 308.125470     0.0  26537.0

S2 node 0  262654   2138.293911 326.654584  1120.0  28687.0
S2 node 1  262654   2276.924202 501.347859  1166.0  12539.0
S2 node 2  262654   2517.623767 492.247327  1511.0  42315.0
S2 node 3  262654   2453.137763 369.997775  1454.0  41098.0

S3 node 0  262654   3753.998663 1750.148029 1540.0  12848.0
S3 node 1  262654   4829.871919 1941.940450    0.0  13146.0
S3 node 2  262654   3723.413929 928.949175  1509.0   9302.0
S3 node 3  262654   2919.388017 450.205170  1666.0   9474.0
|
|
|
|
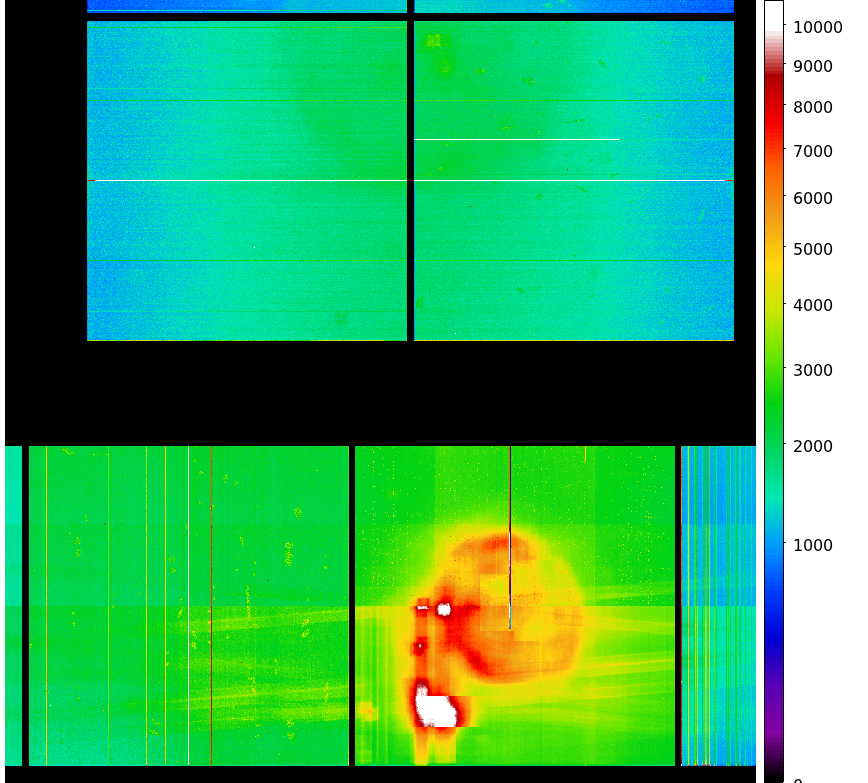
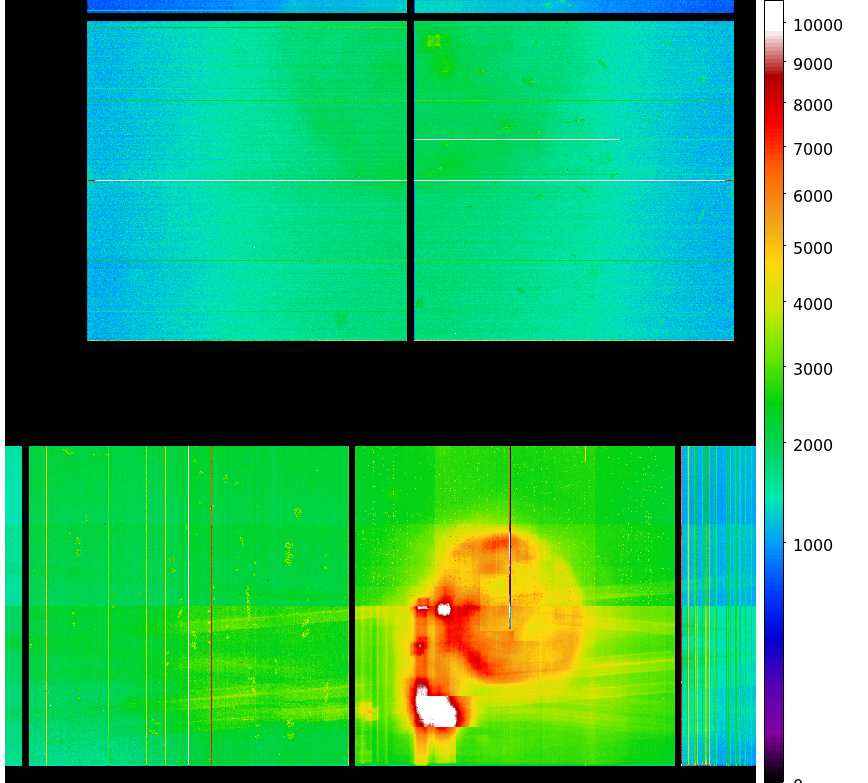
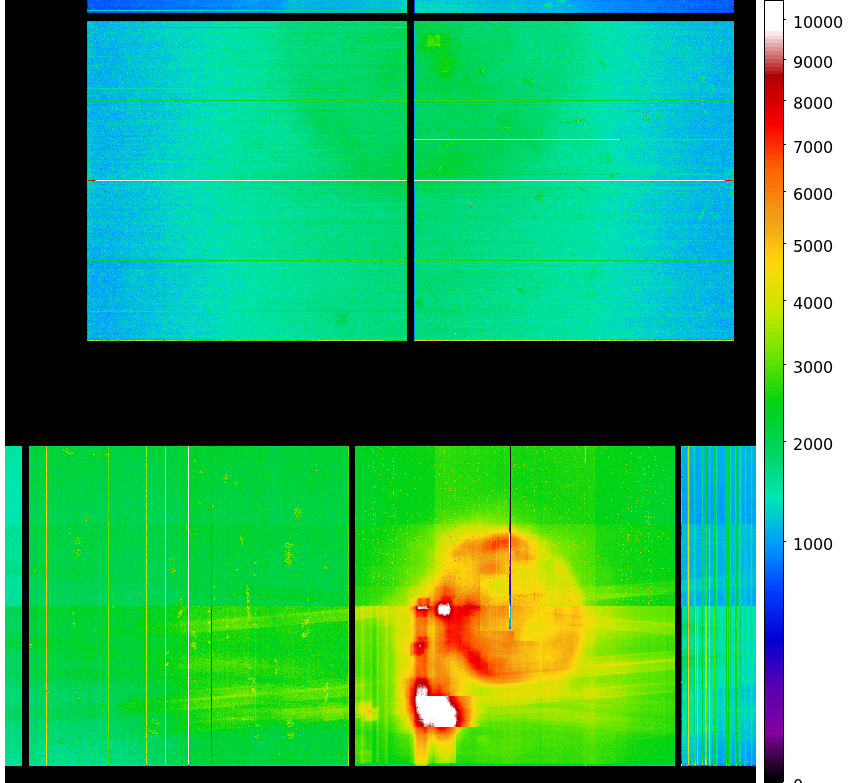
| Jan 2014 | Oct 2013 | Jul 2013 | Apr 0213 |
|---|
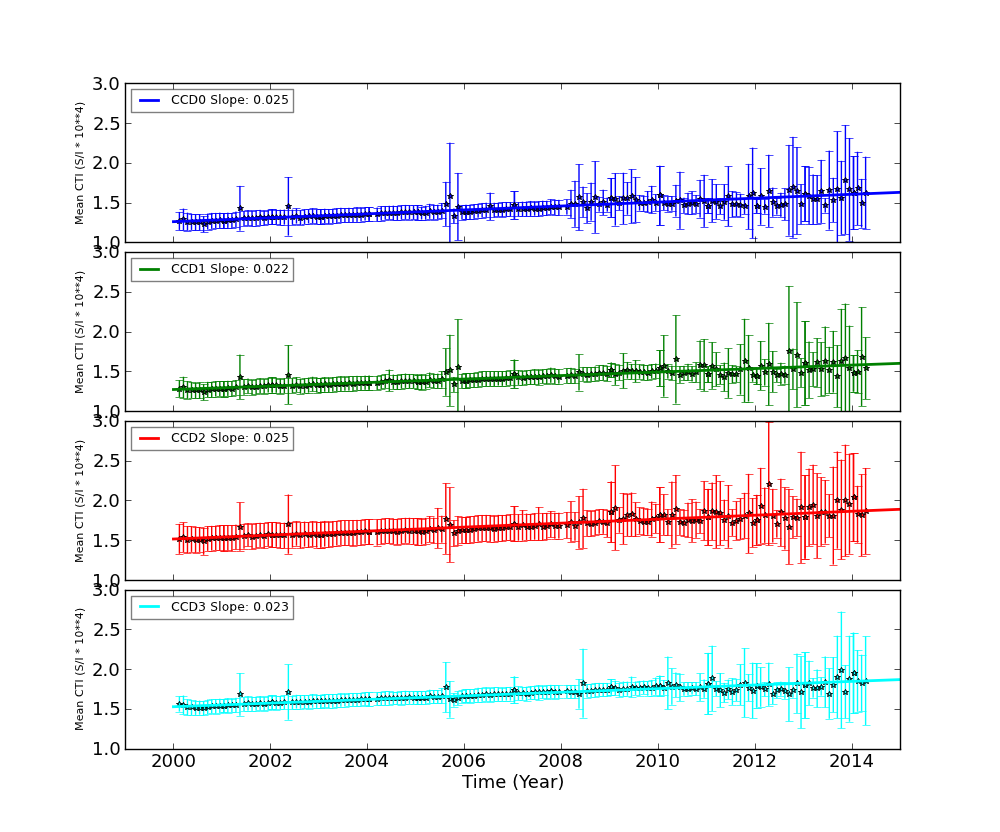
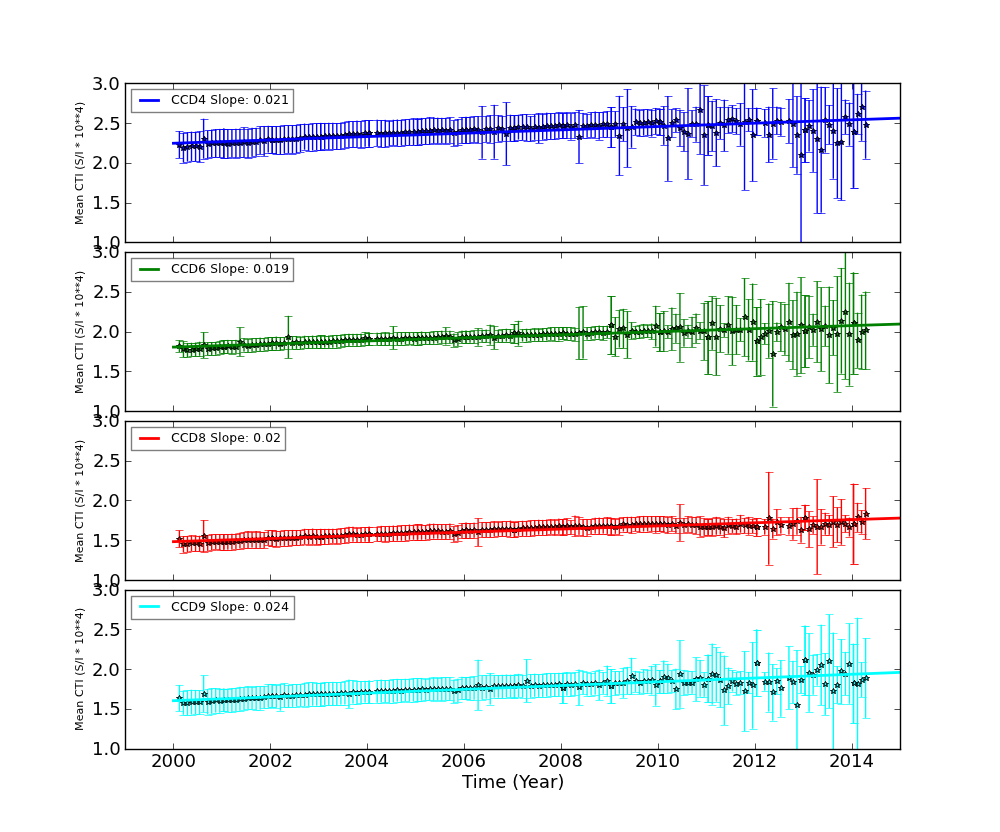
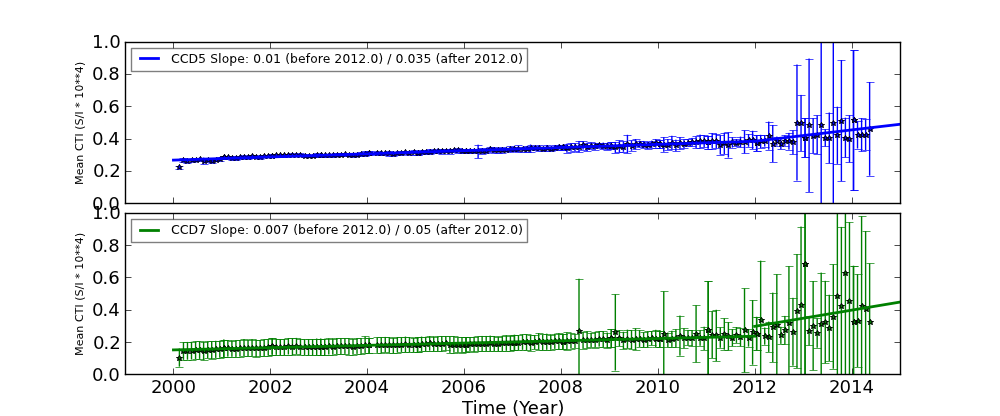
We report CTIs with a refined data definition. CTIs were computed for the temperature dependency corrected data. Please see CTI page for detailed explanation. CTI's are computed for Mn K alpha, and defined as slope/intercept x10^4 of row # vs ADU. Data file: here
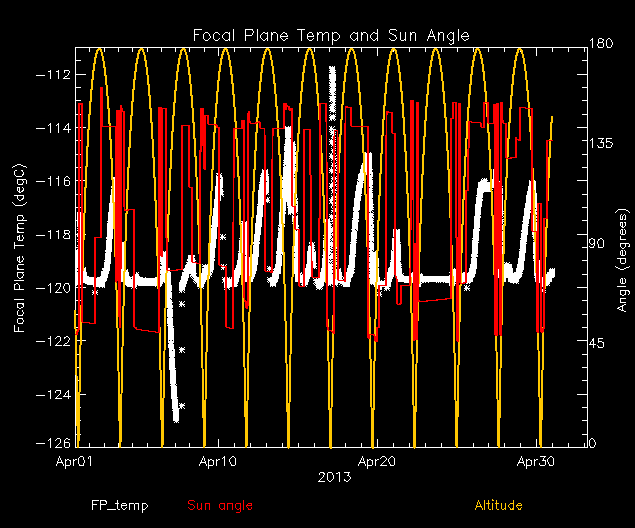
| The Mean (max) FPT: | |
|---|---|
| -117.05 | +/- 1.86 C |
| Mean Width: | |
| 0.44 | +/- 0.48 days |
We are using 10 period moving averages to show trends of peak temperatures and peak widths. Note, the gaps in the width plot are due to missing/corrupted data.

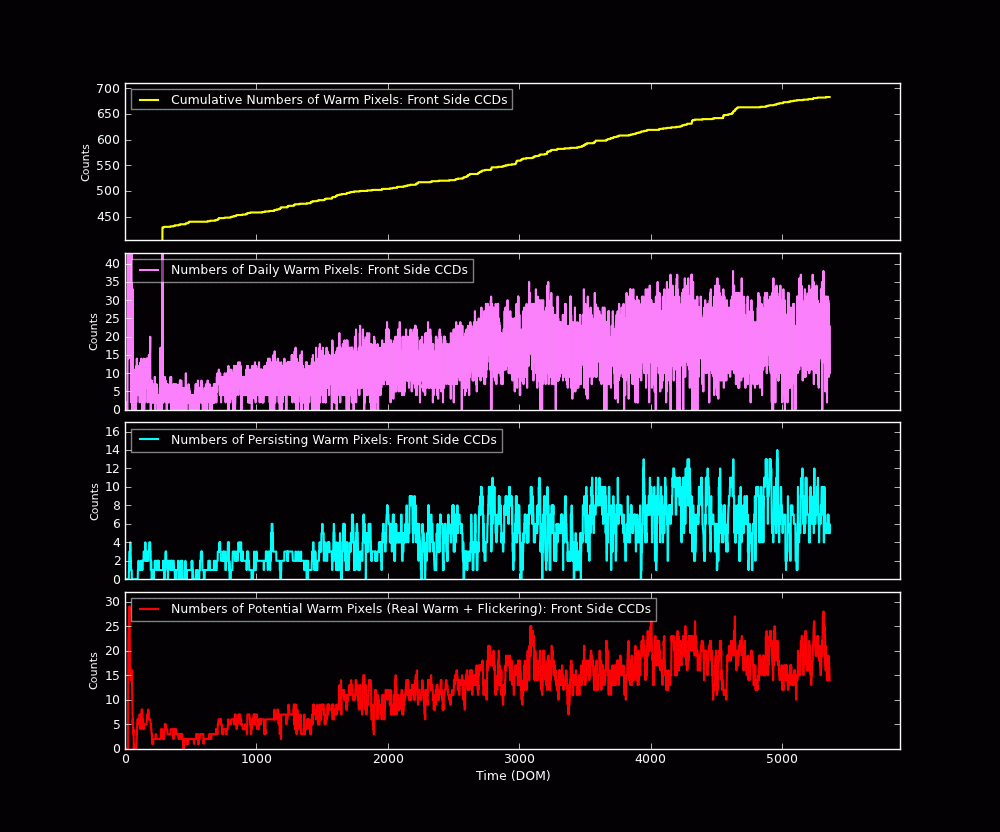
The plots below were generated with a new warm pixel finding script. Please see Acis Bad Pixel Page for details.

| Name | Low (keV) | High(KeV) | Description |
|---|---|---|---|
| SSoft | 0.00 | 0.50 | Super soft photons |
| Soft | 0.50 | 1.00 | Soft photons |
| Med | 1.00 | 3.00 | Moderate energy photons |
| Hard | 3.00 | 5.00 | Hard Photons |
| Harder | 5.00 | 10.00 | Very Hard photons |
| Hardest | 10.00 | Beyond 10 keV |
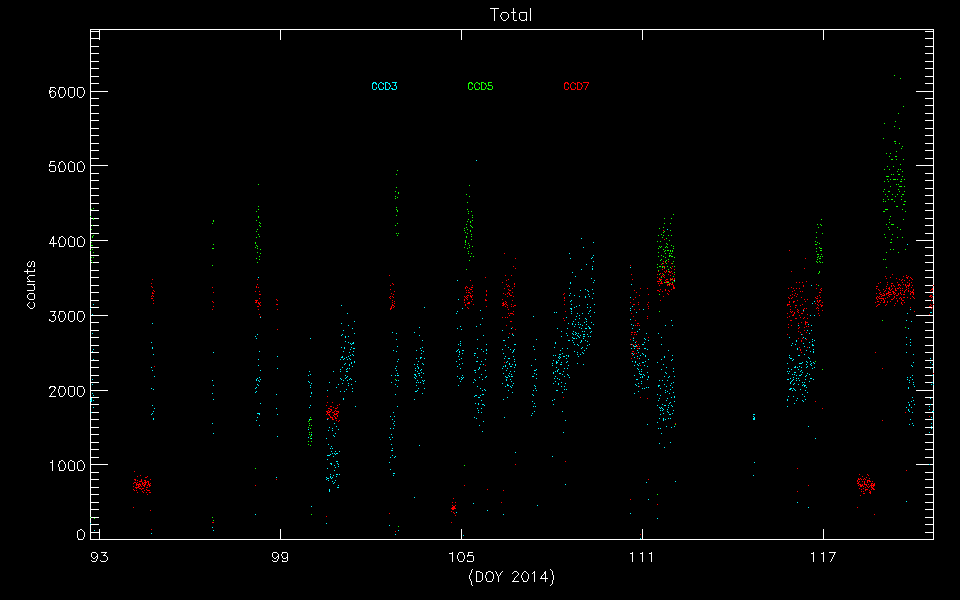
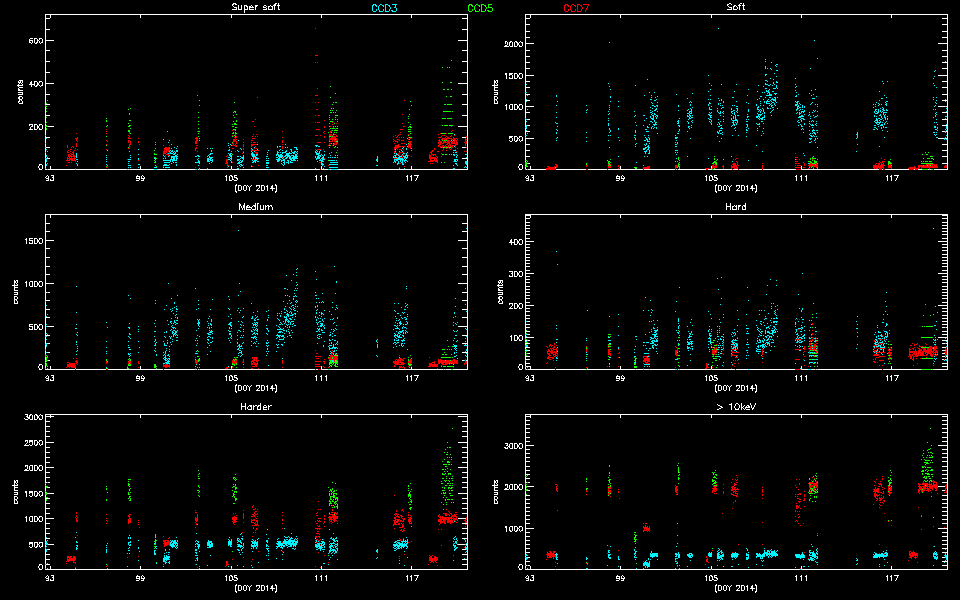
Please refer to Maximum Dose Trends for more details.
        IMAGE                NPIX      MEAN    STDDEV      MIN       MAX
HRCI_04_2014.fits          16777216   0.012    0.3429      0.0       11.0
        IMAGE                NPIX      MEAN    STDDEV      MIN       MAX
HRCI_08_1999_04_2014.fits  16777216   4.254    4.866       0.0       292.0
          IMAGE                NPIX      MEAN    STDDEV      MIN       MAX
HRCS_04_2014.fits          16777216     0.031    0.1796     0.0         6.0
        IMAGE                NPIX     MEAN      STDDEV      MIN      MAX
HRCS_08_1999_04_2014.fits  16777216  15.425     26.984      0.0      1679.0

|
|
Max dose trend plots corrected for events that "pile-up"
in the center of the taps due to bad position information.
|
|
|
|
|
| Jan 2014 | Oct 2013 | Jul 2013 | Apr 2013 |
|---|
|
|
|
|
| Jan 2014 | Oct 2013 | Jul 2013 | Apr 2013 |
|---|
We plot the width of the zero order streak of ACIS/HETG observations and the width of the zero order image for HRC/LETG observations of point sources. No significant defocusing trend is seen at this time. See Gratings Focus pages.

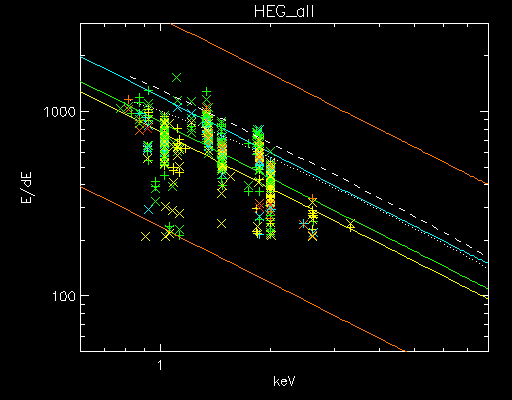
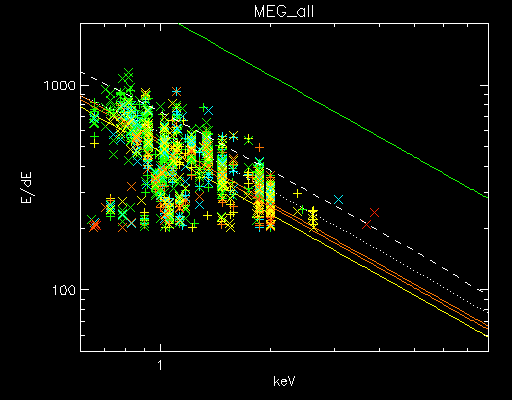
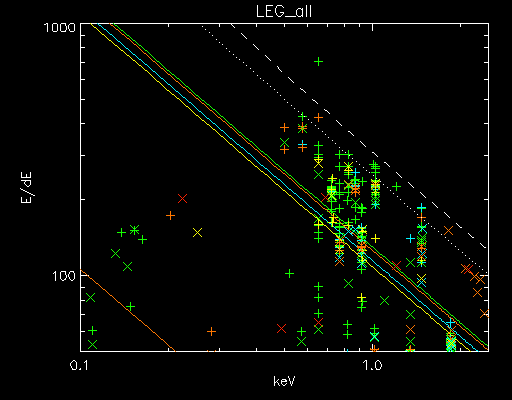
We plot E/dE vs. E for fits to detected lines with fwhm_error/fwhm less than 0.15 for the plus and minus arms of HEG, MEG, and LEG. Also shown are conservative (dotted line) and optimistic (dashed line) pre-launch resolving power expectations.
We have selected only calibration observations of Capella, HR1099, and Sigma Gem. See MIT technotes for a parallel analysis.
| Plot symbol indicates dispersion arm: | Color indicates observation date: |
Minus side = cross (x) |
A002-2004 blue 2005-2006 yellow 2007-2009 orange |
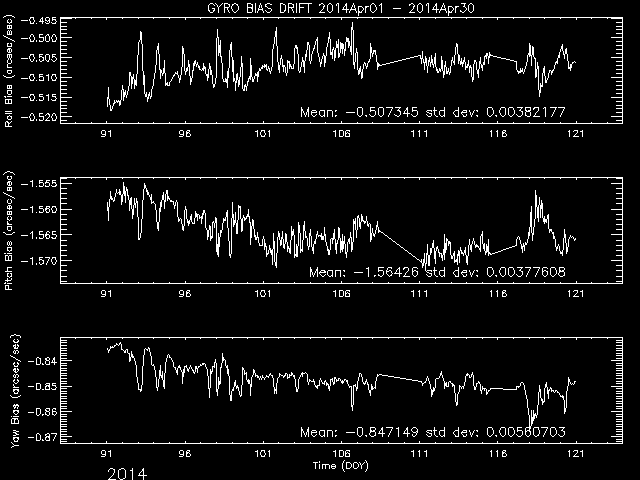
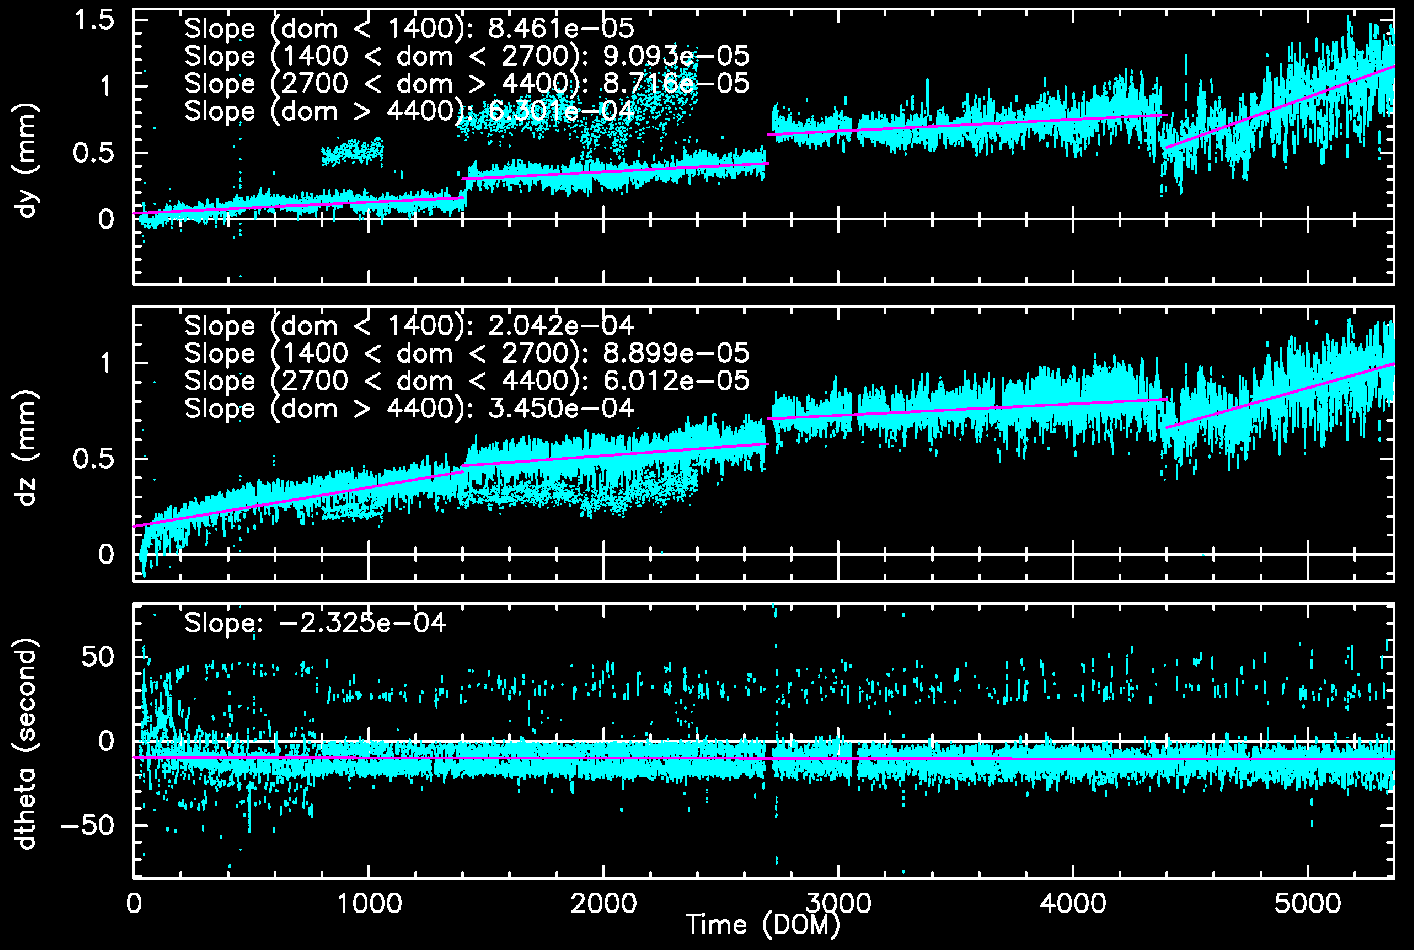
SIM Shift and Twist Trend The following plots show trends of SIM shifts (dy and dz) and twist (dtheta). All quantities are directly taken from pcaf*_asol1.fits files. The units are mm for dy and dz, and degree for dtheta. We fit three lines separated before and after (Days of Mission)= 1400 (May 21, 2003), 2700 (Dec 11, 2006), and 4400 (Aug 07, 2011). The unit of slopes are mm per day or degree per day.
The sudden shift around DOM = 1400, 2700 and 4400 are due to fid light drift (see a memo by Aldcroft fiducial light drift). On the dtheta plot, two tracks are clearly observed. The track around 0.01 is due to HRC-I, and all others are clustered around -0.002. For more detail, please see SIM Shift and Twist Trend page
| Previous Quarter | ||||||
| MSID | MEAN | RMS | DELTA/YR | DELTA/YR/YR | UNITS | DESCRIPTION |
| 3RCTUBPT | 272.59 | 10.29 | -9.055e+00 | 2.599e-12 | K | RCTU BASEPLATE (+X) |
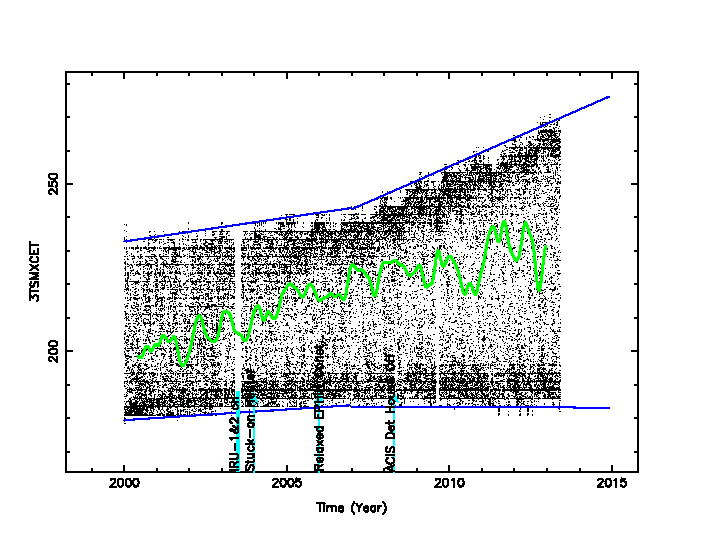
| 3TSMXCET | 232.10 | 3.399e+01 | 2.580e+00 | 4.771e-13 | K | -X TURTLE SHELL NR HRC CEA |
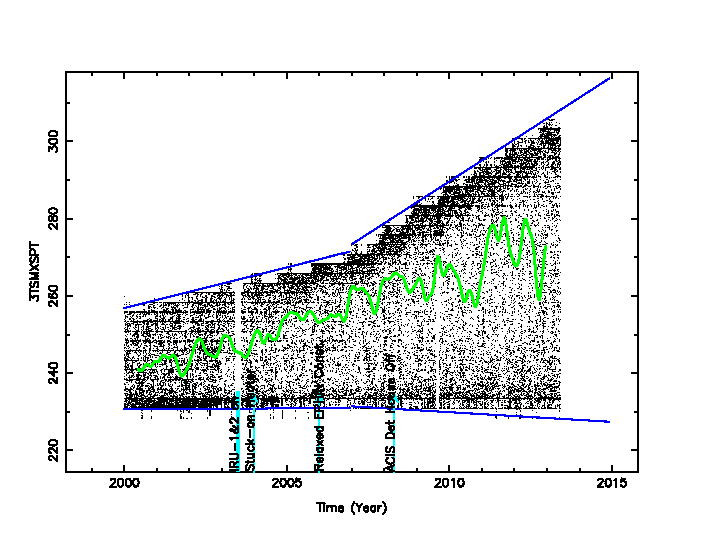
| 3TSMXSPT | 273.82 | 31.29 | 6.226e+00 | -2.854e-12 | K | -X TURTLE SHELL NR ACIS SS |
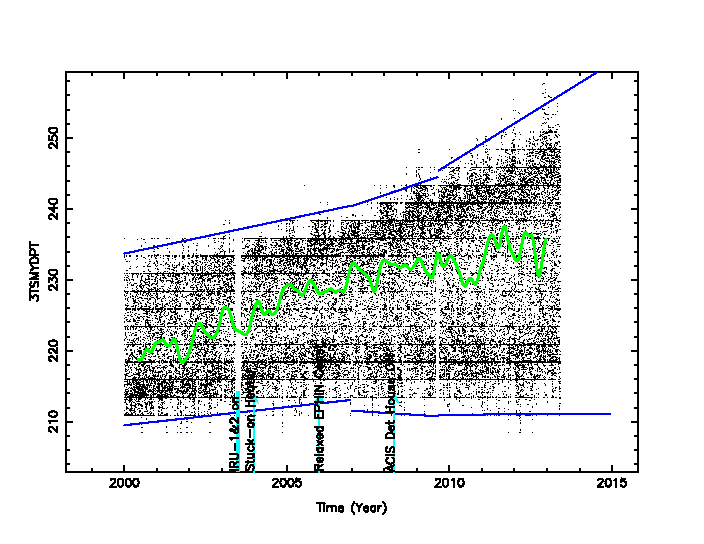
| 3TSMYDPT | 235.37 | 13.04 | -3.420e-01 | 7.418e-14 | K | -Y TURTLE SHELL NR ACIS DPA |
| Previous Quarter | ||||||
| MSID | MEAN | RMS | DELTA/YR | DELTA/YR/YR | UNITS | DESCRIPTION |
| EOEB1CIC | 6.300e-03 | 1.745e-02 | -3.001e-04 | -4.389e-02 | EB1CI) | BATTERY 1 CHARGE CURRENT - COUNTS ( |
| EOEB1DIC | 2.994e-04 | 8.284e-04 | -6.174e-05 | -1.078e-03 | (EB1DI) | BATTERY 1 DISCHARGE CURRENT - COUNTS |
| EOEB1VC | 0.65 | 1.79 | -1.305e-01 | -2.364e+00 | COUNTS | BATTERY 1 VOLTAGE - |
| EOEB2CIC | 6.766e-03 | 1.872e-02 | -1.048e-03 | -3.276e-02 | EB2CI) | BATTERY 2 CHARGE CURRENT - COUNTS ( |
| EOEB2VC | 0.65 | 1.79 | -1.299e-01 | -2.381e+00 | COUNTS | VOLTAGE - |
| EOEB3CIC | 6.363e-03 | 1.761e-02 | -1.276e-03 | -2.438e-02 | EB3CI) | BATTERY 3 CHARGE CURRENT - COUNTS ( |
| EOEB3VC | 0.65 | 1.79 | -1.294e-01 | -2.359e+00 | COUNTS | BATTERY 3 VOLTAGE - |
| EOECNV1C | 0.30 | 0.82 | -6.021e-02 | -1.076e+00 | (ECNV1V) | PCU CONVERTER 1: +15V OUTPUT - ANALOG |
| EOECNV2C | 0.30 | 0.82 | -6.024e-02 | -1.060e+00 | (ECNV2V) | PCU CONVERTER 2: +15V OUTPUT - ANALOG |
| EOECNV3C | 0.31 | 0.84 | -6.135e-02 | -1.119e+00 | (ECNV3V) | PCU CONVERTER 3: +15V OUTPUT - ANALOG |
| EOESAC1C | 0.25 | 0.70 | -4.113e-02 | -9.167e-01 | (ESAMYI) | -Y SOLAR ARRAY CURRENT - COUNTS |
| EOESAC2C | 0.25 | 0.70 | -5.261e-02 | -2.067e-01 | (ESAPYI) | +Y SOLAR ARRAY CURRENT - COUNTS |
| Previous Quarter | ||||||
| MSID | MEAN | RMS | DELTA/YR | DELTA/YR/YR | UNITS | DESCRIPTION |
| TAPE2PST | 289.65 | 0.95 | 4.349e+00 | 1.863e+01 | K | PEA-2 POWER SUPPLY TEMP |
| TSAMYT | 321.99 | 0.68 | 4.632e+00 | -7.022e+01 | K | -Y WING SOLAR ARRAY TEMP |
| TSAPYT | 321.71 | 0.66 | 4.722e+00 | -8.005e+01 | K | +Y WING SOLAR ARRAY TEMP |
|
|

Note: From Feb 2010, the computation of reaction wheel rotations are slightly modified.
| Year | Month | |||||||||||
|---|---|---|---|---|---|---|---|---|---|---|---|---|
| 1999 | Jul | Aug | Sep | Oct | Nov | Dec | ||||||
| 2000 | Jan | Feb | Mar | Apr | May | Jun | Jul | Aug | Sep | Oct | Nov | Dec |
| 2001 | Jan | Feb | Mar | Apr | May | Jun | Jul | Aug | Sep | Oct | Nov | Dec |
| 2002 | Jan | Feb | Mar | Apr | May | Jun | Jul | Aug | Sep | Oct | Nov | Dec |
| 2003 | Jan | Feb | Mar | Apr | May | Jun | Jul | Aug | Sep | Oct | Nov | Dec |
| 2004 | Jan | Feb | Mar | Apr | May | Jun | Jul | Aug | Sep | Oct | Nov | Dec |
| 2005 | Jan | Feb | Mar | Apr | May | Jun | Jul | Aug | Sep | Oct | Nov | Dec |
| 2006 | Jan | Feb | Mar | Apr | May | Jun | Jul | Aug | Sep | Oct | Nov | Dec |
| 2007 | Jan | Feb | Mar | Apr | May | Jun | Jul | Aug | Sep | Oct | Nov | Dec |
| 2008 | Jan | Feb | Mar | Apr | May | Jun | Jul | Aug | Sep | Oct | Nov | Dec |
| 2009 | Jan | Feb | Mar | Apr | May | Jun | Jul | Aug | Sep | Oct | Nov | Dec |
| 2010 | Jan | Feb | Mar | Apr | May | Jun | Jul | Aug | Sep | Oct | Nov | Dec |
| 2011 | Jan | Feb | Mar | Apr | May | Jun | Jul | Aug | Sep | Oct | Nov | Dec |
| 2012 | Jan | Feb | Mar | Apr | May | Jun | Jul | Aug | Sep | Oct | Nov | Dec |
| 2013 | Jan | Feb | Mar | Apr | May | Jun | Jul | Aug | Sep | Oct | Nov | Dec |
| 2014 | Jan | Feb | Mar | |||||||||