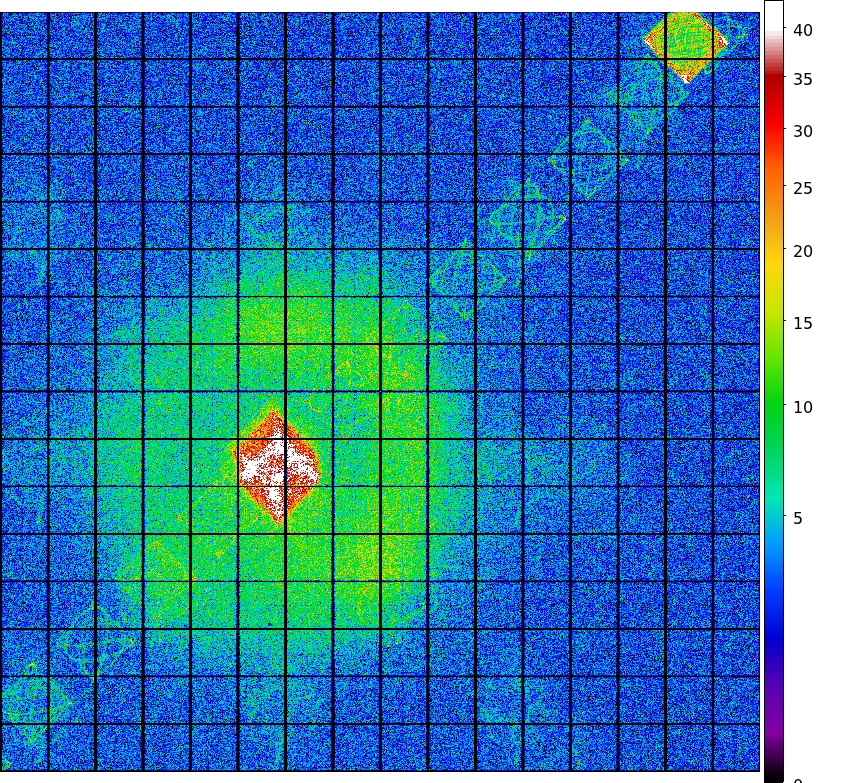
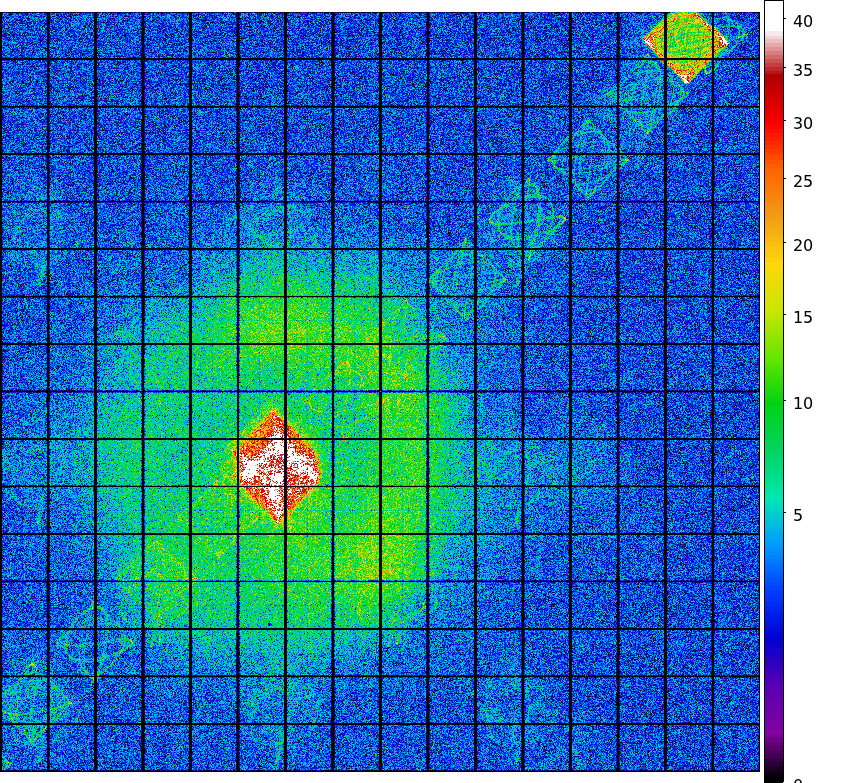
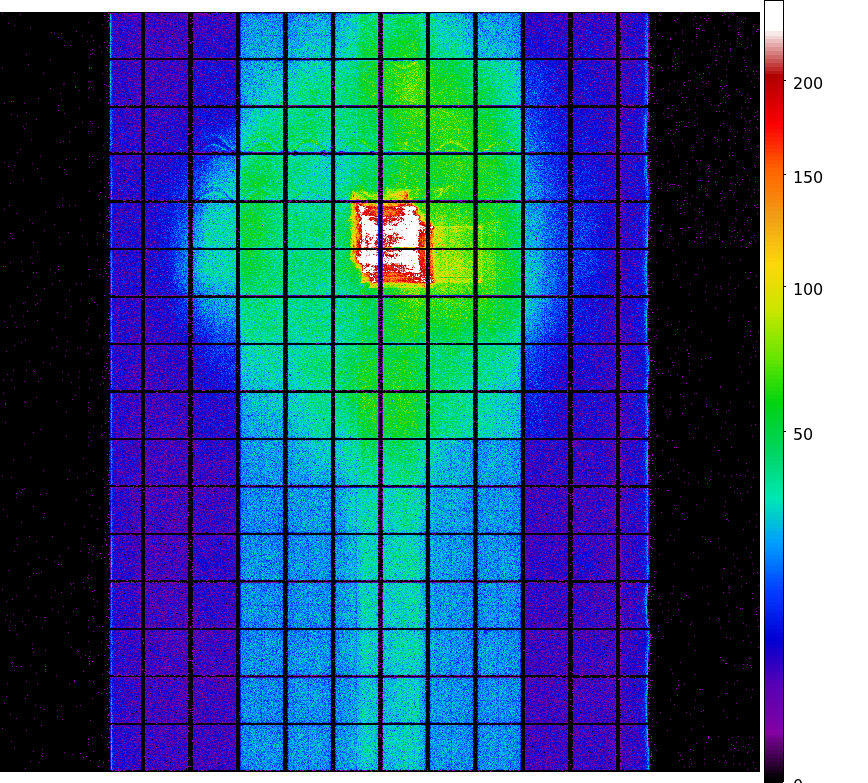
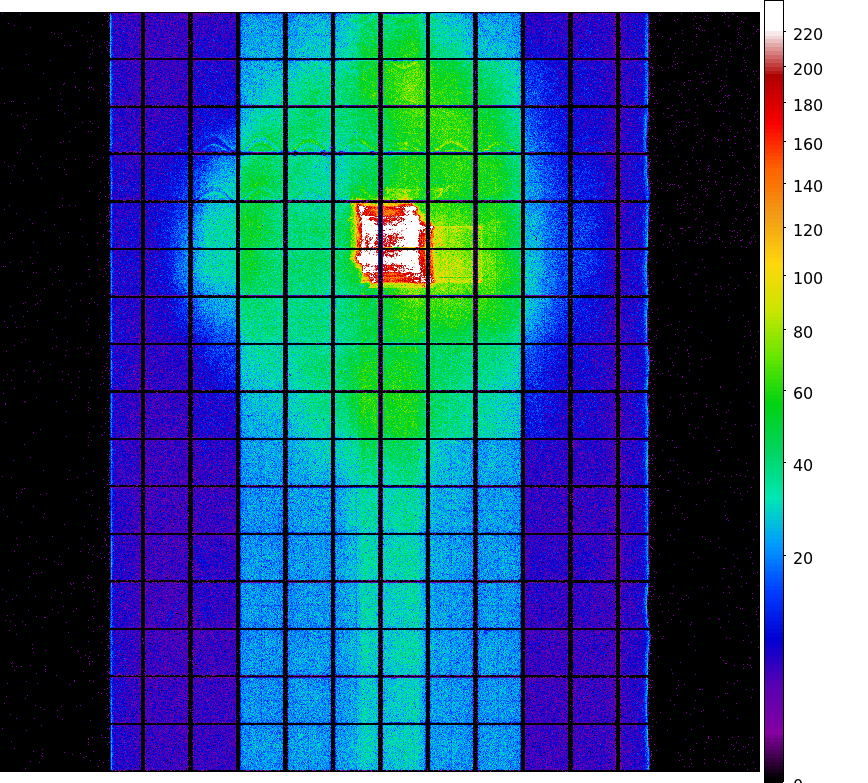
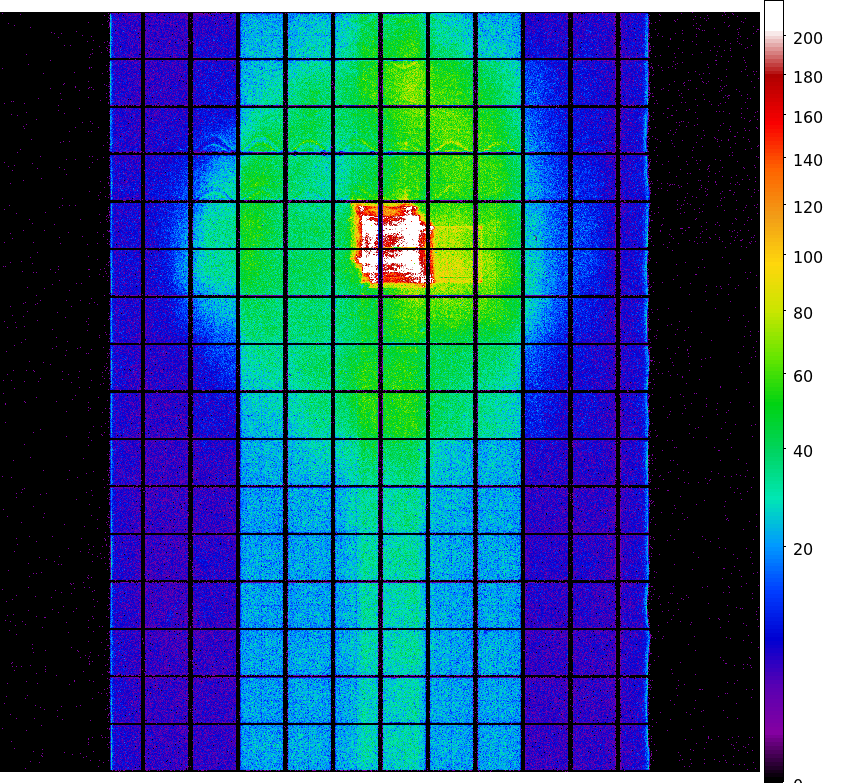
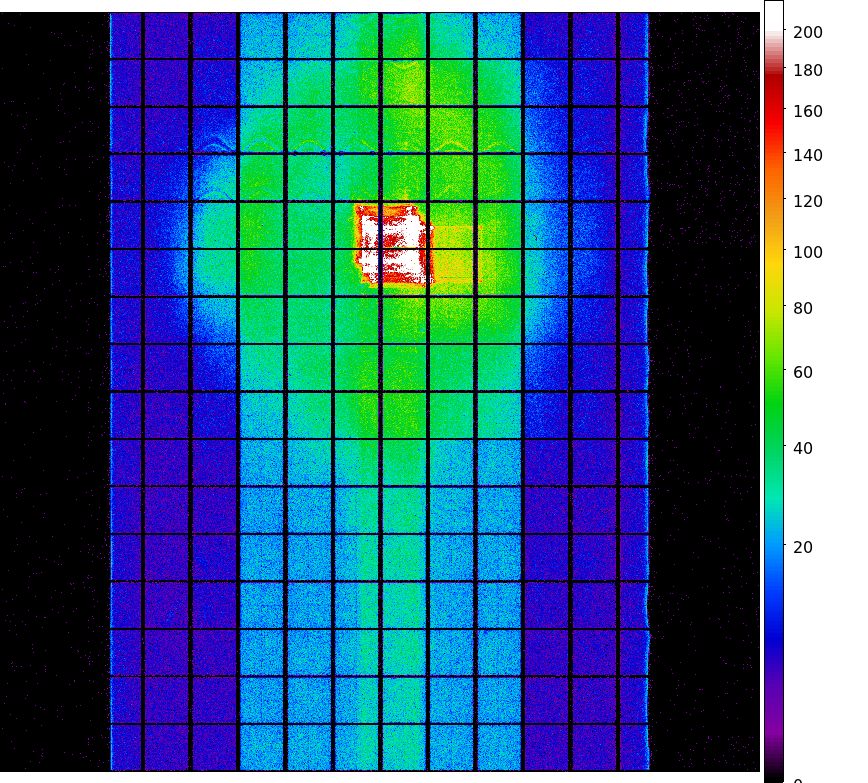
May Dose Map
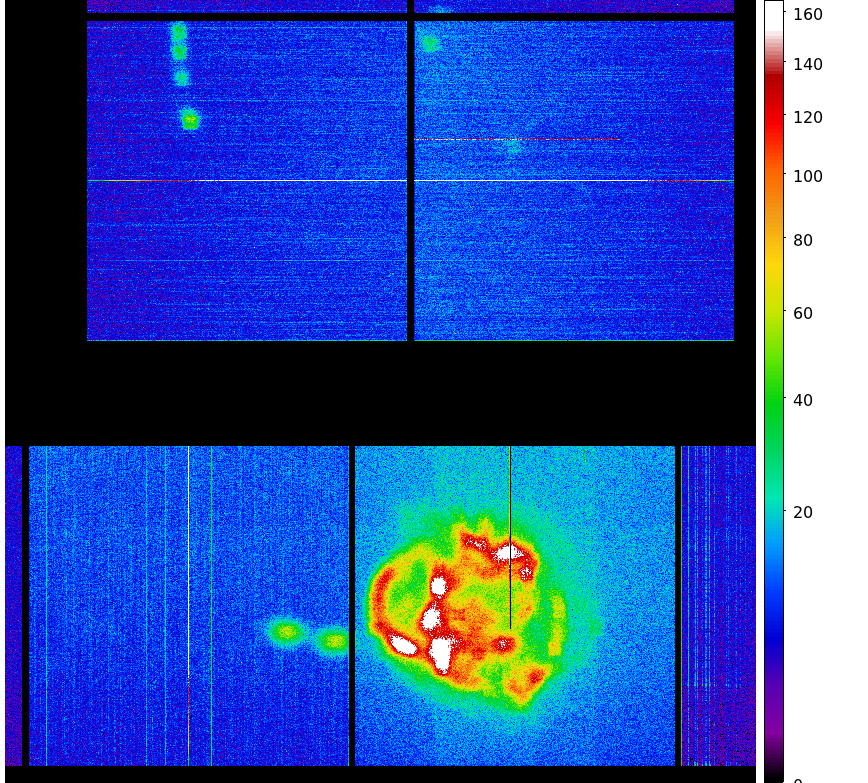
TOTAL
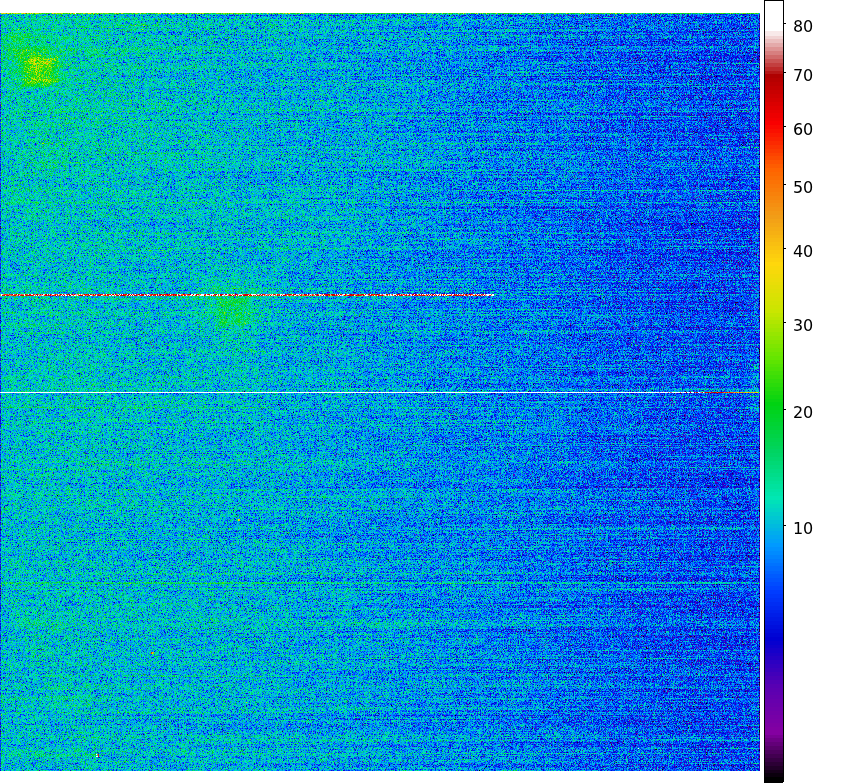
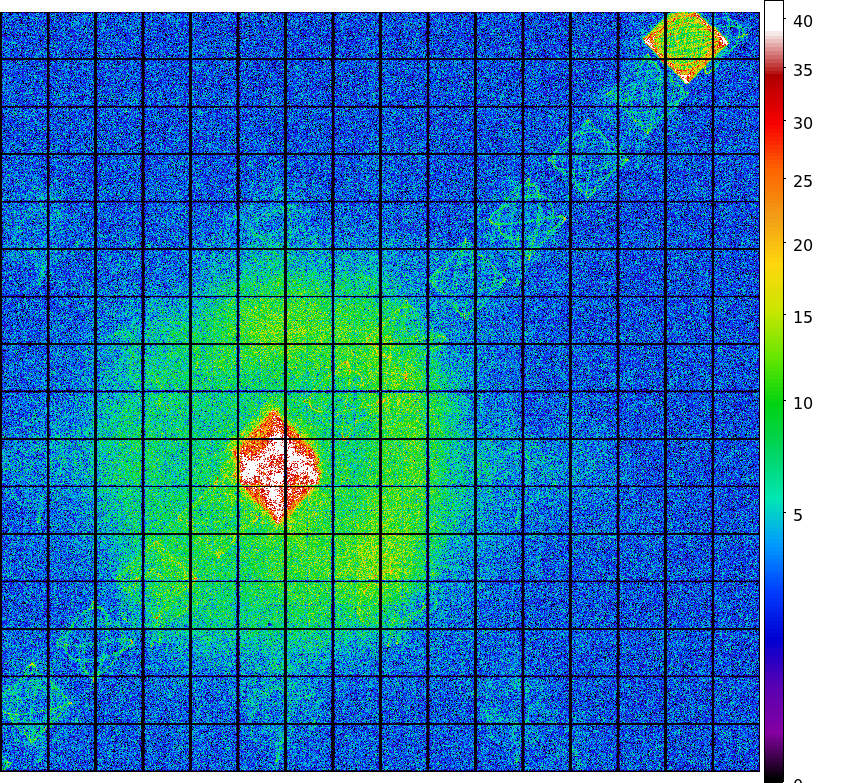
CCD I3
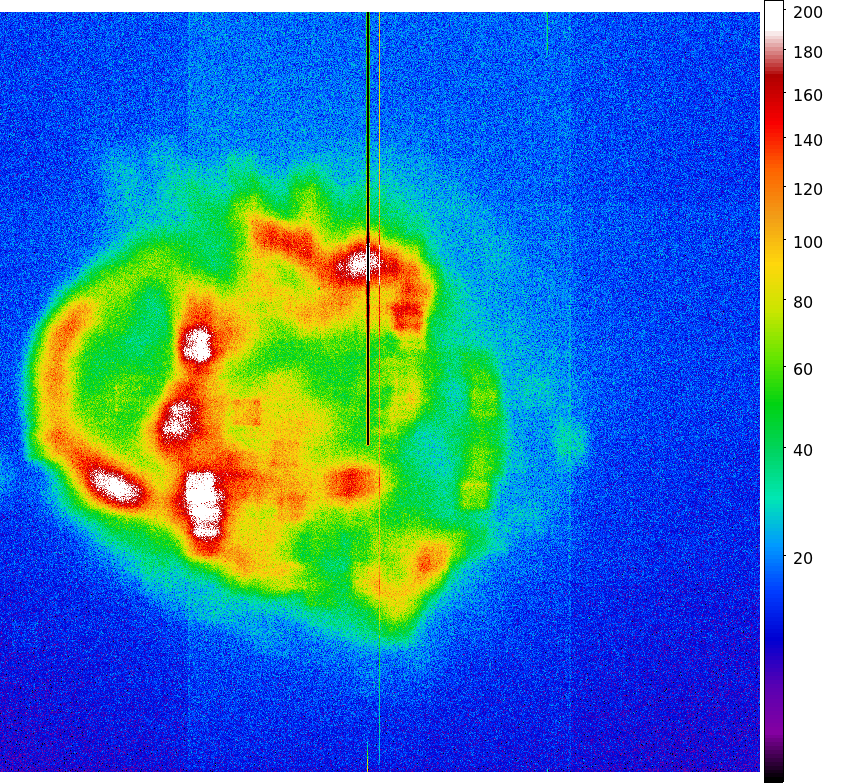
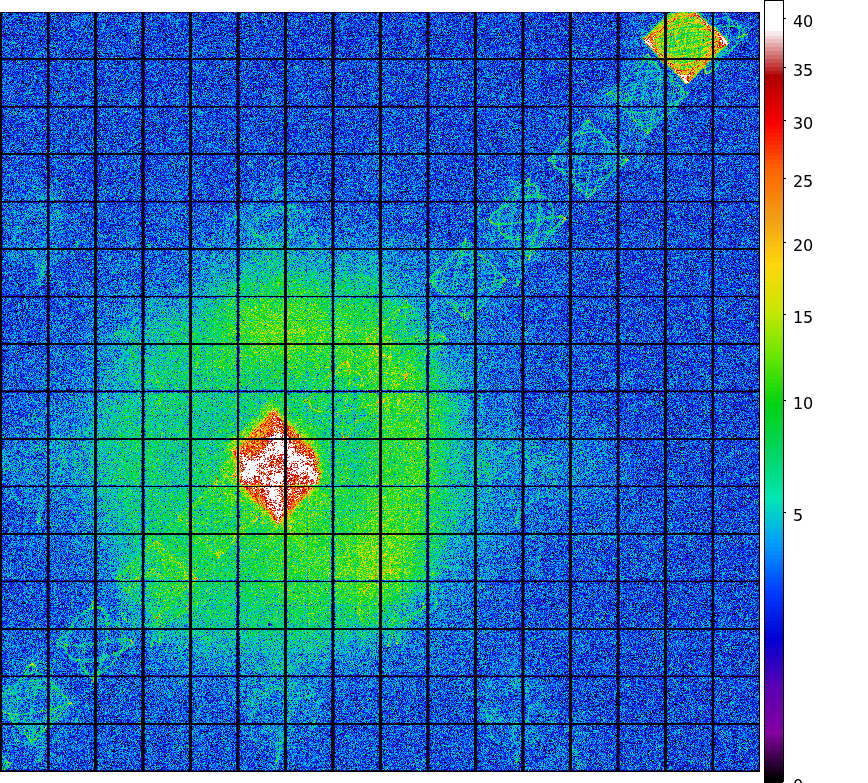
CCD S3
The steps we took to compute the dose map are;
Please check more detail plots at Telemetered Photon Dose Trend page.
Statistics:
# IMAGE     NPIX        MEAN           RMS              MIN     MAX
ACIS_may14 6004901      11.182         20.484           0.0     4426


I2 node 0  262654   7.324918    3.277373    0.0   37.0
I2 node 1  262654   7.826003    3.681514    0.0  427.0
I2 node 2  262654   8.123681    4.411441    0.0   70.0
I2 node 3  262654   8.305796    4.746612    0.0  936.0

I3 node 0  262654   9.658206    4.434686    0.0  759.0
I3 node 1  262654   9.910959    8.721424    0.0  387.0
I3 node 2  262654   9.037780    3.605604    0.0   73.0
I3 node 3  262654   9.147474    3.726630    0.0  218.0

S2 node 0  262654   9.248066    5.415398    0.0 1600.0
S2 node 1  262654   9.472386    4.169029    0.0   60.0
S2 node 2  262654   9.777064    9.529947    0.0 4426.0
S2 node 3  262654   11.710616   7.793324    0.0  514.0

S3 node 0  262654   35.063687   37.514316   0.0  278.0
S3 node 1  262654   55.488052   44.160957   0.0  281.0
S3 node 2  262654   29.188212   23.608592   1.0  193.0
S3 node 3  262654   13.850533   4.318167    0.0   42.0
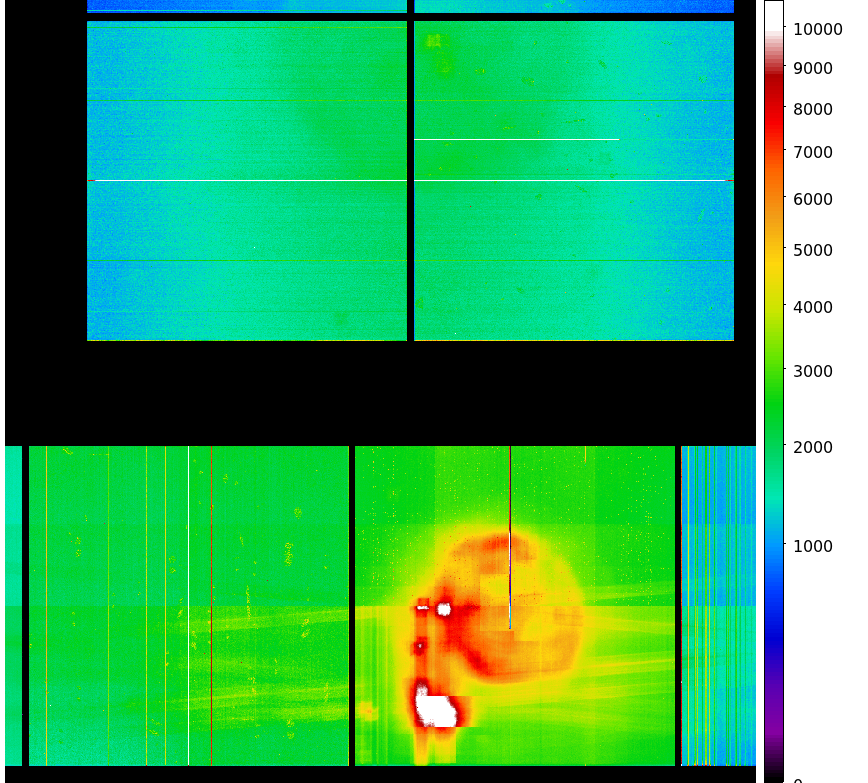
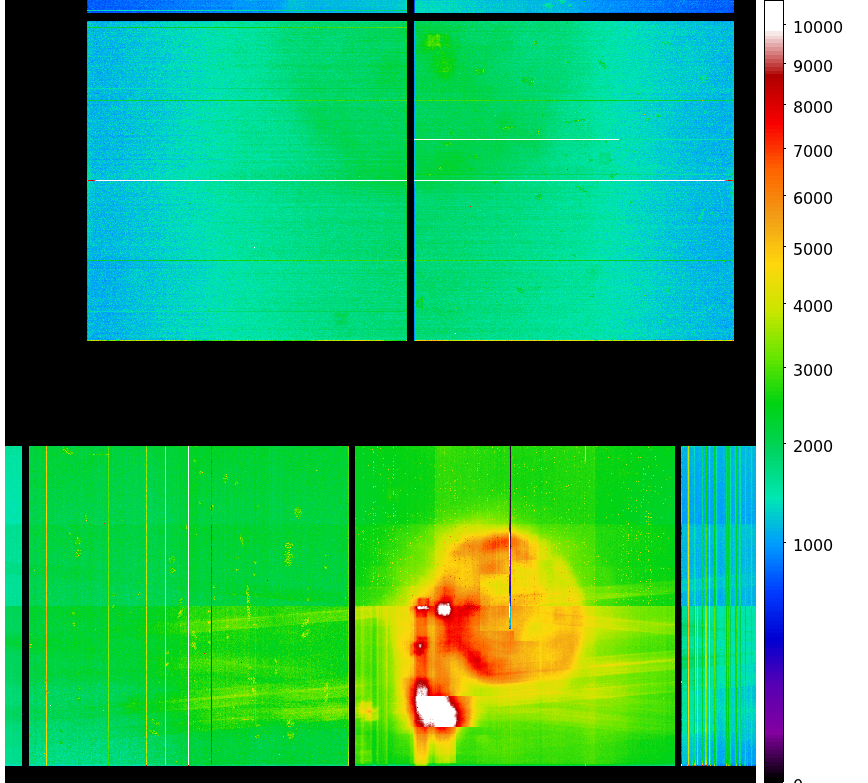
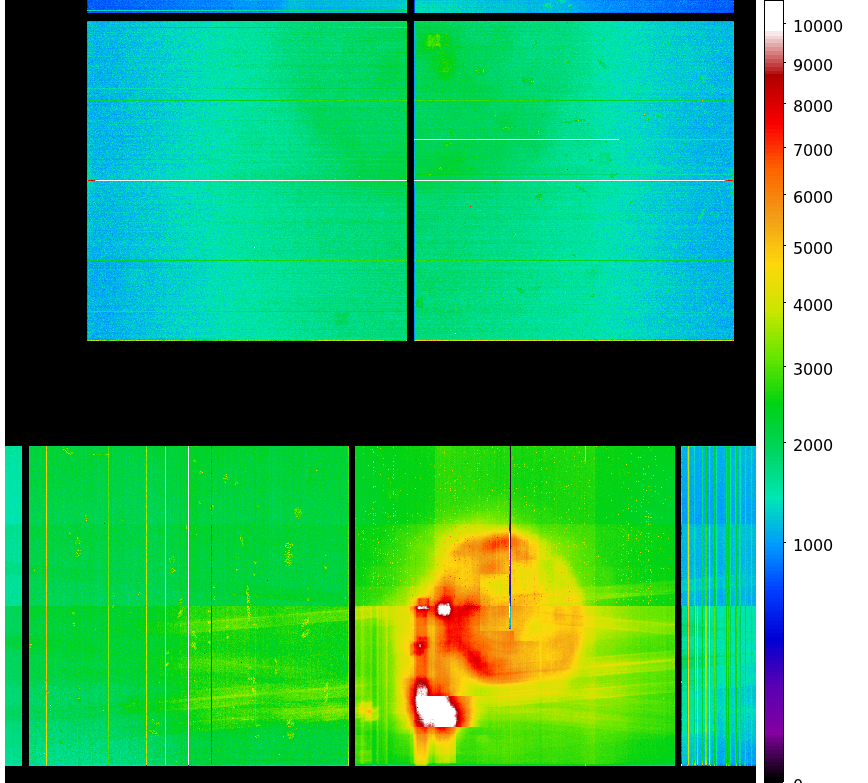
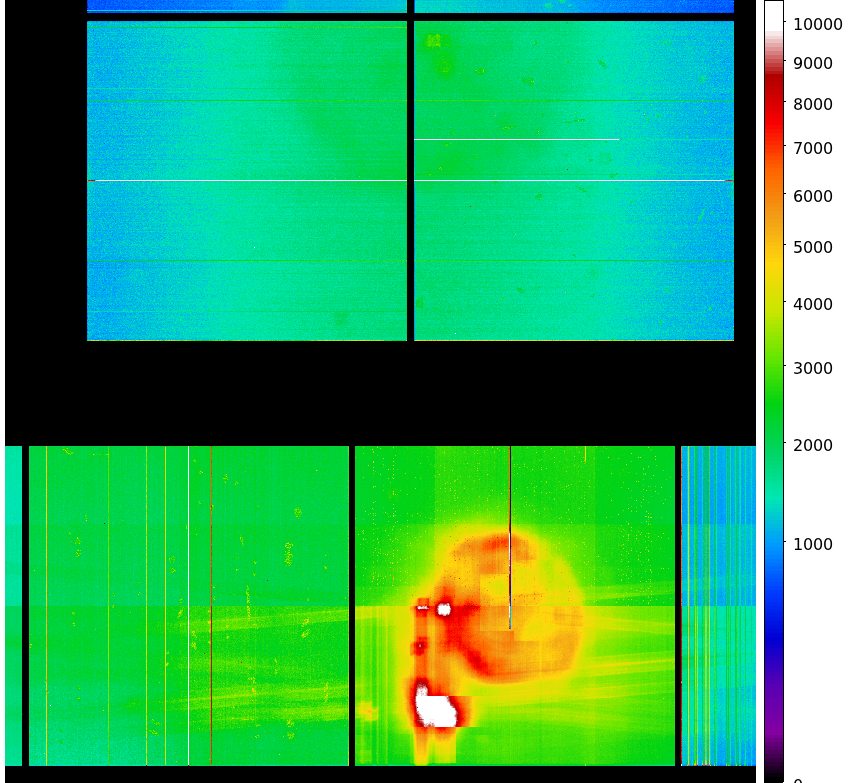
Statistics:
 IMAGE        NPIX      MEAN             RMS            MIN    MAX
ACIS_total   6004901    1794.812         2364.551       0.0   104704


I2 node 0  262654   1498.770017 285.543247   279.0    8990.0
I2 node 1  262654   1580.558945 394.273518   310.0   35525.0
I2 node 2  262654   1610.835509 337.142082   316.0    9115.0
I2 node 3  262654   1608.899772 404.724338   294.0   27925.0

I3 node 0  262654   1684.339476 401.930272   288.0    6640.0
I3 node 1  262654   1768.401342 1341.204401  300.0   34076.0
I3 node 2  262654   1545.408808 275.900782   289.0    7782.0
I3 node 3  262654   1531.279496 295.280653   271.0   26382.0

S2 node 0  262654   2101.810742 303.093077  1094.0   21115.0
S2 node 1  262654   2229.221565 487.197930  1137.0   12355.0
S2 node 2  262654   2460.461190 462.045871  1457.0   18506.0
S2 node 3  262654   2389.207800 327.083530  1387.0   40288.0

S3 node 0  262654   3743.792046 1773.004227 1520.0   13431.0
S3 node 1  262654   4922.660403 2064.493700    0.0   13912.0
S3 node 2  262654   3729.134069 973.849177  1502.0    9186.0
S3 node 3  262654   2881.582256 430.073318  1637.0   10159.0
|
|
|
|
| Feb 2014 | nov 2013 | Jun 2013 | May 0213 |
|---|
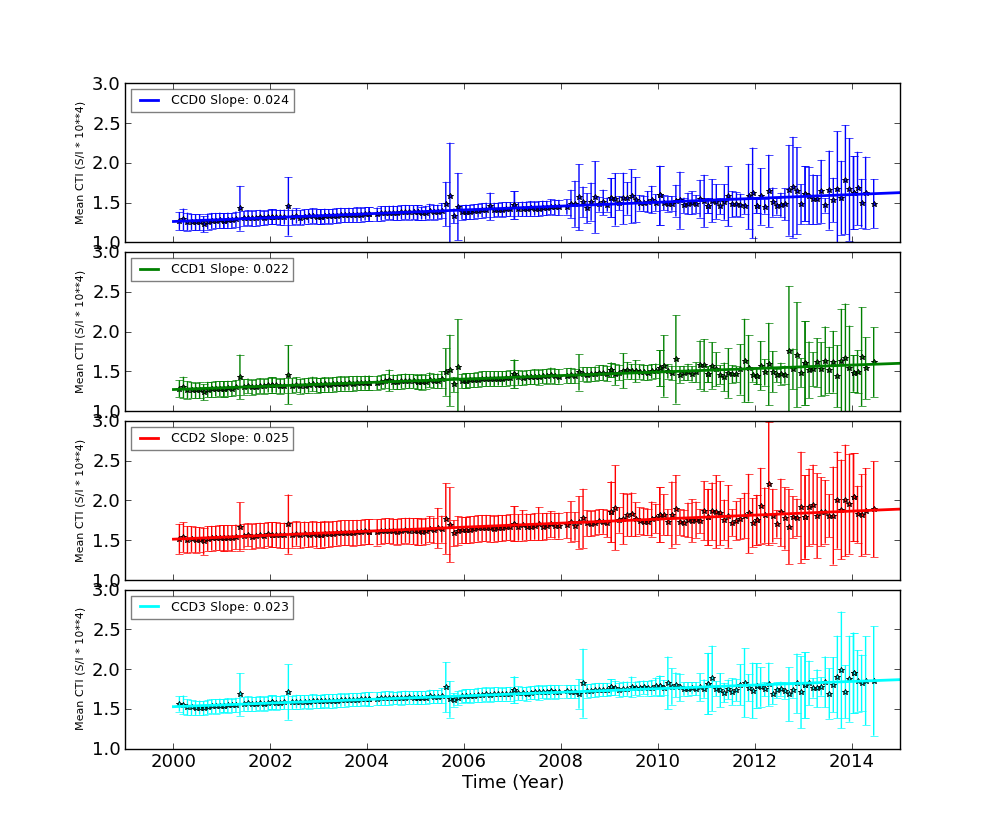
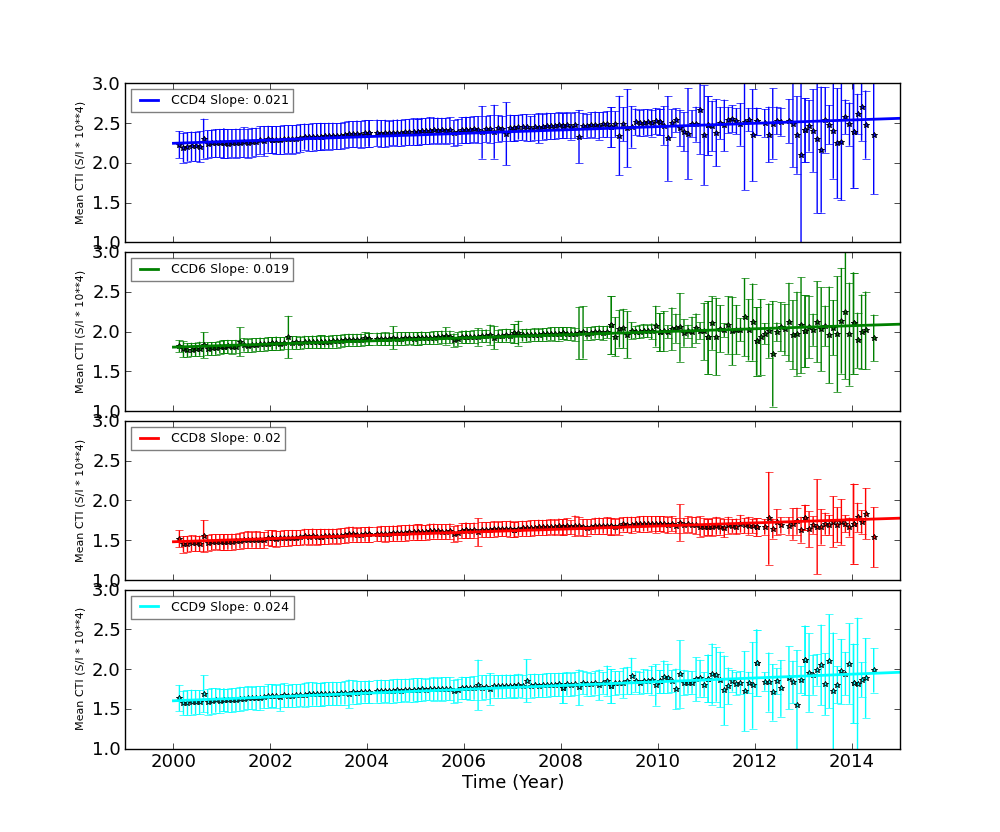
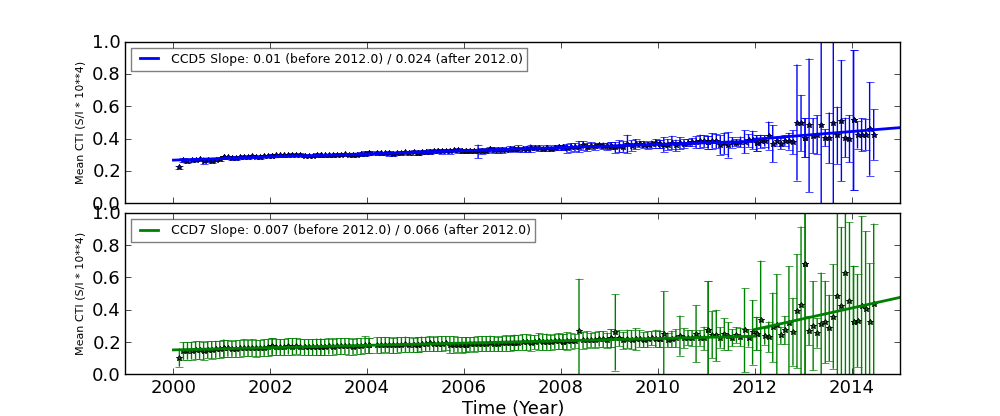
We report CTIs with a refined data definition. CTIs were computed for the temperature dependency corrected data. Please see CTI page for detailed explanation. CTI's are computed for Mn K alpha, and defined as slope/intercept x10^4 of row # vs ADU. Data file: here
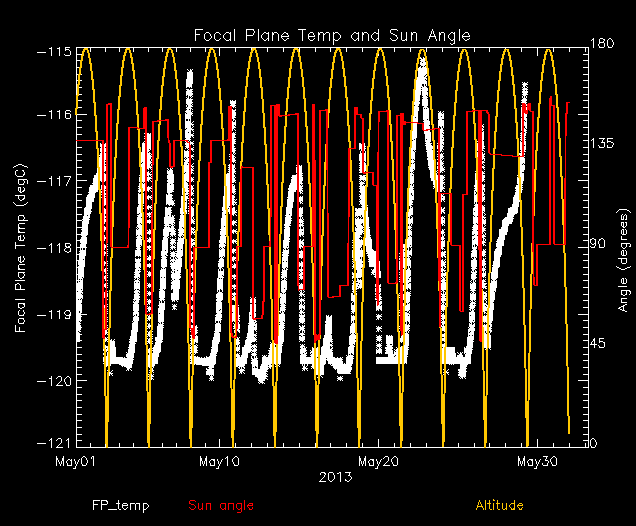
| The Mean (max) FPT: | |
|---|---|
| -116.72 | +/- 1.27 C |
| Mean Width: | |
| 1.36 | +/- 0.97 days |
We are using 10 period moving averages to show trends of peak temperatures and peak widths. Note, the gaps in the width plot are due to missing/corrupted data.

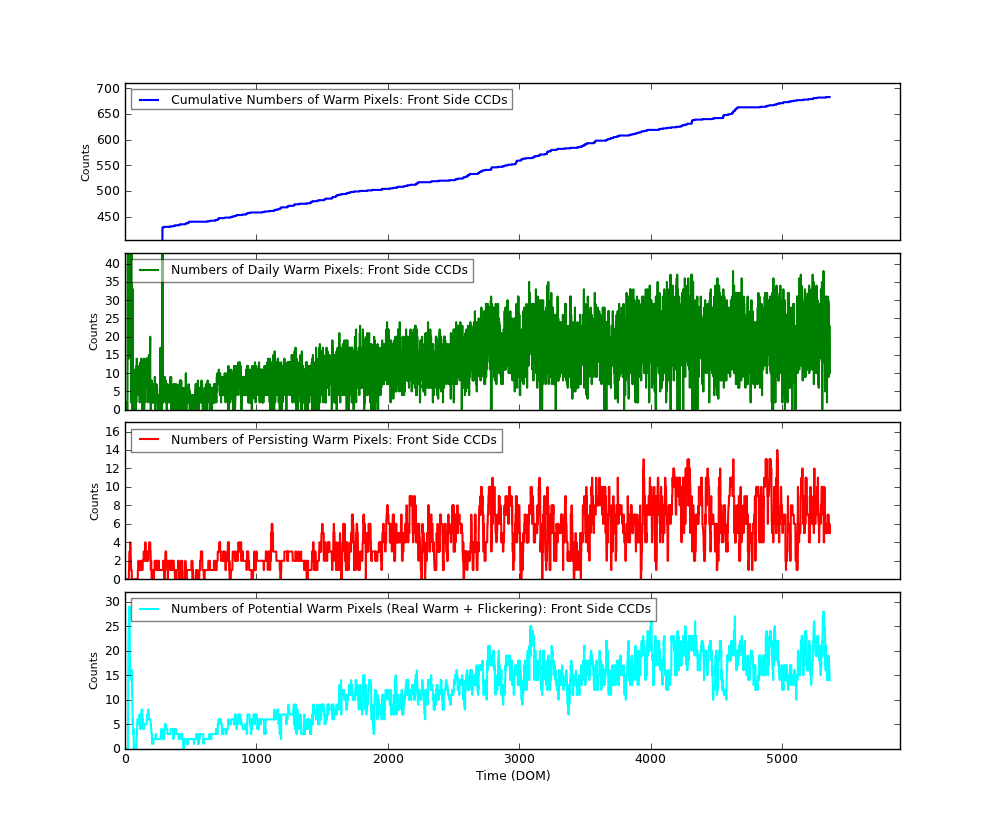
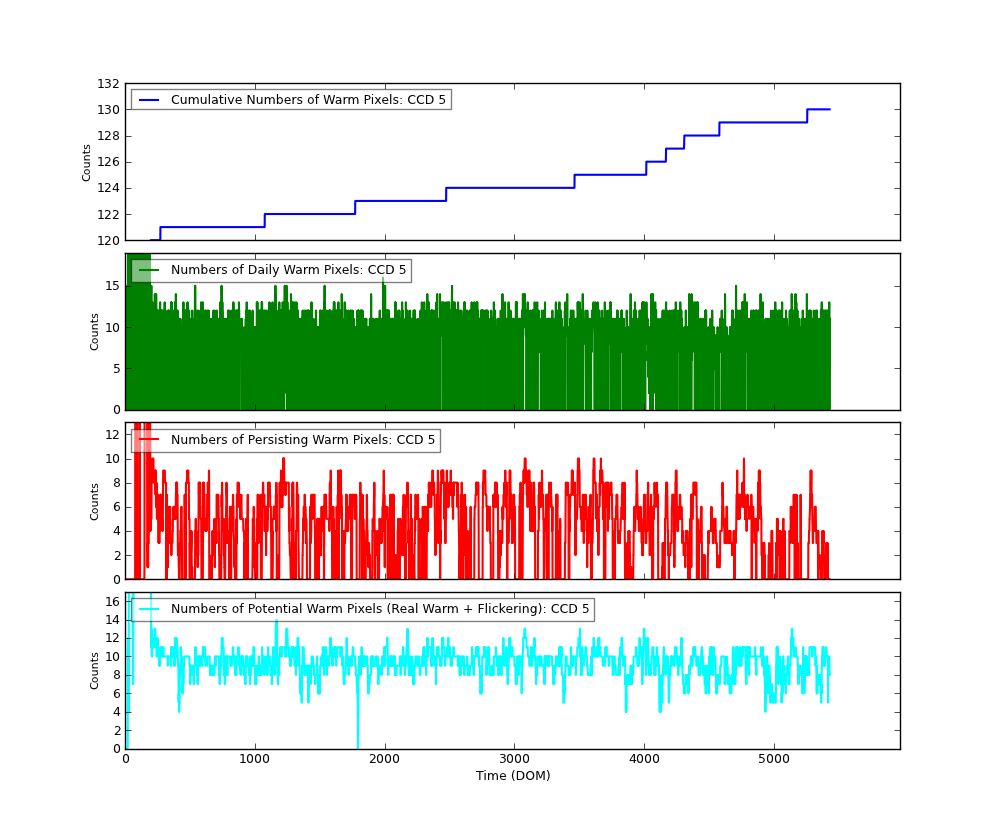
The plots below were generated with a new warm pixel finding script. Please see Acis Bad Pixel Page for details.
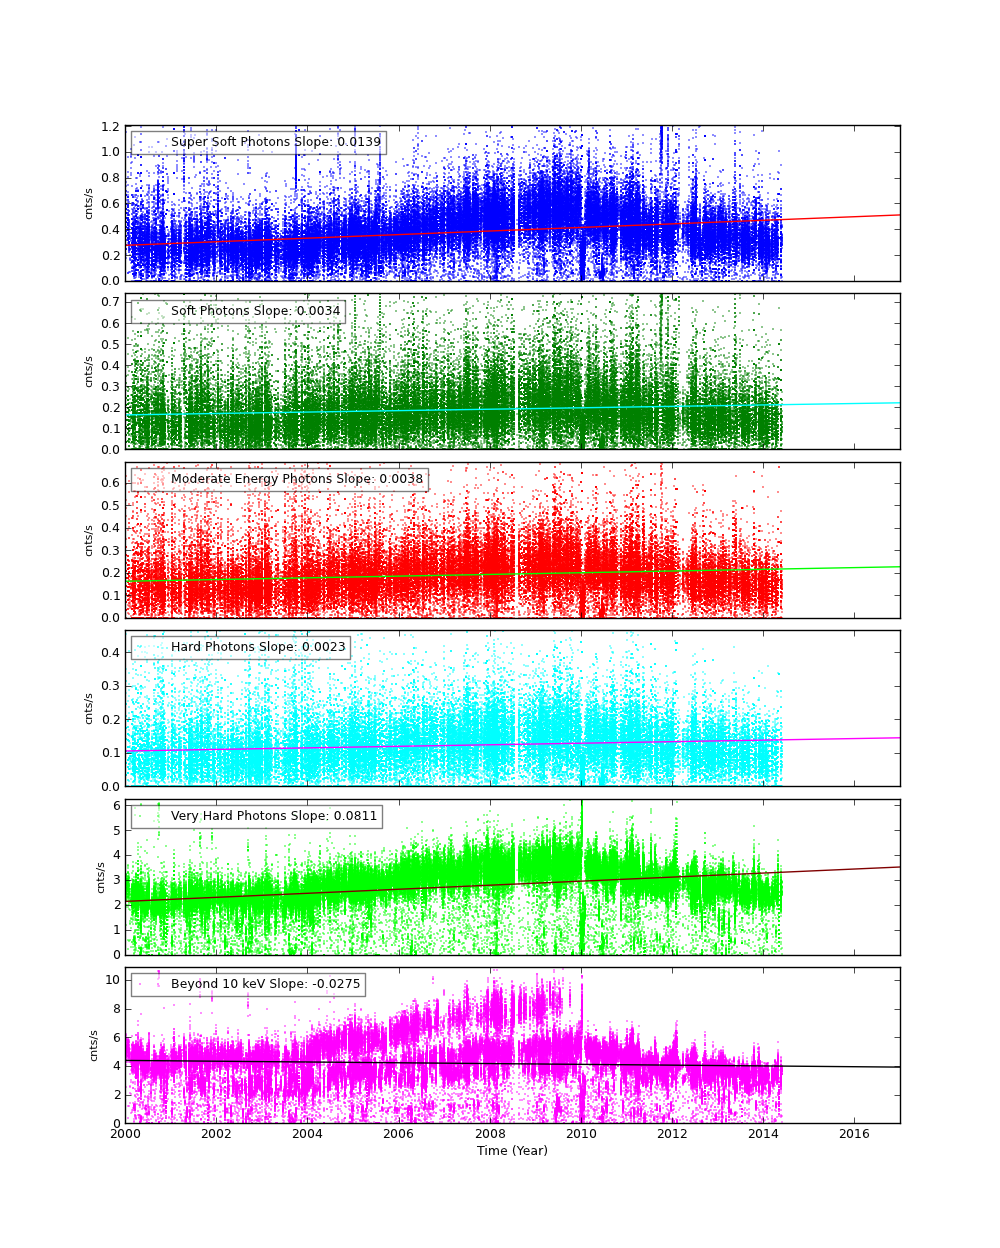
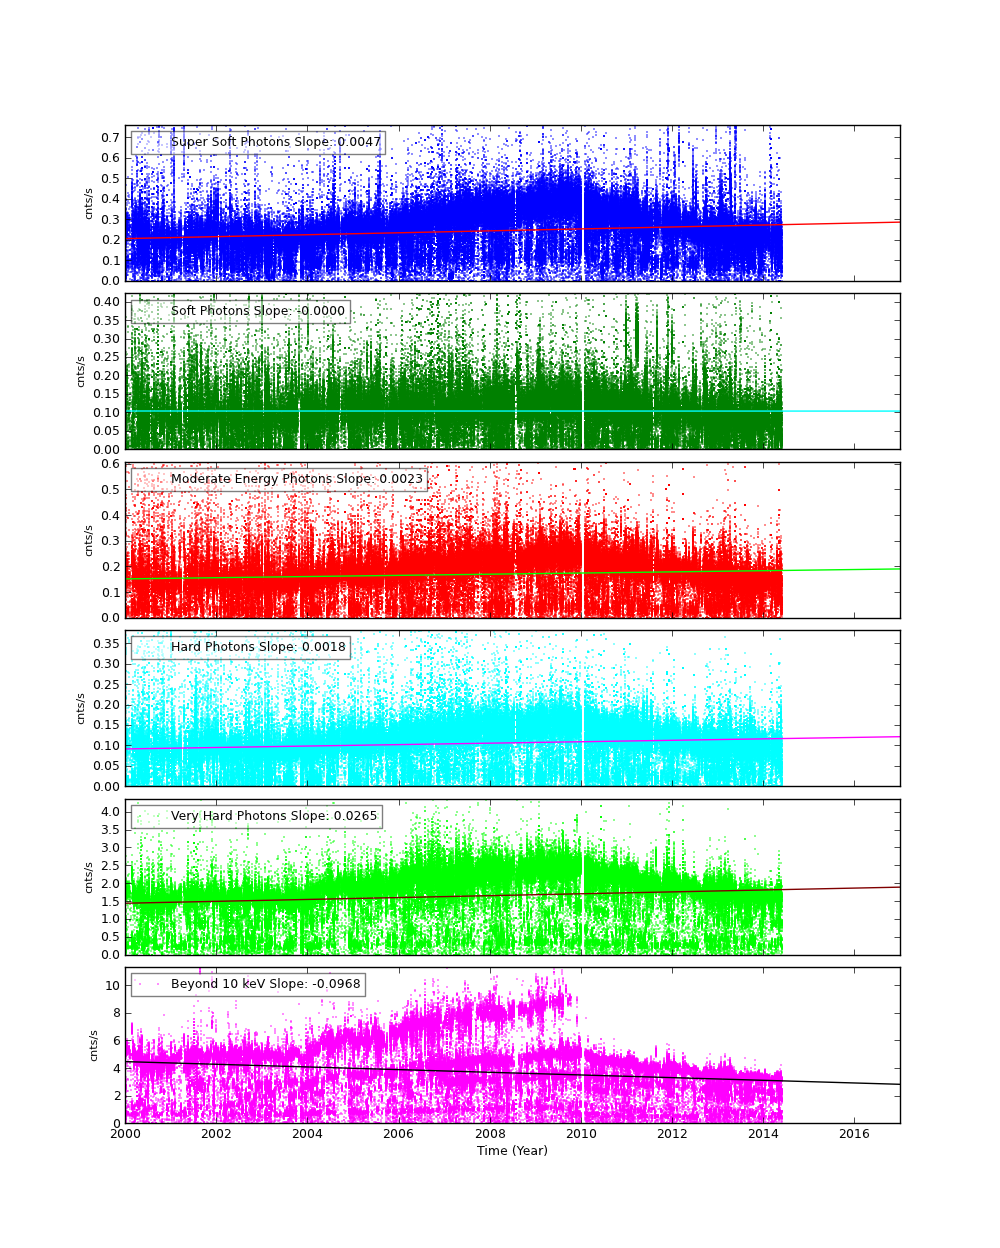
| Name | Low (keV) | High(KeV) | Description |
|---|---|---|---|
| SSoft | 0.00 | 0.50 | Super soft photons |
| Soft | 0.50 | 1.00 | Soft photons |
| Med | 1.00 | 3.00 | Moderate energy photons |
| Hard | 3.00 | 5.00 | Hard Photons |
| Harder | 5.00 | 10.00 | Very Hard photons |
| Hardest | 10.00 | Beyond 10 keV |
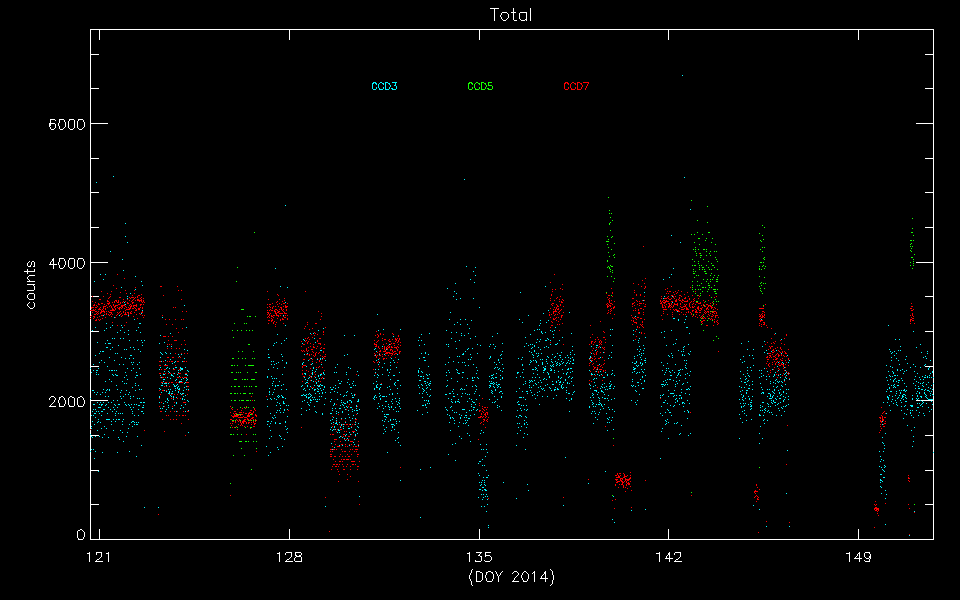
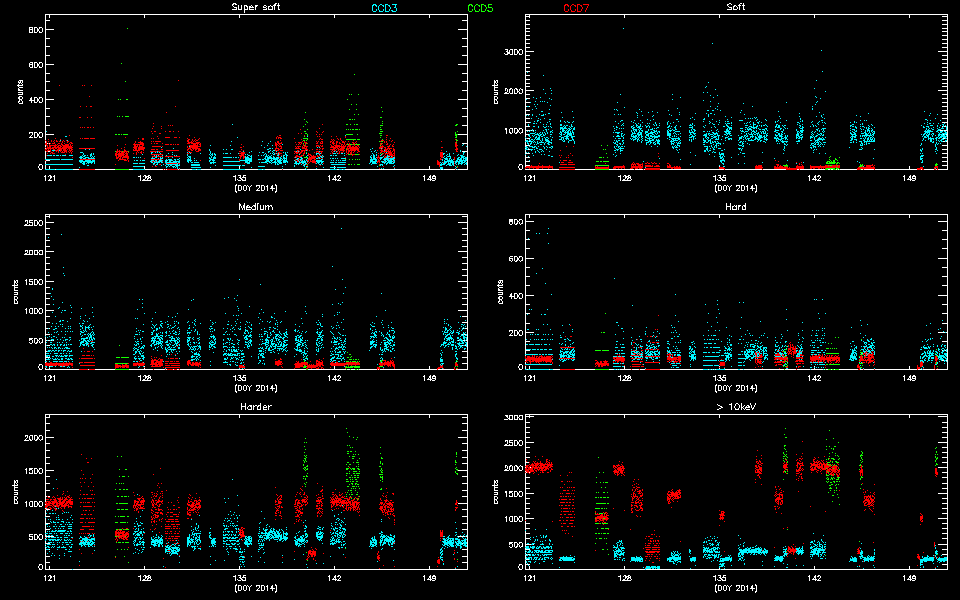
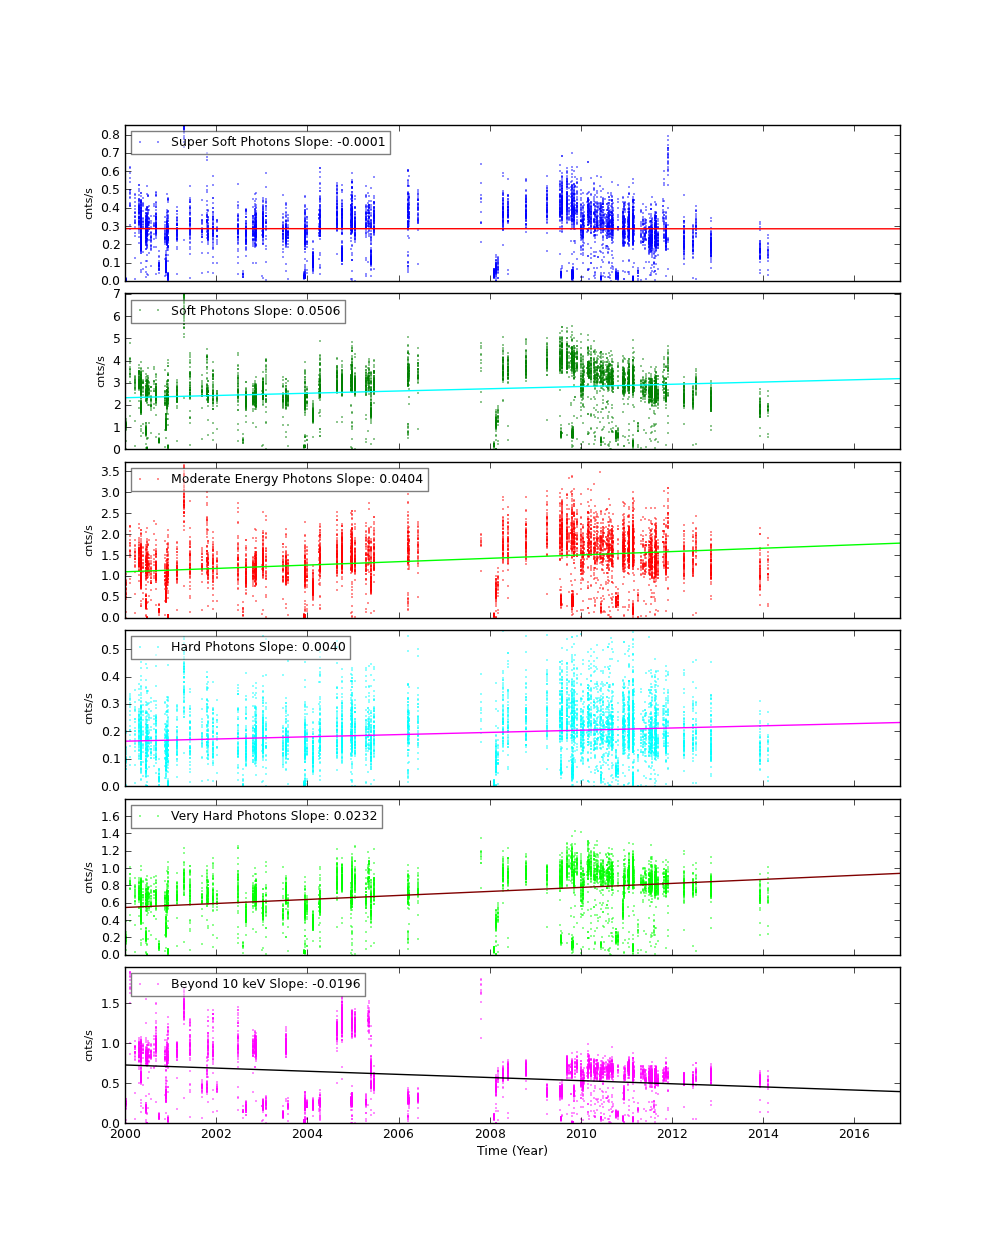
The following three plots show trends of SIB from year 2000. CCDs shown here are CCD3, CCD5, and CCD7. Fitted lines are linear fit after eliminating extreme outliers. For >10 keV plots, 2 lines are fit. One is with a 13 keV filter, and another without.
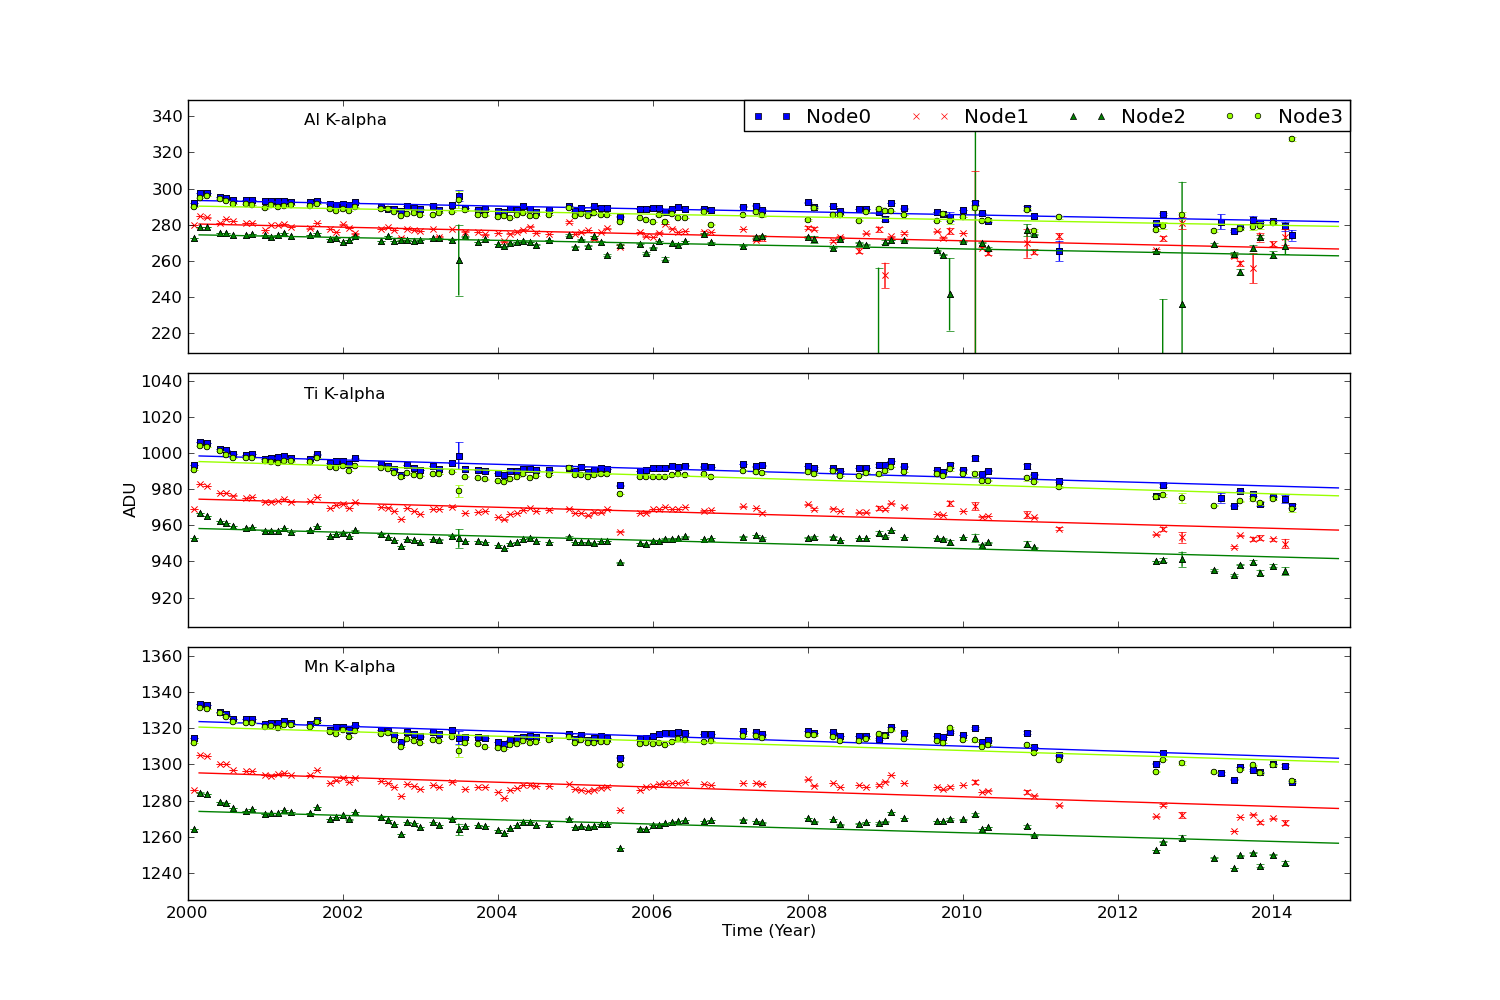
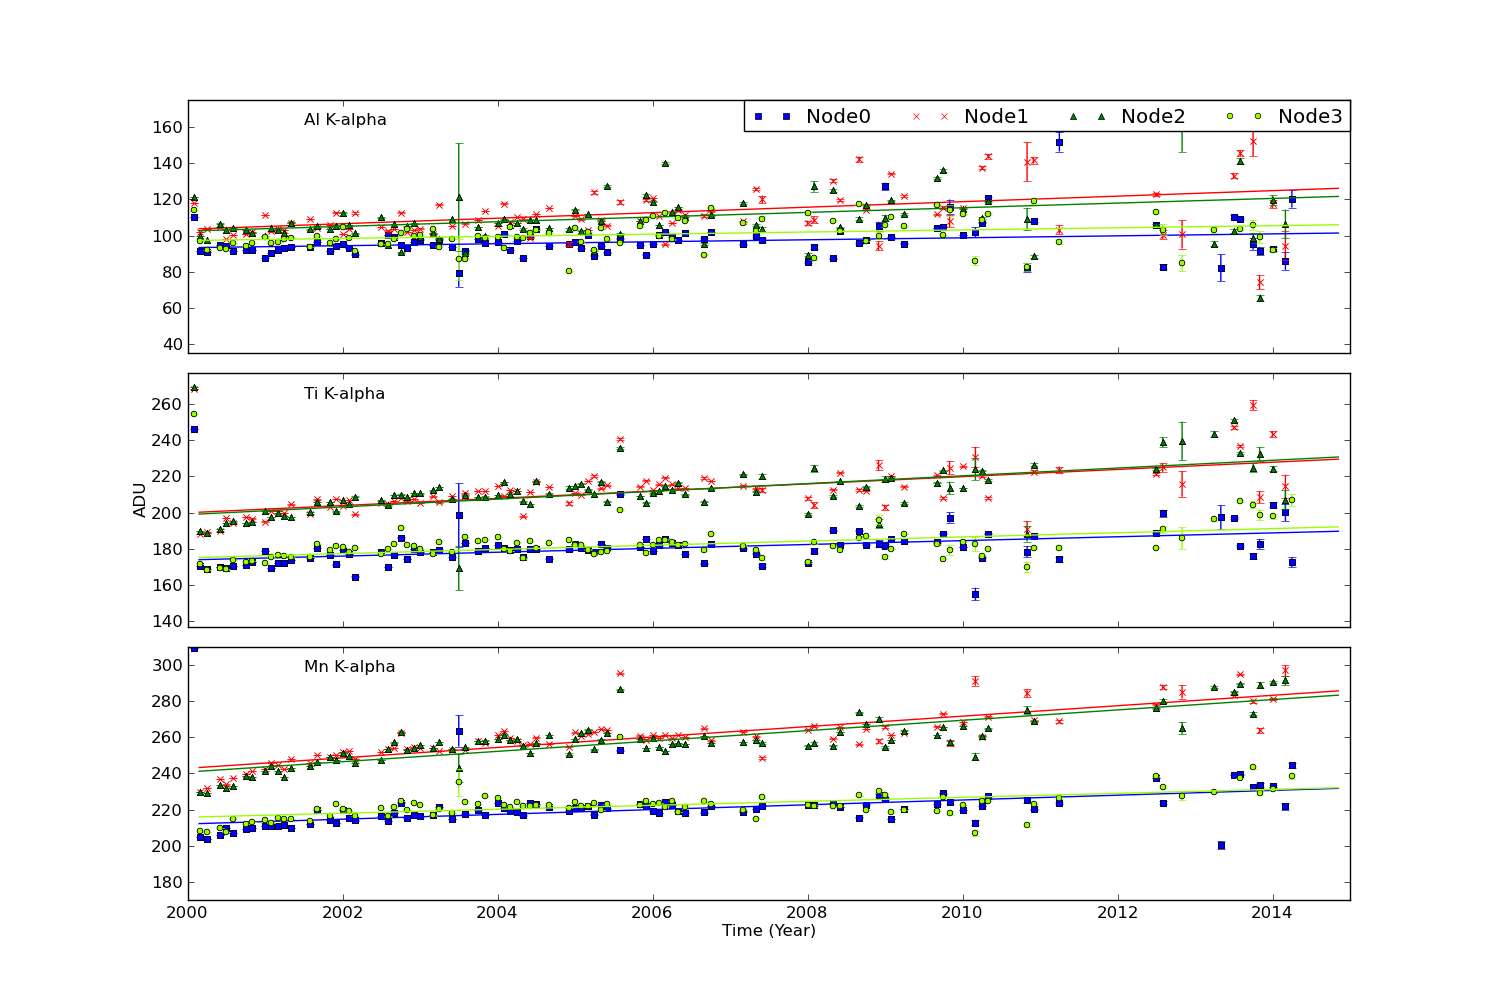
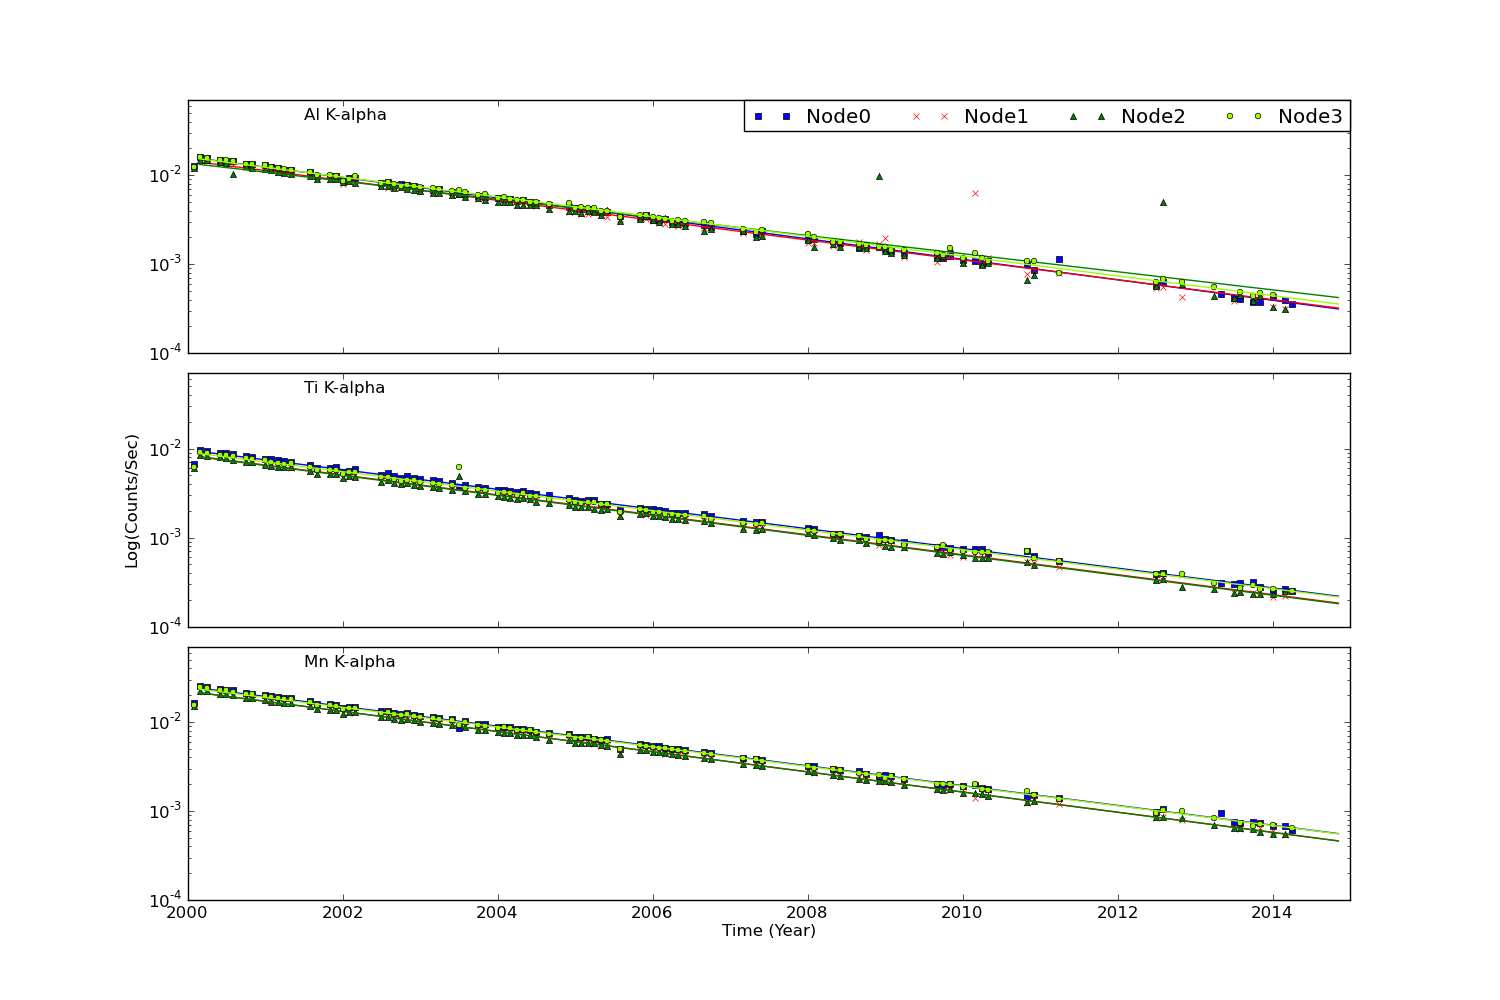
We collected data from acis histogram mode data, and created trend plots of peak portions and peak widths against time (DOM). The peaks were estimated by fitting a simple Gaussian on three peaks (Al, Ti, and Mn), and the widths were estimated by a width at the half max from the peak.
All histogram data are taken under TIMED and GRADED_HIST mode, SIM position is at an external calibration source position, the focal temperature is around -119.7 C, and parameter settings in aciselec, acistemp are set to about same for all.
Please refer to Maximum Dose Trends for more details.
        IMAGE                NPIX      MEAN    STDDEV      MIN       MAX
HRCI_05_2014.fits          16777216   0.004    0.0662      0.0       3.0
        IMAGE                NPIX      MEAN    STDDEV      MIN       MAX
HRCI_08_1999_05_2014.fits  16777216   4.258    4.869       0.0       292.0
No Data
        IMAGE                NPIX     MEAN      STDDEV      MIN      MAX
HRCS_08_1999_05_2014.fits  16777216  15.425     26.984      0.0      1679.0

|
|
Max dose trend plots corrected for events that "pile-up"
in the center of the taps due to bad position information.
|
|
|
|
|
| Feb 2014 | Nov 2013 | Aug 2013 | May 2013 |
|---|
|
|
|
|
| Feb 2014 | Nov 2013 | Aug 2013 | May 2013 |
|---|
We plot the width of the zero order streak of ACIS/HETG observations and the width of the zero order image for HRC/LETG observations of point sources. No significant defocusing trend is seen at this time. See Gratings Focus pages.

| Previous Quarter | ||||||
| MSID | MEAN | RMS | DELTA/YR | DELTA/YR/YR | UNITS | DESCRIPTION |
| TATECDRT | 288.99 | 0.95 | 4.383e+00 | 1.545e+01 | K | TEC DRIVER RDNT TEMP |
| TFSSBKT1 | 338.89 | 20.73 | -3.048e+00 | 1.543e+02 | K | FSS BRACKET-1 TEMP (+Y) |
| TFSSBKT2 | 328.92 | 3.192e+01 | 4.116e+00 | 5.737e+02 | K | FSS BRACKET-2 TEMP (+Y) |
| TSCTSF4 | 268.65 | 1.20 | -5.091e-01 | 2.276e+02 | K | SC-TS FITTING -4 TEMP |
| TSCTSF6 | 303.17 | 3.43 | 6.680e+00 | 6.454e+01 | K | SC-TS FITTING -6 TEMP |
| Previous Quarter | ||||||
| MSID | MEAN | RMS | DELTA/YR | DELTA/YR/YR | UNITS | DESCRIPTION |
| ELBI | 56.69 | 1.34 | 3.802e-01 | -9.703e+01 | AMP | LOAD BUS CURRENT |
| ELBV | 28.36 | 0.12 | -8.381e-01 | 1.619e+01 | V | LOAD BUS VOLTAGE |
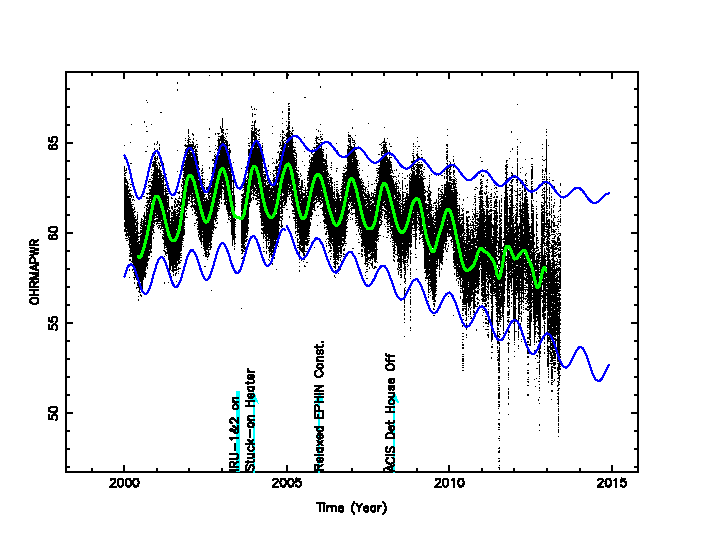
| OHRMAPWR | 54.63 | 2.53 | -9.481e+00 | -1.597e+02 | W | HRMA COMPUTED TOTAL POWER |
| OOBAPWR | 48.34 | 2.59 | -2.396e+00 | -2.817e+02 | W | OBA COMPUTED TOTAL POWER |
| Previous Quarter | ||||||
| MSID | MEAN | RMS | DELTA/YR | DELTA/YR/YR | UNITS | DESCRIPTION |
| CPA1PWR | 0.88 | 4.31 | -3.769e+00 | -6.331e+00 | DBM | POWER AMP-1 OUTPUT POWER |
| CPA1V | 0.08 | 0.42 | -3.650e-01 | -6.039e-01 | V | POWER AMP-1 SECONDARY VOLTAGE |
| CPA2PWR | 4.15 | 9.89 | 9.670e+00 | 5.589e+01 | DBM | POWER AMP-2 OUTPUT POWER |
| CPA2V | 0.40 | 0.96 | 9.360e-01 | 5.450e+00 | V | POWER AMP-2 SECONDARY VOLTAGE |
| CTXAPWR | 36.40 | 1.057e-02 | -1.666e-02 | 1.079e+02 | DBM | TRANSMITTER A OUTPUT POWER |
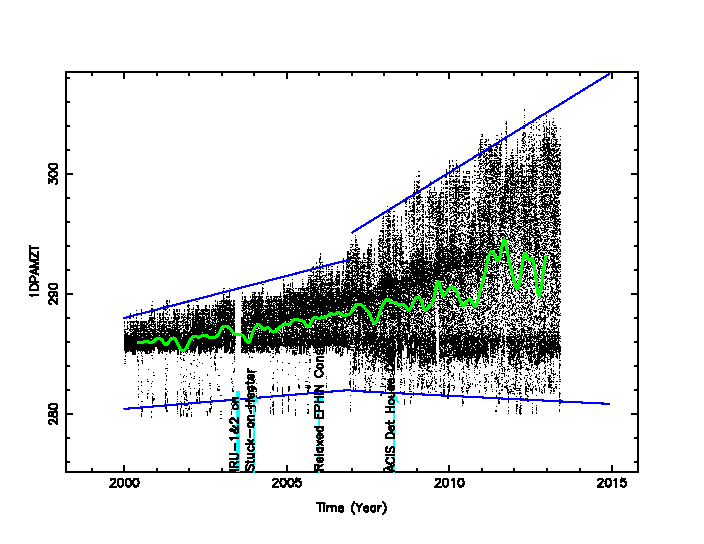
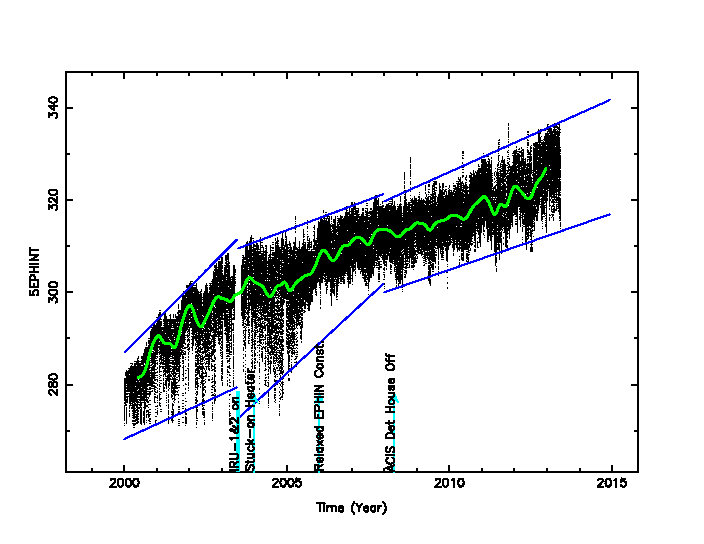
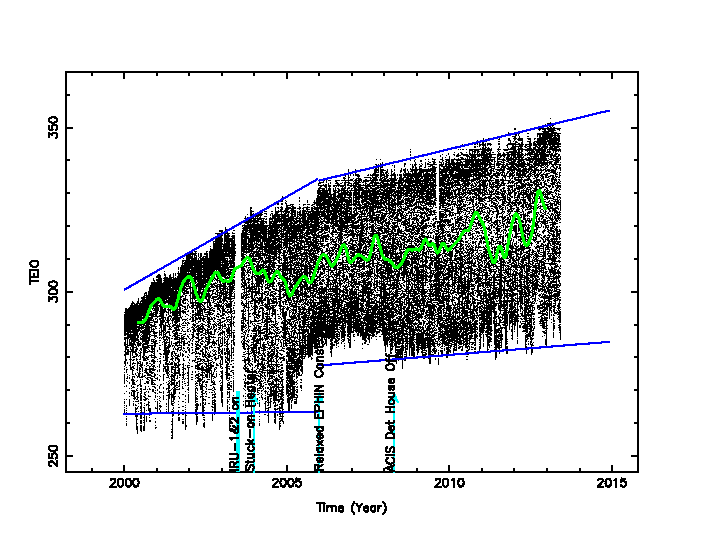
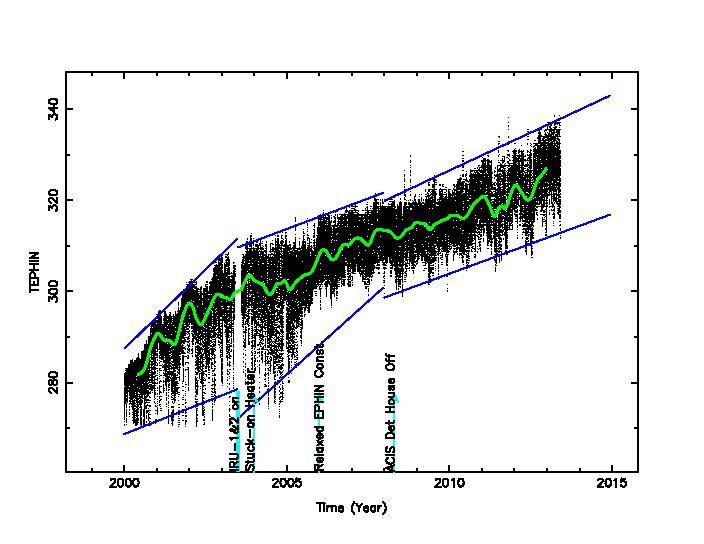
|
|
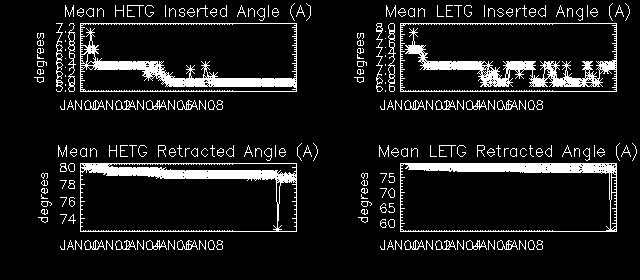

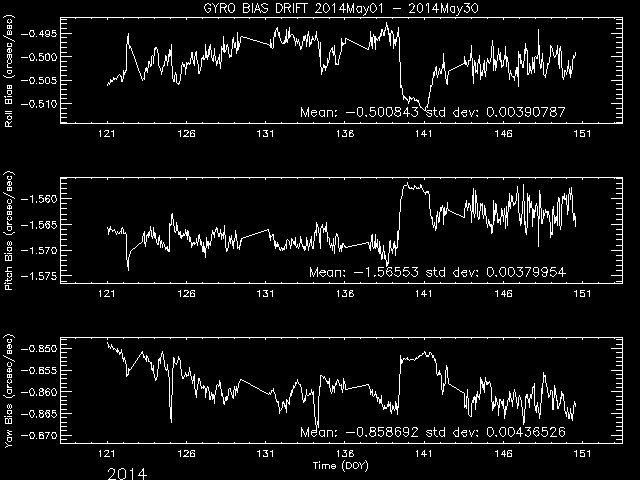
Note: From Feb 2010, the computation of reaction wheel rotations are slightly modified.
| Year | Month | |||||||||||
|---|---|---|---|---|---|---|---|---|---|---|---|---|
| 1999 | Jul | Aug | Sep | Oct | Nov | Dec | ||||||
| 2000 | Jan | Feb | Mar | Apr | May | Jun | Jul | Aug | Sep | Oct | Nov | Dec |
| 2001 | Jan | Feb | Mar | Apr | May | Jun | Jul | Aug | Sep | Oct | Nov | Dec |
| 2002 | Jan | Feb | Mar | Apr | May | Jun | Jul | Aug | Sep | Oct | Nov | Dec |
| 2003 | Jan | Feb | Mar | Apr | May | Jun | Jul | Aug | Sep | Oct | Nov | Dec |
| 2004 | Jan | Feb | Mar | Apr | May | Jun | Jul | Aug | Sep | Oct | Nov | Dec |
| 2005 | Jan | Feb | Mar | Apr | May | Jun | Jul | Aug | Sep | Oct | Nov | Dec |
| 2006 | Jan | Feb | Mar | Apr | May | Jun | Jul | Aug | Sep | Oct | Nov | Dec |
| 2007 | Jan | Feb | Mar | Apr | May | Jun | Jul | Aug | Sep | Oct | Nov | Dec |
| 2008 | Jan | Feb | Mar | Apr | May | Jun | Jul | Aug | Sep | Oct | Nov | Dec |
| 2009 | Jan | Feb | Mar | Apr | May | Jun | Jul | Aug | Sep | Oct | Nov | Dec |
| 2010 | Jan | Feb | Mar | Apr | May | Jun | Jul | Aug | Sep | Oct | Nov | Dec |
| 2011 | Jan | Feb | Mar | Apr | May | Jun | Jul | Aug | Sep | Oct | Nov | Dec |
| 2012 | Jan | Feb | Mar | Apr | May | Jun | Jul | Aug | Sep | Oct | Nov | Dec |
| 2013 | Jan | Feb | Mar | Apr | May | Jun | Jul | Aug | Sep | Oct | Nov | Dec |
| 2014 | Jan | Feb | Mar | Apr | ||||||||