Jun Dose Map
)
TOTAL
)
CCD I3
)
CCD S3
The steps we took to compute the dose map are;
Please check more detail plots at Telemetered Photon Dose Trend page.
Statistics:
# IMAGE     NPIX        MEAN           RMS              MIN     MAX
ACIS_jun14 6004901      8.951          12.257           0.0     429


I2 node 0  262654   5.624874    2.782063    0.0  42.0
I2 node 1  262654   6.084941    3.232411    0.0 173.0
I2 node 2  262654   6.235904    3.470367    0.0  46.0
I2 node 3  262654   5.815496    2.918088    0.0  33.0

I3 node 0  262654   6.667288    3.212547    0.0  35.0
I3 node 1  262654   6.740074    5.908833    0.0 124.0
I3 node 2  262654   6.194510    2.874678    0.0  41.0
I3 node 3  262654   6.279484    2.942871    0.0  78.0

S2 node 0  262654   11.648388   5.156614    0.0 169.0
S2 node 1  262654   16.812940   10.361554   0.0  85.0
S2 node 2  262654   16.964093   10.136115   0.0 264.0
S2 node 3  262654   13.825072   9.558455    0.0 355.0

S3 node 0  262654   15.229745   9.627961    0.0 139.0
S3 node 1  262654   21.023280   12.818874   0.0 144.0
S3 node 2  262654   22.802485   13.512701   0.0  92.0
S3 node 3  262654   19.567787   11.455543   0.0  98.0
Statistics:
 IMAGE        NPIX      MEAN             RMS            MIN    MAX
ACIS_total   6004901   1803.763         2374.334        0.0   105035


I2 node 0  262654   1504.394890 286.661274   279.0    8995.0
I2 node 1  262654   1586.643886 395.906711   312.0   35698.0
I2 node 2  262654   1617.071413 338.115656   317.0    9125.0
I2 node 3  262654   1614.715268 406.153372   298.0   27932.0

I3 node 0  262654   1691.006764 403.565423   292.0    6663.0
I3 node 1  262654   1775.141416 1346.418121  302.0   34200.0
I3 node 2  262654   1551.603318 277.106346   289.0    7813.0
I3 node 3  262654   1537.558980 296.558849   272.0   26454.0

S2 node 0  262654   2113.459130 303.788765  1106.0   21132.0
S2 node 1  262654   2246.034504 491.065975  1158.0   12439.0
S2 node 2  262654   2477.425283 467.354765  1477.0   18613.0
S2 node 3  262654   2403.032872 330.981976  1392.0   40460.0

S3 node 0  262654   3759.021791 1777.272458 1534.0   13445.0
S3 node 1  262654   4943.683684 2068.753592    0.0   13938.0
S3 node 2  262654   3751.936554 979.030648  1510.0    9205.0
S3 node 3  262654   2901.150043 437.693878  1650.0   10185.0
)
|
)
|
)
|
)
|
| Mar 2014 | Dec 2013 | Sep 2013 | Jun 0213 |
|---|
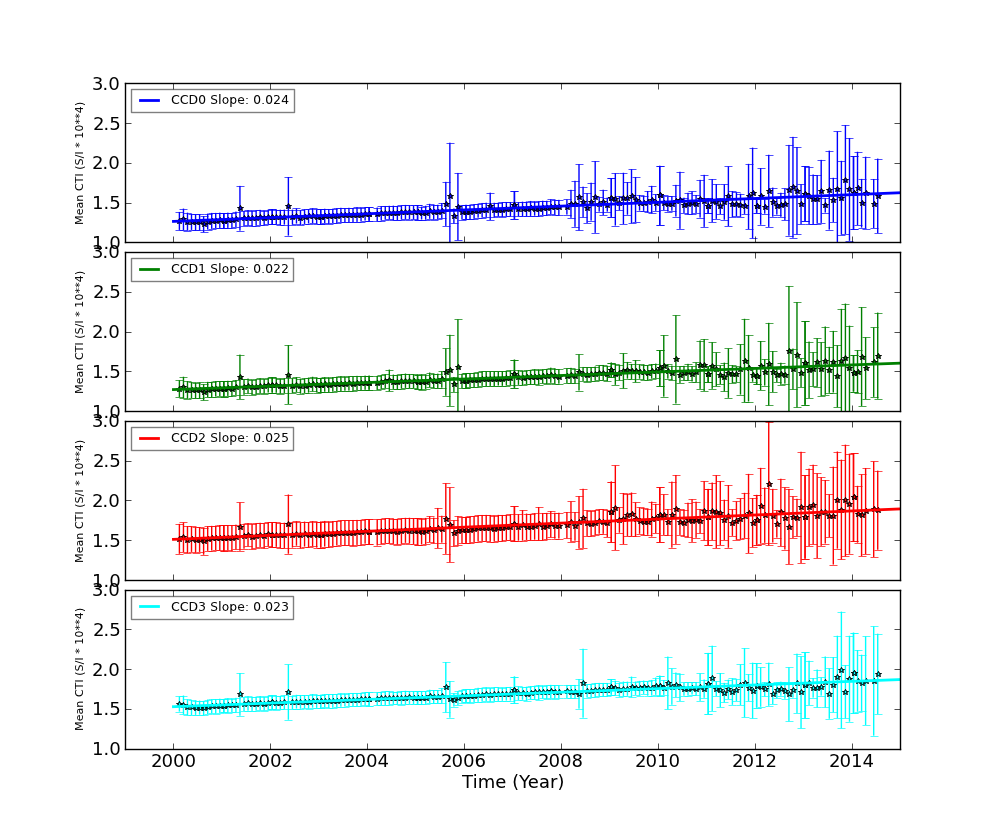
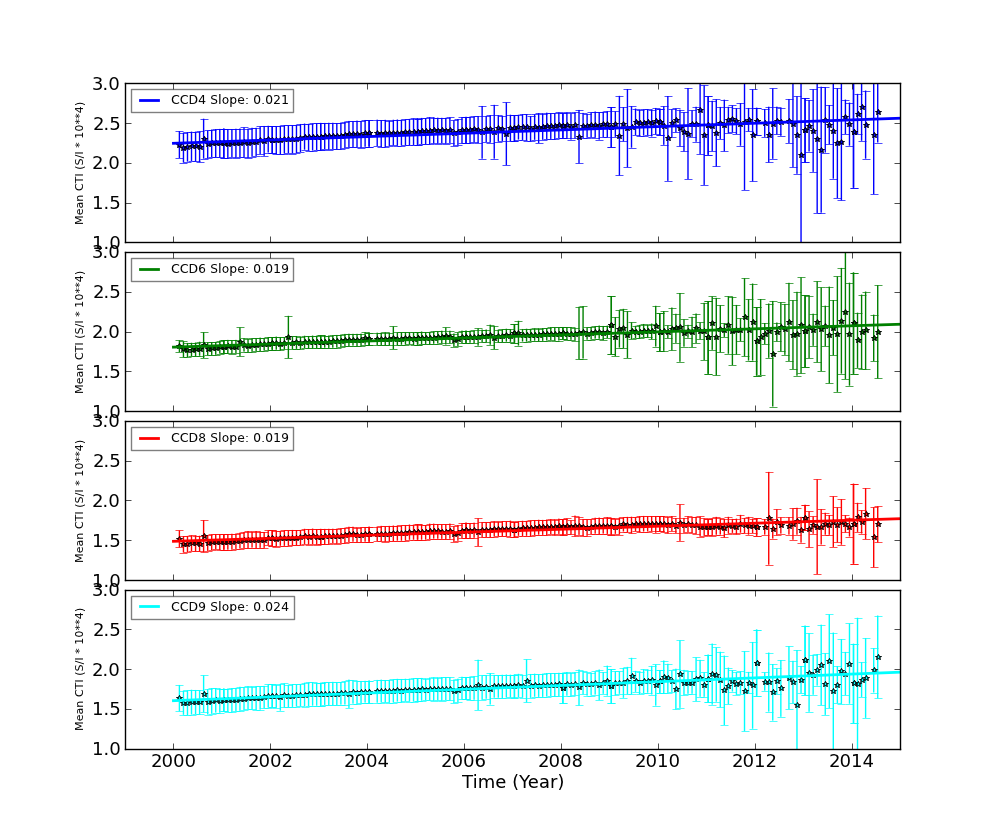
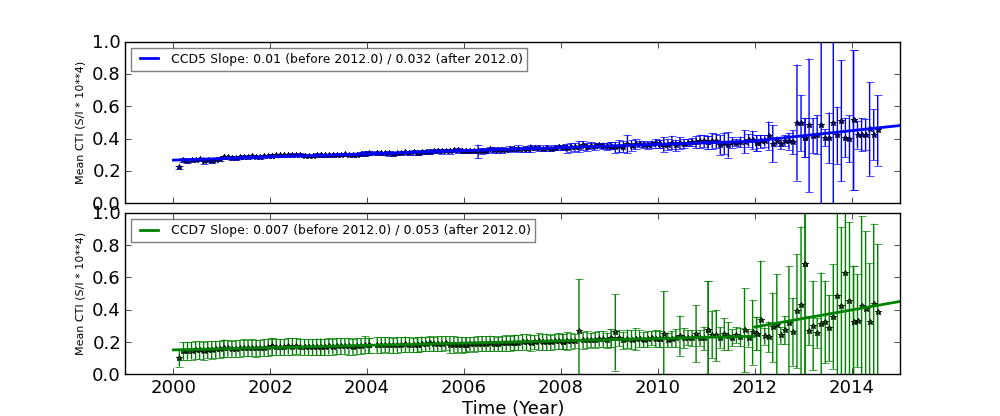
We report CTIs with a refined data definition. CTIs were computed for the temperature dependency corrected data. Please see CTI page for detailed explanation. CTI's are computed for Mn K alpha, and defined as slope/intercept x10^4 of row # vs ADU. Data file: here
| The Mean (max) FPT: | |
|---|---|
| -116.13 | +/- 1.51 C |
| Mean Width: | |
| 0.54 | +/- 0.59 days |
We are using 10 period moving averages to show trends of peak temperatures and peak widths. Note, the gaps in the width plot are due to missing/corrupted data.
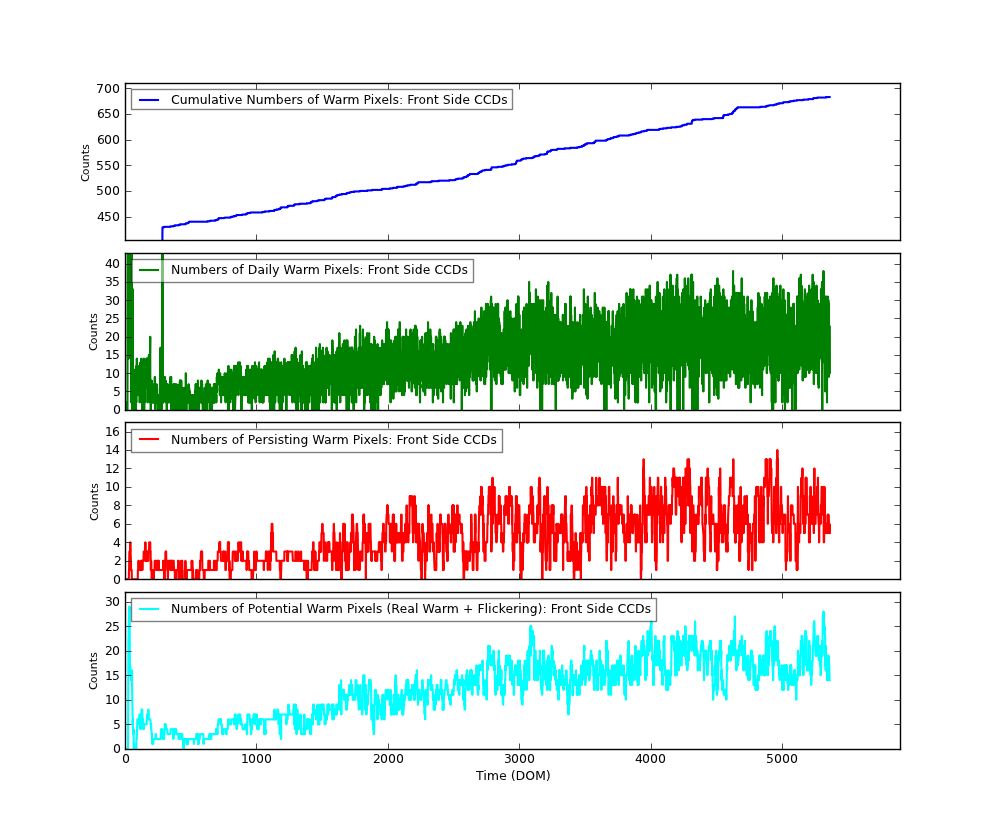
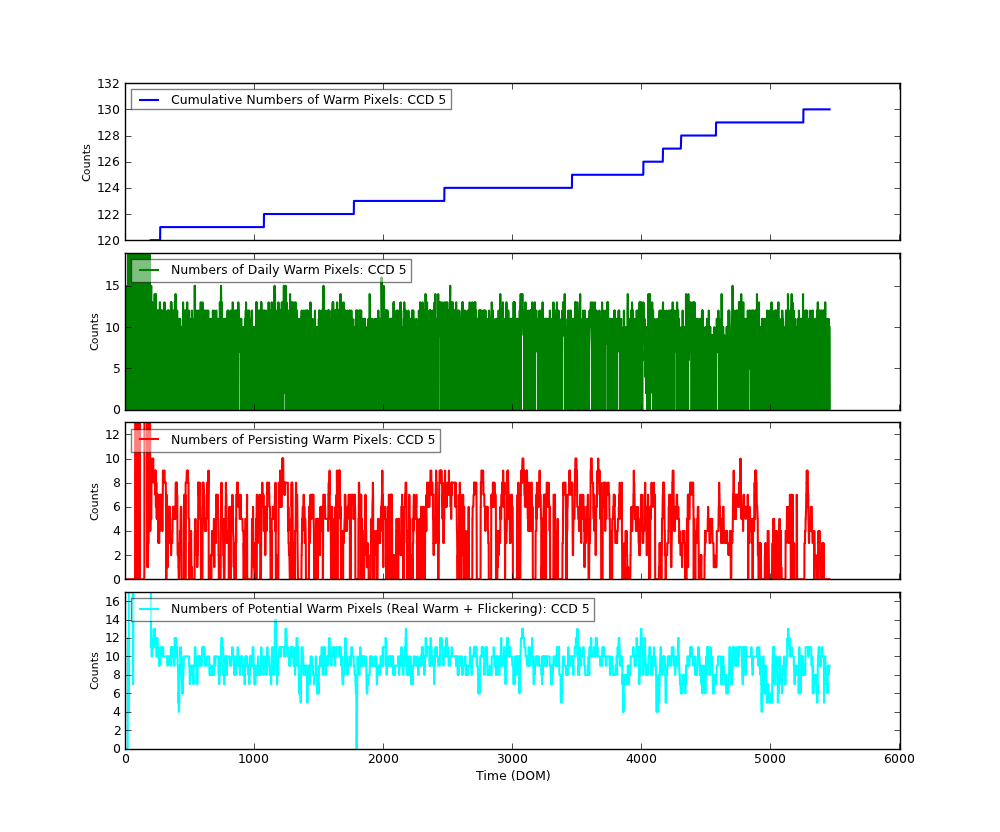
The plots below were generated with a new warm pixel finding script. Please see Acis Bad Pixel Page for details.
| Name | Low (keV) | High(KeV) | Description |
|---|---|---|---|
| SSoft | 0.00 | 0.50 | Super soft photons |
| Soft | 0.50 | 1.00 | Soft photons |
| Med | 1.00 | 3.00 | Moderate energy photons |
| Hard | 3.00 | 5.00 | Hard Photons |
| Harder | 5.00 | 10.00 | Very Hard photons |
| Hardest | 10.00 | Beyond 10 keV |
Please refer to Maximum Dose Trends for more details.
)
        IMAGE                NPIX      MEAN    STDDEV      MIN       MAX
HRCI_06_2014.fits          16777216   0.006    0.0787      0.0       6.0
)
        IMAGE                NPIX      MEAN    STDDEV      MIN       MAX
HRCI_08_1999_06_2014.fits  16777216   4.264    4.877       0.0       292.0
)
          IMAGE                NPIX      MEAN    STDDEV      MIN       MAX
HRCS_06_2014.fits          16777216     0.030    0.2935     0.0        35.0
)
        IMAGE                NPIX     MEAN      STDDEV      MIN      MAX
HRCS_08_1999_06_2014.fits  16777216  15.455     27.060      0.0      1679.0
|
|
Max dose trend plots corrected for events that "pile-up"
in the center of the taps due to bad position information.
|
)
|
)
|
)
|
)
|
| Mar 2014 | Dec 2013 | Sep 2013 | Jun 2013 |
|---|
)
|
)
|
)
|
)
|
| Mar 2014 | Dec 2013 | Sep 2013 | Jun 2013 |
|---|
We plot the width of the zero order streak of ACIS/HETG observations and the width of the zero order image for HRC/LETG observations of point sources. No significant defocusing trend is seen at this time. See Gratings Focus pages.
Fid light positions on ACA drift with time. The drift trends of Fid light 2 with ACIS-I and ACIS-S configurations are shown below.
The top panel shows Fid light 2 drift in ACENT I (app. along with -Y axis), and the
bottom panel shows that in ACENT J (app. along with Z axis). The unit is a pixel, and
one pixel is approximately 0.5 arcsec. The slope listed at the top right corner is
the change in a position per year (arcsec/yr). The vertical line on DOM = 1411 (Jun 1, 2003)
indicates a transition date of use of IRU-1 to IRU-2.
See also Tom Aldcroft's updated page:
https://cxc.cfa.harvard.edu/mta/ASPECT/fid_drift
| ACIS Temperatures - Daily Maximums | ||||||
|---|---|---|---|---|---|---|
| MSID | MEAN | RMS | DELTA/YR | DELTA/YR/YR | UNITS | DESCRIPTION |
| 1PDEAAT | 304.92 | 8.73 | -5.117e-01 | 1.073e+00 | K | PSMC DEA PS A TEMP |
| 1PIN1AT | 291.69 | 7.77 | -3.513e-01 | 8.658e-01 | K | PSMC TEMP 1A |
| HRMA Computed Averages - Daily Maximums | ||||||
|---|---|---|---|---|---|---|
| MSID | MEAN | RMS | DELTA/YR | DELTA/YR/YR | UNITS | DESCRIPTION |
| OBAAVG | 285.80 | 2.23 | 4.834e-01 | 8.792e-02 | K | OBA/TFTE TEMP |
| EPHIN Temperatures - Daily Maximums | ||||||
|---|---|---|---|---|---|---|
| MSID | MEAN | RMS | DELTA/YR | DELTA/YR/YR | UNITS | DESCRIPTION |
| TEIO | 326.21 | 21.72 | 7.763e+00 | -1.160e+01 | K | EPHIN ELECTRONICS HOUSING TEMP |
| TEPHIN | 332.59 | 6.22 | 1.075e-01 | 6.037e+00 | K | EPHIN SENSOR HOUSING TEMP |
| S/C Main Temperatures - Daily Maximums | ||||||
|---|---|---|---|---|---|---|
| MSID | MEAN | RMS | DELTA/YR | DELTA/YR/YR | UNITS | DESCRIPTION |
| TCYLFMZM | 305.13 | 26.51 | 2.858e+00 | 9.536e+00 | K | CNT CYL TEMP:-Z SIDE UNDER LAE-1 |
| TCYLFMZP | 307.31 | 25.34 | 2.833e+00 | 8.785e+00 | K | CNT CYL TEMP:-Z SIDE UNDER LAE-2 |
| S/C Ancillary Temperatures - Daily Maximums | ||||||
|---|---|---|---|---|---|---|
| MSID | MEAN | RMS | DELTA/YR | DELTA/YR/YR | UNITS | DESCRIPTION |
| TFSSBKT1 | 337.30 | 20.49 | 5.237e+00 | 2.000e+01 | K | FSS BRACKET-1 TEMP (+Y) |
| TFSSBKT2 | 331.27 | 28.40 | 6.159e+00 | 2.570e+01 | K | FSS BRACKET-2 TEMP (+Y) |
| TSCTSF1 | 296.90 | 4.43 | 2.033e+00 | 1.390e+00 | K | SC-TS FITTING -1 TEMP |
| TSCTSF6 | 298.09 | 5.02 | 2.389e+00 | 1.461e+00 | K | SC-TS FITTING -6 TEMP |
| MUPS - Daily Maximums | ||||||
|---|---|---|---|---|---|---|
| MSID | MEAN | RMS | DELTA/YR | DELTA/YR/YR | UNITS | DESCRIPTION |
| PM1THV1T | 333.47 | 8.23 | -2.762e-01 | -1.892e+02 | K | MUPS 1 THRUSTER VALVE 01 TEMP |
| PLINE02T | 317.64 | 11.13 | 3.347e+00 | 5.826e+00 | K | PROP LINE TEMP 02 |
| PLINE03T | 316.64 | 13.64 | 3.278e+00 | 7.846e+00 | K | PROP LINE TEMP 03 |
| PLINE04T | 302.24 | 12.73 | 3.233e+00 | 7.055e+00 | K | PROP LINE TEMP 04 |
| Previous Quarter | ||||||
| MSID | MEAN | RMS | DELTA/YR | DELTA/YR/YR | UNITS | DESCRIPTION |
| OOBTHR06 | 291.70 | 0.80 | 1.063e+00 | 1.312e+02 | K | RT 29: HRMA STRUT |
| OOBTHR07 | 287.19 | 0.58 | 7.019e-01 | 9.676e+01 | K | RT 30: HRMA STRUT |
| OOBTHR23 | 292.60 | 2.37 | 3.450e+00 | 3.094e+02 | K | RT 45: OBA CONE |
| OOBTHR24 | 292.87 | 2.35 | 3.435e+00 | 3.066e+02 | K | RT 46: OBA CONE |
| OOBTHR43 | 261.21 | 1.57 | -2.253e-01 | 8.452e+01 | K | RT 65: TFTE COVER |
| OOBTHR44 | 293.68 | 1.42 | 1.972e+00 | 1.603e+02 | K | RT 66: TFTE COVER |
| Previous Quarter | ||||||
| MSID | MEAN | RMS | DELTA/YR | DELTA/YR/YR | UNITS | DESCRIPTION |
| OHRTHR02 | 295.31 | 4.718e-03 | 1.021e-02 | 8.989e-03 | K | RT 2: HRMA FORWARD APERTURE PLATE |
| OHRTHR21 | 295.27 | 3.733e-03 | 7.773e-03 | -3.275e-02 | K | RT 3: HRMA FOWARD APERTURE PLATE |
| OHRTHR23 | 295.26 | 4.855e-03 | 3.101e-02 | -2.571e-01 | K | RT 8: HRMA PRECOLLIMATOR PLATE 10 |
| OHRTHR45 | 295.25 | 1.031e-03 | 5.360e-03 | 1.721e-02 | K | RT 4: HRMA FORWARD APERTURE PLATE |
| OHRTHR46 | 295.27 | 1.279e-03 | 6.715e-03 | 1.333e-01 | K | RT 7: HRMA FORWARD APERTURE PLATE |
|
|
Note: From Feb 2010, the computation of reaction wheel rotations are slightly modified.
| Year | Month | |||||||||||
|---|---|---|---|---|---|---|---|---|---|---|---|---|
| 1999 | Jul | Aug | Sep | Oct | Nov | Dec | ||||||
| 2000 | Jan | Feb | Mar | Apr | May | Jun | Jul | Aug | Sep | Oct | Nov | Dec |
| 2001 | Jan | Feb | Mar | Apr | May | Jun | Jul | Aug | Sep | Oct | Nov | Dec |
| 2002 | Jan | Feb | Mar | Apr | May | Jun | Jul | Aug | Sep | Oct | Nov | Dec |
| 2003 | Jan | Feb | Mar | Apr | May | Jun | Jul | Aug | Sep | Oct | Nov | Dec |
| 2004 | Jan | Feb | Mar | Apr | May | Jun | Jul | Aug | Sep | Oct | Nov | Dec |
| 2005 | Jan | Feb | Mar | Apr | May | Jun | Jul | Aug | Sep | Oct | Nov | Dec |
| 2006 | Jan | Feb | Mar | Apr | May | Jun | Jul | Aug | Sep | Oct | Nov | Dec |
| 2007 | Jan | Feb | Mar | Apr | May | Jun | Jul | Aug | Sep | Oct | Nov | Dec |
| 2008 | Jan | Feb | Mar | Apr | May | Jun | Jul | Aug | Sep | Oct | Nov | Dec |
| 2009 | Jan | Feb | Mar | Apr | May | Jun | Jul | Aug | Sep | Oct | Nov | Dec |
| 2010 | Jan | Feb | Mar | Apr | May | Jun | Jul | Aug | Sep | Oct | Nov | Dec |
| 2011 | Jan | Feb | Mar | Apr | May | Jun | Jul | Aug | Sep | Oct | Nov | Dec |
| 2012 | Jan | Feb | Mar | Apr | May | Jun | Jul | Aug | Sep | Oct | Nov | Dec |
| 2013 | Jan | Feb | Mar | Apr | May | Jun | Jul | Aug | Sep | Oct | Nov | Dec |
| 2014 | Jan | Feb | Mar | Apr | May | |||||||
)
)
)
)
)
)
)
)
)
)
)
)
)
)
)
)
)
)
)
)
)
)
)
)
)
)
)
)
)