Jul Dose Map
)
TOTAL
)
CCD I3
)
CCD S3
The steps we took to compute the dose map are;
Please check more detail plots at Telemetered Photon Dose Trend page.
Statistics:
# IMAGE     NPIX        MEAN           RMS              MIN     MAX
ACIS_jul14 6004901      7.365         10.129            0.0     387


I2 node 0  262654   7.063169    3.849113    0.0  60.0
I2 node 1  262654   7.313228    3.461977    0.0 133.0
I2 node 2  262654   7.549581    3.415230    0.0  43.0
I2 node 3  262654   7.726792    4.207683    0.0  70.0

I3 node 0  262654   9.990549    4.048693    0.0  40.0
I3 node 1  262654   10.818092   6.731680    0.0 118.0
I3 node 2  262654   8.393377    3.534344    0.0  43.0
I3 node 3  262654   7.549910    3.293415    0.0  75.0

S2 node 0  262654   8.130373    3.872407    0.0 150.0
S2 node 1  262654   8.654855    4.939107    0.0  63.0
S2 node 2  262654   10.031392   8.514377    0.0  94.0
S2 node 3  262654   10.365538   10.697091   0.0 271.0

S3 node 0  262654   13.280970   12.953472   0.0 194.0
S3 node 1  262654   12.979777   9.718509    0.0 141.0
S3 node 2  262654   14.044922   10.806813   0.0 121.0
S3 node 3  262654   12.649728   8.387062    0.0 109.0
Statistics:
 IMAGE        NPIX      MEAN             RMS            MIN    MAX
ACIS_total   6004901    1811.128         2382.380       0.0    105336


I2 node 0  262654   1511.458059 288.238294   279.0    9001.0
I2 node 1  262654   1593.957114 397.783351   312.0   35831.0
I2 node 2  262654   1624.620994 339.811294   321.0    9133.0
I2 node 3  262654   1622.442060 408.112997   300.0   27941.0

I3 node 0  262654   1700.997313 405.680688   293.0    6690.0
I3 node 1  262654   1785.959508 1351.713092  306.0   34294.0
I3 node 2  262654   1559.996696 278.791352   294.0    7847.0
I3 node 3  262654   1545.108890 298.063521   273.0   26529.0

S2 node 0  262654   2121.589503 304.612157  1107.0   21140.0
S2 node 1  262654   2254.689360 492.730713  1163.0   12478.0
S2 node 2  262654   2487.456675 469.849737  1484.0   18679.0
S2 node 3  262654   2413.398410 333.595927  1396.0   40624.0

S3 node 0  262654   3772.302761 1782.571323 1542.0   13466.0
S3 node 1  262654   4956.663461 2069.910811    0.0   13957.0
S3 node 2  262654   3765.981476 979.889377  1518.0    9230.0
S3 node 3  262654   2913.799770 441.111867  1664.0   10212.0
)
|
)
|
)
|
)
|
| Apr 2014 | Jan 2014 | Oct 2013 | Jul 0213 |
|---|
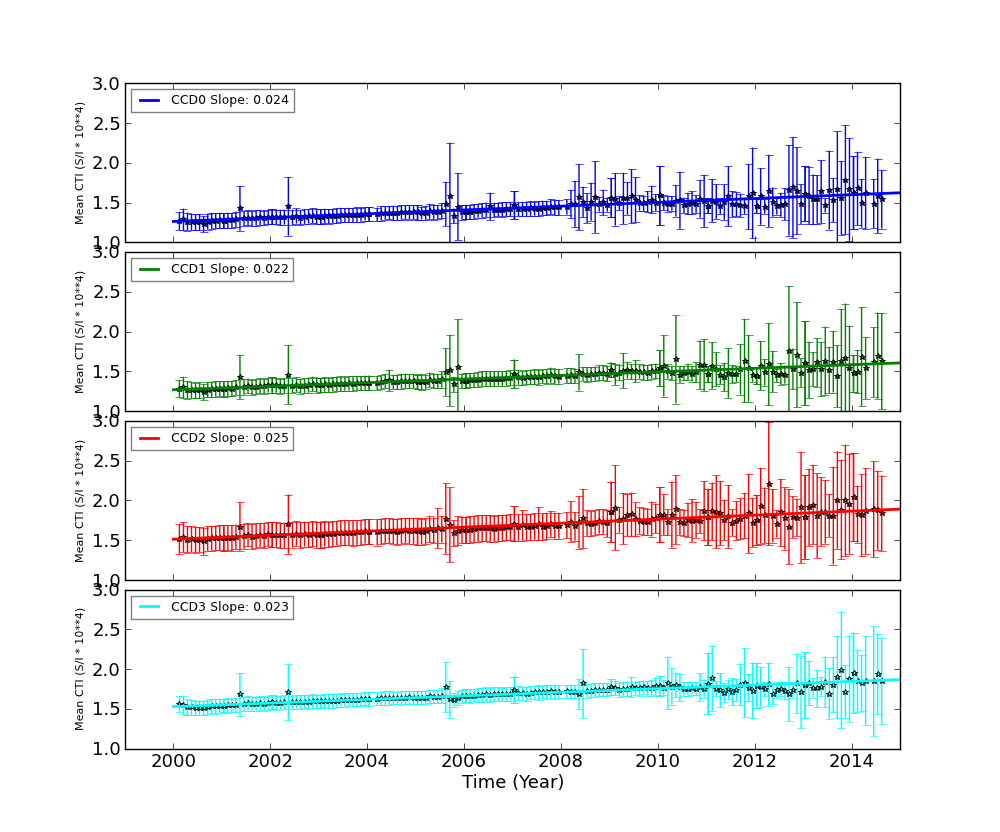
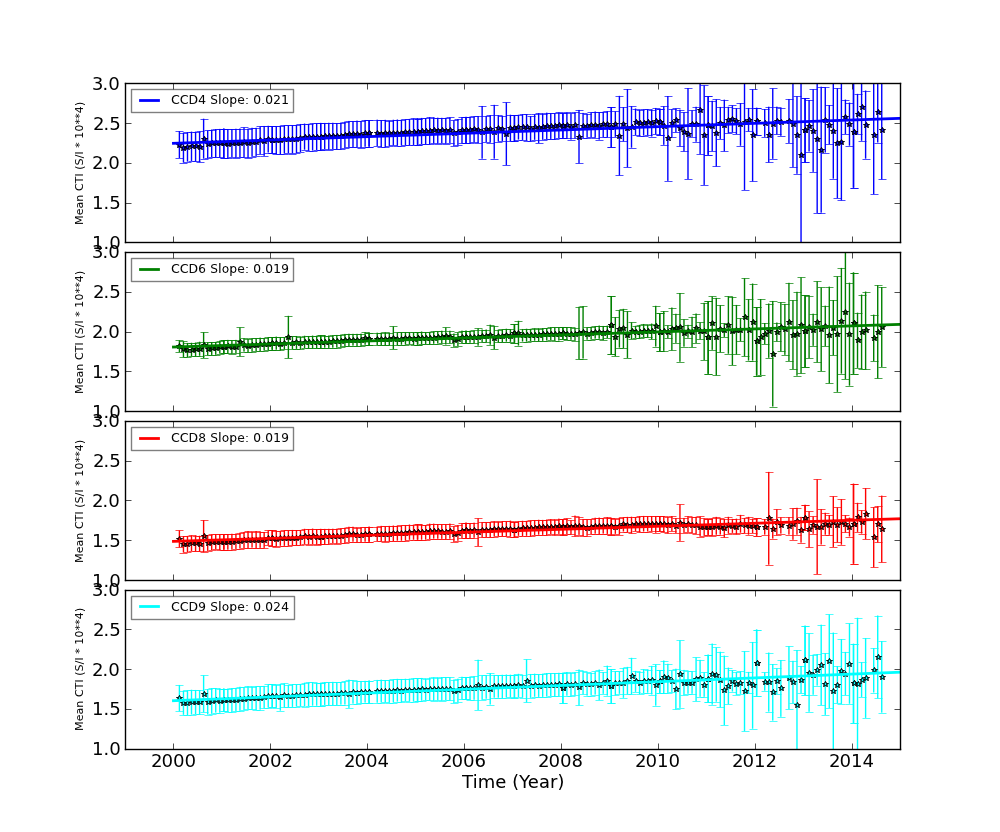
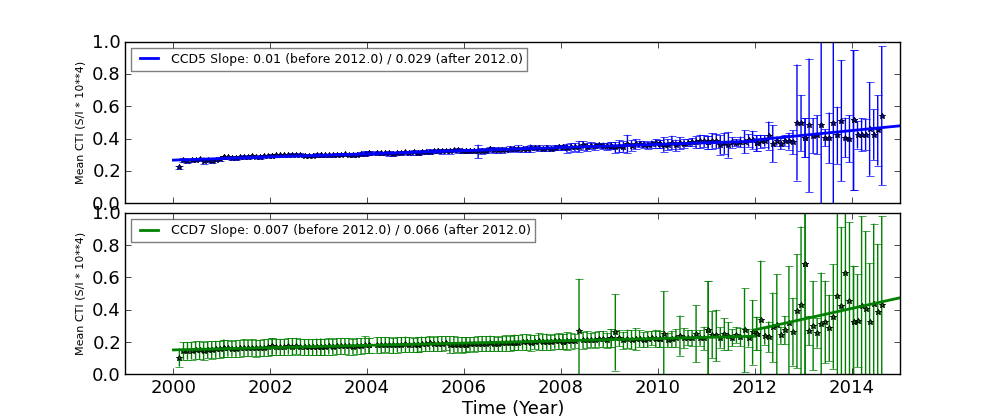
We report CTIs with a refined data definition. CTIs were computed for the temperature dependency corrected data. Please see CTI page for detailed explanation. CTI's are computed for Mn K alpha, and defined as slope/intercept x10^4 of row # vs ADU. Data file: here
| The Mean (max) FPT: | |
|---|---|
| -109.42 | +/- 23.12 C |
| Mean Width: | |
| 0.41 | +/- 0.27 days |
We are using 10 period moving averages to show trends of peak temperatures and peak widths. Note, the gaps in the width plot are due to missing/corrupted data.
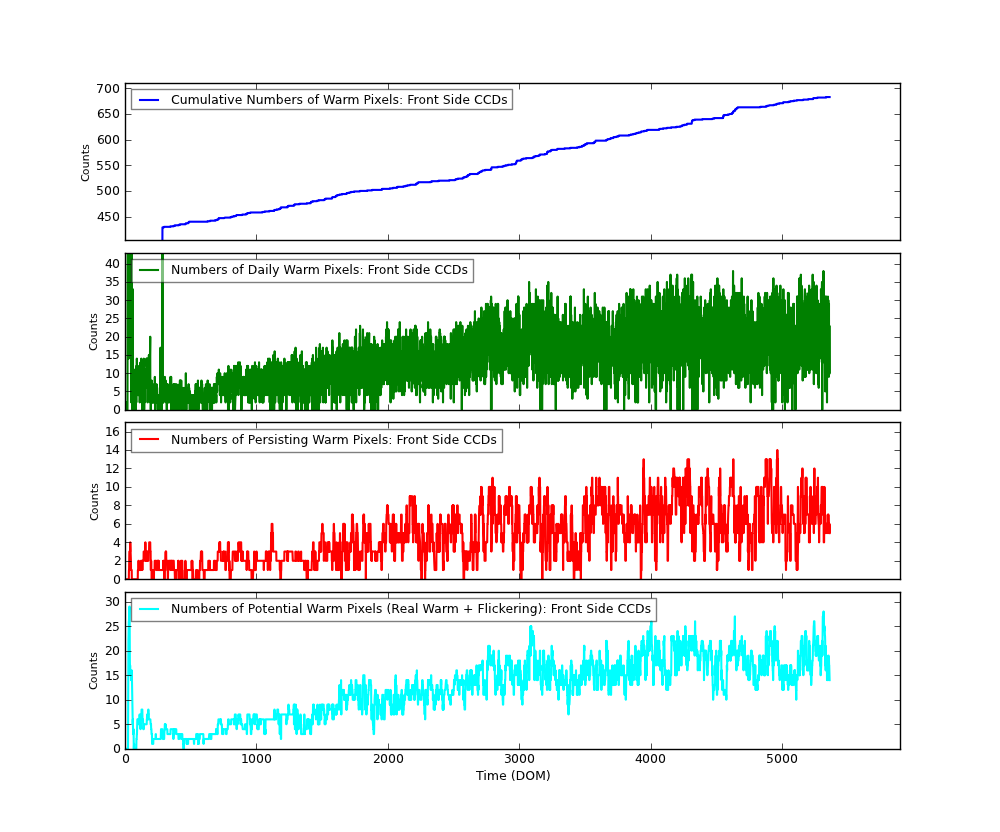
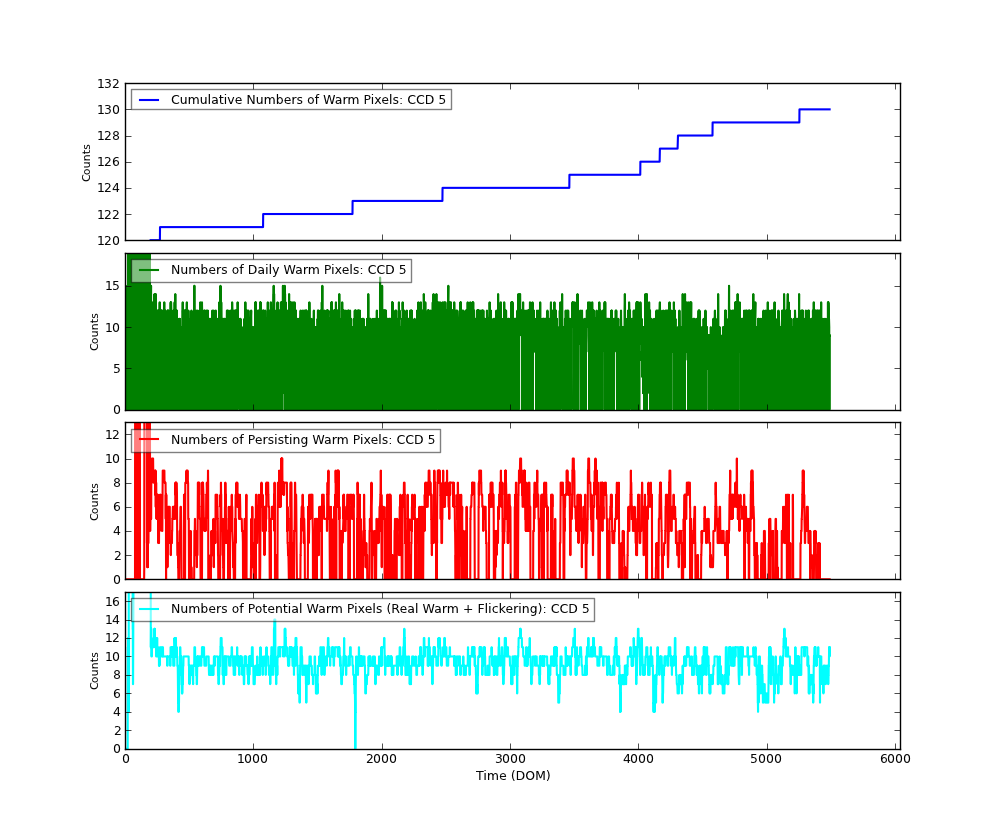
The plots below were generated with a new warm pixel finding script. Please see Acis Bad Pixel Page for details.
| Name | Low (keV) | High(KeV) | Description |
|---|---|---|---|
| SSoft | 0.00 | 0.50 | Super soft photons |
| Soft | 0.50 | 1.00 | Soft photons |
| Med | 1.00 | 3.00 | Moderate energy photons |
| Hard | 3.00 | 5.00 | Hard Photons |
| Harder | 5.00 | 10.00 | Very Hard photons |
| Hardest | 10.00 | Beyond 10 keV |
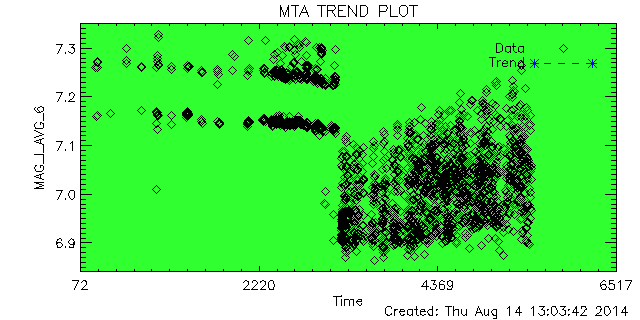
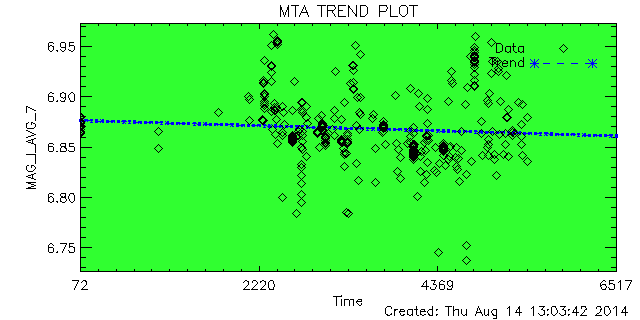
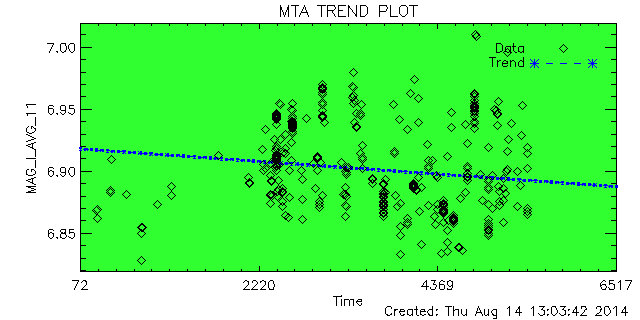
We plot the average corner pixel centroid slope and mean for ACIS observations. Separate plots are shown for FAINT MODE (3X3) and VFAINT MODE (5X5) observations. Metric is the centroid of a Gaussian fit to the histogram of corner pixel PHA values of detected events. Plus signs are FAINT observations, diamonds are VFAINT observations, and boxes are VFAINT observations with centroids computed using only the corner pixels of a 3X3 event island (referred to as AFAINT). We see a very small upward trend.
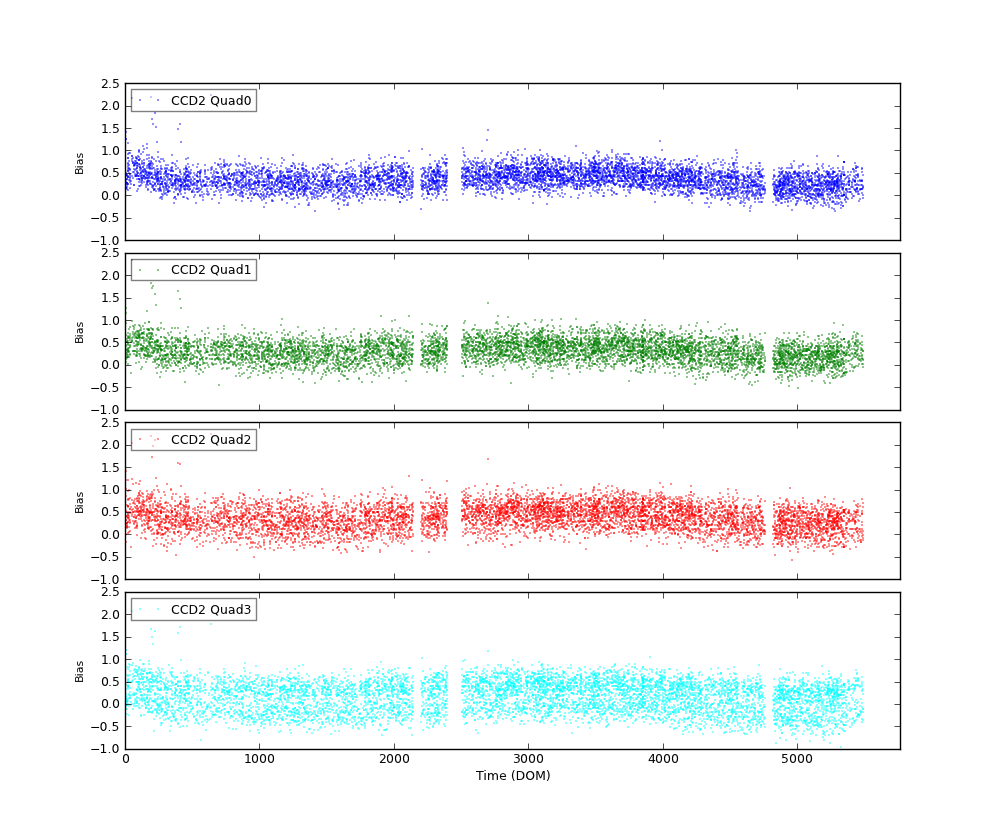
The bias plus overclock level was calculated as follows:
An example of Overclock values as reported in FITS file header:
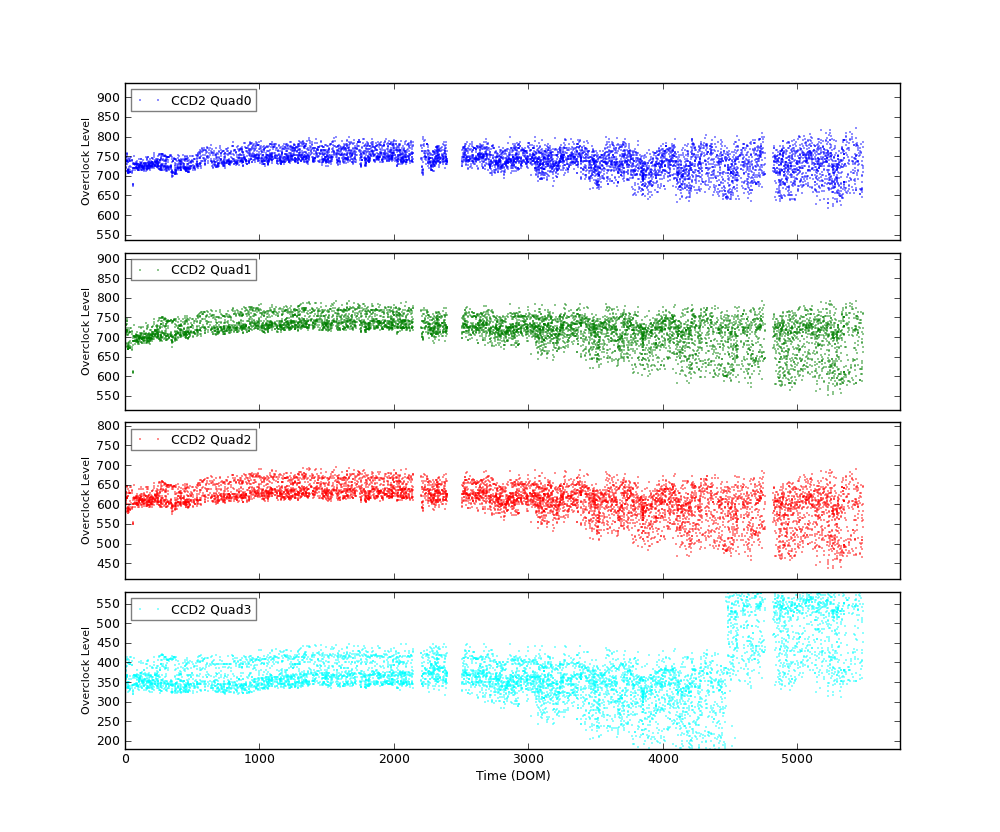
An example of mean bias minus overclock value:
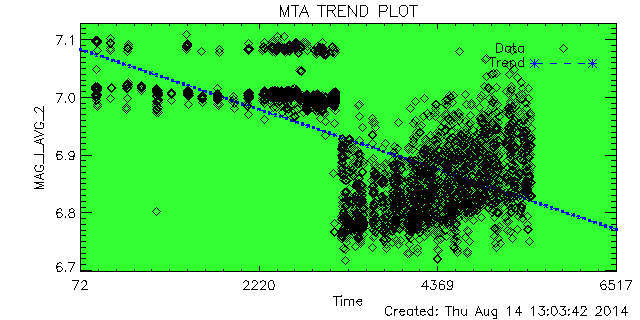
Please refer to Maximum Dose Trends for more details.
No Data
)
        IMAGE                NPIX      MEAN    STDDEV      MIN       MAX
HRCI_08_1999_07_2014.fits  16777216   4.264    4.877       0.0       292.0
)
          IMAGE                NPIX      MEAN    STDDEV      MIN       MAX
HRCS_07_2014.fits          16777216     0.070    0.3627     0.0        19.0
)
        IMAGE                NPIX     MEAN      STDDEV      MIN      MAX
HRCS_08_1999_07_2014.fits  16777216  15.525     27.207      0.0      1681.0
|
|
Max dose trend plots corrected for events that "pile-up"
in the center of the taps due to bad position information.
|
)
|
)
|
)
|
)
|
| Apr 2014 | Jan 2014 | Oct 2013 | Jul 2013 |
|---|
)
|
)
|
)
|
)
|
| Apr 2014 | Jan 2014 | Oct 2013 | Jul 2013 |
|---|
We plot the width of the zero order streak of ACIS/HETG observations and the width of the zero order image for HRC/LETG observations of point sources. No significant defocusing trend is seen at this time. See Gratings Focus pages.
| Previous Quarter | ||||||
| MSID | MEAN | RMS | DELTA/YR | DELTA/YR/YR | UNITS | DESCRIPTION |
| 4RT568T | 292.19 | 1.28 | 3.117e+00 | -9.402e+01 | K | RT 568 - HRMA TEMP |
| 4RT569T | 294.47 | 0.12 | 2.945e-01 | -7.591e+00 | K | RT 569 - HRMA TEMP |
| 4RT570T | 294.38 | 1.065e-02 | 7.010e-03 | 4.225e-02 | K | RT 570 - HRMA TEMP |
| 4RT575T | 295.03 | 1.63 | 3.696e+00 | -1.072e+02 | K | RT 575 - OB CONE TEMP |
| 4RT577T | 295.98 | 3.08 | 7.904e+00 | -2.226e+02 | K | RT 577 - OB CONE TEMP |
| 4RT578T | 293.44 | 2.75 | 7.944e+00 | -2.113e+02 | K | RT 578 - OB CONE TEMP |
| Previous Quarter | ||||||
| MSID | MEAN | RMS | DELTA/YR | DELTA/YR/YR | UNITS | DESCRIPTION |
| 4RT584T | 294.37 | 0.98 | 2.178e+00 | -5.167e+01 | K | RT 584 - STRUT TEMP |
| 4RT585T | 294.46 | 0.98 | 2.538e+00 | -6.199e+01 | K | RT 585 - STRUT TEMP |
| 4RT586T | 291.68 | 0.85 | 2.312e+00 | -5.877e+01 | K | RT 586 - STRUT TEMP |
| 4RT597T | 297.04 | 1.90 | 2.906e+00 | -9.660e+01 | K | RT 597 - TFTE TEMP |
| 4RT598T | 296.51 | 1.91 | 3.649e+00 | -1.175e+02 | K | RT 598 - TFTE TEMP |
|
|
Note: From Feb 2010, the computation of reaction wheel rotations are slightly modified.
| Year | Month | |||||||||||
|---|---|---|---|---|---|---|---|---|---|---|---|---|
| 1999 | Jul | Aug | Sep | Oct | Nov | Dec | ||||||
| 2000 | Jan | Feb | Mar | Apr | May | Jun | Jul | Aug | Sep | Oct | Nov | Dec |
| 2001 | Jan | Feb | Mar | Apr | May | Jun | Jul | Aug | Sep | Oct | Nov | Dec |
| 2002 | Jan | Feb | Mar | Apr | May | Jun | Jul | Aug | Sep | Oct | Nov | Dec |
| 2003 | Jan | Feb | Mar | Apr | May | Jun | Jul | Aug | Sep | Oct | Nov | Dec |
| 2004 | Jan | Feb | Mar | Apr | May | Jun | Jul | Aug | Sep | Oct | Nov | Dec |
| 2005 | Jan | Feb | Mar | Apr | May | Jun | Jul | Aug | Sep | Oct | Nov | Dec |
| 2006 | Jan | Feb | Mar | Apr | May | Jun | Jul | Aug | Sep | Oct | Nov | Dec |
| 2007 | Jan | Feb | Mar | Apr | May | Jun | Jul | Aug | Sep | Oct | Nov | Dec |
| 2008 | Jan | Feb | Mar | Apr | May | Jun | Jul | Aug | Sep | Oct | Nov | Dec |
| 2009 | Jan | Feb | Mar | Apr | May | Jun | Jul | Aug | Sep | Oct | Nov | Dec |
| 2010 | Jan | Feb | Mar | Apr | May | Jun | Jul | Aug | Sep | Oct | Nov | Dec |
| 2011 | Jan | Feb | Mar | Apr | May | Jun | Jul | Aug | Sep | Oct | Nov | Dec |
| 2012 | Jan | Feb | Mar | Apr | May | Jun | Jul | Aug | Sep | Oct | Nov | Dec |
| 2013 | Jan | Feb | Mar | Apr | May | Jun | Jul | Aug | Sep | Oct | Nov | Dec |
| 2014 | Jan | Feb | Mar | Apr | May | Jun | ||||||
)
)
)
)
)
)
)
)
)
)
)
)
)
)