Aug Dose Map
)
TOTAL
)
CCD I3
)
CCD S3
The steps we took to compute the dose map are;
Please check more detail plots at Telemetered Photon Dose Trend page.
Statistics:
# IMAGE     NPIX        MEAN           RMS              MIN     MAX
ACIS_aug14 6004901      10.602         16.297           0.0     1852


I2 node 0  262654   8.179890    3.522738    0.0  45.0
I2 node 1  262654   8.571949    3.891129    0.0 297.0
I2 node 2  262654   8.651453    3.680178    0.0  60.0
I2 node 3  262654   8.603602    3.870428    0.0 110.0

I3 node 0  262654   10.021192   4.025377    0.0  42.0
I3 node 1  262654   10.888259   8.329568    0.0 166.0
I3 node 2  262654   8.943726    3.642372    0.0  64.0
I3 node 3  262654   8.673756    4.163957    0.0 142.0

S2 node 0  262654   12.399100   6.302130    0.0  57.0
S2 node 1  262654   18.205447   12.538645   0.0  97.0
S2 node 2  262654   19.540598   14.992826   0.0 135.0
S2 node 3  262654   16.559437   14.721664   0.0 369.0

S3 node 0  262654   25.748081   37.535654   0.0 280.0
S3 node 1  262654   19.599210   16.600151   0.0 189.0
S3 node 2  262654   22.691406   19.433359   0.0 160.0
S3 node 3  262654   17.601568   14.485297   0.0 144.0
Statistics:
 IMAGE        NPIX      MEAN             RMS            MIN    MAX
ACIS_total   6004901    1821.730         2393.535       0.0   105679


I2 node 0  262654   1519.637950 290.030170   284.0   9014.0
I2 node 1  262654   1602.529063 400.109095   313.0  36128.0
I2 node 2  262654   1633.272448 341.780621   322.0   9146.0
I2 node 3  262654   1631.045662 410.356303   301.0  27952.0

I3 node 0  262654   1711.018506 407.868773   298.0   6729.0
I3 node 1  262654   1796.847767 1358.915330  308.0  34460.0
I3 node 2  262654   1568.940422 280.641173   294.0   7906.0
I3 node 3  262654   1553.782645 300.023861   277.0  26628.0

S2 node 0  262654   2133.988603 305.234489  1124.0  21153.0
S2 node 1  262654   2272.894806 496.795403  1181.0  12560.0
S2 node 2  262654   2506.997273 476.850571  1502.0  18795.0
S2 node 3  262654   2429.957847 340.592343  1405.0  40836.0

S3 node 0  262654   3798.050842 1788.793375 1550.0  13490.0
S3 node 1  262654   4976.262671 2073.560383    0.0  13979.0
S3 node 2  262654   3788.672882 984.490847  1521.0   9244.0
S3 node 3  262654   2931.401338 450.323230  1677.0  10237.0
)
|
)
|
)
|
)
|
| May 2014 | Feb 2014 | Nov 2013 | Aug 0213 |
|---|
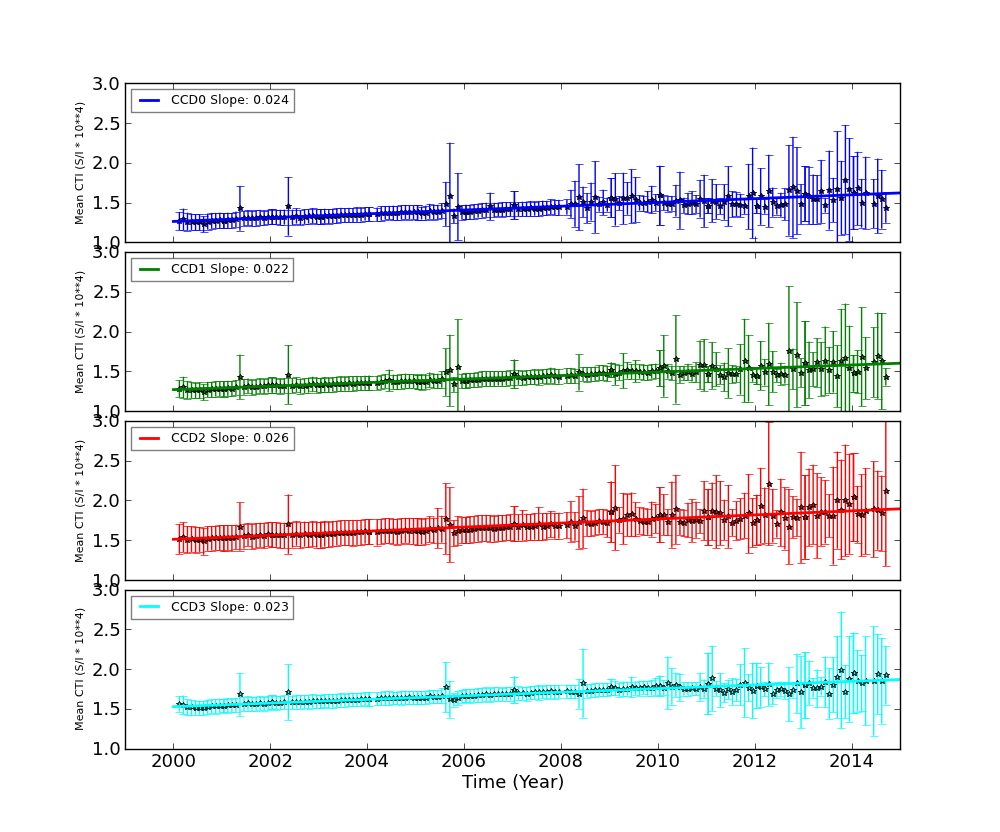
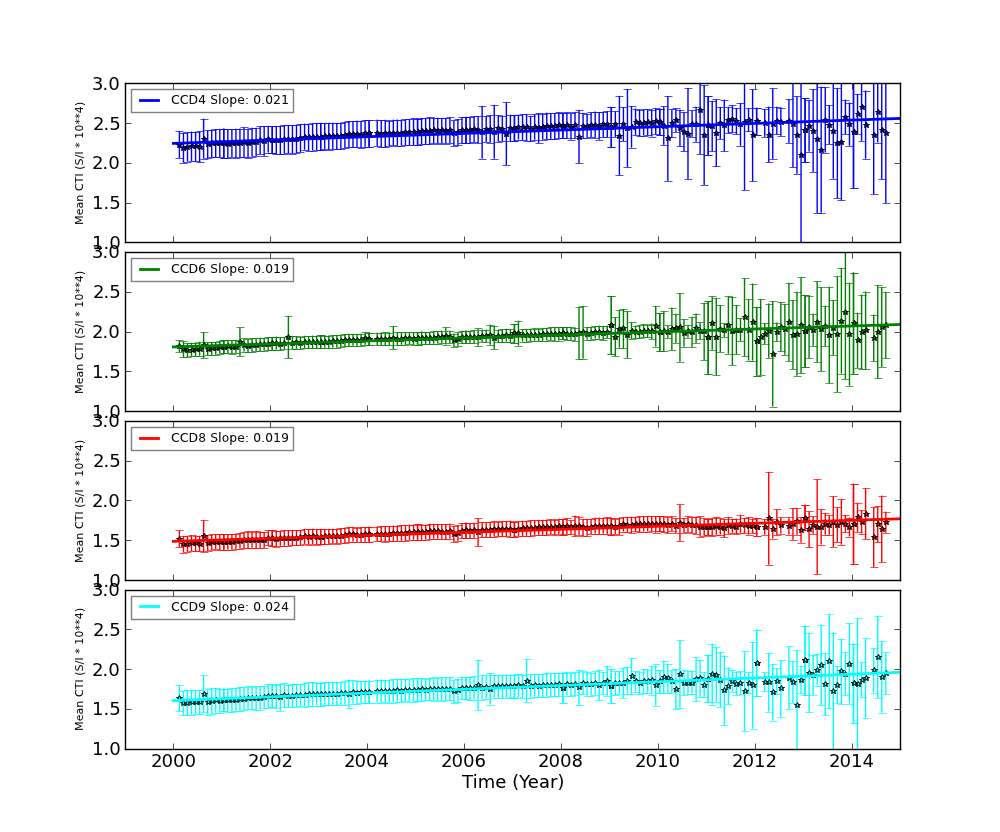
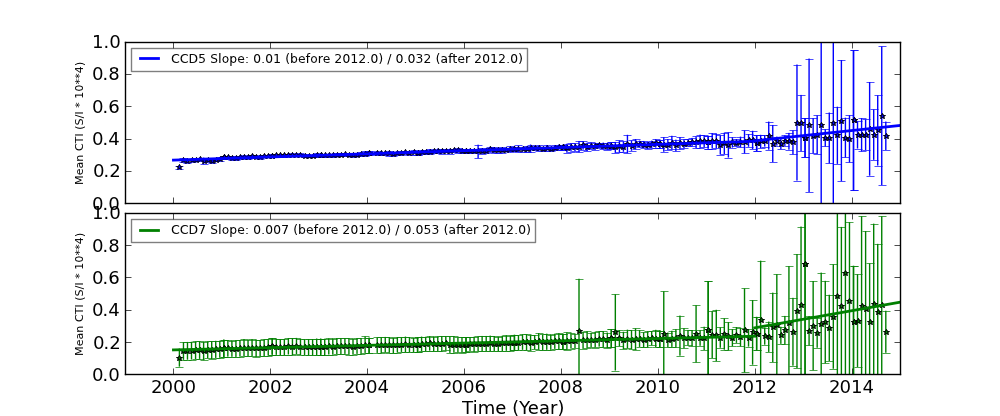
We report CTIs with a refined data definition. CTIs were computed for the temperature dependency corrected data. Please see CTI page for detailed explanation. CTI's are computed for Mn K alpha, and defined as slope/intercept x10^4 of row # vs ADU. Data file: here
| The Mean (max) FPT: | |
|---|---|
| -114.18 | +/- 3.82 C |
| Mean Width: | |
| 0.85 | +/- 0.73 days |
We are using 10 period moving averages to show trends of peak temperatures and peak widths. Note, the gaps in the width plot are due to missing/corrupted data.
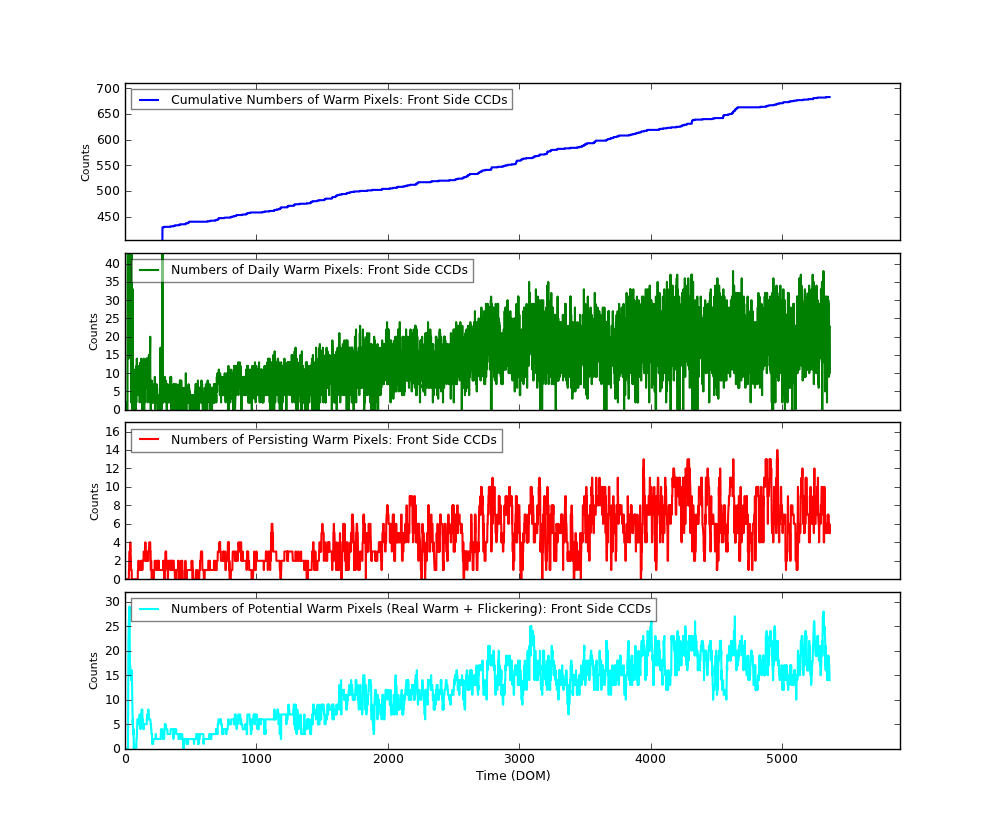
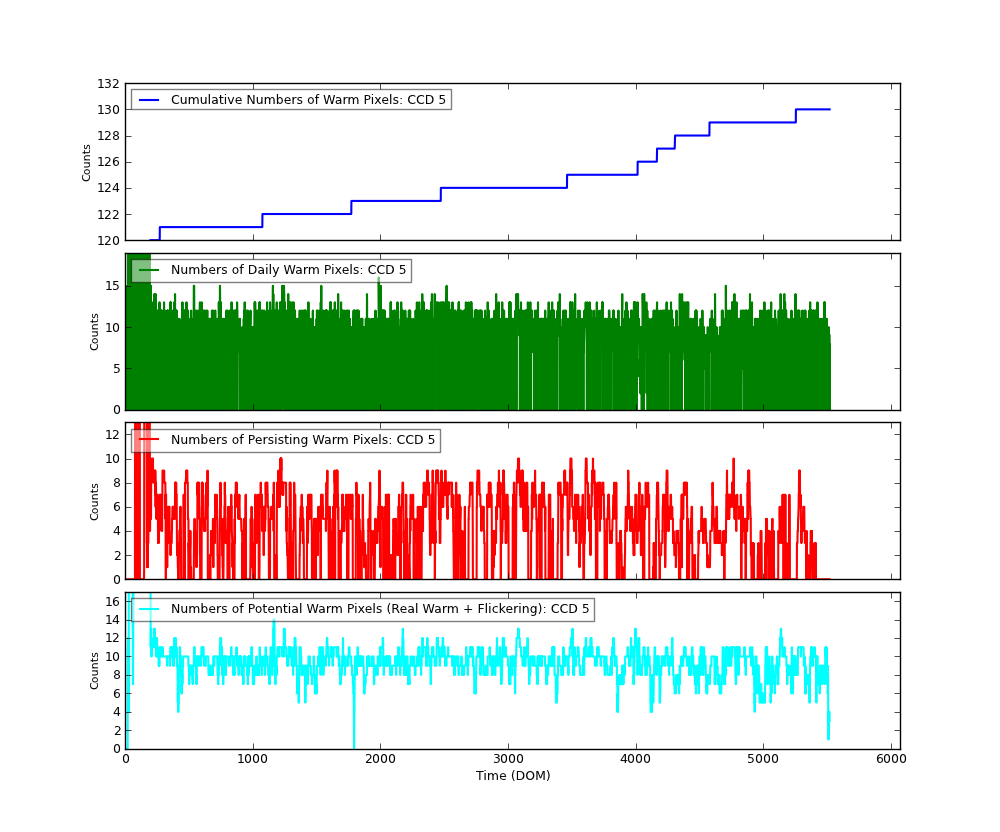
The plots below were generated with a new warm pixel finding script. Please see Acis Bad Pixel Page for details.
| Name | Low (keV) | High(KeV) | Description |
|---|---|---|---|
| SSoft | 0.00 | 0.50 | Super soft photons |
| Soft | 0.50 | 1.00 | Soft photons |
| Med | 1.00 | 3.00 | Moderate energy photons |
| Hard | 3.00 | 5.00 | Hard Photons |
| Harder | 5.00 | 10.00 | Very Hard photons |
| Hardest | 10.00 | Beyond 10 keV |
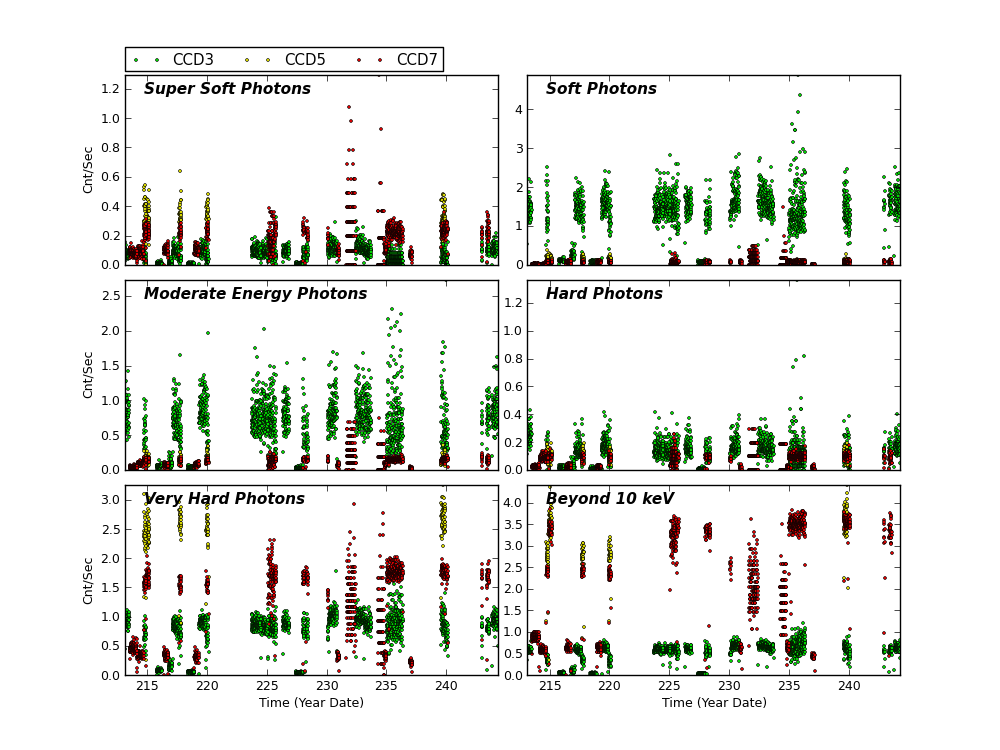
Please refer to Maximum Dose Trends for more details.
)
|
|---|
 -
         IMAGE                NPIX      MEAN    STDDEV      MIN       MAX
 HRCI_08_2014.fits          16777216   0.010    0.0987      0.0       3.0
)
        IMAGE                NPIX      MEAN    STDDEV      MIN       MAX
HRCI_08_1999_08_2014.fits  16777216   4.273    4.879       0.0       292.0
No Data
)
        IMAGE                NPIX     MEAN      STDDEV      MIN      MAX
HRCS_08_1999_08_2014.fits  16777216  15.525     27.207      0.0      1681.0
|
|
Max dose trend plots corrected for events that "pile-up"
in the center of the taps due to bad position information.
|
)
|
)
|
)
|
)
|
| May 2014 | Feb 2014 | Nov 2013 | Aug 2013 |
|---|
)
|
)
|
)
|
)
|
| May 2014 | Feb 2014 | Nov 2013 | Aug 2013 |
|---|
Plots below show various characteristics of detected imaging sources. Standard level 2 data products (*src2.fits) are used. Only observations with focus (sim_x) within 0.01 mm of nominal value for given SI configuration are used. Sources are also filtered for strength (SNR > 15).
For individual detectors, please go to MTA SRC2 Monitoring page.
)
)
)
|
)
|
)
|
)
|
)
|
)
|
)
|
)
|
We plot the width of the zero order streak of ACIS/HETG observations and the width of the zero order image for HRC/LETG observations of point sources. No significant defocusing trend is seen at this time. See Gratings Focus pages.

The following plots are the difference between coordinates obtained from Chandra observations and those obtained from existing catalogs vs time in day of mission.
The following steps are taken to generate these plots.
The large dispersion around DOM ~ 2400 (Jan 2005) are all due to none grating Capella observations. Many observations are off-axis observations (e.g., obsid 6558).
| Previous Quarter | ||||||
| MSID | MEAN | RMS | DELTA/YR | DELTA/YR/YR | UNITS | DESCRIPTION |
| 1CBAT | 206.07 | 2.10 | 6.060e+00 | 1.503e+02 | K | CAMERA BODY TEMP. A |
| 1CBBT | 206.62 | 2.12 | 7.100e+00 | 1.793e+02 | K | CAMERA BODY TEMP. B |
| 1CRAT | 146.41 | 1.77 | 4.635e+00 | 4.925e+01 | K | COLD RADIATOR TEMP. A |
| 1CRBT | 147.00 | 2.01 | 5.229e+00 | 6.031e+01 | K | COLD RADIATOR TEMP. B |
| 1DACTBT | 256.11 | 2.68 | 6.538e-01 | -1.098e+01 | K | DA COLLIMATOR TEMP. B |
| 1DEAMZT | 287.24 | 6.51 | 2.119e+01 | 2.419e+02 | K | DEA -Z PANEL TEMP |
| 1DPAMYT | 288.42 | 7.11 | 1.819e+01 | 5.114e+02 | K | DPA -Y PANEL TEMP |
| 1DPAMZT | 291.49 | 6.82 | 1.865e+01 | 4.653e+02 | K | DPA -Z PANEL TEMP |
| 1OAHAT | 242.87 | 2.14 | 4.053e+00 | 7.850e+01 | K | OPEN ACTUATOR HOUSING TEMP. A |
| 1OAHBT | 239.16 | 1.95 | 3.727e+00 | 9.506e+01 | K | OPEN ACTUATOR HOUSING TEMP. B |
| 1PDEAAT | 301.18 | 7.93 | -1.632e+01 | 2.652e+02 | K | PSMC DEA PS A TEMP |
| 1PDEABT | 292.99 | 7.73 | -1.640e+01 | 2.220e+02 | K | PSMC DEA PS B TEMP |
| 1PIN1AT | 288.42 | 7.00 | -1.373e+01 | 1.739e+02 | K | PSMC TEMP 1A |
| 1WRAT | 189.12 | 2.23 | 7.463e+00 | 1.238e+02 | K | WARM RADIATOR TEMP. A |
| 1WRBT | 188.76 | 2.22 | 7.339e+00 | 1.177e+02 | K | WARM RADIATOR TEMP. B |
| Previous Quarter | ||||||
| MSID | MEAN | RMS | DELTA/YR | DELTA/YR/YR | UNITS | DESCRIPTION |
| DEAHK1 | 18.99 | 6.56 | 1.681e+01 | 4.880e+02 | C | DPA Thermistor 1 - BEP PC Board |
| DEAHK2 | 17.24 | 6.71 | 1.726e+01 | 5.078e+02 | C | DPA Thermistor 2 - BEP Oscillator |
| DEAHK3 | 18.75 | 8.42 | 1.556e+01 | 6.905e+02 | C | DPA Thermistor 3 - FEP 0 Mongoose |
| DEAHK4 | 17.40 | 7.67 | 1.651e+01 | 6.256e+02 | C | DPA Thermistor 4 - FEP 0 PC Board |
| DEAHK5 | 19.01 | 8.16 | 1.575e+01 | 6.965e+02 | C | DPA Thermistor 5 - FEP 0 ACTEL |
| DEAHK6 | 18.78 | 7.93 | 1.625e+01 | 6.668e+02 | C | DPA Thermistor 6 - FEP 0 RAM |
| DEAHK7 | 15.72 | 7.51 | 1.701e+01 | 6.192e+02 | C | DPA Thermistor 7 - FEP 0 Frame Buf. |
| DEAHK8 | 23.63 | 7.52 | 1.680e+01 | 5.746e+02 | C | DPA Thermistor 8 - FEP 1 Mongoose |
| DEAHK9 | 20.47 | 7.56 | 1.781e+01 | 5.882e+02 | C | DPA Thermistor 9 - FEP 1 PC Board |
| DEAHK10 | 23.04 | 7.65 | 1.661e+01 | 6.067e+02 | C | DPA Thermistor 10- FEP 1 ACTEL |
| DEAHK11 | 21.92 | 7.88 | 1.723e+01 | 6.416e+02 | C | DPA Thermistor 11- FEP 1 RAM |
| DEAHK12 | 17.02 | 7.67 | 1.783e+01 | 6.070e+02 | C | DPA Thermistor 12- FEP 1 Frame Buf. |
| DEAHK13 | 0.000e+00 | 0.000e+00 | 0.000e+00 | 0.000e+00 | C | DEA Video Board ADC |
| DEAHK15 | -248.59 | 0.18 | -3.185e-01 | -1.003e+01 | C | Focal Plane Temp. Board 12 |
| DEAHK16 | -119.12 | 1.16 | 2.541e+00 | 7.401e+01 | C | Focal Plane Temp. Board 11 |
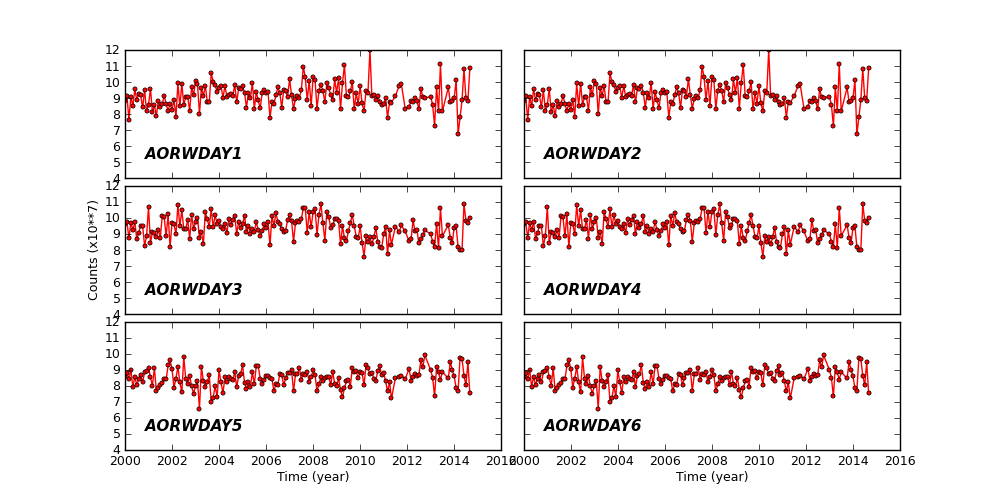
Reaction Wheel Rotations
| Year | Month | |||||||||||
|---|---|---|---|---|---|---|---|---|---|---|---|---|
| 1999 | Jul | Aug | Sep | Oct | Nov | Dec | ||||||
| 2000 | Jan | Feb | Mar | Apr | May | Jun | Jul | Aug | Sep | Oct | Nov | Dec |
| 2001 | Jan | Feb | Mar | Apr | May | Jun | Jul | Aug | Sep | Oct | Nov | Dec |
| 2002 | Jan | Feb | Mar | Apr | May | Jun | Jul | Aug | Sep | Oct | Nov | Dec |
| 2003 | Jan | Feb | Mar | Apr | May | Jun | Jul | Aug | Sep | Oct | Nov | Dec |
| 2004 | Jan | Feb | Mar | Apr | May | Jun | Jul | Aug | Sep | Oct | Nov | Dec |
| 2005 | Jan | Feb | Mar | Apr | May | Jun | Jul | Aug | Sep | Oct | Nov | Dec |
| 2006 | Jan | Feb | Mar | Apr | May | Jun | Jul | Aug | Sep | Oct | Nov | Dec |
| 2007 | Jan | Feb | Mar | Apr | May | Jun | Jul | Aug | Sep | Oct | Nov | Dec |
| 2008 | Jan | Feb | Mar | Apr | May | Jun | Jul | Aug | Sep | Oct | Nov | Dec |
| 2009 | Jan | Feb | Mar | Apr | May | Jun | Jul | Aug | Sep | Oct | Nov | Dec |
| 2010 | Jan | Feb | Mar | Apr | May | Jun | Jul | Aug | Sep | Oct | Nov | Dec |
| 2011 | Jan | Feb | Mar | Apr | May | Jun | Jul | Aug | Sep | Oct | Nov | Dec |
| 2012 | Jan | Feb | Mar | Apr | May | Jun | Jul | Aug | Sep | Oct | Nov | Dec |
| 2013 | Jan | Feb | Mar | Apr | May | Jun | Jul | Aug | Sep | Oct | Nov | Dec |
| 2014 | Jan | Feb | Mar | Apr | May | Jun | Jul | |||||
)
)
)
)
)
)
)
)
)
)
)
)
)
)
)
)
)
)
)
)
)
)
)
)
)
)
)
)
)
)
)
)
)