Sep Dose Map
)
TOTAL
)
CCD I3
)
CCD S3
The steps we took to compute the dose map are;
Please check more detail plots at Telemetered Photon Dose Trend page.
Statistics:
# IMAGE     NPIX        MEAN           RMS              MIN     MAX
ACIS_sep14 6004901      6.757          15.563           0.0     15556


I2 node 0  262654   8.459684    3.649276    0.0    51.0
I2 node 1  262654   8.852212    4.420574    0.0   364.0
I2 node 2  262654   8.742635    3.633568    0.0    67.0
I2 node 3  262654   8.570435    3.969257    0.0    53.0

I3 node 0  262654   8.738705    3.788974    0.0    40.0
I3 node 1  262654   9.216449    9.555910    0.0  1420.0
I3 node 2  262654   8.367440    3.600953    0.0    84.0
I3 node 3  262654   8.619148    17.547017   0.0  7437.0

S2 node 0  262654   8.792842    54.779781   0.0 15556.0
S2 node 1  262654   8.605342    3.987620    0.0    60.0
S2 node 2  262654   8.787963    4.304201    0.0   109.0
S2 node 3  262654   8.620530    3.811419    0.0   488.0

S3 node 0  262654   9.338791    5.418296    0.0   152.0
S3 node 1  262654   10.426673   4.217875    0.0    93.0
S3 node 2  262654   9.814844    3.512108    0.0    45.0
S3 node 3  262654   8.978626    3.283843    0.0    39.0
Statistics:
 IMAGE        NPIX      MEAN             RMS            MIN    MAX
ACIS_total   6004901    1828.486         2402.085       0.0    106149


I2 node 0  262654   1528.097633 291.947684  286.0    9027.0
I2 node 1  262654   1611.381275 403.170088  318.0   36492.0
I2 node 2  262654   1642.015082 343.629305  323.0    9160.0
I2 node 3  262654   1639.616097 412.777984  302.0   27963.0

I3 node 0  262654   1719.757210 409.986244  300.0    6760.0
I3 node 1  262654   1806.064216 1366.652011 308.0   34630.0
I3 node 2  262654   1577.307862 282.409951  295.0    7972.0
I3 node 3  262654   1562.401793 302.359587  277.0   26741.0

S2 node 0  262654   2142.781445 311.725009  1131.0  21159.0
S2 node 1  262654   2281.500148 498.754992  1188.0  12598.0
S2 node 2  262654   2515.785237 478.341525  1506.0  18904.0
S2 node 3  262654   2438.578377 340.629789  1411.0  41150.0

S3 node 0  262654   3807.389633 1789.181559 1553.0  13501.0
S3 node 1  262654   4986.689344 2074.222547    0.0  13988.0
S3 node 2  262654   3798.487726 984.563960  1535.0   9272.0
S3 node 3  262654   2940.379964 450.009338  1684.0  10261.0
)
|
)
|
)
|
)
|
| Jun 2014 | Mar 2014 | Dec 2013 | Sep 0213 |
|---|
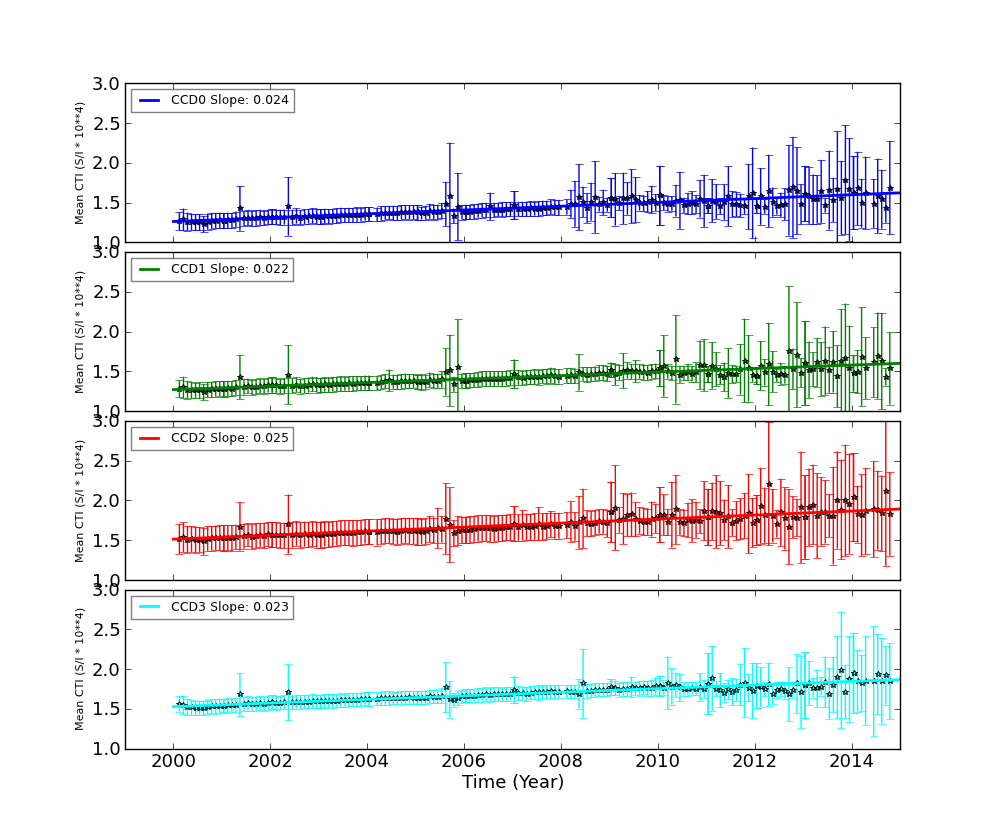
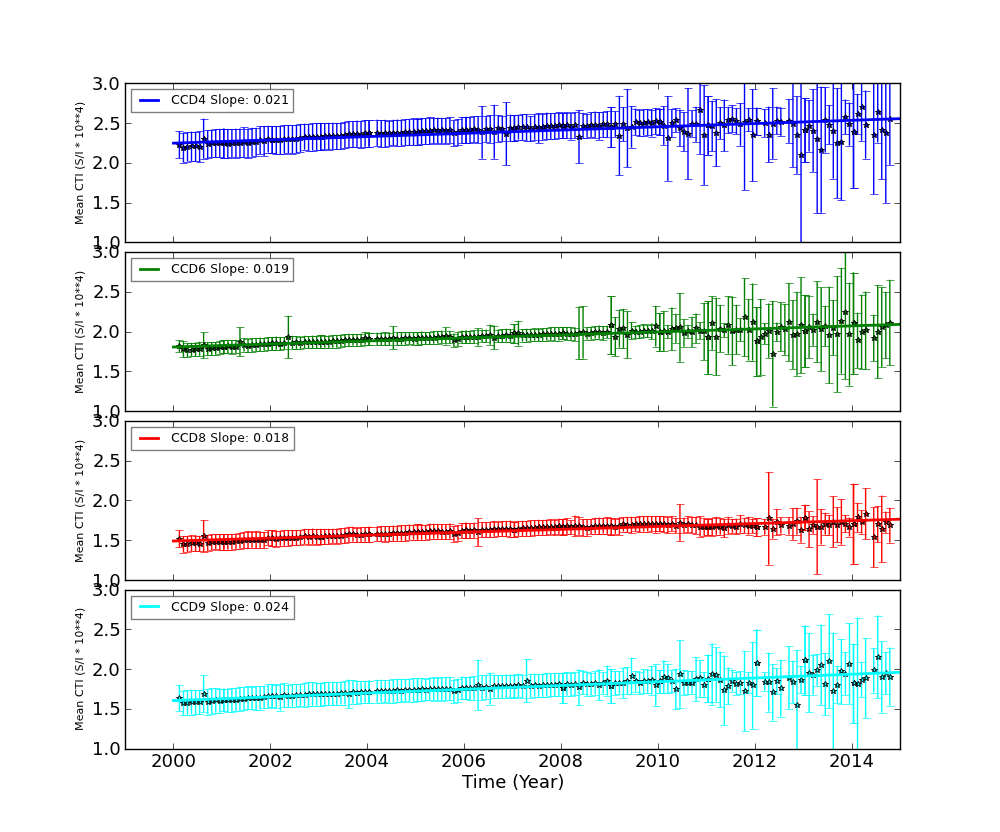
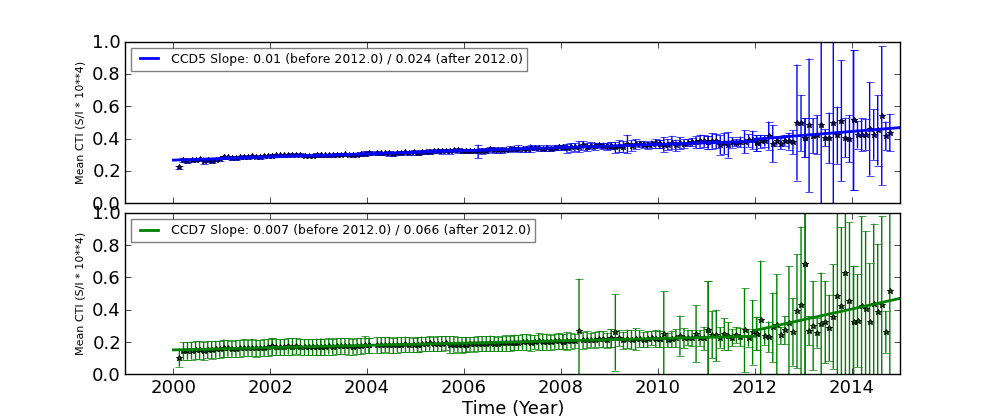
We report CTIs with a refined data definition. CTIs were computed for the temperature dependency corrected data. Please see CTI page for detailed explanation. CTI's are computed for Mn K alpha, and defined as slope/intercept x10^4 of row # vs ADU. Data file: here
| The Mean (max) FPT: | |
|---|---|
| -113.72 | +/- 4.54 C |
| Mean Width: | |
| 0.51 | +/- 0.46 days |
We are using 10 period moving averages to show trends of peak temperatures and peak widths. Note, the gaps in the width plot are due to missing/corrupted data.
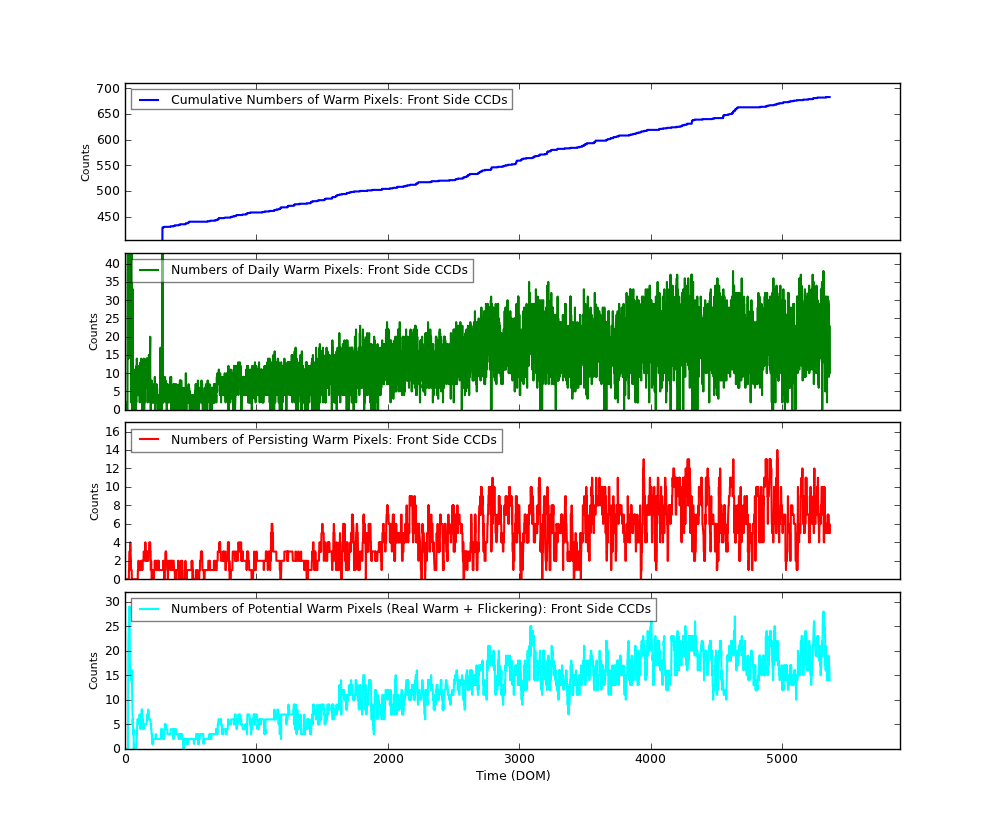
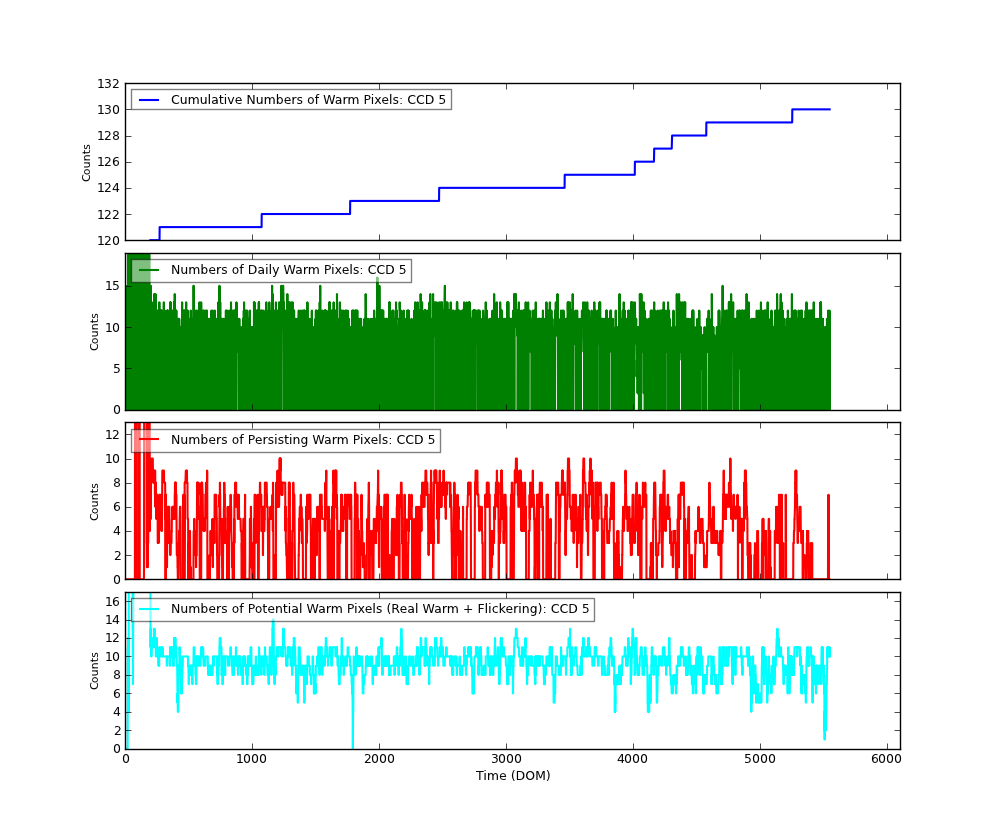
The plots below were generated with a new warm pixel finding script. Please see Acis Bad Pixel Page for details.
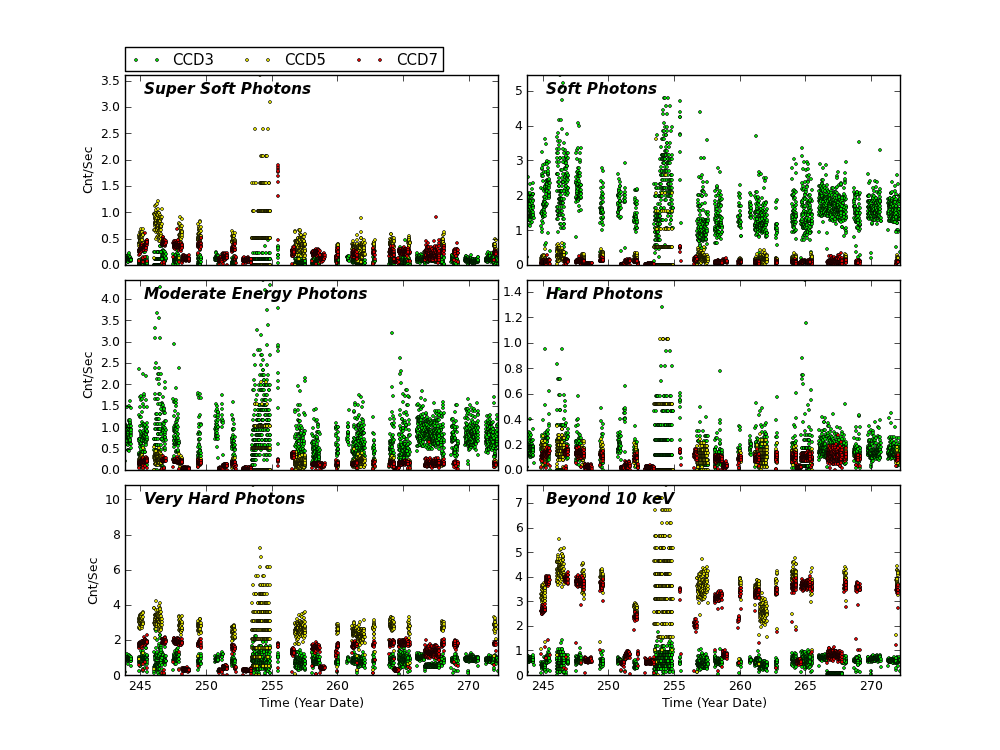
| Name | Low (keV) | High(KeV) | Description |
|---|---|---|---|
| SSoft | 0.00 | 0.50 | Super soft photons |
| Soft | 0.50 | 1.00 | Soft photons |
| Med | 1.00 | 3.00 | Moderate energy photons |
| Hard | 3.00 | 5.00 | Hard Photons |
| Harder | 5.00 | 10.00 | Very Hard photons |
| Hardest | 10.00 | Beyond 10 keV |
We computed ACIS gain and offset from ACIS event1 files used in CTI computation, following the step described by C. Grant ACIS gain @ -120C page.
Instead computing gains and offsets from individual observations, we combined all data from each month and computed an monthly averaged gain and offset.
The following plots show CCD3 and CCD5 gains and offset trends.
| CCD 3 | |
)
|
)
|
| CCD 5 | |
)
|
)
|
Please refer to Maximum Dose Trends for more details.
)
|
|---|
         IMAGE                NPIX      MEAN    STDDEV      MIN       MAX
 HRCI_09_2014.fits          16777216   0.019    0.1443      0.0       10.0
)
        IMAGE                NPIX      MEAN    STDDEV      MIN       MAX
HRCI_08_1999_09_2014.fits  16777216   4.273    4.879       0.0       292.0
)
          IMAGE                NPIX      MEAN    STDDEV      MIN       MAX
HRCS_09_2014.fits          16777216     0.032    0.1914     0.0        12.0
)
        IMAGE                NPIX     MEAN      STDDEV      MIN      MAX
HRCS_08_1999_09_2014.fits  16777216  15.525     27.207      0.0      1681.0
|
|
Max dose trend plots corrected for events that "pile-up"
in the center of the taps due to bad position information.
|
)
|
)
|
)
|
)
|
| Jun 2014 | Mar 2014 | Dec 2013 | Sep 2013 |
|---|
)
|
)
|
)
|
)
|
| Jun 2014 | Mar 2014 | Dec 2013 | Sep 2013 |
|---|
We plot the width of the zero order streak of ACIS/HETG observations and the width of the zero order image for HRC/LETG observations of point sources. No significant defocusing trend is seen at this time. See Gratings Focus pages.
| ACIS Temperatures - Daily Maximums | ||||||
|---|---|---|---|---|---|---|
| MSID | MEAN | RMS | DELTA/YR | DELTA/YR/YR | UNITS | DESCRIPTION |
| 1PDEAAT | 304.89 | 8.83 | -5.124e-01 | 7.989e-01 | K | PSMC DEA PS A TEMP |
| 1PIN1AT | 291.69 | 7.96 | -3.142e-01 | 1.006e+00 | K | PSMC TEMP 1A |
| HRMA Computed Averages - Daily Maximums | ||||||
|---|---|---|---|---|---|---|
| MSID | MEAN | RMS | DELTA/YR | DELTA/YR/YR | UNITS | DESCRIPTION |
| OBAAVG | 287.51 | 2.24 | 9.787e-01 | 2.974e-01 | TEMP | OBA/TFTE |
| EPHIN Temperatures - Daily Maximums | ||||||
|---|---|---|---|---|---|---|
| MSID | MEAN | RMS | DELTA/YR | DELTA/YR/YR | UNITS | DESCRIPTION |
| TEIO | 327.84 | 20.68 | 6.942e+00 | 1.961e+01 | K | EPHIN ELECTRONICS HOUSING TEMP |
| TEPHIN | 333.28 | 6.08 | 4.111e+00 | 1.560e+01 | K | EPHIN SENSOR HOUSING TEMP |
| S/C Main Temperatures - Daily Maximums | ||||||
|---|---|---|---|---|---|---|
| MSID | MEAN | RMS | DELTA/YR | DELTA/YR/YR | UNITS | DESCRIPTION |
| TCYLFMZM | 305.81 | 26.06 | 2.119e+00 | 4.452e+00 | K | CNT CYL TEMP:-Z SIDE UNDER LAE-1 |
| TCYLFMZP | 307.98 | 24.89 | 2.068e+00 | 4.537e+00 | K | CNT CYL TEMP:-Z SIDE UNDER LAE-2 |
| S/C Ancillary Temperatures - Daily Maximums | ||||||
|---|---|---|---|---|---|---|
| MSID | MEAN | RMS | DELTA/YR | DELTA/YR/YR | UNITS | DESCRIPTION |
| TFSSBKT1 | 341.03 | 20.57 | 9.677e-01 | -1.793e+02 | K | FSS BRACKET-1 TEMP (+Y) |
| TFSSBKT2 | 336.08 | 27.49 | 1.020e+01 | -2.839e+02 | K | FSS BRACKET-2 TEMP (+Y) |
| TSCTSF1 | 302.54 | 3.15 | 1.955e+00 | 9.054e-01 | K | SC-TS FITTING -1 TEMP |
| TSCTSF6 | 304.52 | 3.48 | 1.987e+00 | -4.799e+00 | K | SC-TS FITTING -6 TEMP |
| MUPS - Daily Maximums | ||||||
|---|---|---|---|---|---|---|
| MSID | MEAN | RMS | DELTA/YR | DELTA/YR/YR | UNITS | DESCRIPTION |
| PM1THV1T | 333.47 | 8.23 | -2.762e-01 | -1.892e+02 | K | MUPS 1 THRUSTER VALVE 01 TEMP |
| PLINE02T | 317.64 | 11.13 | 3.347e+00 | 5.826e+00 | K | PROP LINE TEMP 02 |
| PLINE03T | 316.64 | 13.64 | 3.278e+00 | 7.846e+00 | K | PROP LINE TEMP 03 |
| PLINE04T | 302.24 | 12.73 | 3.233e+00 | 7.055e+00 | K | PROP LINE TEMP 04 |
| Previous Quarter | ||||||
| MSID | MEAN | RMS | DELTA/YR | DELTA/YR/YR | UNITS | DESCRIPTION |
| 5EIOT | 360.08 | 17.86 | 2.324e+01 | -1.600e+02 | K | EIO TEMP |
| 5EPHINT | 332.44 | 5.95 | 1.868e+01 | -4.691e+02 | K | EPHIN TEMP |
| HKEBOXTEMP | 337.75 | 6.21 | 1.926e+01 | -4.703e+02 | K | EPHIN HOUSEKEEPING EBOX: TEMPERATURE (5EHSE300) |
| HKGHV | 0.000e+00 | 0.000e+00 | 0.000e+00 | 0.000e+00 | HKGHV | |
| HKN6I | 73.02 | 1.610e-02 | 8.760e-03 | 6.429e-02 | AMP | HK 6 Volts Rail - Current |
| HKN6V | -5.97 | 1.139e-02 | 1.785e-02 | -3.394e-01 | V | HK -6 Volts Rail - Voltage |
| HKP27I | 7.04 | 9.169e-02 | -3.244e-01 | 5.790e+00 | AMP | HK 27 Volts Rail - Current |
| HKP27V | 26.85 | 5.943e-02 | 1.196e-01 | -6.237e+00 | V | HK 27 Volts Rail - Voltage |
| HKP5I | 49.98 | 2.74 | -5.958e+00 | -3.160e+02 | AMP | HK 5 Volts Rail - Current |
| HKP5V | 5.08 | 1.116e-02 | 1.114e-02 | 1.061e+00 | V | HK 5 Volts Rail - Voltage |
| HKP6I | 137.23 | 0.71 | 2.270e+00 | -5.568e+01 | AMP | HK 6 Volts Rail - Current |
| HKP6V | 5.77 | 1.336e-02 | -4.058e-02 | 8.163e-01 | V | HK 6 Volts Rail - Voltage |
| TEIO | 334.30 | 19.08 | 2.456e+01 | -2.752e+02 | K | EPHIN ELECTRONICS HOUSING TEMP |
| TEPHIN | 333.05 | 6.33 | 1.920e+01 | -4.529e+02 | K | EPHIN SENSOR HOUSING TEMP |
| Previous Quarter | ||||||
| MSID | MEAN | RMS | DELTA/YR | DELTA/YR/YR | UNITS | DESCRIPTION |
| HSTRTGRD1 | -4.52 | 0.28 | -1.305e+00 | 4.523e+01 | K | RT25-RT26: HRMA STRUTS |
| HSTRTGRD2 | -3.61 | 0.19 | -8.020e-01 | 1.771e+01 | K | RT26-RT27: HRMA STRUTS |
| HSTRTGRD3 | -0.17 | 0.11 | 8.519e-02 | -1.968e+01 | K | RT27-RT28: HRMA STRUTS |
| HSTRTGRD4 | 2.90 | 0.14 | 7.096e-01 | -1.708e+01 | K | RT28-RT29: HRMA STRUTS |
| HSTRTGRD5 | 4.62 | 0.24 | 1.292e+00 | -2.826e+01 | K | RT29-RT30: HRMA STRUTS |
| HSTRTGRD6 | 0.78 | 3.354e-02 | 4.203e-02 | 1.627e+00 | K | RT30-RT25: HRMA STRUTS |
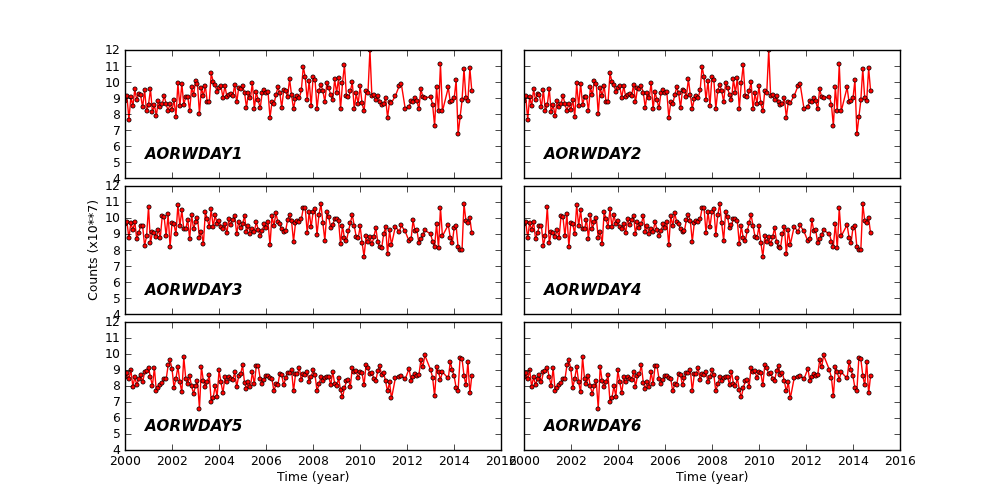
Reaction Wheel Rotations
| Year | Month | |||||||||||
|---|---|---|---|---|---|---|---|---|---|---|---|---|
| 1999 | Jul | Aug | Sep | Oct | Nov | Dec | ||||||
| 2000 | Jan | Feb | Mar | Apr | May | Jun | Jul | Aug | Sep | Oct | Nov | Dec |
| 2001 | Jan | Feb | Mar | Apr | May | Jun | Jul | Aug | Sep | Oct | Nov | Dec |
| 2002 | Jan | Feb | Mar | Apr | May | Jun | Jul | Aug | Sep | Oct | Nov | Dec |
| 2003 | Jan | Feb | Mar | Apr | May | Jun | Jul | Aug | Sep | Oct | Nov | Dec |
| 2004 | Jan | Feb | Mar | Apr | May | Jun | Jul | Aug | Sep | Oct | Nov | Dec |
| 2005 | Jan | Feb | Mar | Apr | May | Jun | Jul | Aug | Sep | Oct | Nov | Dec |
| 2006 | Jan | Feb | Mar | Apr | May | Jun | Jul | Aug | Sep | Oct | Nov | Dec |
| 2007 | Jan | Feb | Mar | Apr | May | Jun | Jul | Aug | Sep | Oct | Nov | Dec |
| 2008 | Jan | Feb | Mar | Apr | May | Jun | Jul | Aug | Sep | Oct | Nov | Dec |
| 2009 | Jan | Feb | Mar | Apr | May | Jun | Jul | Aug | Sep | Oct | Nov | Dec |
| 2010 | Jan | Feb | Mar | Apr | May | Jun | Jul | Aug | Sep | Oct | Nov | Dec |
| 2011 | Jan | Feb | Mar | Apr | May | Jun | Jul | Aug | Sep | Oct | Nov | Dec |
| 2012 | Jan | Feb | Mar | Apr | May | Jun | Jul | Aug | Sep | Oct | Nov | Dec |
| 2013 | Jan | Feb | Mar | Apr | May | Jun | Jul | Aug | Sep | Oct | Nov | Dec |
| 2014 | Jan | Feb | Mar | Apr | May | Jun | Jul | Aug | ||||
)
)
)
)
)
)
)
)
)
)
)
)
)
)
)
)
)
)
)
)
)
)
)
)
)
)
)
)
)
)
)
)
)
)
)
)
)
)