Oct Dose Map
)
TOTAL
)
CCD I3
)
CCD S3
The steps we took to compute the dose map are;
Please check more detail plots at Telemetered Photon Dose Trend page.
Statistics:
# IMAGE     NPIX        MEAN           RMS              MIN     MAX
ACIS_oct14 6004901      6.693          10.016           0.0     557


I2 node 0  262654   8.898032    3.700317    0.0  46.0
I2 node 1  262654   9.329183    4.165988    0.0 293.0
I2 node 2  262654   9.134173    3.700288    0.0  70.0
I2 node 3  262654   9.293379    4.018083    0.0  53.0

I3 node 0  262654   10.829439   4.491948    0.0  59.0
I3 node 1  262654   11.165358   9.716783    0.0 273.0
I3 node 2  262654   10.139778   3.897460    0.0 100.0
I3 node 3  262654   10.296191   4.022512    0.0 121.0

S2 node 0  262654   6.604707    2.877600    0.0  41.0
S2 node 1  262654   6.709722    3.308199    0.0  48.0
S2 node 2  262654   6.914840    3.322692    0.0  67.0
S2 node 3  262654   6.741954    3.072921    0.0 319.0

S3 node 0  262654   7.878784    4.511057    0.0 145.0
S3 node 1  262654   8.868137    4.000930    0.0 138.0
S3 node 2  262654   8.573740    3.290309    0.0  48.0
S3 node 3  262654   7.964274    3.362659    0.0  37.0
Statistics:
 IMAGE        NPIX      MEAN             RMS            MIN    MAX
ACIS_total   6004901   1835.179         2410.272        0.0   106452


I2 node 0  262654   1536.995666 293.852798   286.0   9044.0
I2 node 1  262654   1620.710457 405.773858   320.0  36785.0
I2 node 2  262654   1651.149255 345.470093   323.0   9173.0
I2 node 3  262654   1648.909476 415.106957   304.0  27978.0

I3 node 0  262654   1730.586649 412.132778   302.0   6793.0
I3 node 1  262654   1817.229574 1375.656523  309.0  34856.0
I3 node 2  262654   1587.447640 284.414550   296.0   8052.0
I3 node 3  262654   1572.697984 304.482634   277.0  26862.0

S2 node 0  262654   2149.386152 312.673278  1132.0  21169.0
S2 node 1  262654   2288.209870 500.472419  1192.0  12631.0
S2 node 2  262654   2522.700077 479.747905  1511.0  18971.0
S2 node 3  262654   2445.320330 341.400219  1416.0  41323.0

S3 node 0  262654   3815.268417 1790.188273 1556.0  13517.0
S3 node 1  262654   4995.557481 2075.032330    0.0  13996.0
S3 node 2  262654   3807.061466 985.077086  1548.0   9282.0
S3 node 3  262654   2948.344238 450.866864  1685.0  10280.0
)
|
)
|
)
|
)
|
| Jul 2014 | Apr 2014 | Jan 2014 | Oct 0213 |
|---|
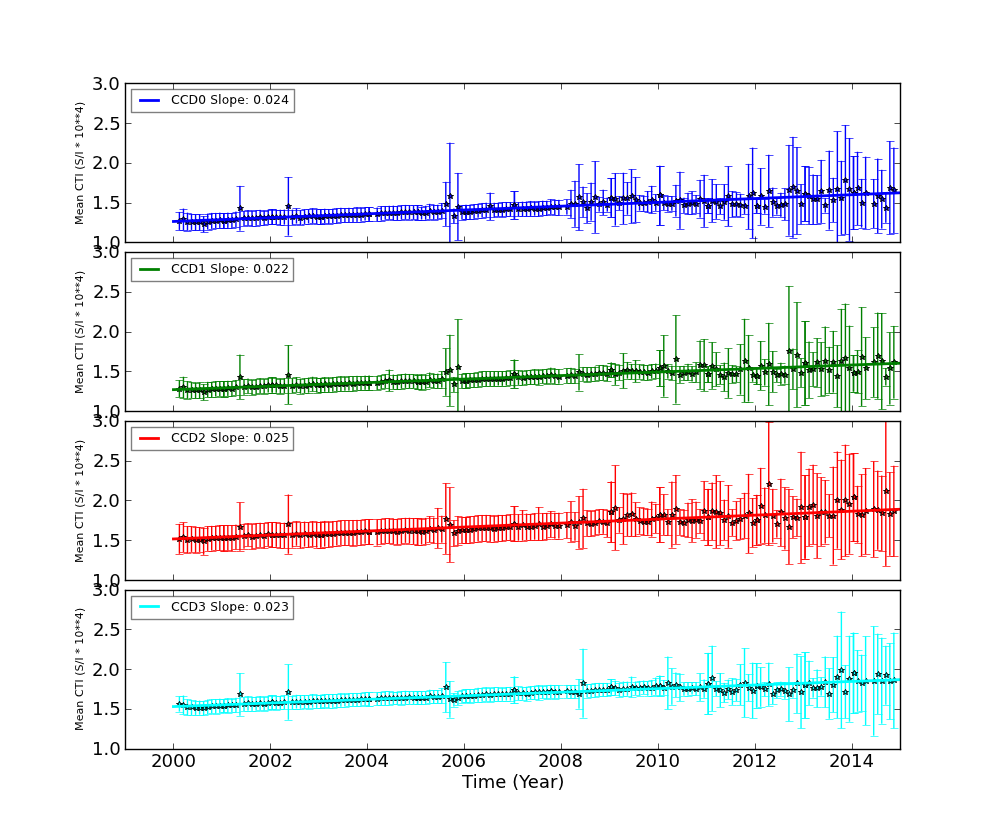
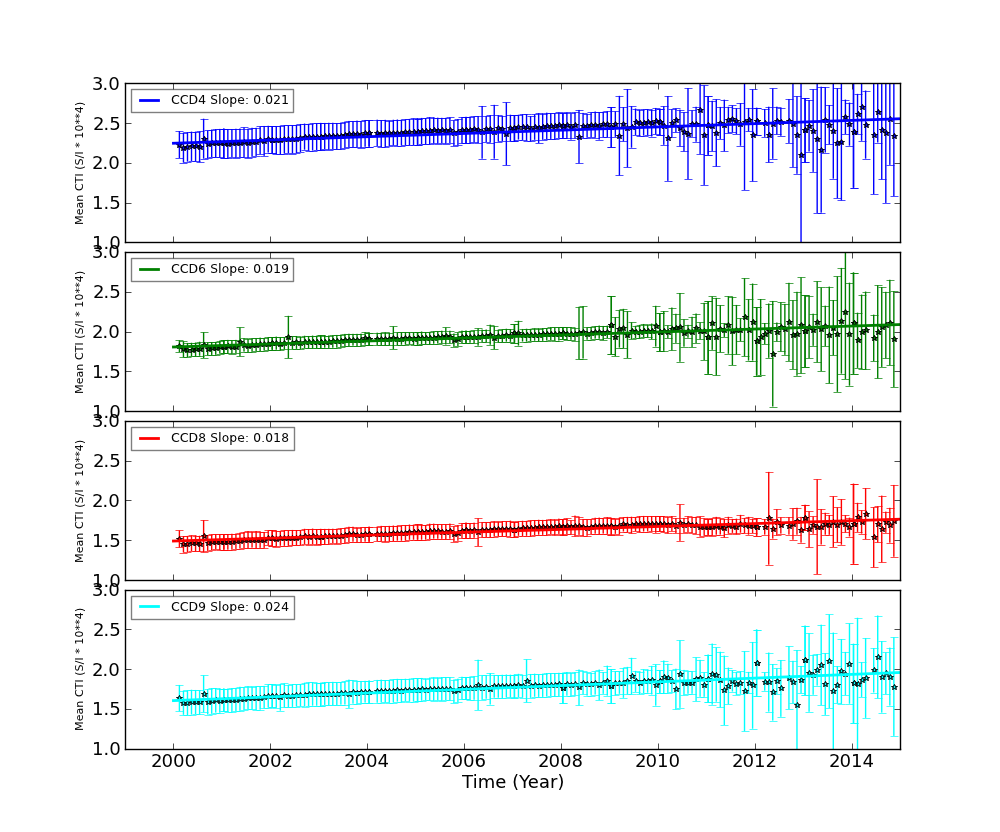
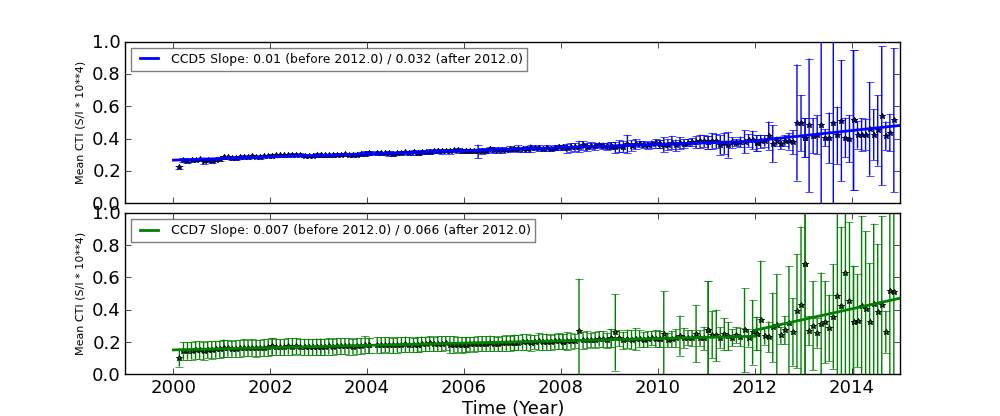
We report CTIs with a refined data definition. CTIs were computed for the temperature dependency corrected data. Please see CTI page for detailed explanation. CTI's are computed for Mn K alpha, and defined as slope/intercept x10^4 of row # vs ADU. Data file: here
| The Mean (max) FPT: | |
|---|---|
| -109.18 | +/- 6.60 C |
| Mean Width: | |
| 1.28 | +/- 0.94 days |
We are using 10 period moving averages to show trends of peak temperatures and peak widths. Note, the gaps in the width plot are due to missing/corrupted data.

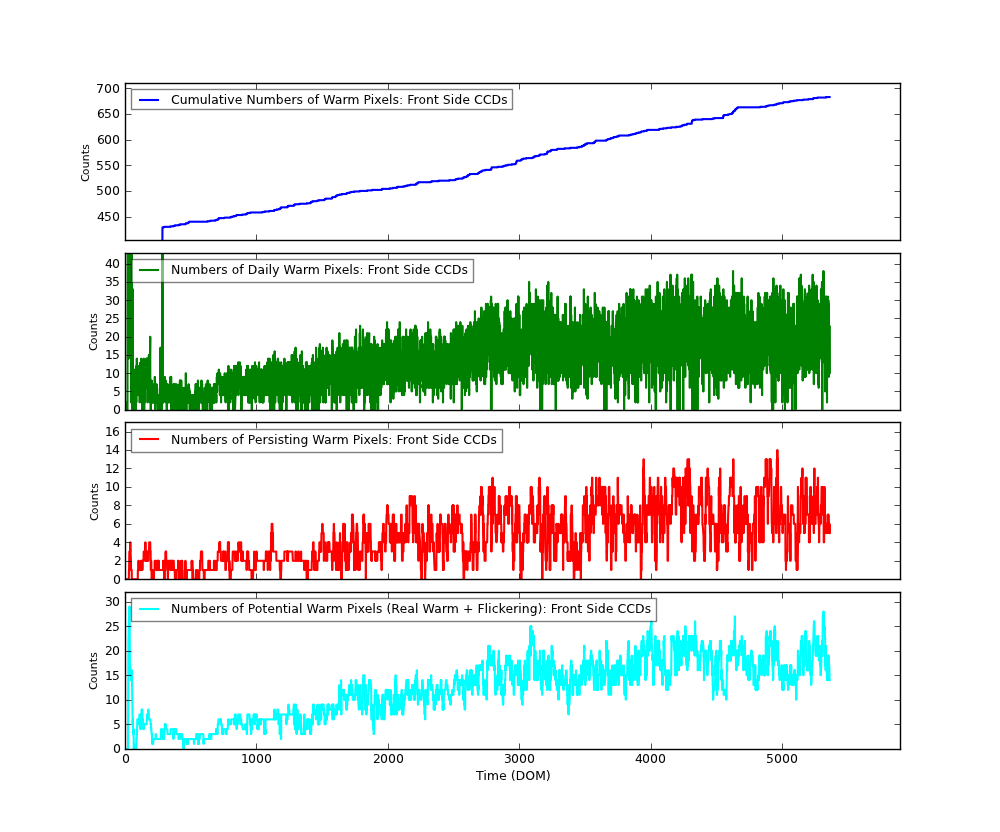
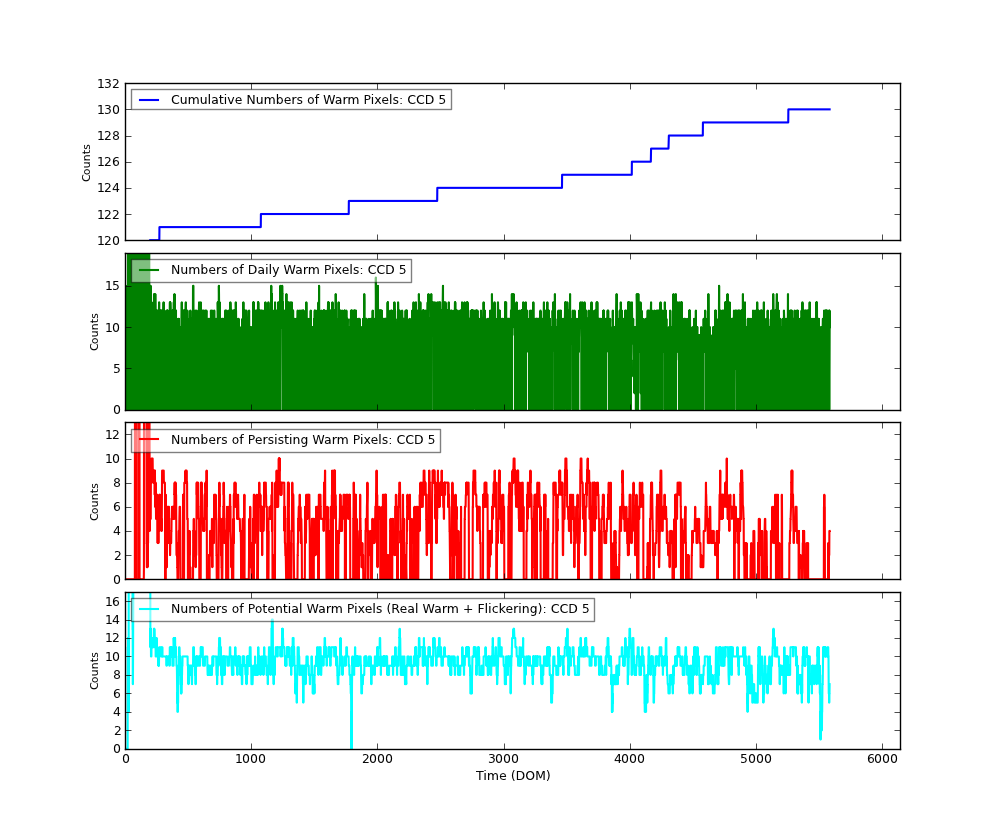
The plots below were generated with a new warm pixel finding script. Please see Acis Bad Pixel Page for details.
| Name | Low (keV) | High(KeV) | Description |
|---|---|---|---|
| SSoft | 0.00 | 0.50 | Super soft photons |
| Soft | 0.50 | 1.00 | Soft photons |
| Med | 1.00 | 3.00 | Moderate energy photons |
| Hard | 3.00 | 5.00 | Hard Photons |
| Harder | 5.00 | 10.00 | Very Hard photons |
| Hardest | 10.00 | Beyond 10 keV |
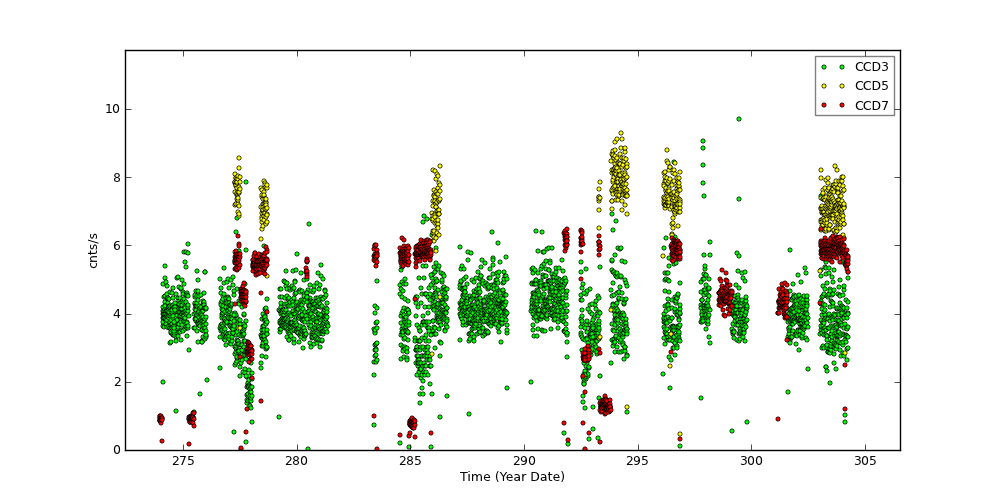
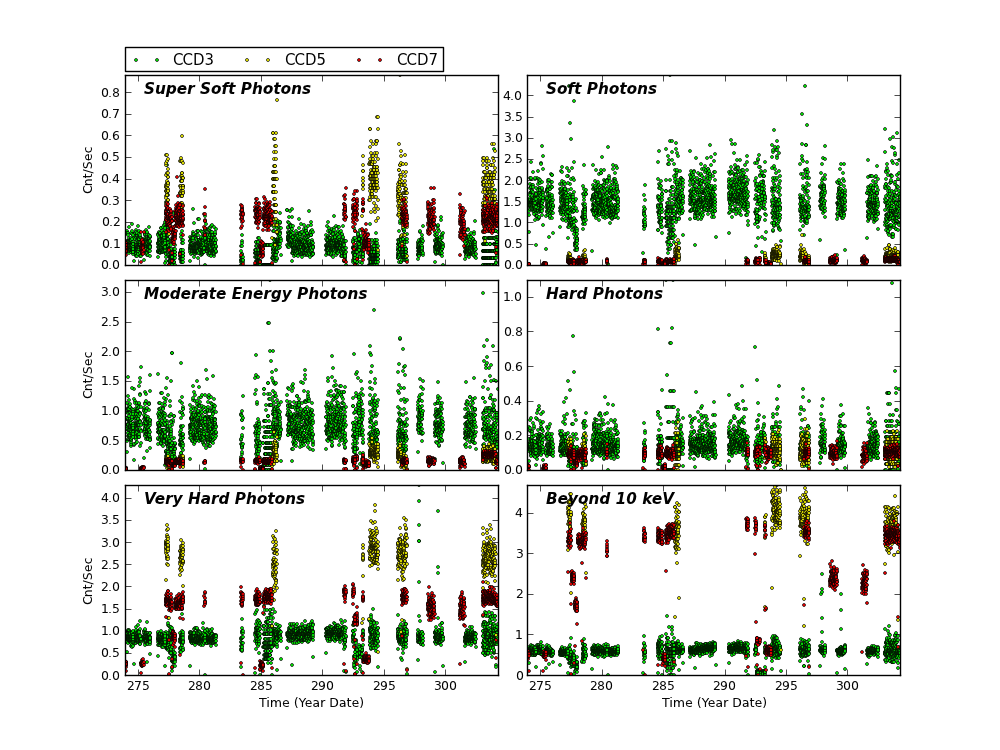
Please refer to Maximum Dose Trends for more details.
No Data
)
        IMAGE                NPIX      MEAN    STDDEV      MIN       MAX
HRCI_08_1999_10_2014.fits  16777216   4.273    4.879       0.0       292.0
No Data
)
        IMAGE                NPIX     MEAN      STDDEV      MIN      MAX
HRCS_08_1999_10_2014.fits  16777216  15.525     27.207      0.0      1681.0
|
|
Max dose trend plots corrected for events that "pile-up"
in the center of the taps due to bad position information.
|
)
|
)
|
)
|
)
|
| Jul 2014 | Apr 2014 | Jan 2014 | Oct 2013 |
|---|
)
|
)
|
)
|
)
|
| Jul 2014 | Apr 2014 | Jan 2014 | Oct 2013 |
|---|
We plot the width of the zero order streak of ACIS/HETG observations and the width of the zero order image for HRC/LETG observations of point sources. No significant defocusing trend is seen at this time. See Gratings Focus pages.
We plot E/dE vs. E for fits to detected lines with fwhm_error/fwhm less than 0.15 for the plus and minus arms of HEG, MEG, and LEG. Also shown are conservative (dotted line) and optimistic (dashed line) pre-launch resolving power expectations.
We have selected only calibration observations of Capella, HR1099, and Sigma Gem. See MIT technotes for a parallel analysis.
| Plot symbol indicates dispersion arm: | Color indicates observation date: |
Minus side = cross (x) |
2002-2004 blue 2005-2006 yellow 2007-2009 orange |
SIM Shift and Twist Trend The following plots show trends of SIM shifts (dy and dz) and twist (dtheta). All quantities are directly taken from pcaf*_asol1.fits files. The units are mm for dy and dz, and degree for dtheta. We fit three lines separated before and after (Days of Mission)= 1400 (May 21, 2003), 2700 (Dec 11, 2006), and 4400 (Aug 07, 2011). The unit of slopes are mm per day or degree per day.
The sudden shift around DOM = 1400, 2700 and 4400 are due to fid light drift (see a memo by Aldcroft fiducial light drift). On the dtheta plot, two tracks are clearly observed. The track around 0.01 is due to HRC-I, and all others are clustered around -0.002. For more detail, please see SIM Shift and Twist Trend page
| Previous Quarter | ||||||
| MSID | MEAN | RMS | DELTA/YR | DELTA/YR/YR | UNITS | DESCRIPTION |
| AFSSPC2V | 3.52 | 1.198e-03 | 1.718e-03 | 4.723e-03 | V | FSS POWER CONV 2 VOLTAGE |
| AGWS2V | 2.70 | 3.038e-04 | -5.858e-05 | -7.747e-03 | V | GYRO WHEEL SUPPLY 2 INPUT VOLTAGE |
| AIRU1G1I | 8.72 | 0.48 | 1.110e+00 | -2.625e+01 | MAMP | IRU-1 GYRO #1 CURRENT |
| AIRU2G1I | 107.28 | 0.60 | -8.115e-01 | 9.279e+01 | MAMP | IRU-2 GYRO #1 CURRENT |
| AIRU2G2I | 111.26 | 0.76 | -1.843e-01 | -6.256e+00 | MAMP | IRU-2 GYRO #2 CURRENT |
| Previous Quarter | ||||||
| MSID | MEAN | RMS | DELTA/YR | DELTA/YR/YR | UNITS | DESCRIPTION |
| PFTANKIP | 1.967e+03 | 17.41 | 5.507e+01 | 6.457e+02 | PSIA | FUEL TANK INLET PRESSURE |
| PFTANKOP | 1.941e+03 | 18.57 | 5.702e+01 | 9.516e+02 | PSIA | FUEL TANK OUTLET PRESSURE |
| PHETANKP | 629.62 | 0.000e+00 | 0.000e+00 | 0.000e+00 | PSIA | HE TANK PRESSURE |
| PXTANKIP | 1.900e+03 | 4.63 | 2.716e-01 | -7.676e+01 | PSIA | OX TANK INLET PRESSURE |
| PXTANKOP | 1.914e+03 | 4.16 | -6.335e-01 | -1.533e+02 | PSIA | OX TANK OUTLET PRESSURE |
| PLINE01T | 289.49 | 2.69 | 5.190e+00 | 2.799e+01 | K | PROP LINE TEMP 01 |
| PLINE02T | 320.68 | 9.61 | -1.517e+00 | 5.416e+02 | K | PROP LINE TEMP 02 |
| PLINE03T | 318.18 | 11.95 | 4.329e-01 | 6.675e+02 | K | PROP LINE TEMP 03 |
| PLINE04T | 304.38 | 11.62 | 8.152e+00 | 6.499e+02 | K | PROP LINE TEMP 04 |
| PLINE05T | 303.47 | 8.51 | 4.390e+00 | 5.482e+02 | K | PROP LINE TEMP 05 |
| PLINE06T | 294.27 | 7.95 | 7.236e+00 | 4.859e+02 | K | PROP LINE TEMP 06 |

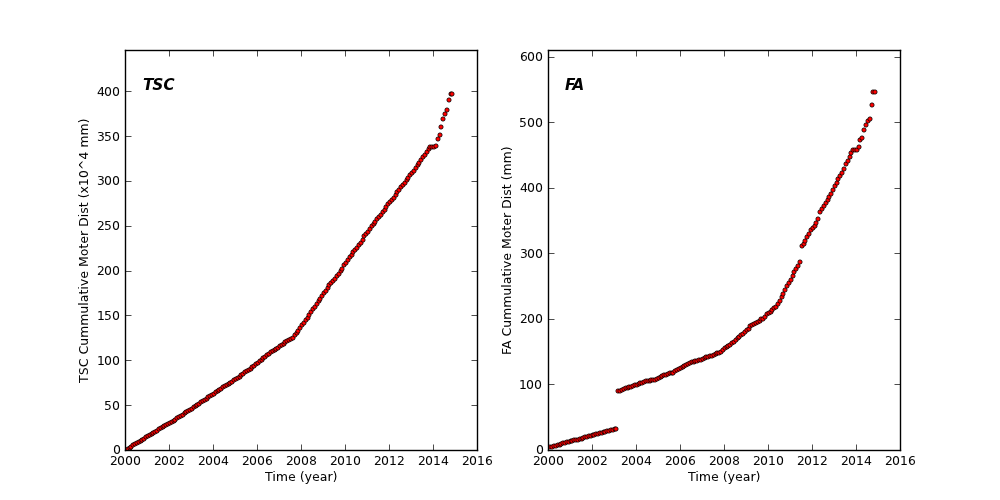
TSC and FA Cummulative Moter Distance
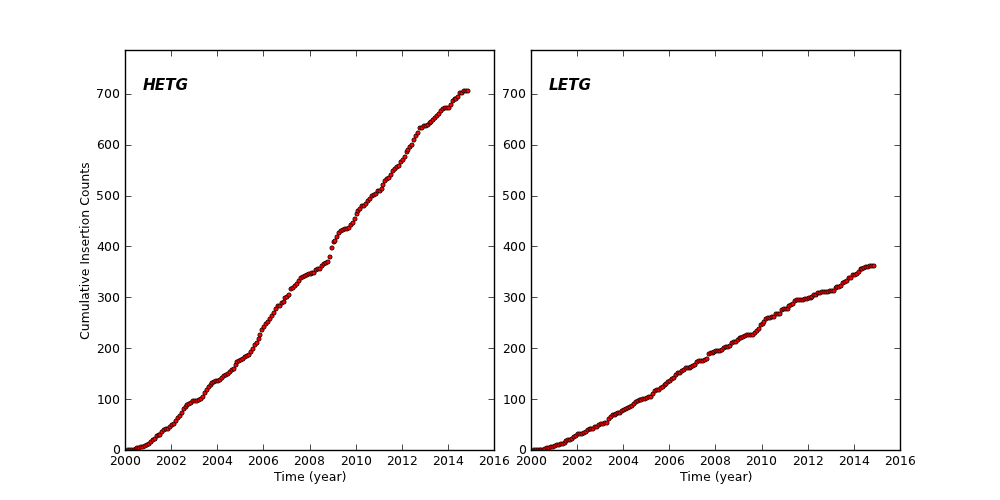
HETG and LETG Cummulative Insertion Counts
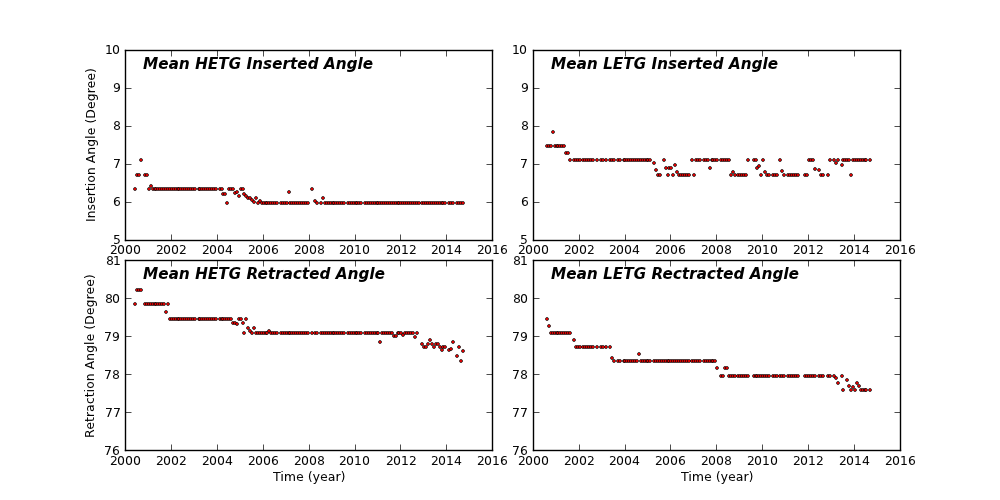
HETG/LETG Insertion/Retraction Angle
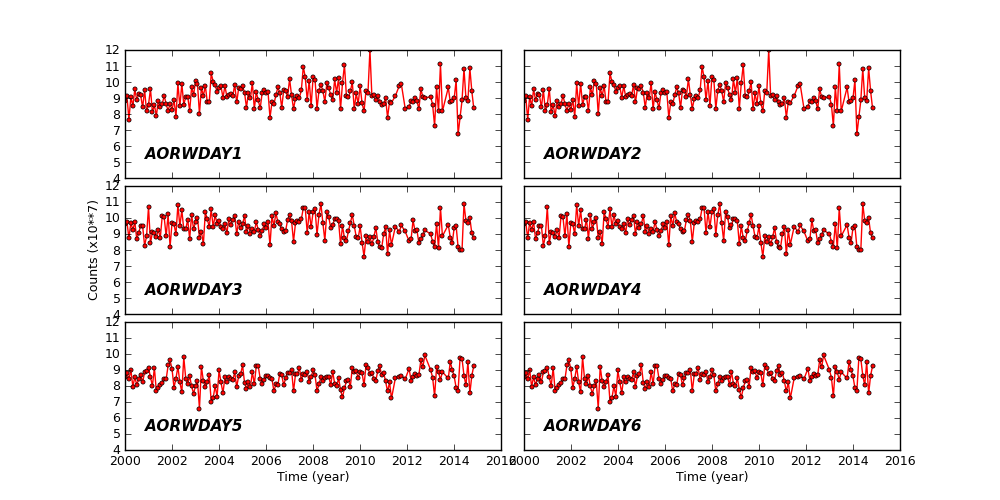
Reaction Wheel Rotations
| Year | Month | |||||||||||
|---|---|---|---|---|---|---|---|---|---|---|---|---|
| 1999 | Jul | Aug | Sep | Oct | Nov | Dec | ||||||
| 2000 | Jan | Feb | Mar | Apr | May | Jun | Jul | Aug | Sep | Oct | Nov | Dec |
| 2001 | Jan | Feb | Mar | Apr | May | Jun | Jul | Aug | Sep | Oct | Nov | Dec |
| 2002 | Jan | Feb | Mar | Apr | May | Jun | Jul | Aug | Sep | Oct | Nov | Dec |
| 2003 | Jan | Feb | Mar | Apr | May | Jun | Jul | Aug | Sep | Oct | Nov | Dec |
| 2004 | Jan | Feb | Mar | Apr | May | Jun | Jul | Aug | Sep | Oct | Nov | Dec |
| 2005 | Jan | Feb | Mar | Apr | May | Jun | Jul | Aug | Sep | Oct | Nov | Dec |
| 2006 | Jan | Feb | Mar | Apr | May | Jun | Jul | Aug | Sep | Oct | Nov | Dec |
| 2007 | Jan | Feb | Mar | Apr | May | Jun | Jul | Aug | Sep | Oct | Nov | Dec |
| 2008 | Jan | Feb | Mar | Apr | May | Jun | Jul | Aug | Sep | Oct | Nov | Dec |
| 2009 | Jan | Feb | Mar | Apr | May | Jun | Jul | Aug | Sep | Oct | Nov | Dec |
| 2010 | Jan | Feb | Mar | Apr | May | Jun | Jul | Aug | Sep | Oct | Nov | Dec |
| 2011 | Jan | Feb | Mar | Apr | May | Jun | Jul | Aug | Sep | Oct | Nov | Dec |
| 2012 | Jan | Feb | Mar | Apr | May | Jun | Jul | Aug | Sep | Oct | Nov | Dec |
| 2013 | Jan | Feb | Mar | Apr | May | Jun | Jul | Aug | Sep | Oct | Nov | Dec |
| 2014 | Jan | Feb | Mar | Apr | May | Jun | Jul | Aug | Sep | |||
)
)
)
)
)
)
)
)
)
)
)
)
)
)
)
)
)
)
)