ACIS
ACIS DOSE Registered-Photon-Map
The steps we took to compute the dose map are;
- Level 1 Event files for a specified month are obtained from archive.
- Image data including I2, I3, S2, S3 CCDs are extracted from all event files.
- All the extracted image data were merged to create a month long exposure map for the month.
- The exposure map is opened with ds9, and check a distribution of count rates against energy. From this, estimate the upper threshold value. Any events beyond this upper threshold are assumed erroneous events such as bad pixels.
- Using this upper threshold, the data is filtered, and create a cleaned exposure map for the month.
- The exposure map from each month from the Sep 1999 is added up to create a cumulative exposure map for each month.
- Using fimgstatistic, we compute count rate statistics for each CCDs.
- For observations with high data drop rates (e.g., Crab nebula, Cas A), we corrected the observations by adding events.
Please check more detail plots at Telemetered Photon Dose Trend page.
)
)
)
Statistics:
# IMAGE     NPIX        MEAN           RMS              MIN     MAX
ACIS_nov14 6004901      7.334          13.651           0.0     4936


I2 node 0  262654   7.838173    3.422585    0.0   40.0
I2 node 1  262654   8.157084    7.286667    0.0 3162.0
I2 node 2  262654   7.917984    3.386410    0.0   69.0
I2 node 3  262654   7.987921    12.731027   0.0 3168.0

I3 node 0  262654   9.787671    4.178950    0.0  271.0
I3 node 1  262654   10.018648   13.375961   0.0 4936.0
I3 node 2  262654   9.154207    3.687668    0.0   74.0
I3 node 3  262654   9.352709    10.617905   0.0 4742.0

S2 node 0  262654   7.398974    6.309869    0.0 2001.0
S2 node 1  262654   7.458695    3.442224    0.0   50.0
S2 node 2  262654   7.563308    3.412700    0.0  286.0
S2 node 3  262654   7.495942    3.215145    0.0  367.0

S3 node 0  262654   21.173820   36.496277   0.0  296.0
S3 node 1  262654   13.226906   14.962594   0.0  234.0
S3 node 2  262654   9.936895    3.390196    0.0   42.0
S3 node 3  262654   9.037095    3.208054    0.0   30.0
)
)
)
Statistics:
 IMAGE        NPIX      MEAN             RMS            MIN    MAX
ACIS_total   6004901   1842.513         2419.260        0.0   106804


I2 node 0  262654   1544.833839 295.524969   286.0   9057.0
I2 node 1  262654   1628.867541 408.111980   321.0  37164.0
I2 node 2  262654   1659.067239 347.039197   324.0   9179.0
I2 node 3  262654   1656.897396 417.333505   305.0  27992.0

I3 node 0  262654   1740.374321 414.357064   305.0   6837.0
I3 node 1  262654   1827.248223 1383.88558 1 310.0  35044.0
I3 node 2  262654   1596.601847 286.276987   296.0   8116.0
I3 node 3  262654   1582.050693 306.637684   277.0  26968.0

S2 node 0  262654   2156.785126 313.887298  1134.0  21184.0
S2 node 1  262654   2295.668565 502.178271  1197.0  12679.0
S2 node 2  262654   2530.263385 480.859291  1516.0  19072.0
S2 node 3  262654   2452.816272 341.752070  1418.0  41558.0

S3 node 0  262654   3836.442237 1792.503110 1562.0  13526.0
S3 node 1  262654   5008.784388 2076.813679    0.0  14008.0
S3 node 2  262654   3816.998361 985.538953  1558.0   9302.0
S3 node 3  262654   2957.381334 450.997970  1689.0  10300.0
)
|
)
|
)
|
)
|
| Aug 2014 | May 2014 | Feb 2014 | Nov 0213 |
|---|
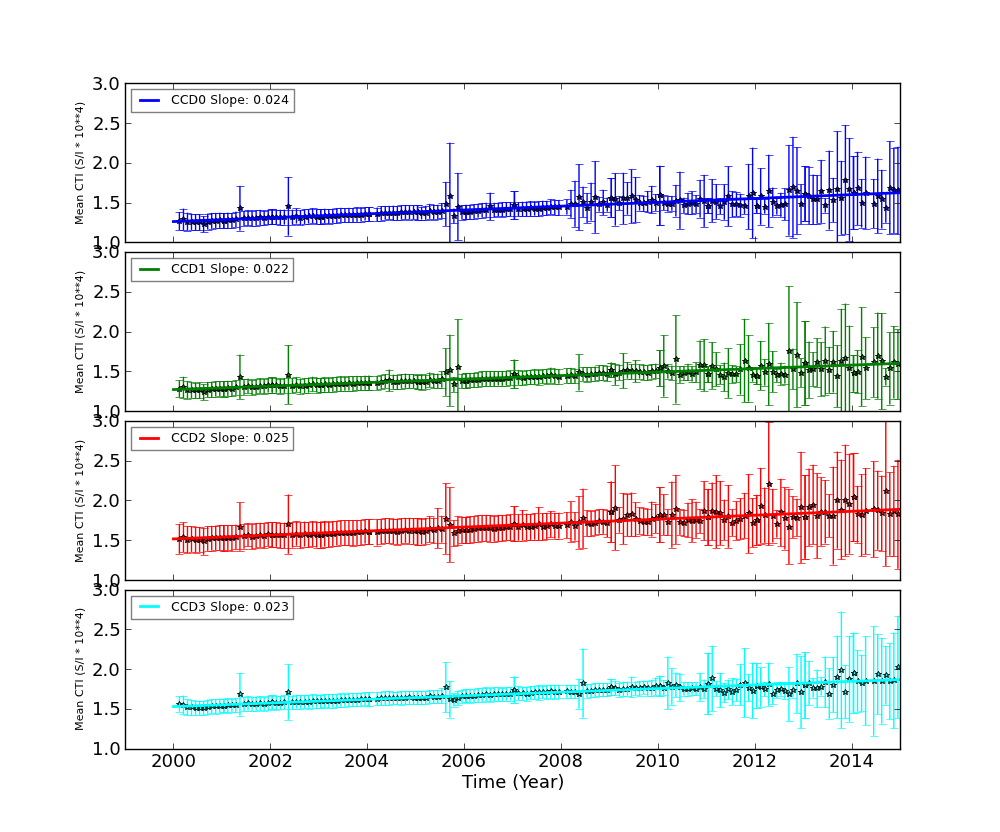
The Mean Detrended CTI
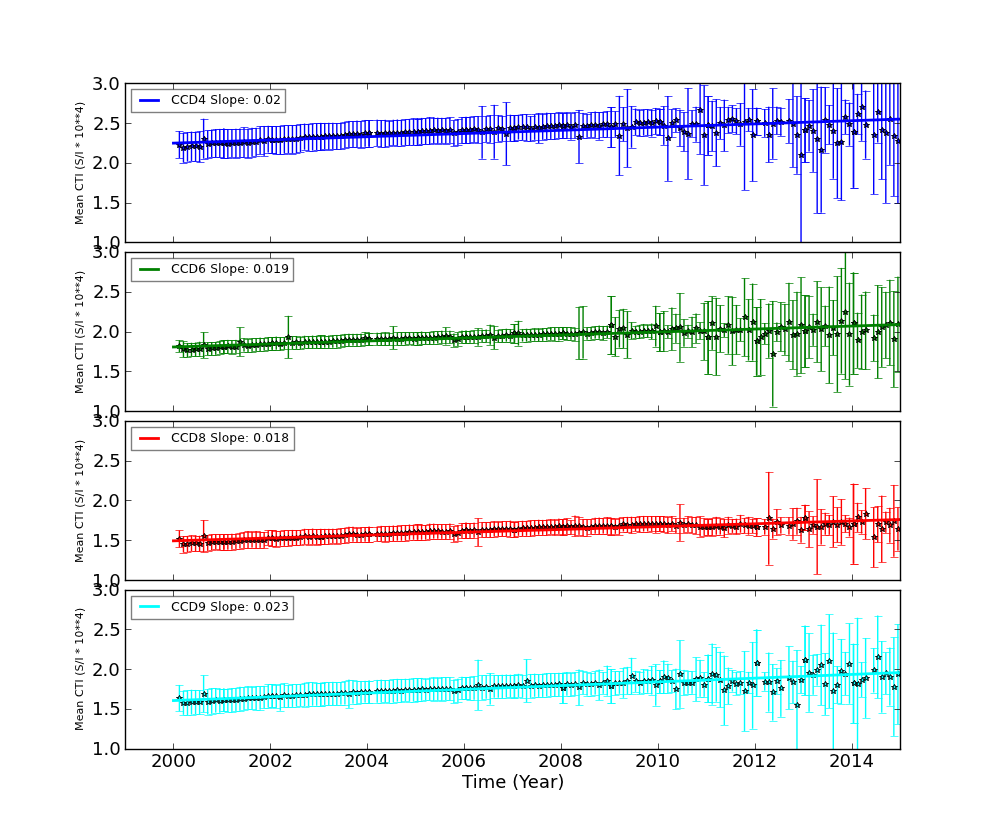
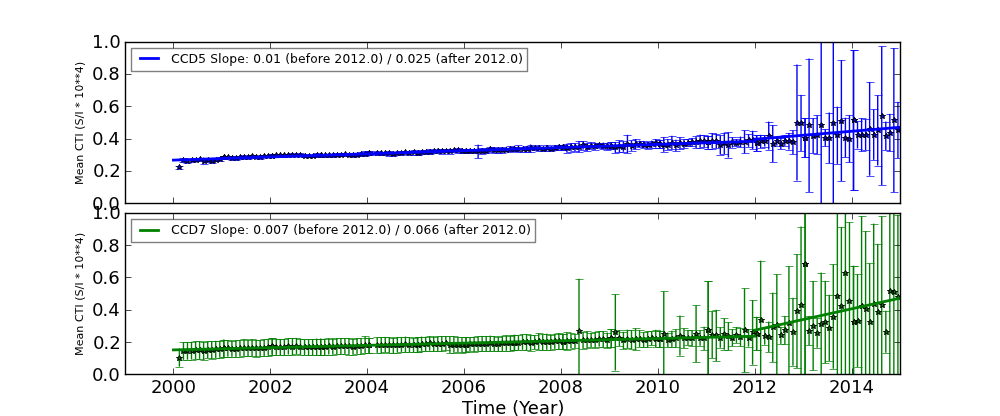
We report CTIs with a refined data definition. CTIs were computed for the temperature dependency corrected data. Please see CTI page for detailed explanation. CTI's are computed for Mn K alpha, and defined as slope/intercept x10^4 of row # vs ADU. Data file: here
Imaging CCDs
Spectral CCDs
Backside CCDs
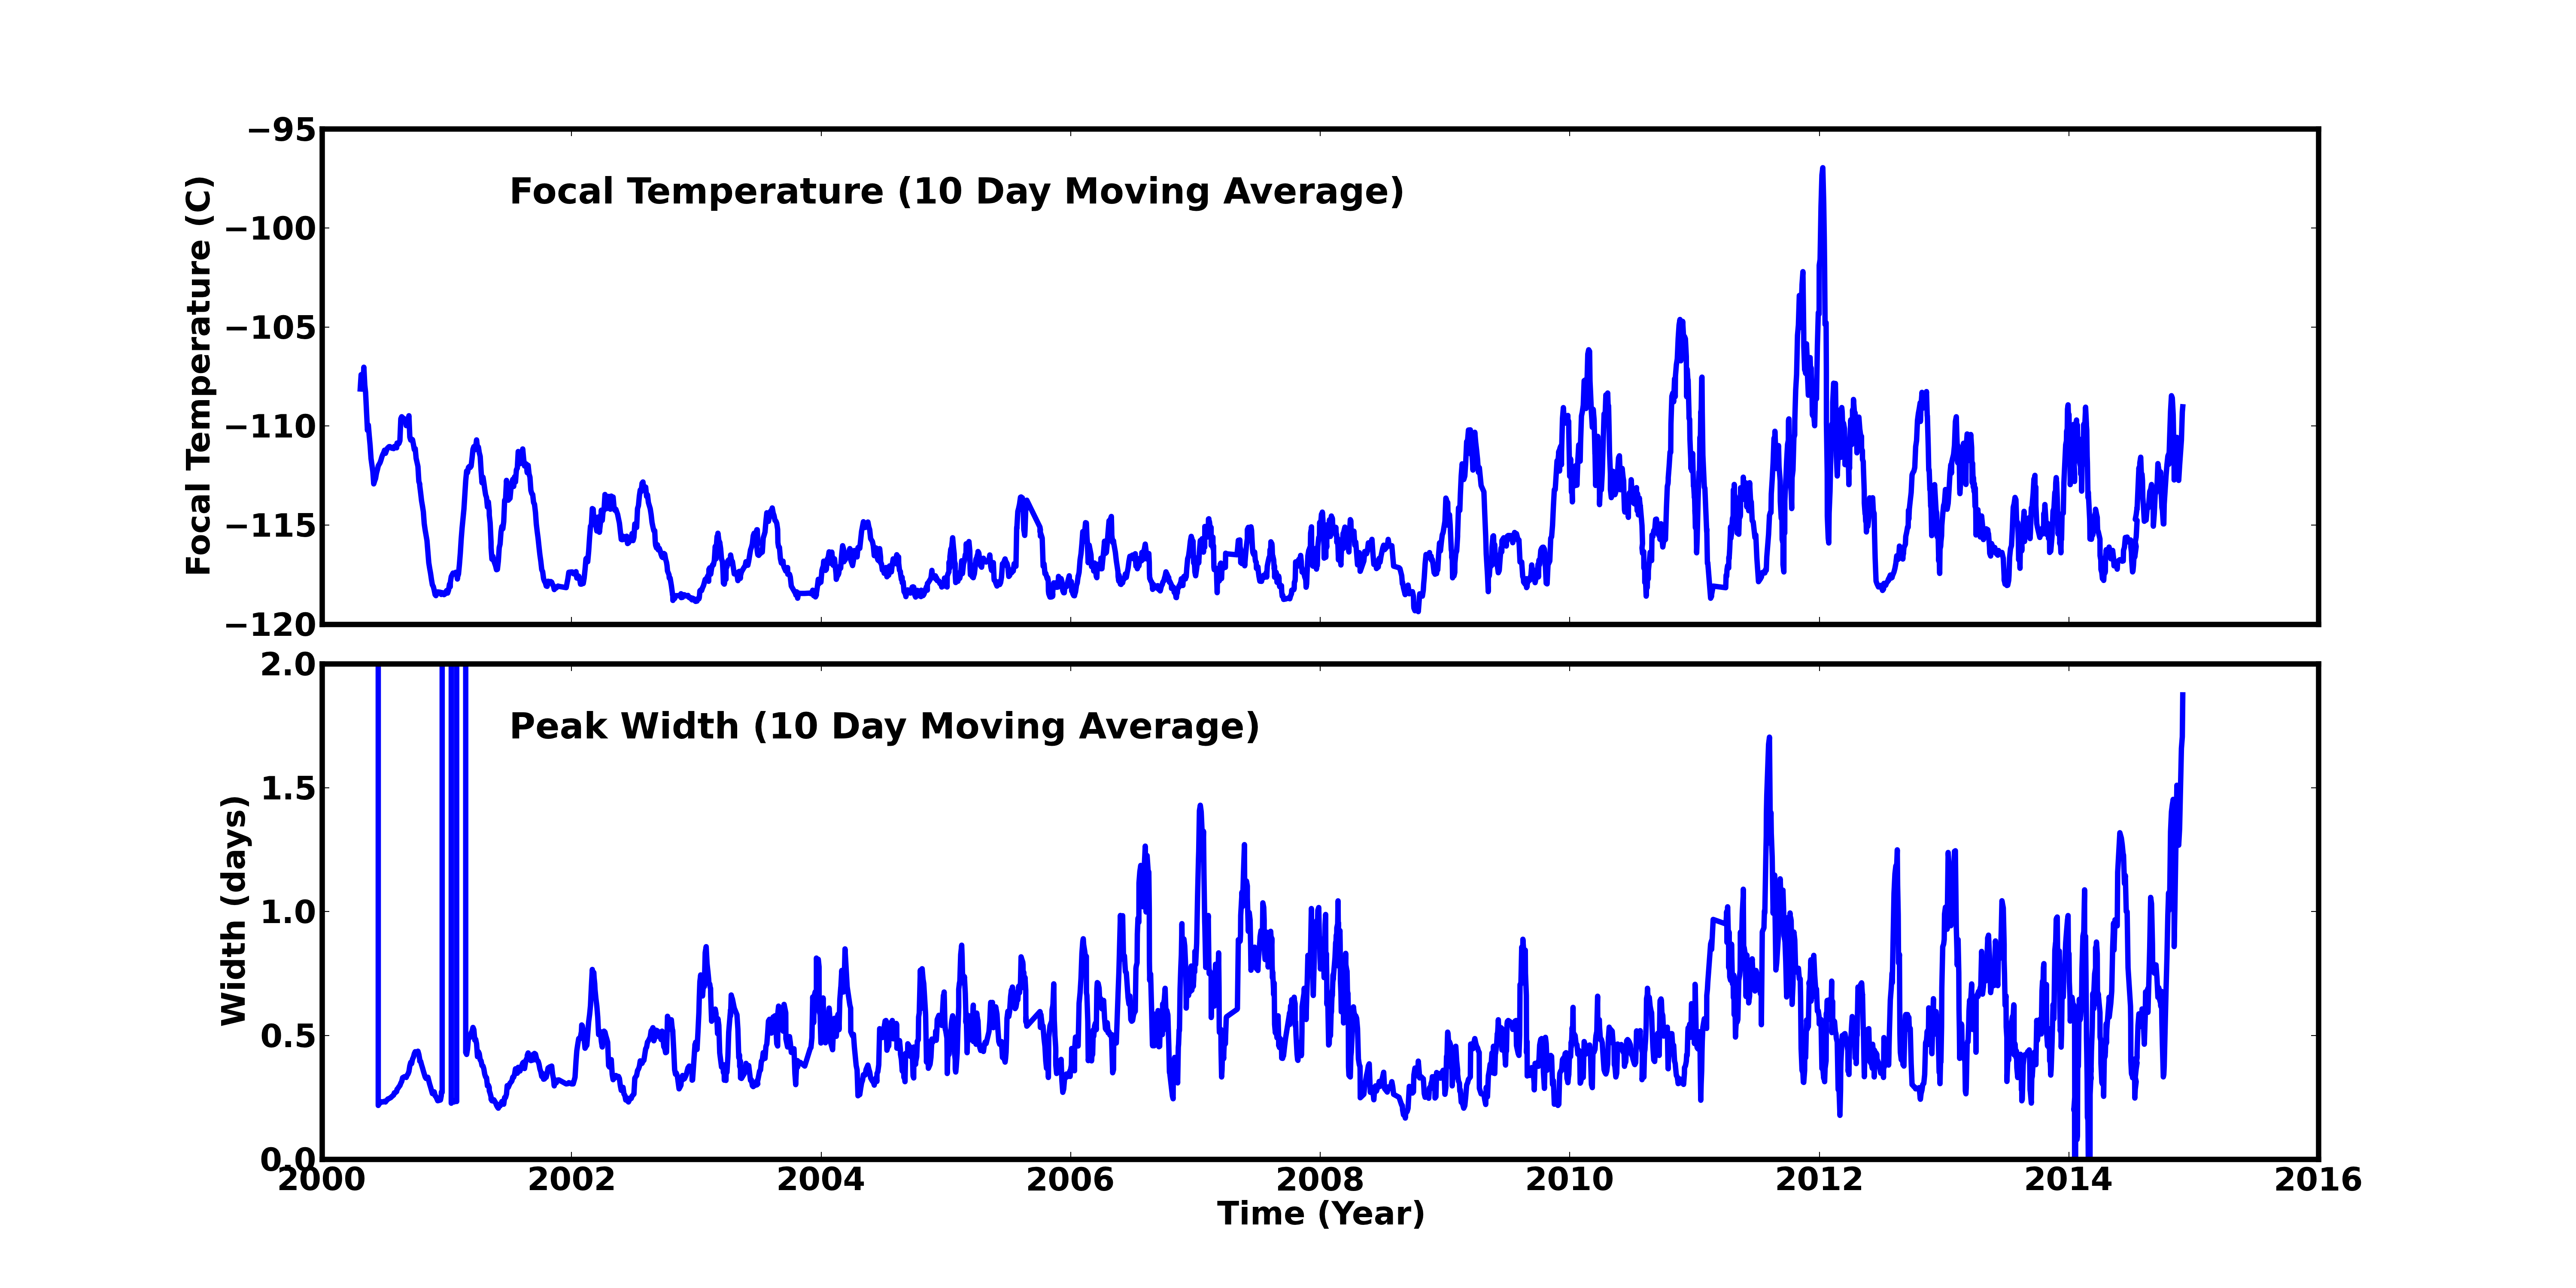
Focal Plane Temperature
Nov 2014 Focal Temperature
| The Mean (max) FPT: | |
|---|---|
| -111.09 | +/- 6.25 C |
| Mean Width: | |
| 1.55 | +/- 1.49 days |
Averaged Focal Plane Temperature
We are using 10 period moving averages to show trends of peak temperatures and peak widths. Note, the gaps in the width plot are due to missing/corrupted data.
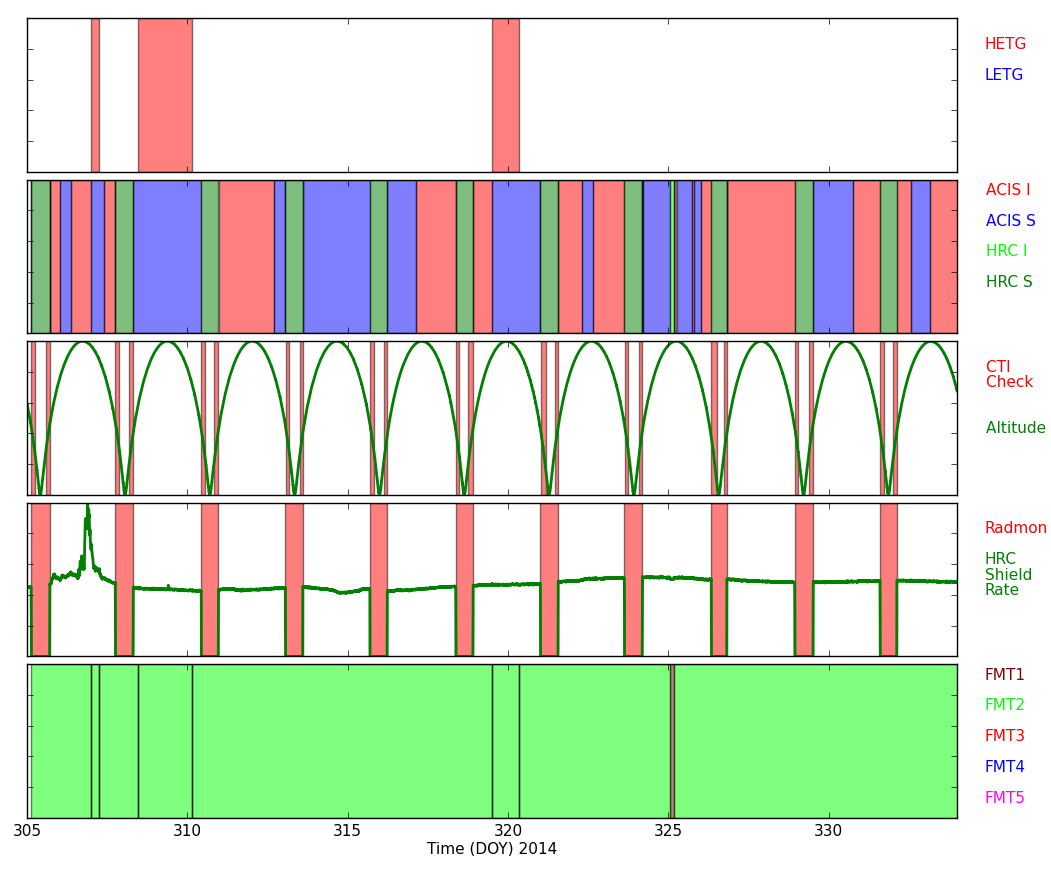
Focal Plane Temperature, Sun Angle and Altitude
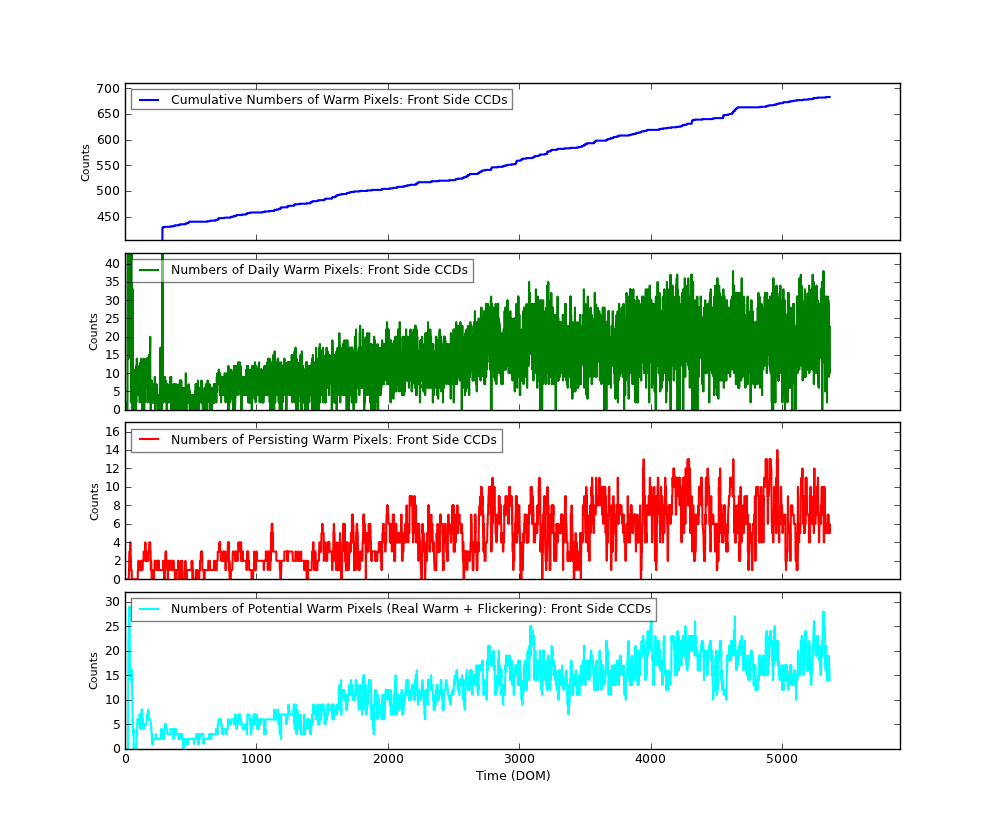
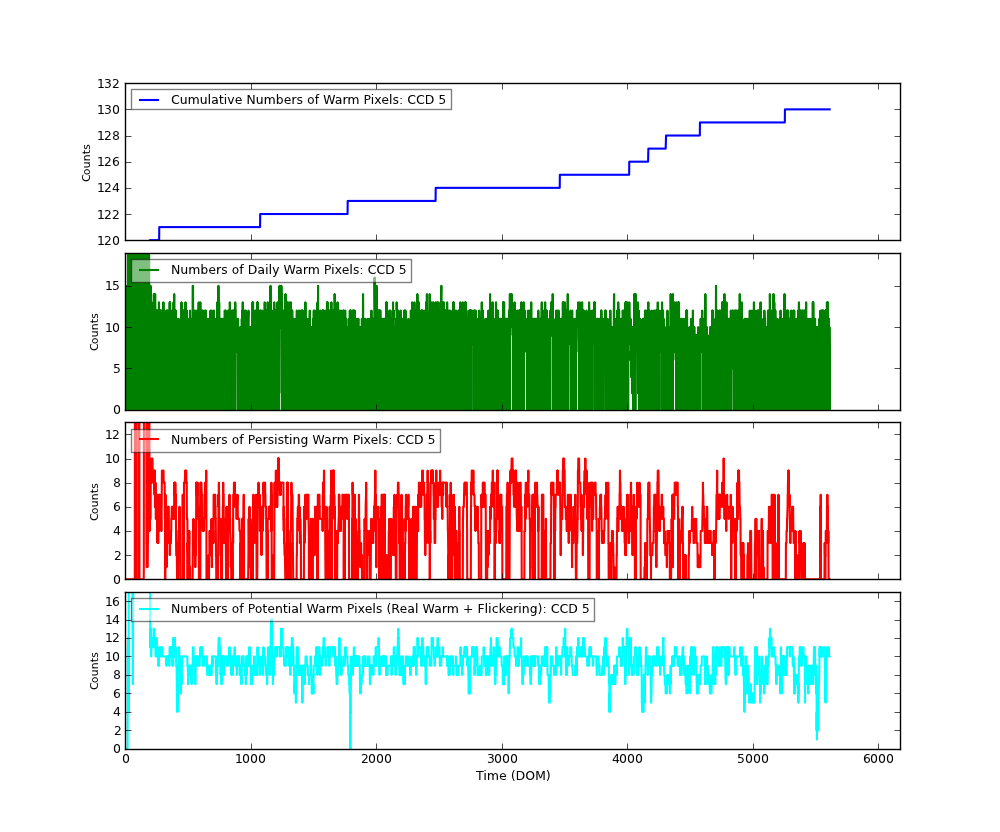
Bad Pixels
The plots below were generated with a new warm pixel finding script. Please see Acis Bad Pixel Page for details.
Front Side CCDs
Back Side CCD (CCD5)
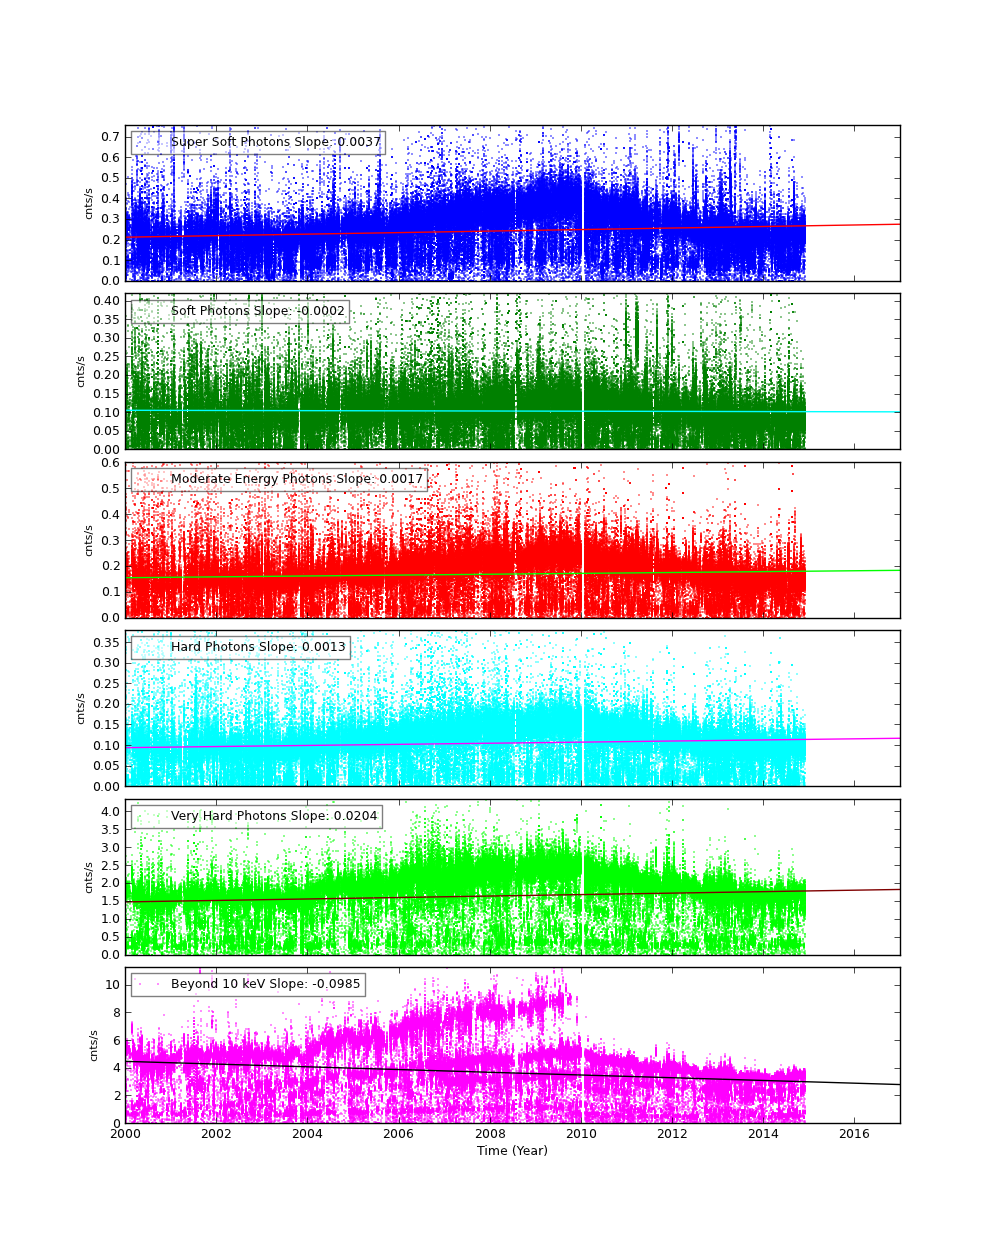
Science Instrument Background Rates
| Name | Low (keV) | High(KeV) | Description |
|---|---|---|---|
| SSoft | 0.00 | 0.50 | Super soft photons |
| Soft | 0.50 | 1.00 | Soft photons |
| Med | 1.00 | 3.00 | Moderate energy photons |
| Hard | 3.00 | 5.00 | Hard Photons |
| Harder | 5.00 | 10.00 | Very Hard photons |
| Hardest | 10.00 | Beyond 10 keV |
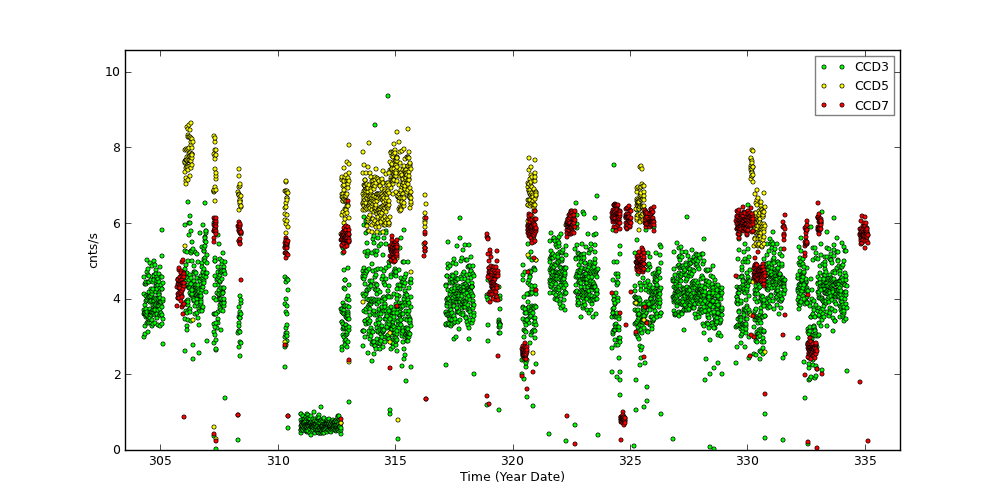
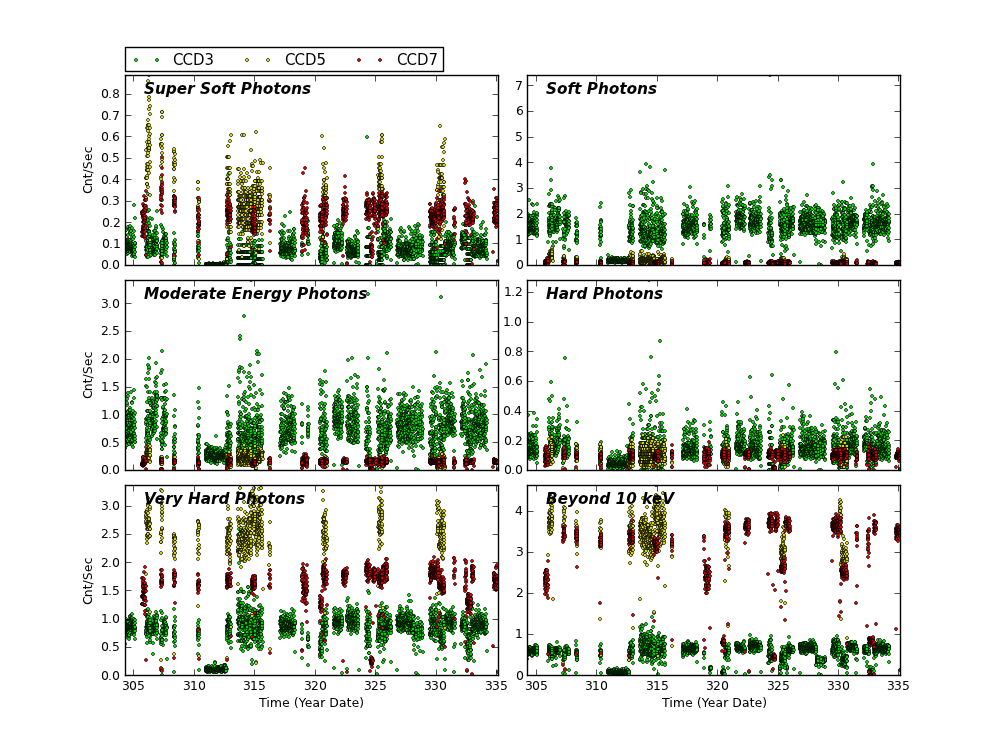
The following three plots show trends of SIB from year 2000. CCDs shown here are CCD3, CCD5, and CCD7. Fitted lines are linear fit after eliminating extreme outliers. For >10 keV plots, 2 lines are fit. One is with a 13 keV filter, and another without.
CCD 3
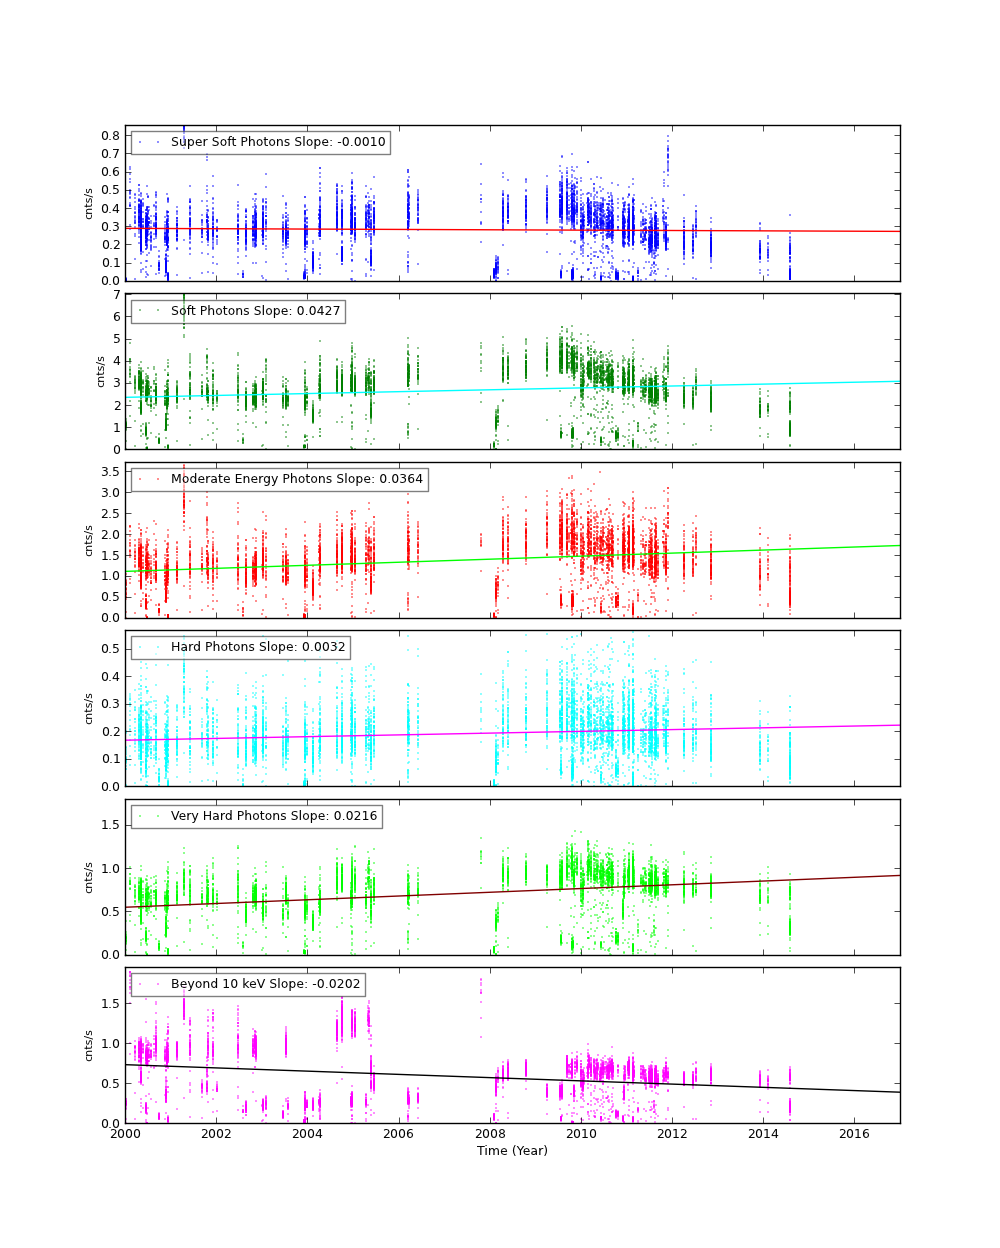
CCD 5
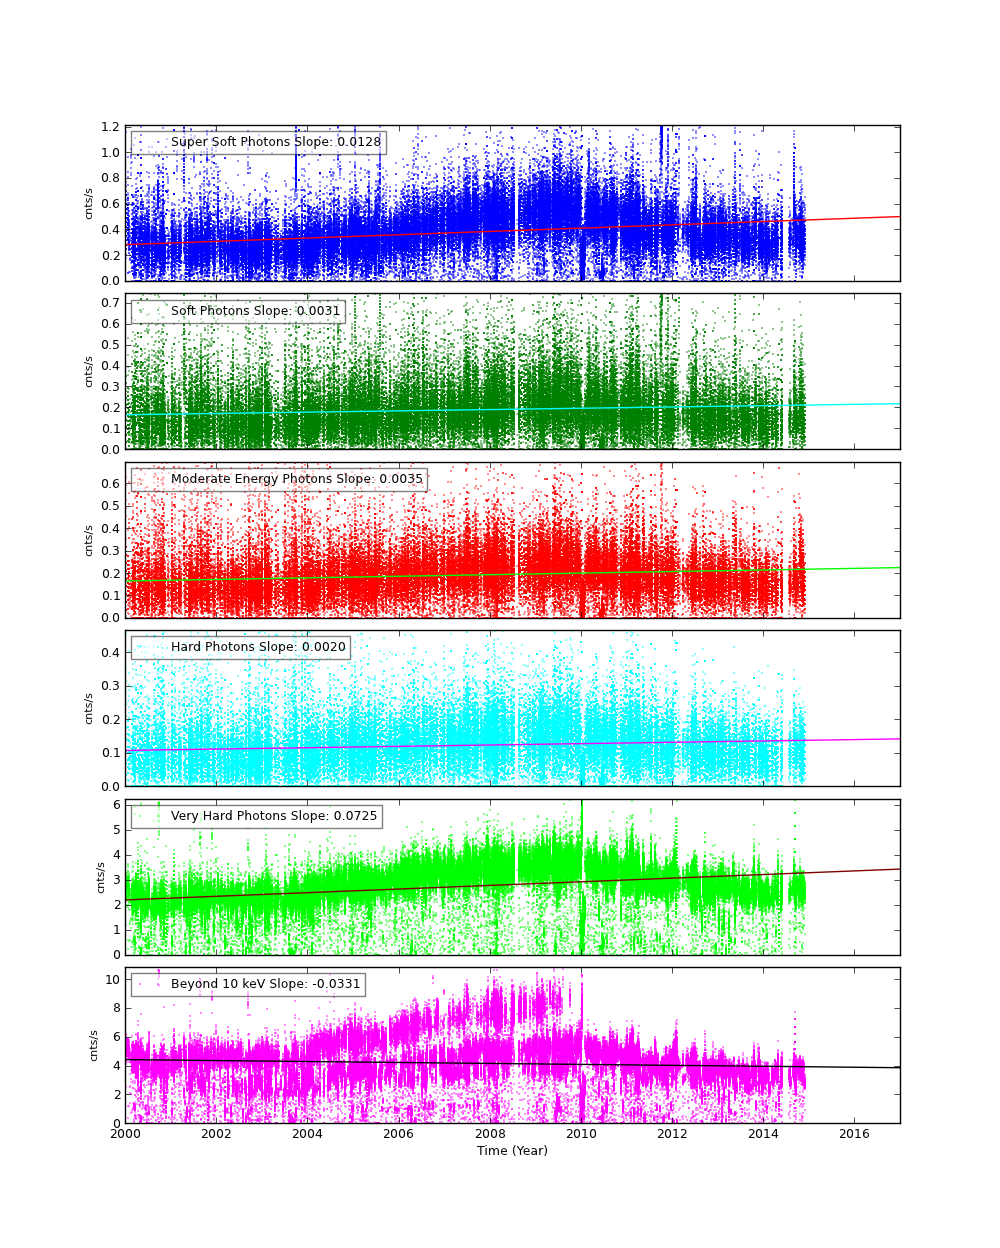
CCD 7
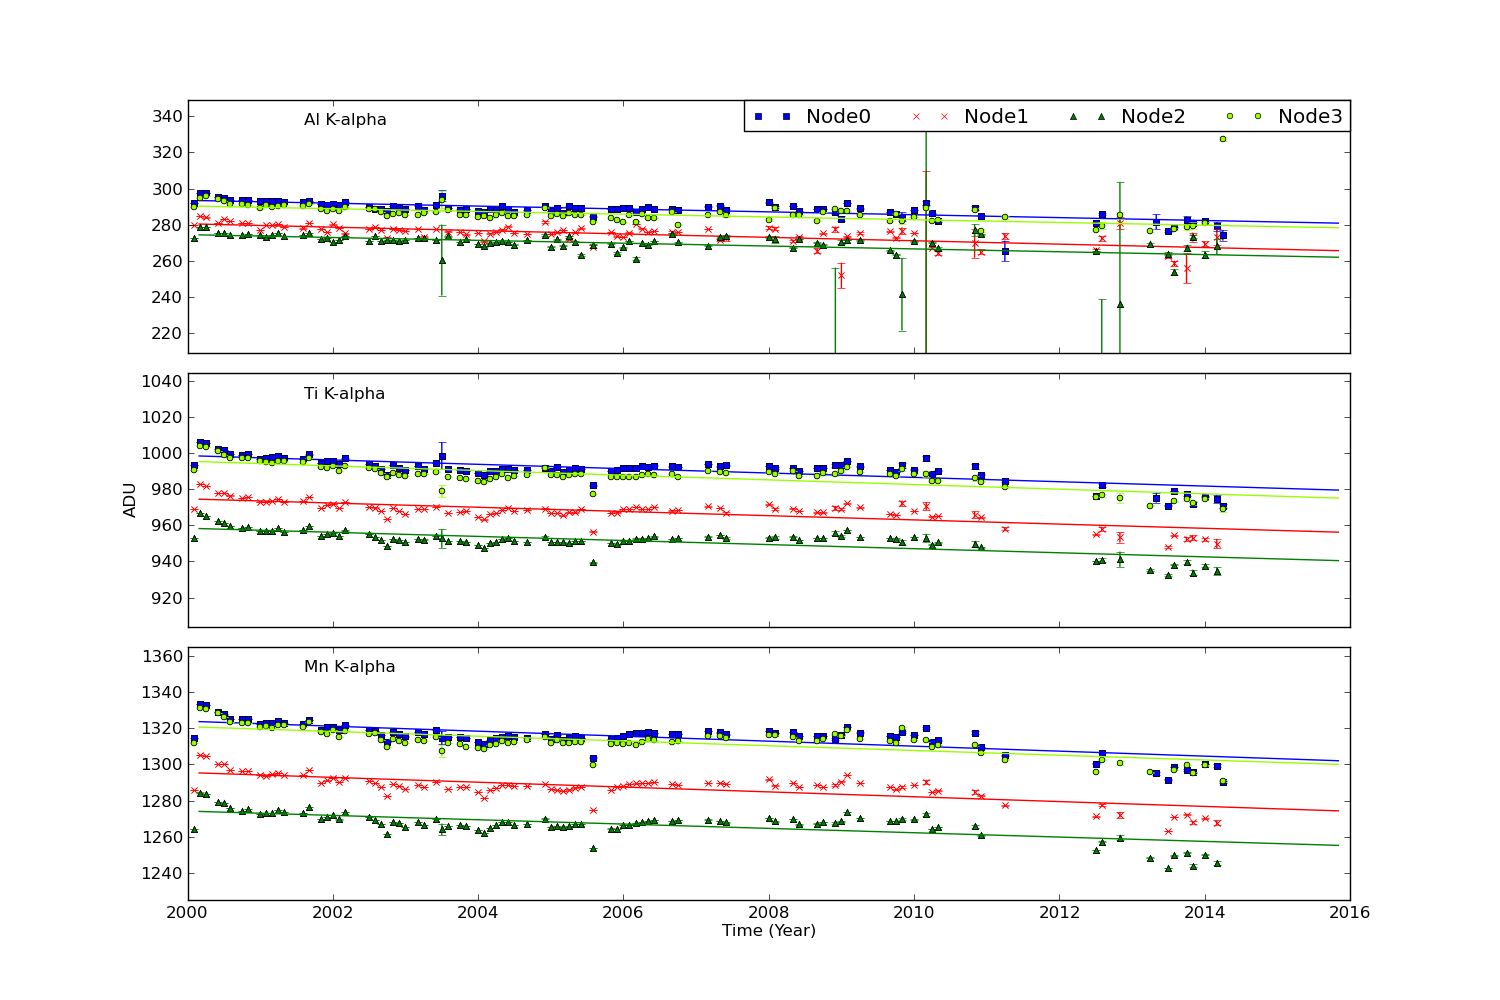
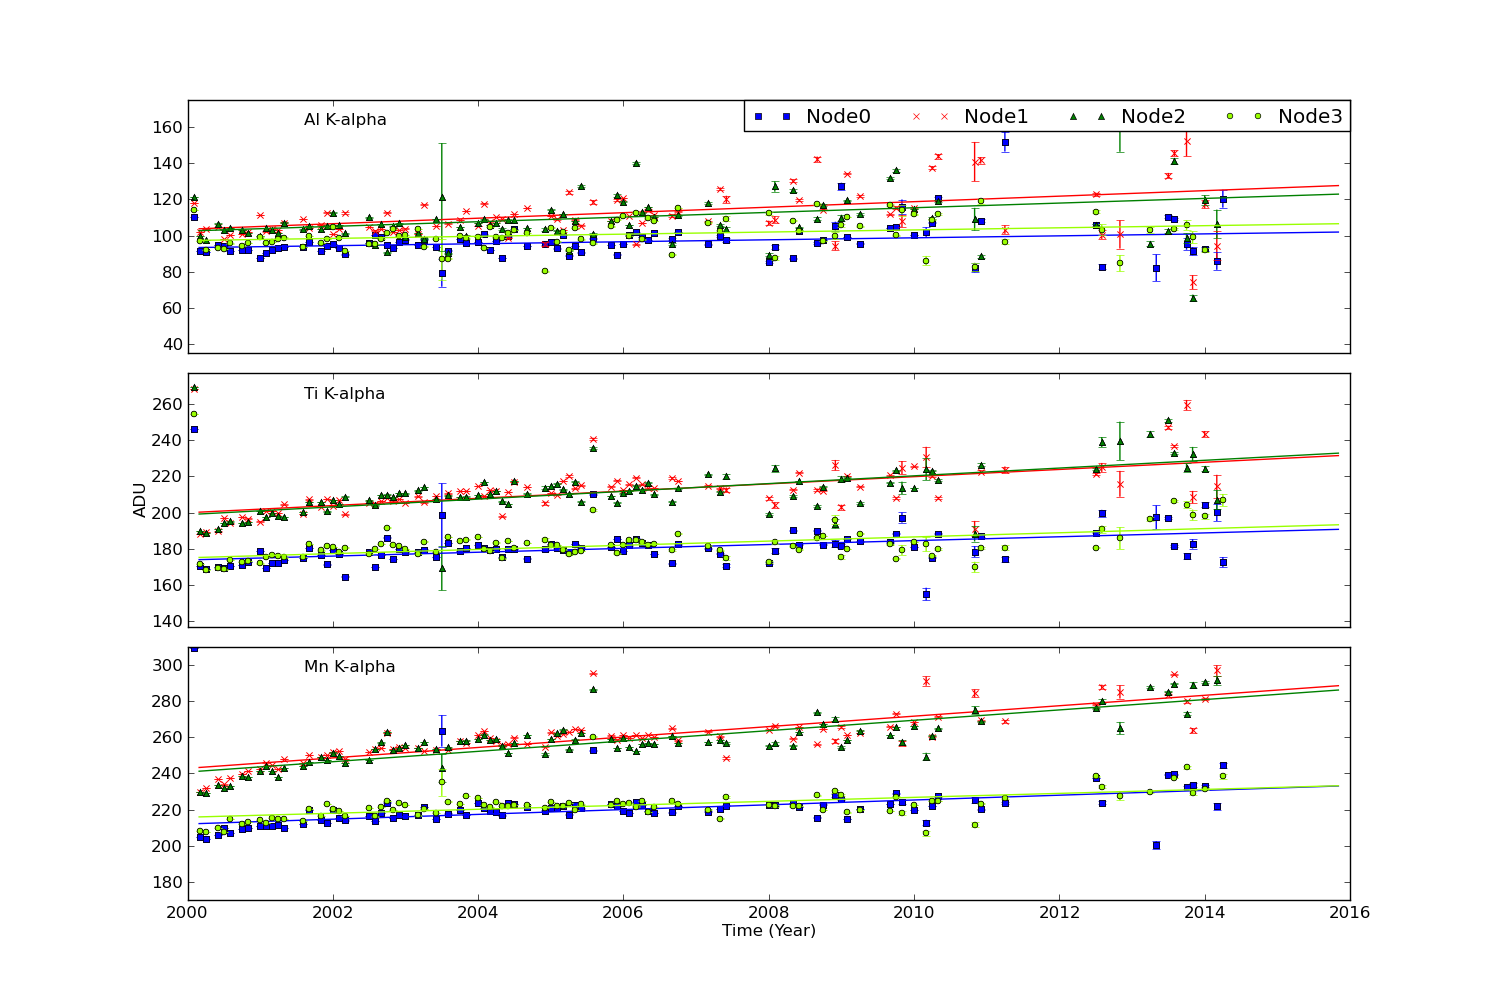
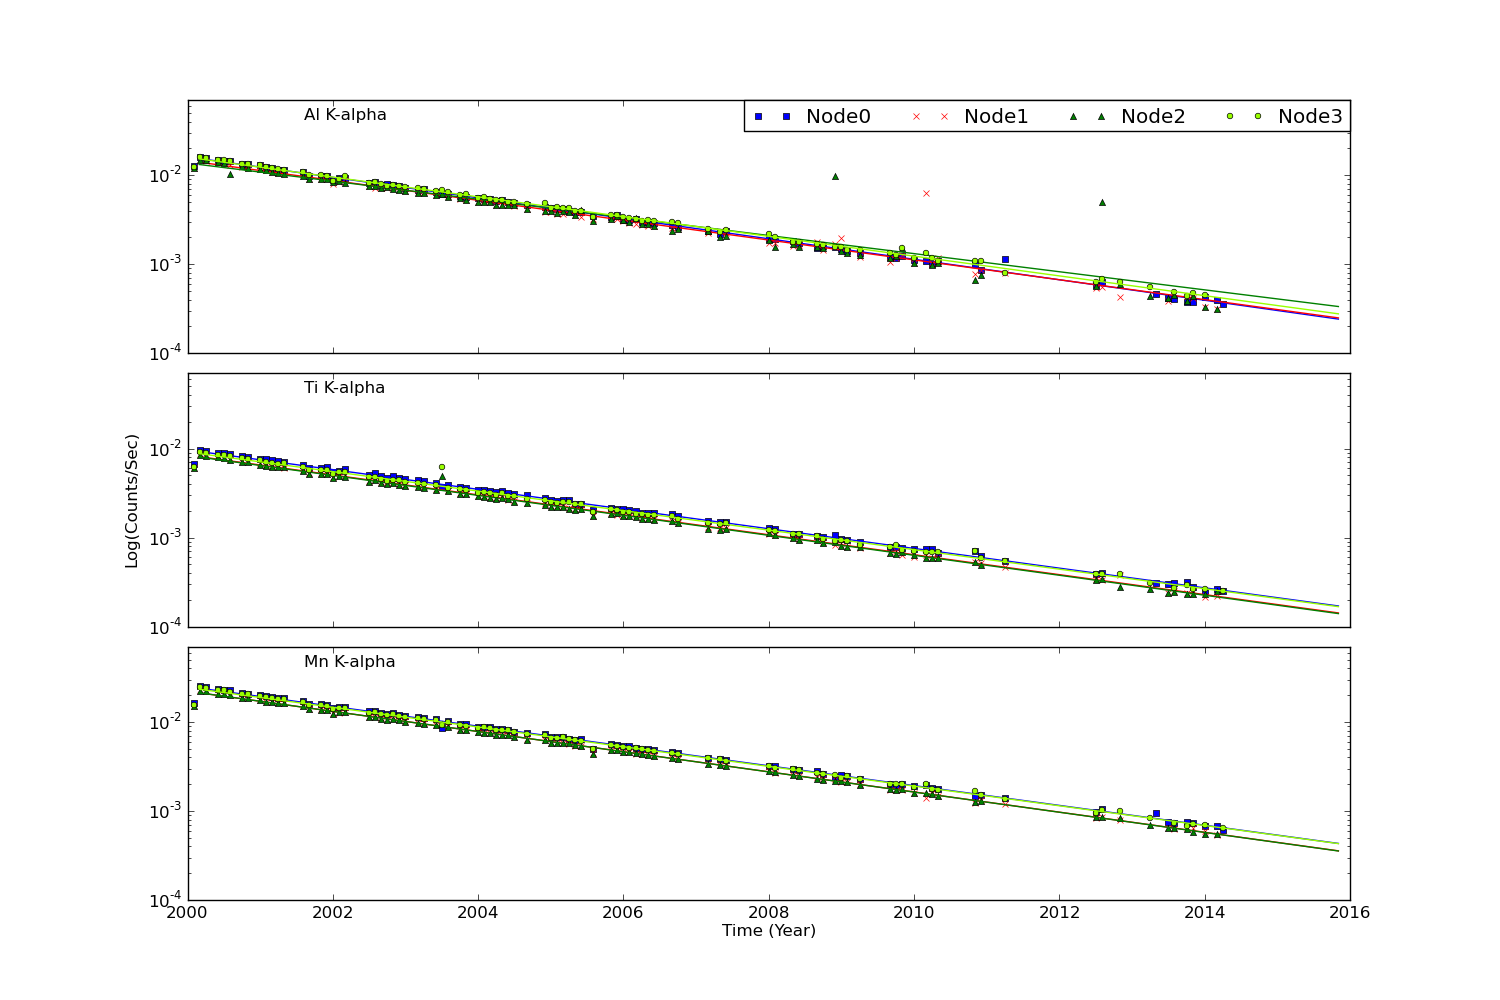
ACIS Histogram Mode Trends
We collected data from acis histogram mode data, and created trend plots of peak portions and peak widths against time (DOM). The peaks were estimated by fitting a simple Gaussian on three peaks (Al, Ti, and Mn), and the widths were estimated by a width at the half max from the peak.
All histogram data are taken under TIMED and GRADED_HIST mode, SIM position is at an external calibration source position, the focal temperature is around -119.7 C, and parameter settings in aciselec, acistemp are set to about same for all.
CCD 3, Peak Position
CCD 3, Peak Widths
CCD 3, Count Rates
HRC
DOSE of Central 4K Pore-Pairs
Please refer to Maximum Dose Trends for more details.
)
|
|---|
         IMAGE                NPIX      MEAN    STDDEV      MIN       MAX
 HRCI_11_2014.fits          16777216   0.007    0.0860      0.0       2.0
)
        IMAGE                NPIX      MEAN    STDDEV      MIN       MAX
HRCI_08_1999_11_2014.fits  16777216   4.300    4.889       0.0       292.0
No Data
)
        IMAGE                NPIX     MEAN      STDDEV      MIN      MAX
HRCS_08_1999_11_2014.fits  16777216  15.525     27.207      0.0      1681.0
|
|
Max dose trend plots corrected for events that "pile-up"
in the center of the taps due to bad position information.
|
)
|
)
|
)
|
)
|
| Aug 2014 | May 2014 | Feb 2014 | Nov 2013 |
|---|
)
|
)
|
)
|
)
|
| Aug 2014 | May 2014 | Feb 2014 | Nov 2013 |
|---|
Gratings
Focus
We plot the width of the zero order streak of ACIS/HETG observations and the width of the zero order image for HRC/LETG observations of point sources. No significant defocusing trend is seen at this time. See Gratings Focus pages.
PCAD
ACA Trending
Gyro Bias Drift
Radiation History
Radiation Zone Timing
Sun Spot History
Trending
Quarterly Trends
- SIM Temperature
| Previous Quarter | ||||||
| MSID | MEAN | RMS | DELTA/YR | DELTA/YR/YR | UNITS | DESCRIPTION |
| 3FLCABPT | 284.22 | 4.26 | 1.418e+01 | 2.681e-12 | K | FLCA BASEPLATE (+X) |
| 3TSMXCET | 236.75 | 31.36 | 1.046e+02 | -2.887e-12 | K | -X TURTLE SHELL NR HRC CEA |
| 3TSMXSPT | 277.92 | 29.00 | 9.698e+01 | -2.590e-11 | K | -X TURTLE SHELL NR ACIS SS |
| 3TSPZSPT | 275.89 | 8.35 | 2.487e+01 | 1.040e-11 | K | +Z TURTLE SHELL NR ACIS SS |
| BOXTEMP | 282.18 | 1.34 | -3.658e+00 | -1.885e-13 | K | SEA box temperature (3FASEAAT) |
| PSUTEMP | 311.27 | 1.13 | -5.101e+00 | 4.182e-13 | K | SEA power supply temperature (3FAPSAT) |
)
)
)
)
)
)
- SIM Electronics
| Previous Quarter | ||||||
| MSID | MEAN | RMS | DELTA/YR | DELTA/YR/YR | UNITS | DESCRIPTION |
| AGRNDADC | 2.712e-04 | 2.006e-04 | 4.531e-04 | 1.446e-02 | V | Analog ground A/D convert reading |
| FATABADC | 5.00 | 2.422e-03 | 7.297e-03 | 2.416e-01 | Converter | FA Tab Position Sensor A/D |
| N15VADC | -15.01 | 4.645e-04 | 8.000e-04 | 4.374e-02 | Reading | -15V Power Supply A/D Converter |
| P15VADC | 14.96 | 5.372e-04 | 2.345e-03 | 6.420e-02 | Reading | +15V Power Supply A/D Converter |
| P5VADC | 5.00 | 2.425e-02 | 7.025e-02 | 2.519e+00 | Reading | +5V Power Supply A/D Converter |
| TSCTABADC | 5.00 | 4.362e-03 | 9.688e-03 | 3.331e-01 | converter | TSC Tab Position Sensor A/D |
)
)
)
)
)
)
Envelope Trending
OBA Grad
OBA Heaters
Spacecraft Motions
TSC and FA Cummulative Moter Distance

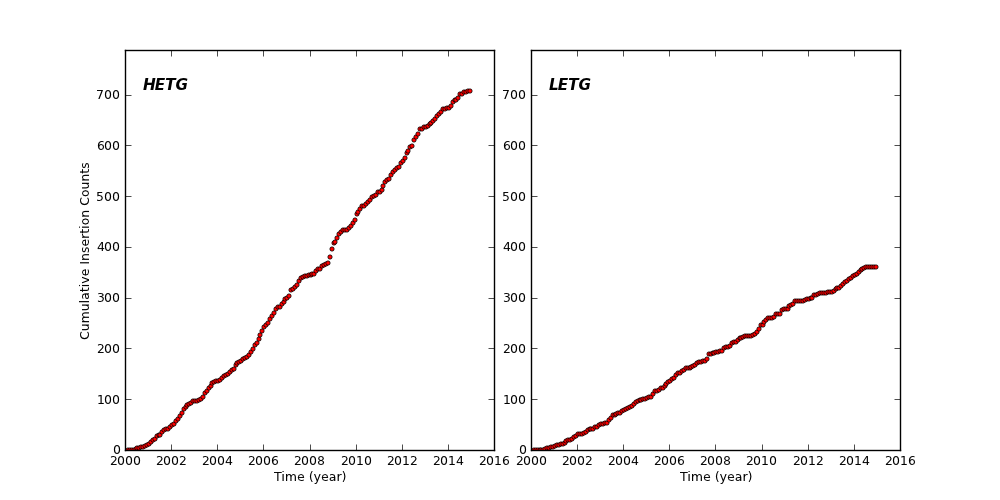
HETG and LETG Cummulative Insertion Counts
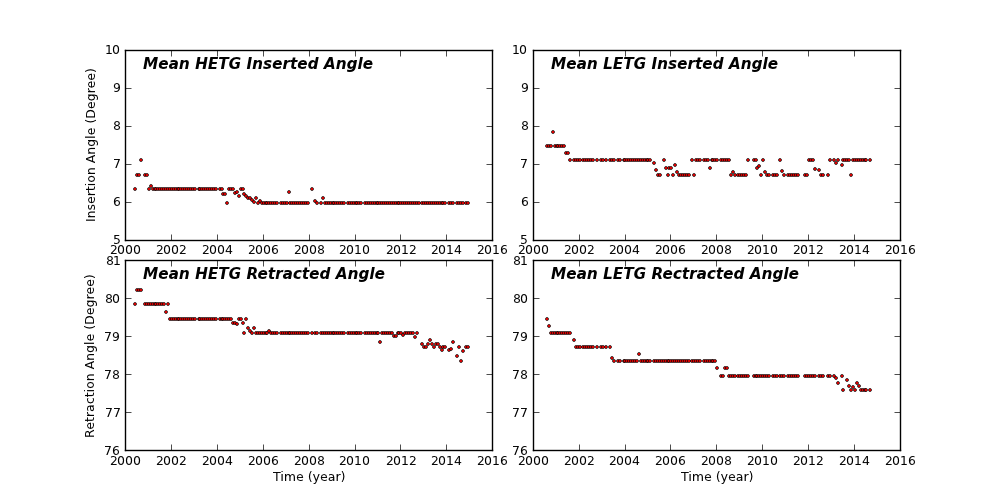
HETG/LETG Insertion/Retraction Angle
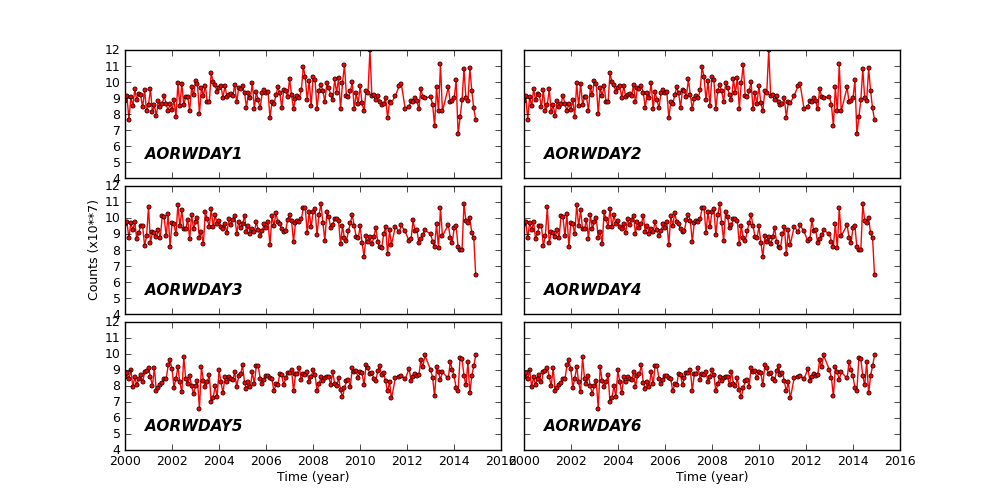
Reaction Wheel Rotations
Links to Past Monthly Reports
| Year | Month | |||||||||||
|---|---|---|---|---|---|---|---|---|---|---|---|---|
| 1999 | Jul | Aug | Sep | Oct | Nov | Dec | ||||||
| 2000 | Jan | Feb | Mar | Apr | May | Jun | Jul | Aug | Sep | Oct | Nov | Dec |
| 2001 | Jan | Feb | Mar | Apr | May | Jun | Jul | Aug | Sep | Oct | Nov | Dec |
| 2002 | Jan | Feb | Mar | Apr | May | Jun | Jul | Aug | Sep | Oct | Nov | Dec |
| 2003 | Jan | Feb | Mar | Apr | May | Jun | Jul | Aug | Sep | Oct | Nov | Dec |
| 2004 | Jan | Feb | Mar | Apr | May | Jun | Jul | Aug | Sep | Oct | Nov | Dec |
| 2005 | Jan | Feb | Mar | Apr | May | Jun | Jul | Aug | Sep | Oct | Nov | Dec |
| 2006 | Jan | Feb | Mar | Apr | May | Jun | Jul | Aug | Sep | Oct | Nov | Dec |
| 2007 | Jan | Feb | Mar | Apr | May | Jun | Jul | Aug | Sep | Oct | Nov | Dec |
| 2008 | Jan | Feb | Mar | Apr | May | Jun | Jul | Aug | Sep | Oct | Nov | Dec |
| 2009 | Jan | Feb | Mar | Apr | May | Jun | Jul | Aug | Sep | Oct | Nov | Dec |
| 2010 | Jan | Feb | Mar | Apr | May | Jun | Jul | Aug | Sep | Oct | Nov | Dec |
| 2011 | Jan | Feb | Mar | Apr | May | Jun | Jul | Aug | Sep | Oct | Nov | Dec |
| 2012 | Jan | Feb | Mar | Apr | May | Jun | Jul | Aug | Sep | Oct | Nov | Dec |
| 2013 | Jan | Feb | Mar | Apr | May | Jun | Jul | Aug | Sep | Oct | Nov | Dec |
| 2014 | Jan | Feb | Mar | Apr | May | Jun | Jul | Aug | Sep | Oct | ||