ACIS
ACIS DOSE Registered-Photon-Map
The steps we took to compute the dose map are;
- Level 1 Event files for a specified month are obtained from archive.
- Image data including I2, I3, S2, S3 CCDs are extracted from all event files.
- All the extracted image data were merged to create a month long exposure map for the month.
- The exposure map is opened with ds9, and check a distribution of count rates against energy. From this, estimate the upper threshold value. Any events beyond this upper threshold are assumed erroneous events such as bad pixels.
- Using this upper threshold, the data is filtered, and create a cleaned exposure map for the month.
- The exposure map from each month from the Sep 1999 is added up to create a cumulative exposure map for each month.
- Using fimgstatistic, we compute count rate statistics for each CCDs.
- For observations with high data drop rates (e.g., Crab nebula, Cas A), we corrected the observations by adding events.
Please check more detail plots at Telemetered Photon Dose Trend page.
)
)
)
Statistics:
# IMAGE     NPIX     MEAN        RMS        MIN     MAX
ACIS_jan15 6004901   7.754       13.196     0.0     1345


I2 node 0  262654   7.660829     3.348893    0.0   52.0
I2 node 1  262654   7.842928     3.605696    0.0  240.0
I2 node 2  262654   8.004315     3.488653    0.0   62.0
I2 node 3  262654   8.008748     4.528251    0.0 1345.0

I3 node 0  262654   8.797402     3.825496    0.0   55.0
I3 node 1  262654   8.949563     7.076554    0.0  216.0
I3 node 2  262654   7.777743     3.298055    0.0   55.0
I3 node 3  262654   7.812007     3.419161    0.0  322.0

S2 node 0  262654   9.202282     3.761388    0.0  290.0
S2 node 1  262654   9.331769     4.142550    0.0   69.0
S2 node 2  262654   9.473292     4.594712    0.0  976.0
S2 node 3  262654   9.420885     3.903514    0.0  484.0

S3 node 0  262654   20.555350   32.650192    0.0  299.0
S3 node 1  262654   17.619495   23.156763    0.0  268.0
S3 node 2  262654   12.094064    3.898124    0.0   59.0
S3 node 3  262654   10.992456    3.668539    0.0   30.0
)
)
)
Statistics:
 IMAGE     NPIX      MEAN        RMS        MIN      MAX
ACIS_total 6004901   1856.793    2436.649   0.0     107677


I2 node 0  262654   1559.145586  298.480370   290.0   9079.0
I2 node 1  262654   1643.691097  411.966826   324.0  37539.0
I2 node 2  262654   1673.836320  350.099898   324.0   9199.0
I2 node 3  262654   1671.762056  421.132060   309.0  28016.0

I3 node 0  262654   1756.513563  418.114363   307.0   6895.0
I3 node 1  262654   1843.727438 1396.111426   313.0  35333.0
I3 node 2  262654   1611.188084  289.053371   299.0   8231.0
I3 node 3  262654   1596.879778  309.565487   282.0  27139.0

S2 node 0  262654   2174.147610  316.713915  1148.0  21215.0
S2 node 1  262654   2313.279645  506.307299  1208.0  12808.0
S2 node 2  262654   2548.220037  482.975940  1523.0  19272.0
S2 node 3  262654   2470.434423  342.044693  1422.0  42093.0

S3 node 0  262654   3868.234425 1794.752673  1579.0  13548.0
S3 node 1  262654   5039.144565 2079.628833     0.0  14029.0
S3 node 2  262654   3841.270623  985.607218  1578.0   9360.0
S3 node 3  262654   2979.421168  450.568583  1699.0  10341.0
)
|
)
|
)
|
)
|
| Oct 2014 | Jul 2014 | Apr 2014 | Jan 2014 |
|---|
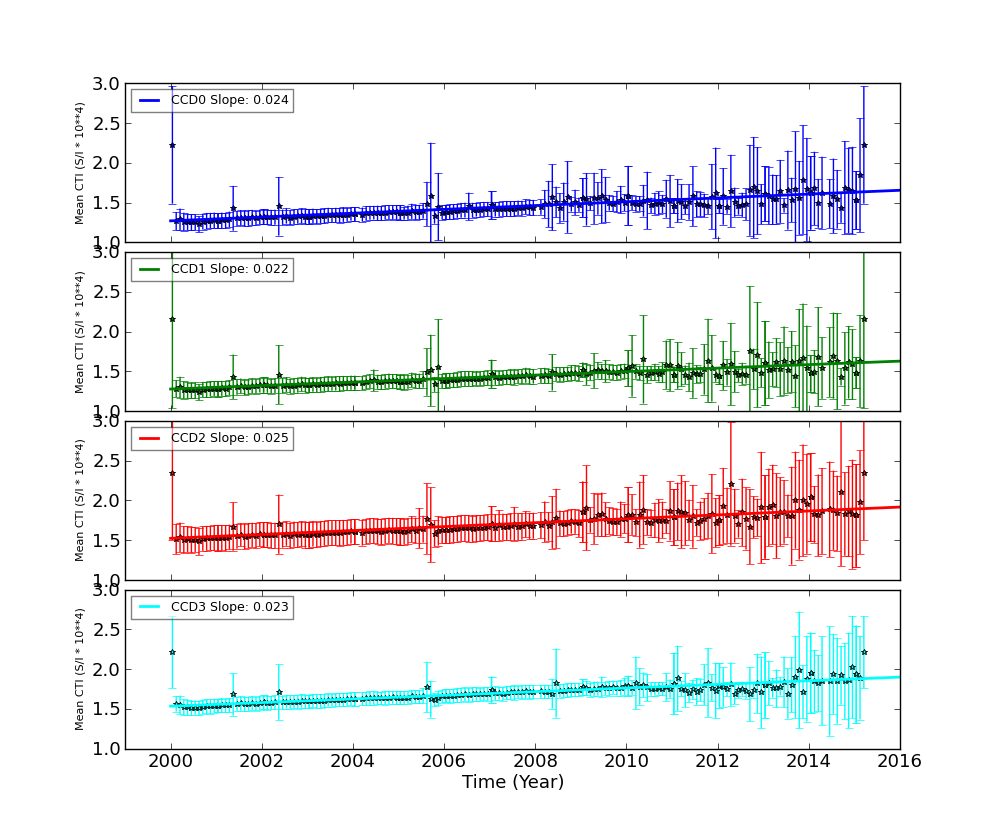
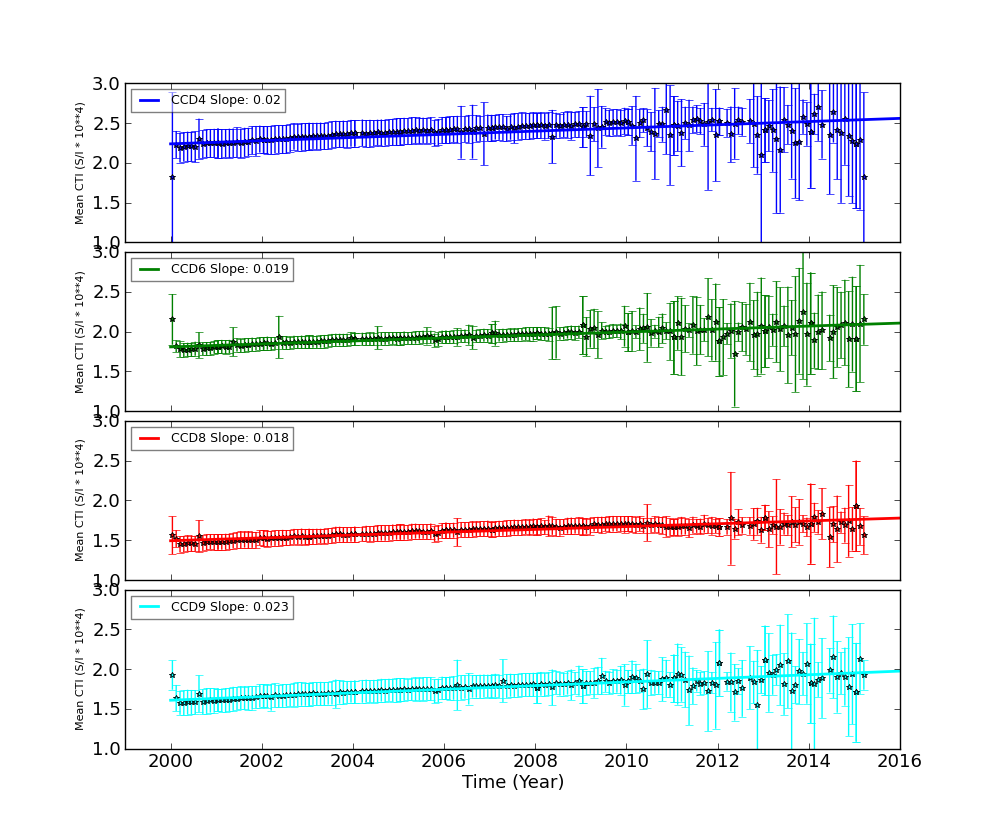
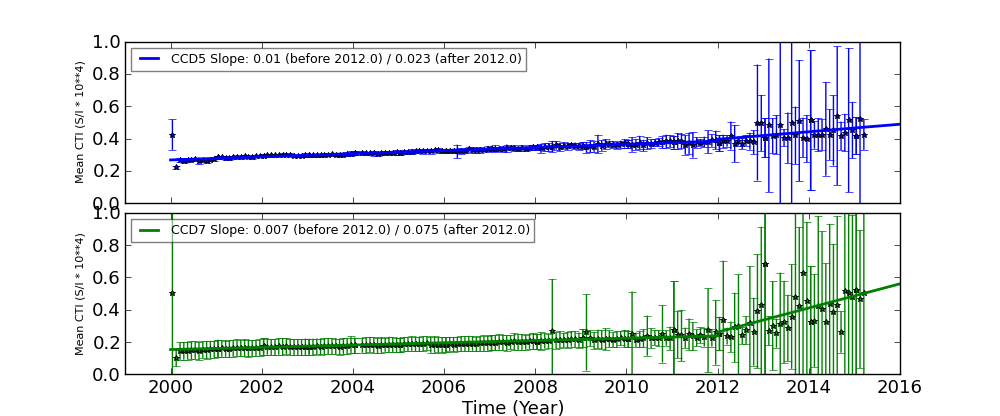
The Mean Detrended CTI
We report CTIs with a refined data definition. CTIs were computed for the temperature dependency corrected data. Please see CTI page for detailed explanation. CTI's are computed for Mn K alpha, and defined as slope/intercept x10^4 of row # vs ADU. Data file: here
Imaging CCDs
Spectral CCDs
Backside CCDs
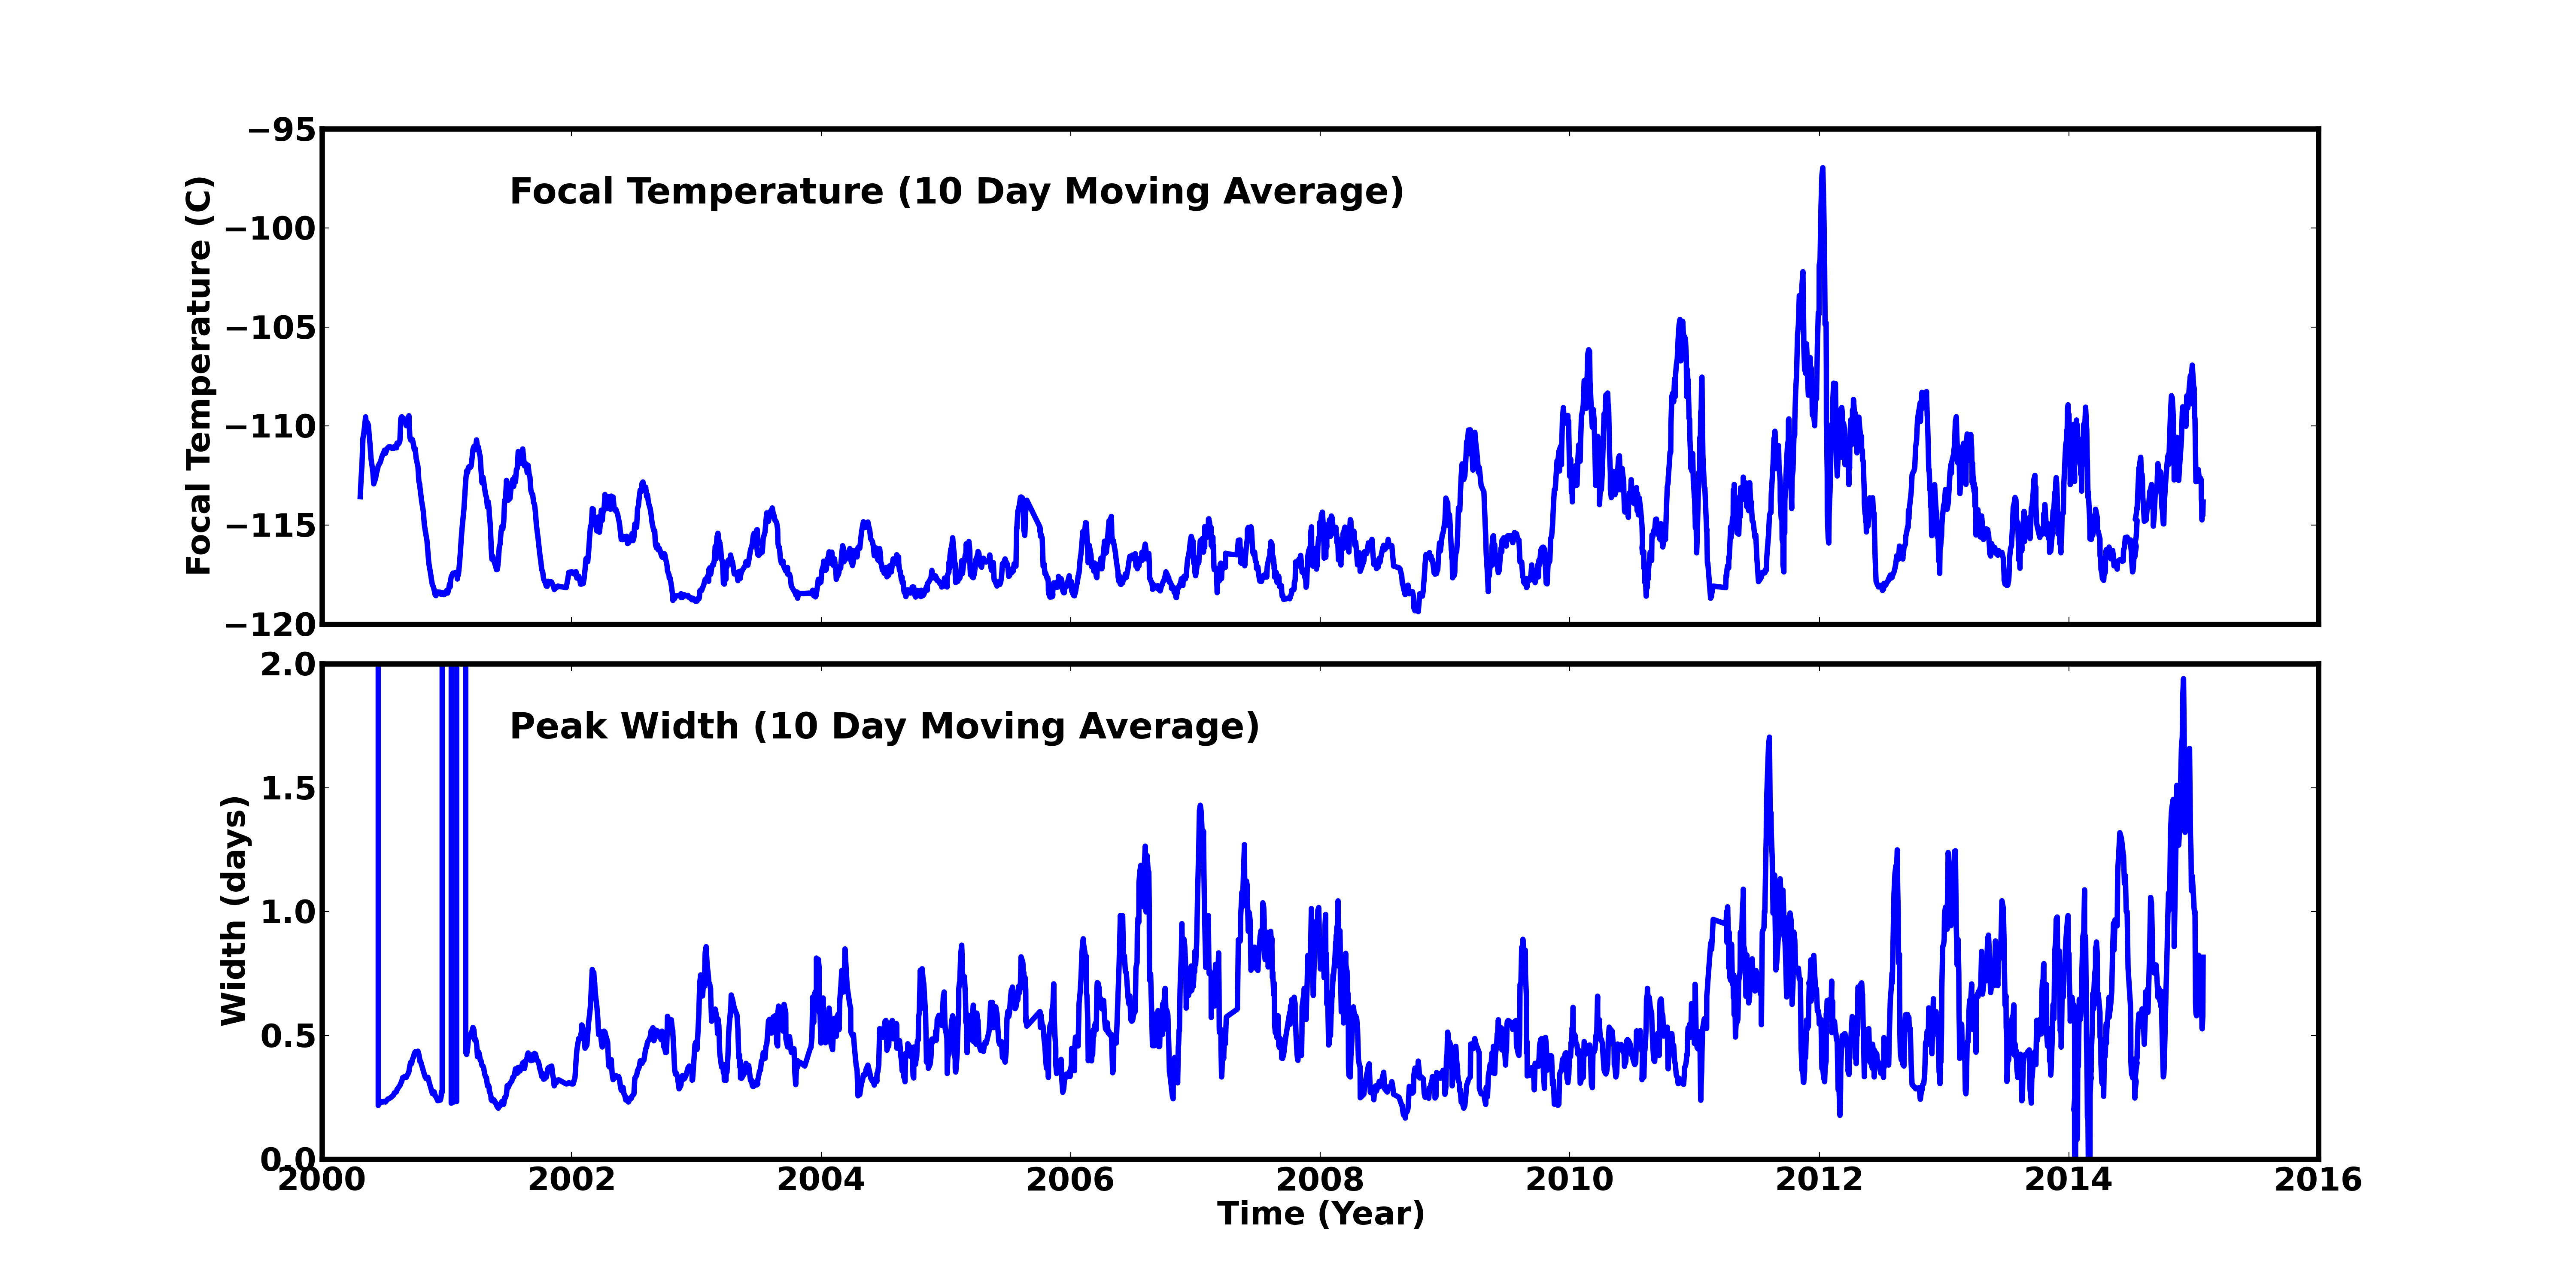
Focal Plane Temperature
Dec 2014 Focal Temperature
| The Mean (max) FPT: | |
|---|---|
| -113.09 | +/- 4.80 C |
| Mean Width: | |
| 0.76 | +/- 0.67 days |
Averaged Focal Plane Temperature
We are using 10 period moving averages to show trends of peak temperatures and peak widths. Note, the gaps in the width plot are due to missing/corrupted data.
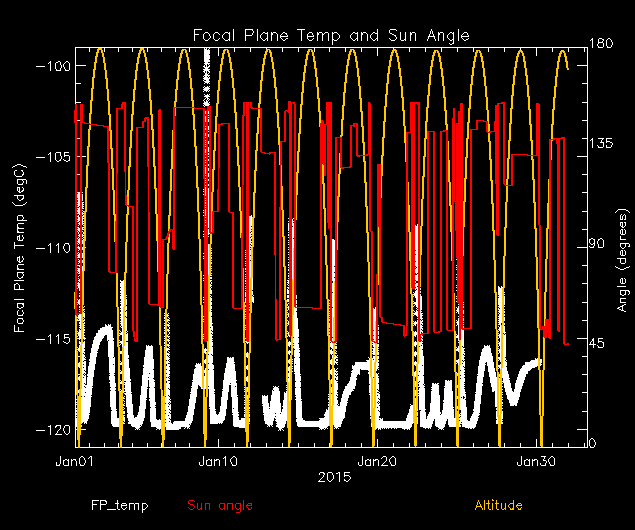
Focal Plane Temperature, Sun Angle and Altitude
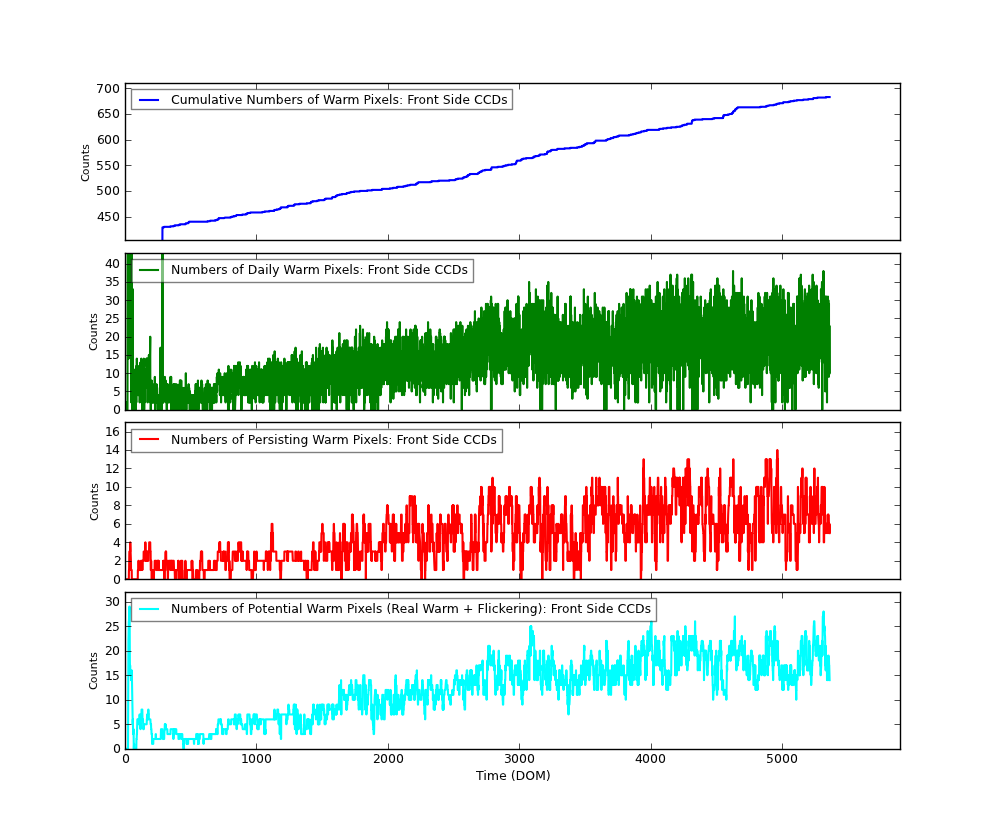
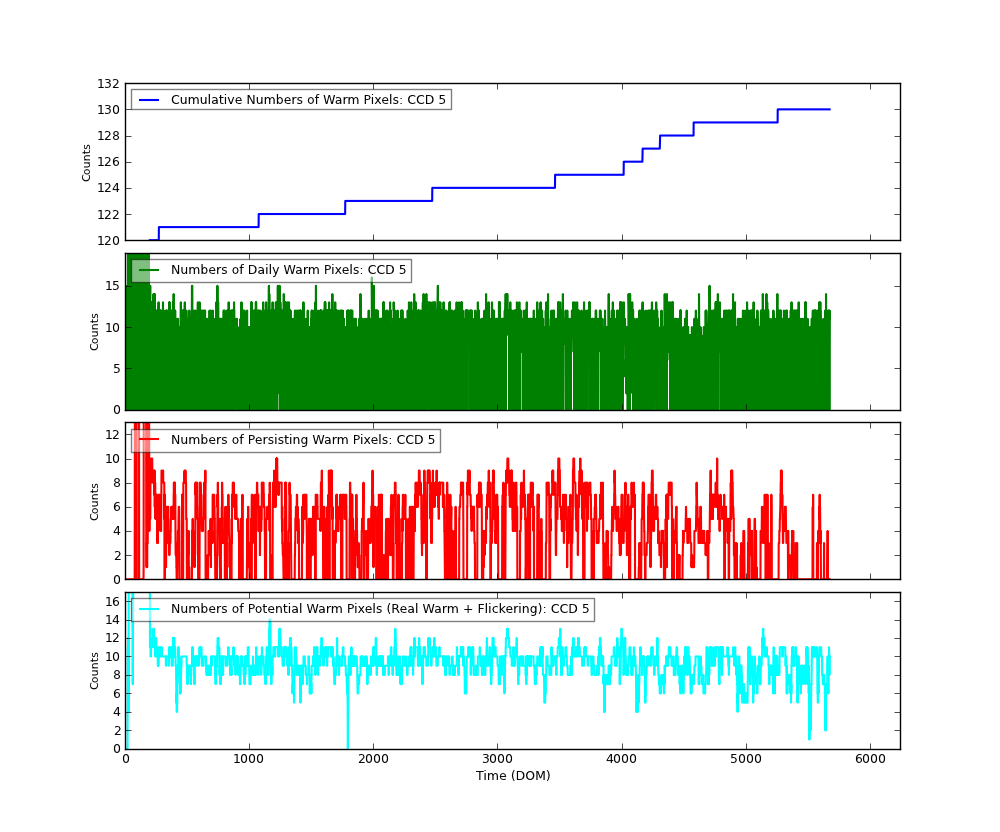
Bad Pixels
The plots below were generated with a new warm pixel finding script. Please see Acis Bad Pixel Page for details.
Front Side CCDs
Back Side CCD (CCD5)
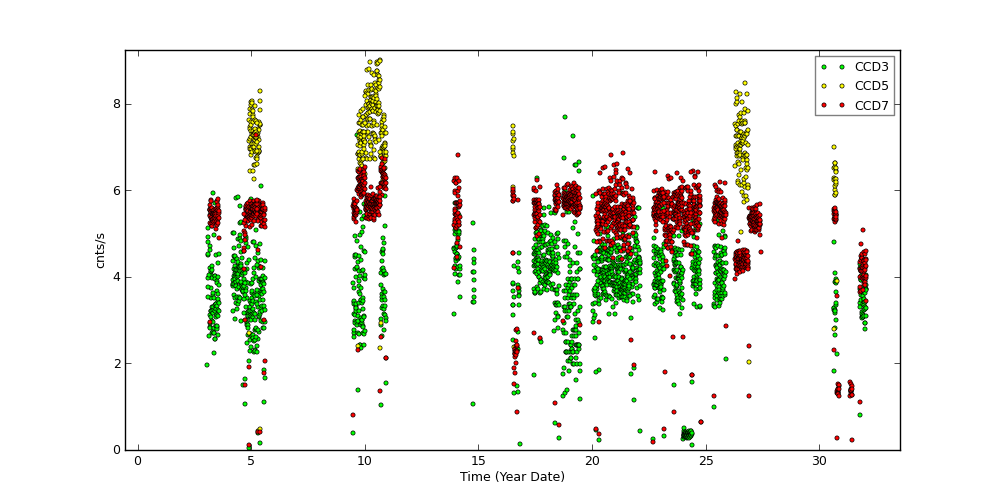
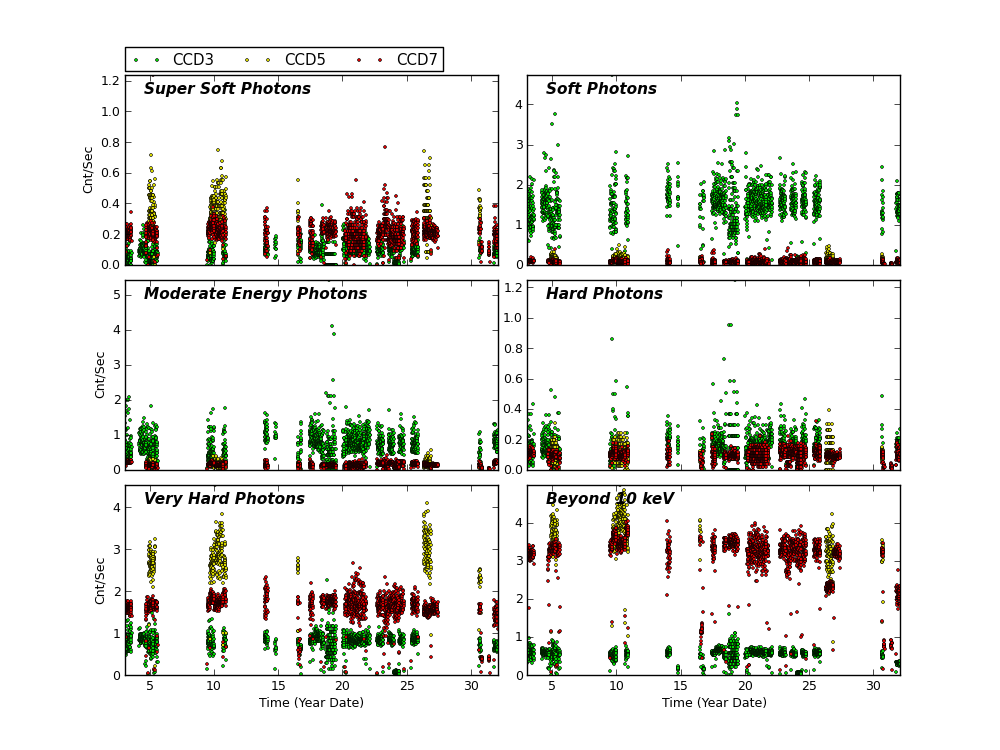
Science Instrument Background Rates
| Name | Low (keV) | High(KeV) | Description |
|---|---|---|---|
| SSoft | 0.00 | 0.50 | Super soft photons |
| Soft | 0.50 | 1.00 | Soft photons |
| Med | 1.00 | 3.00 | Moderate energy photons |
| Hard | 3.00 | 5.00 | Hard Photons |
| Harder | 5.00 | 10.00 | Very Hard photons |
| Hardest | 10.00 | Beyond 10 keV |
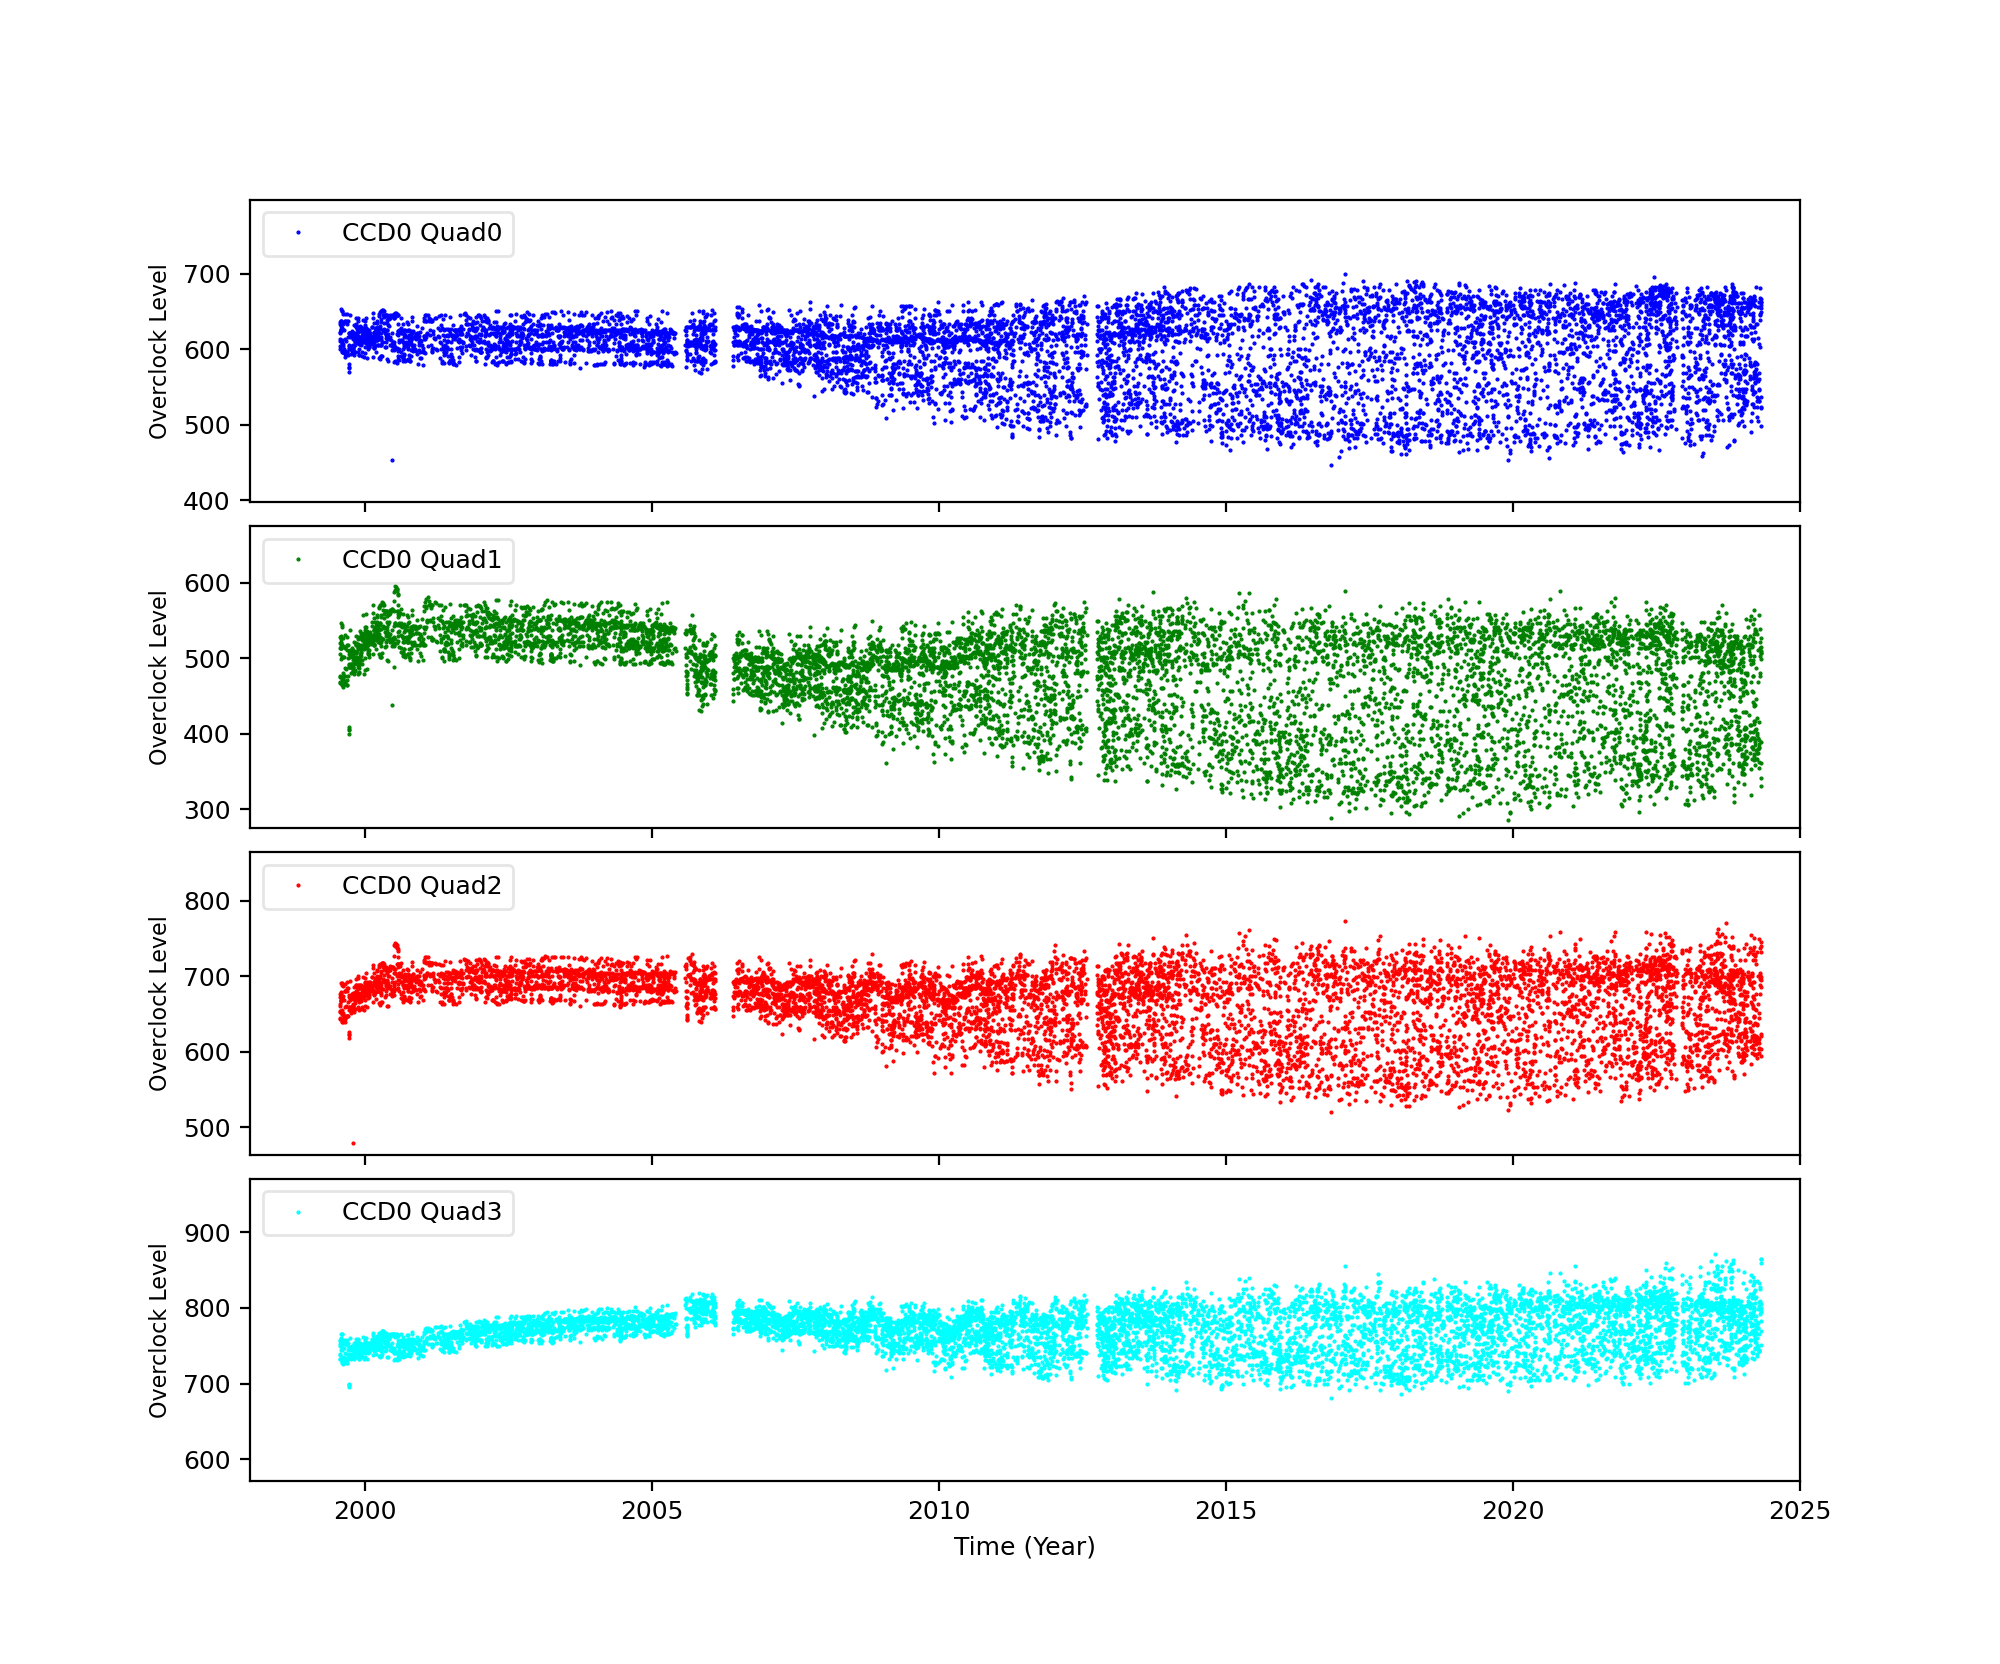
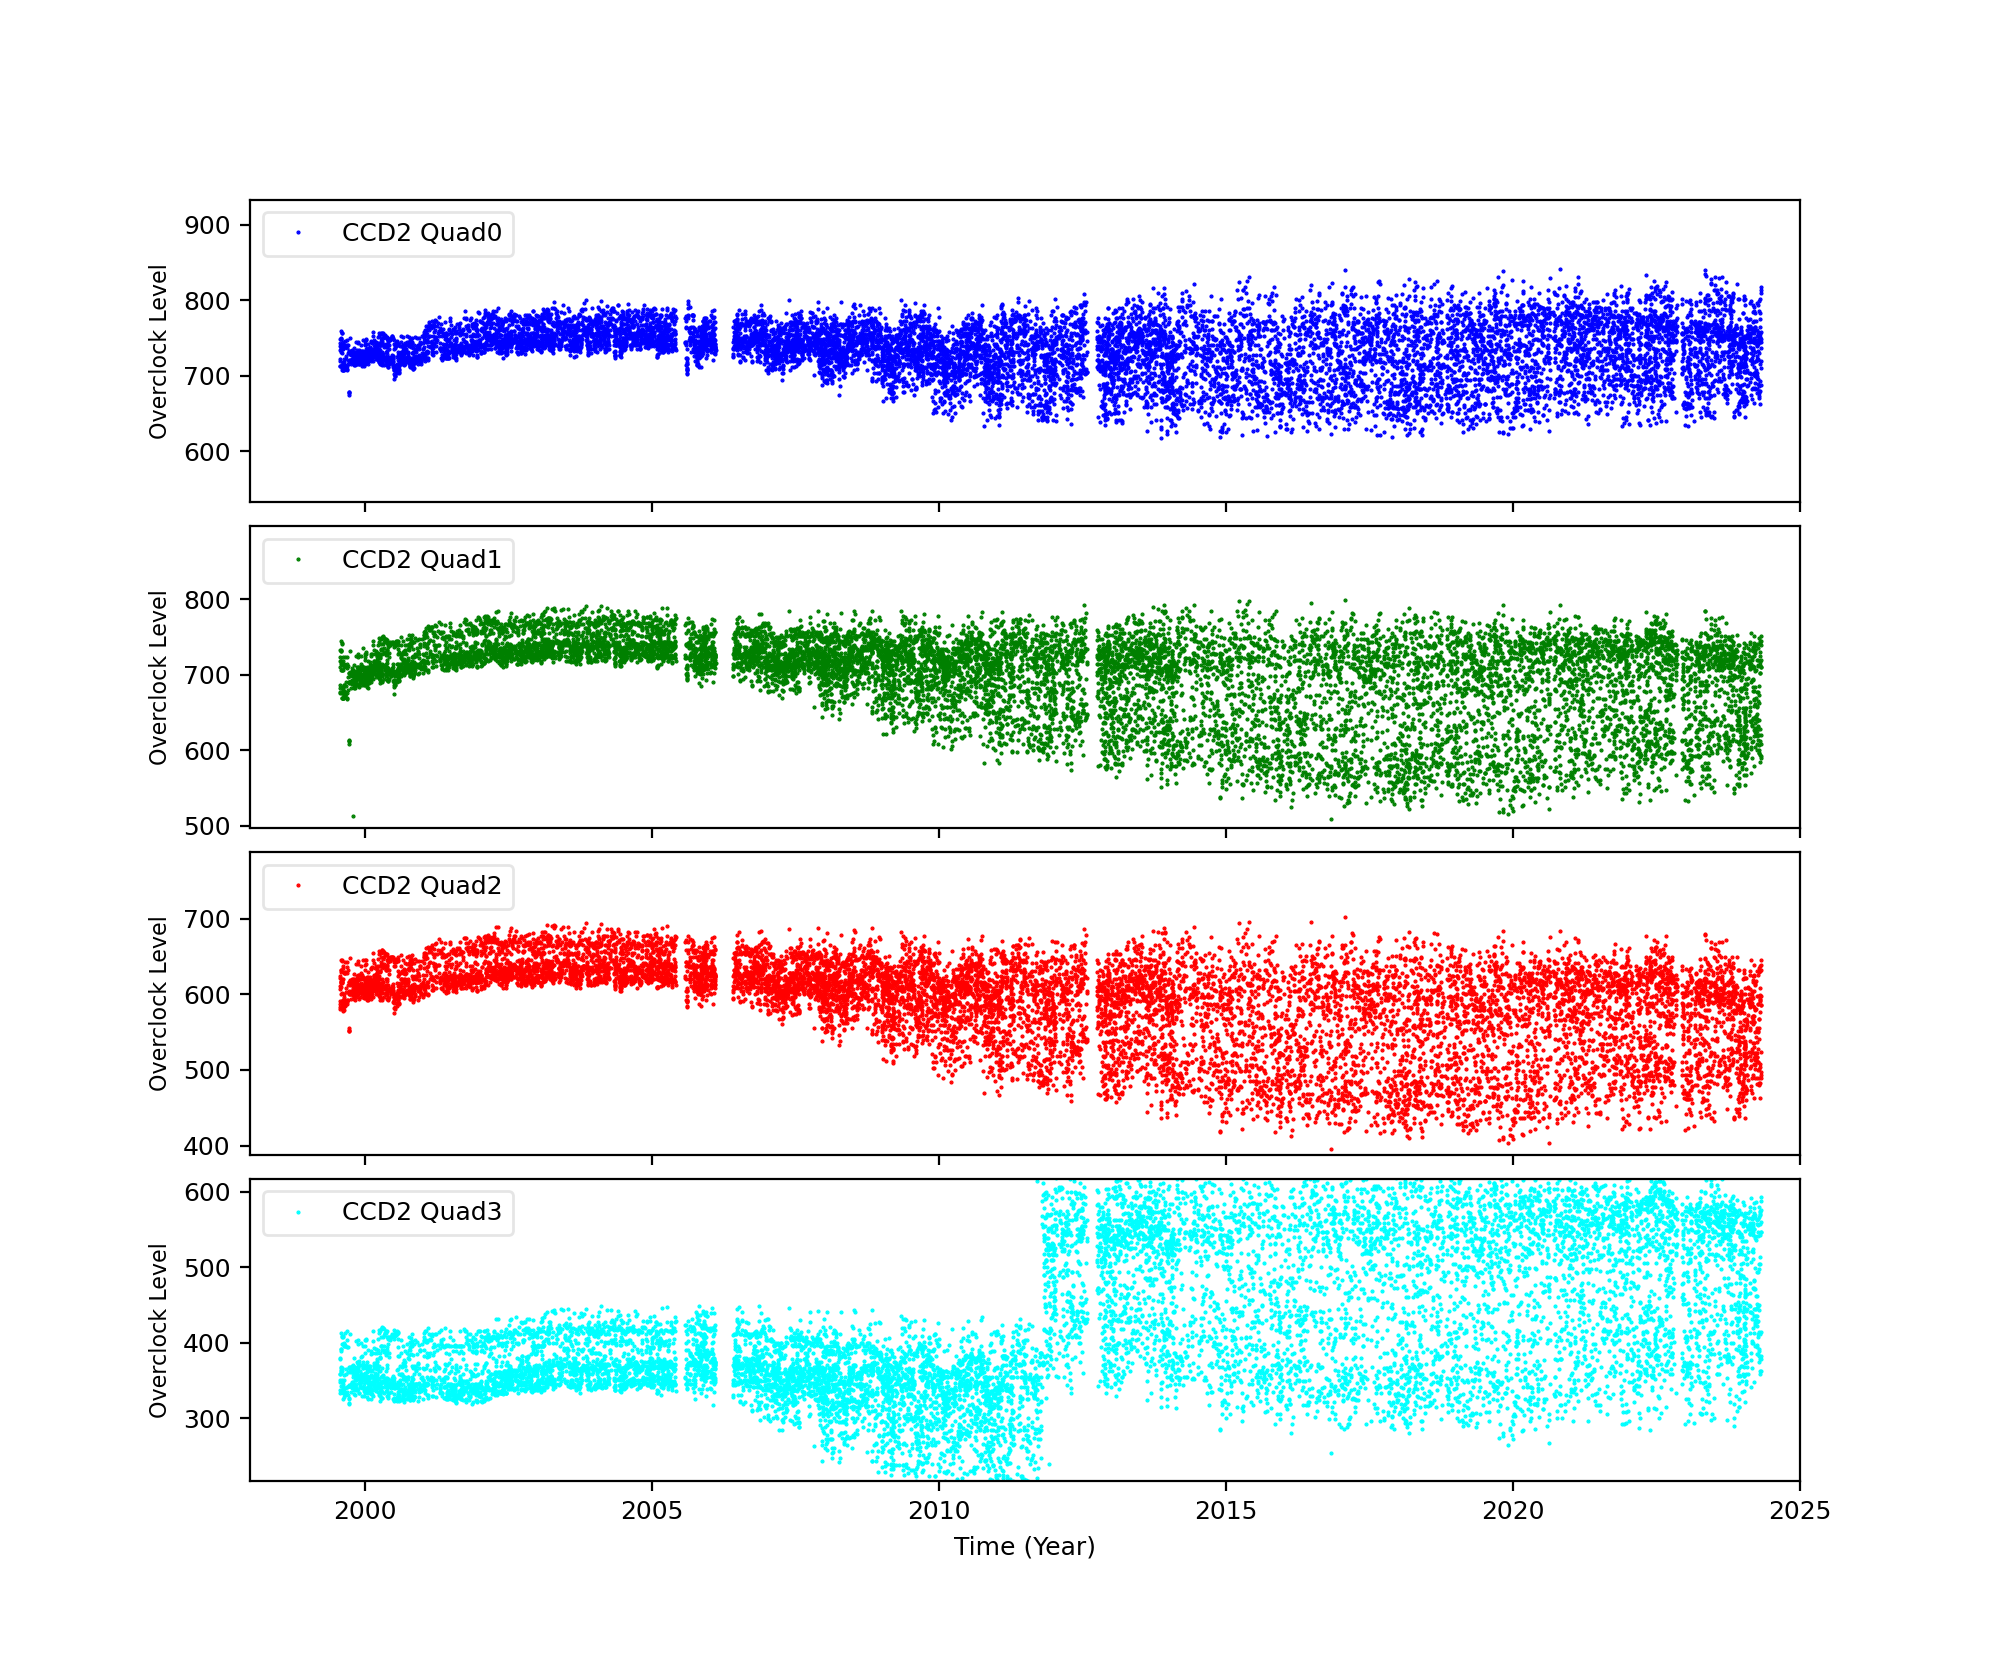
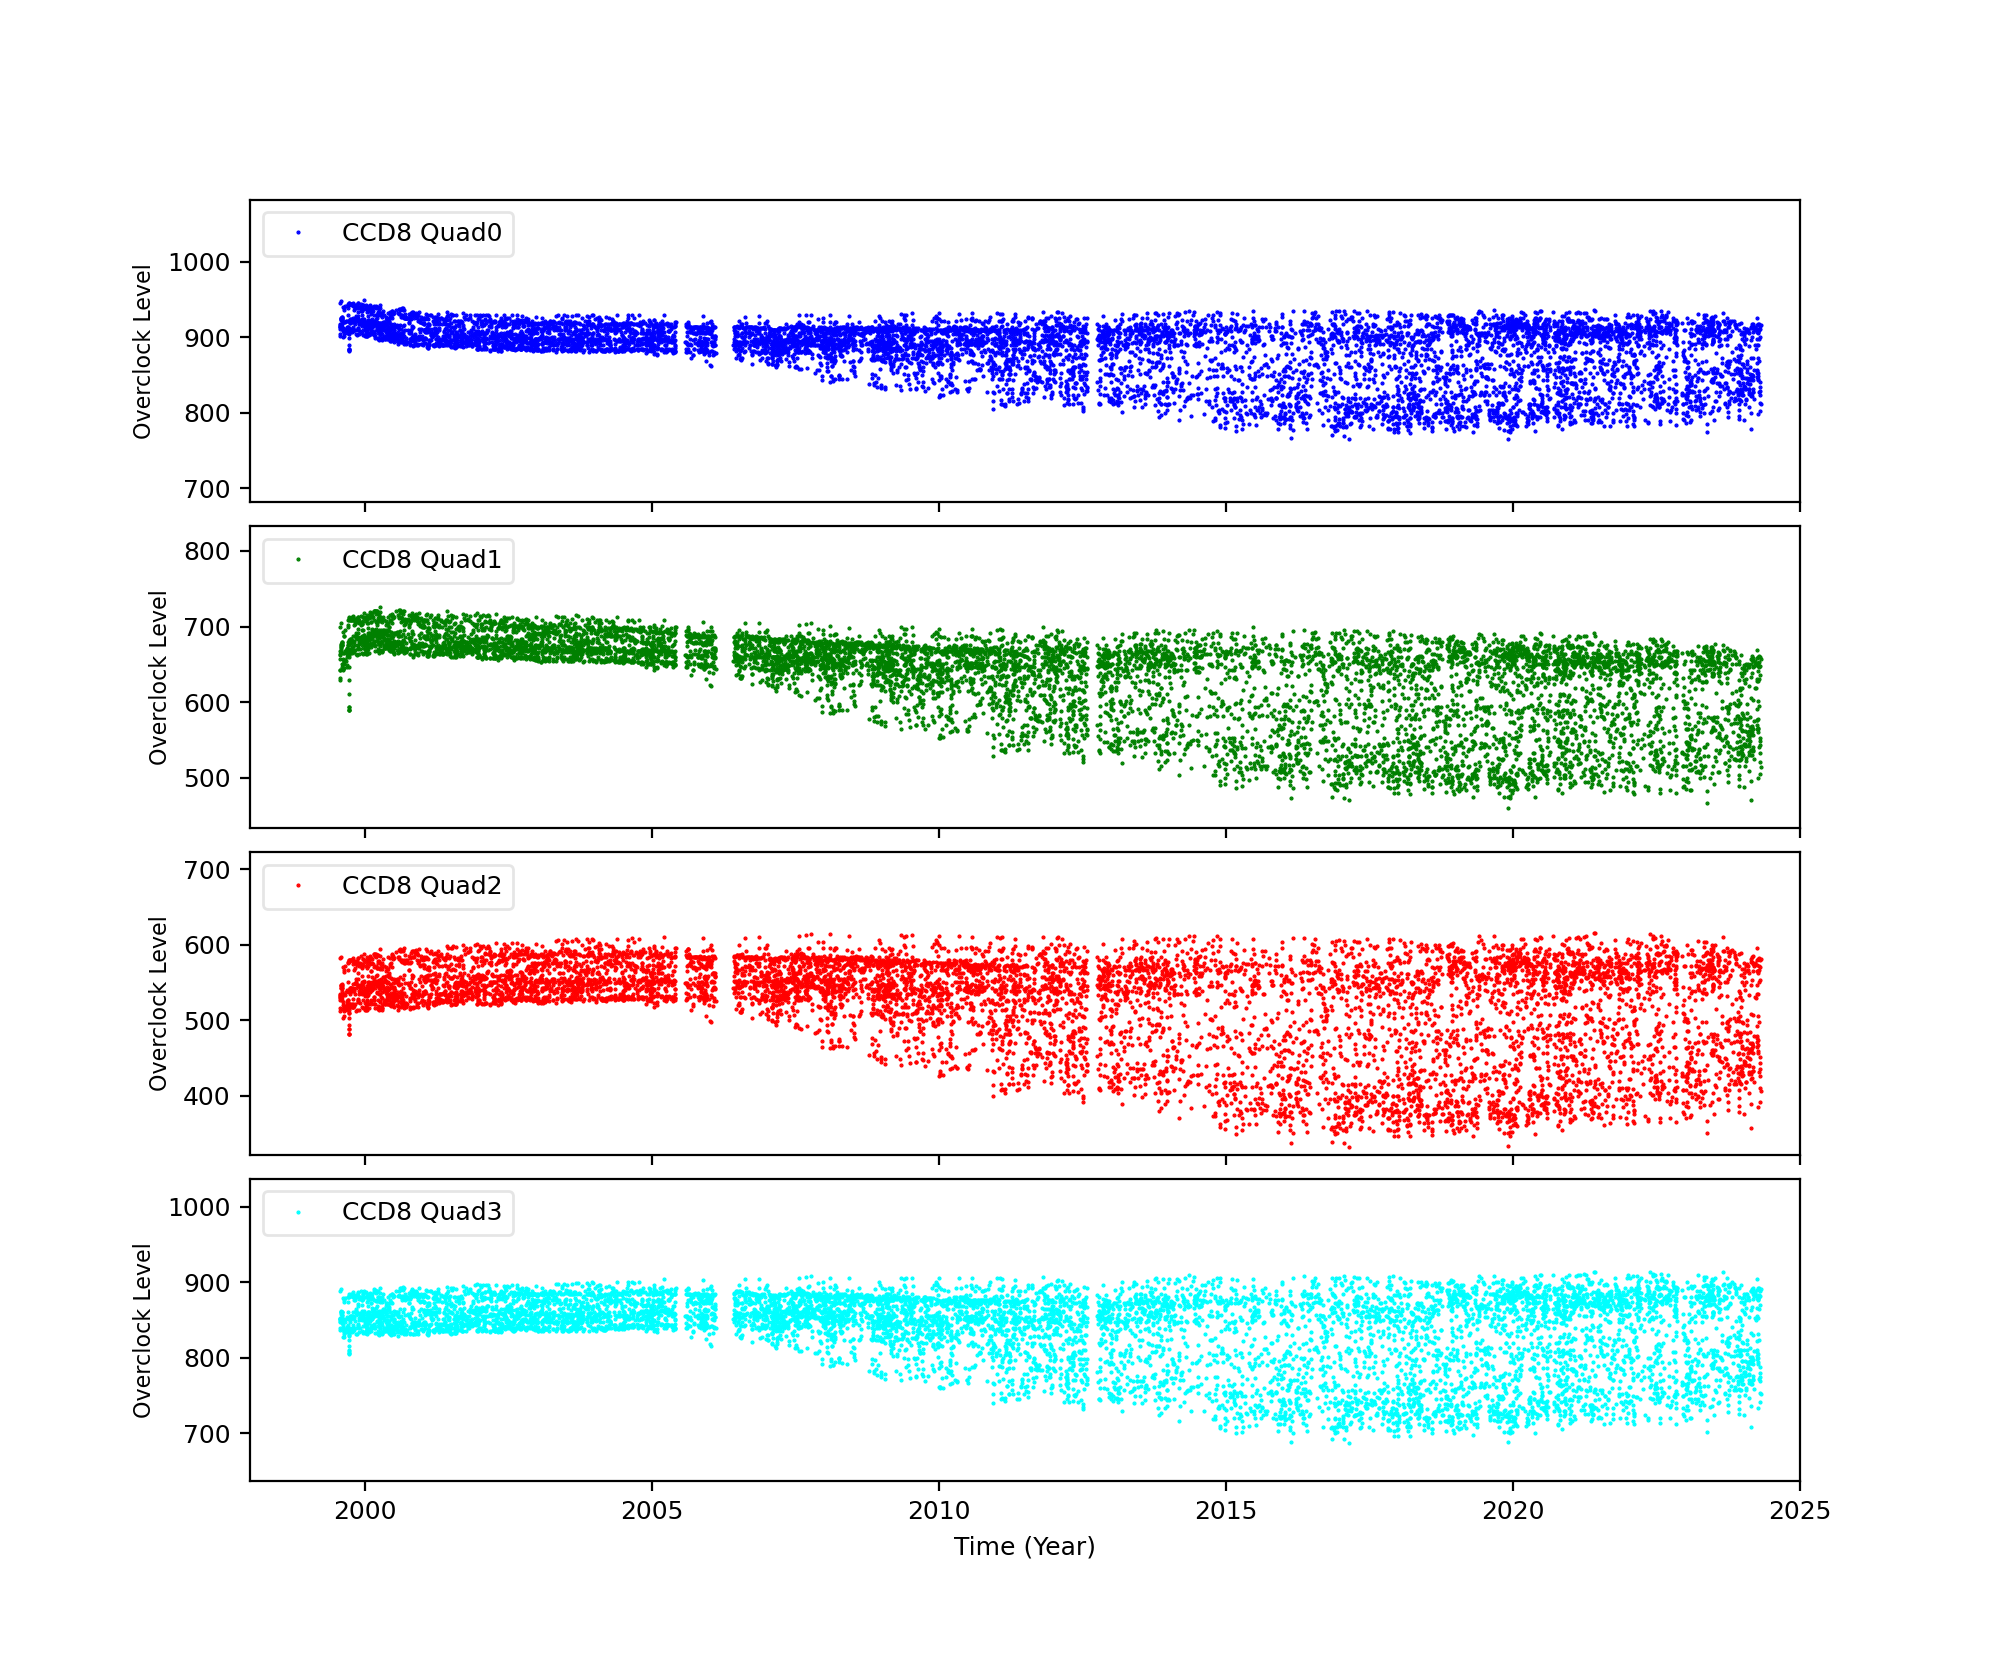
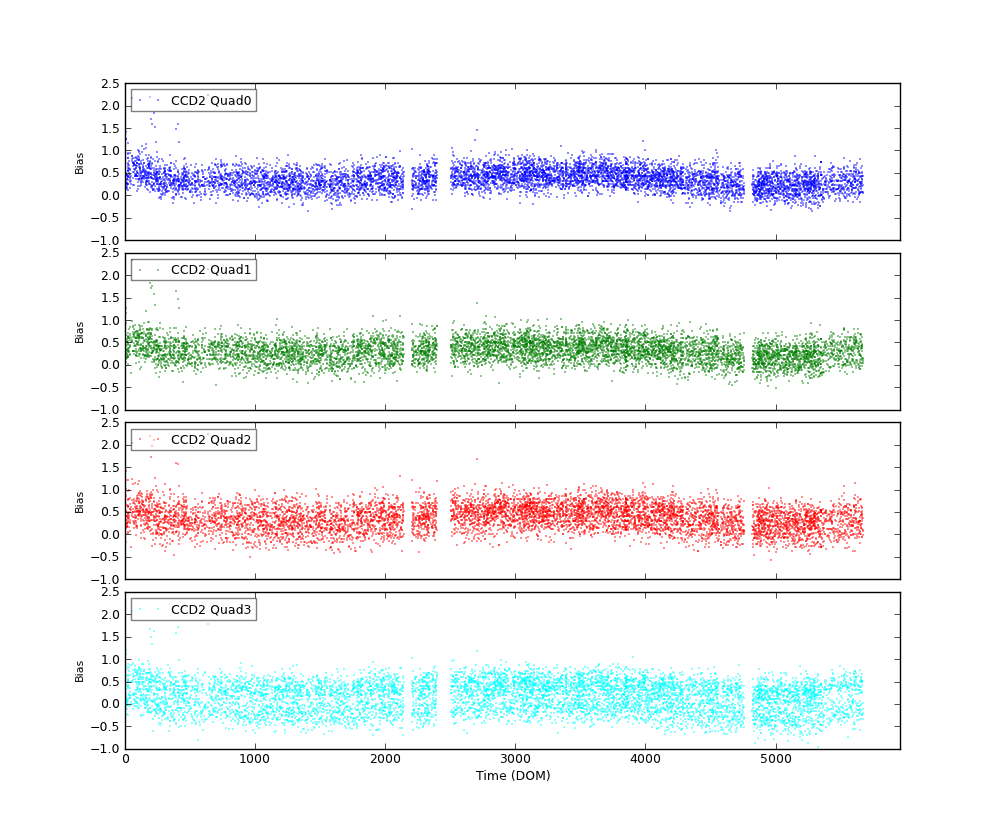
ACIS Bias Trends
The bias plus overclock level was calculated as follows:
- Get acisf*bias0.fits is obtained from a database or /dsops/ap/sdp/cache/*/acis/
- Data with timed mode exposure is selected.
- Fits files were divided into 4 quads, then an average of bias level for each quad is computed. No corrections for dead spots, columns etc were included.
An example of Overclock values as reported in FITS file header:

An example of mean bias minus overclock value:
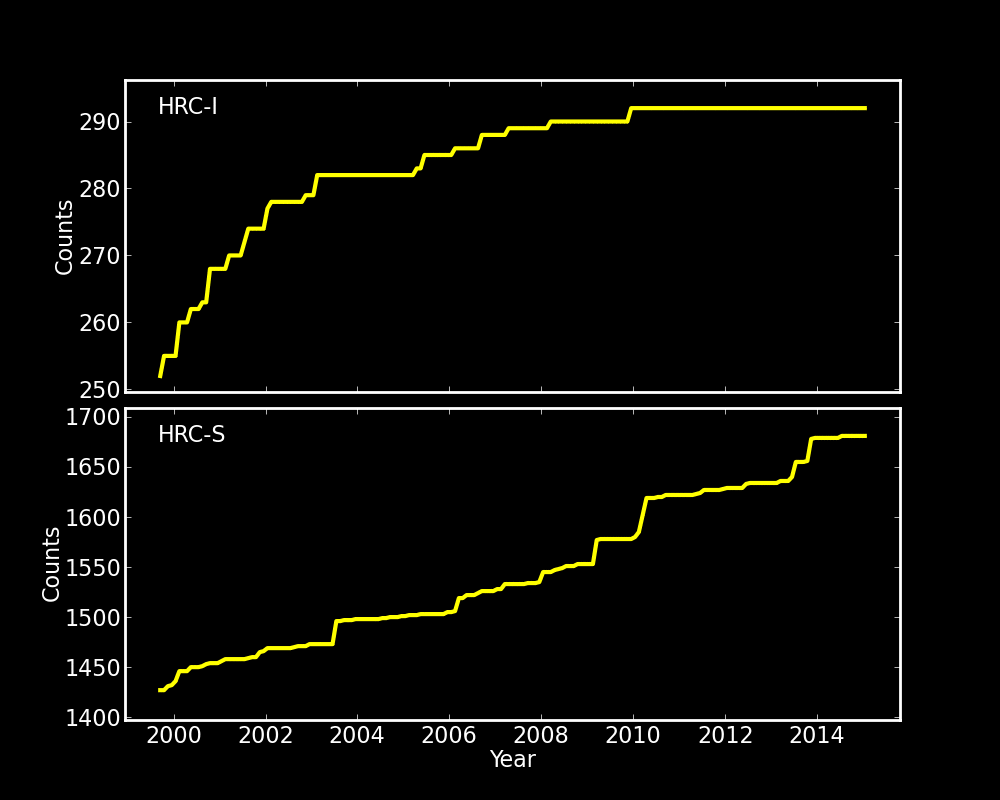
HRC
DOSE of Central 4K Pore-Pairs
Please refer to Maximum Dose Trends for more details.
No Data
)
        IMAGE                NPIX      MEAN    STDDEV      MIN       MAX
HRCI_08_1999_01_2015.fits  16777216   4.304    4.895       0.0       292.0
No Data
)
        IMAGE                NPIX     MEAN      STDDEV      MIN      MAX
HRCS_08_1999_01_2015.fits  16777216  15.588     27.267      0.0      1681.0
|
|
Max dose trend plots corrected for events that "pile-up"
in the center of the taps due to bad position information.
|
)
|
)
|
)
|
)
|
| Oct 2015 | Jul 2014 | Apr 2014 | Jan 2014 |
|---|
)
|
)
|
)
|
)
|
| Oct 2014 | Jul 2014 | Apr 2014 | Jan 2014 |
|---|
HRMA Focus
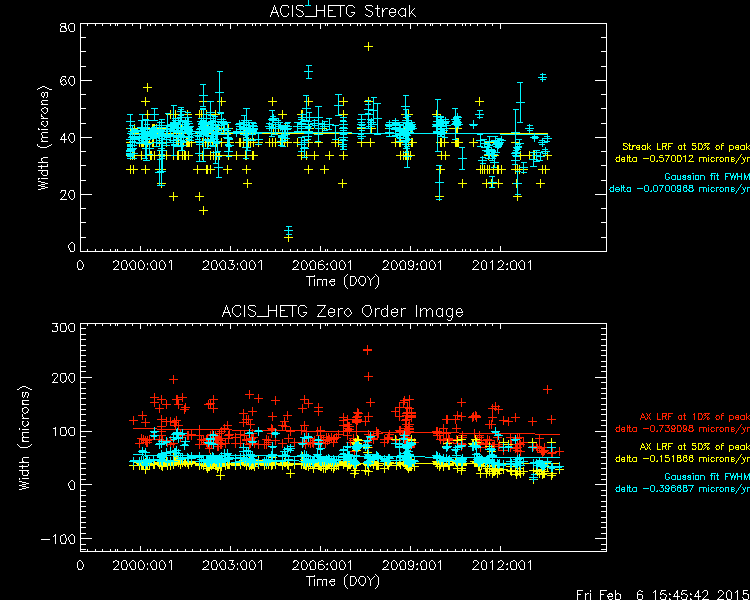
ACIS HETG
PCAD
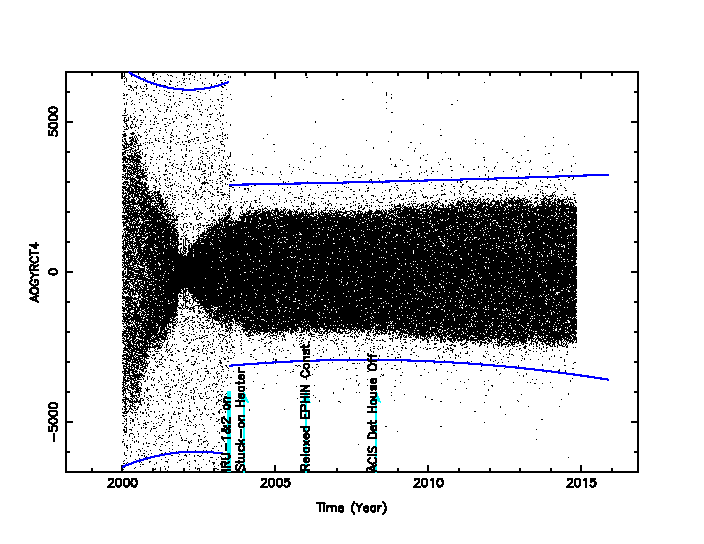
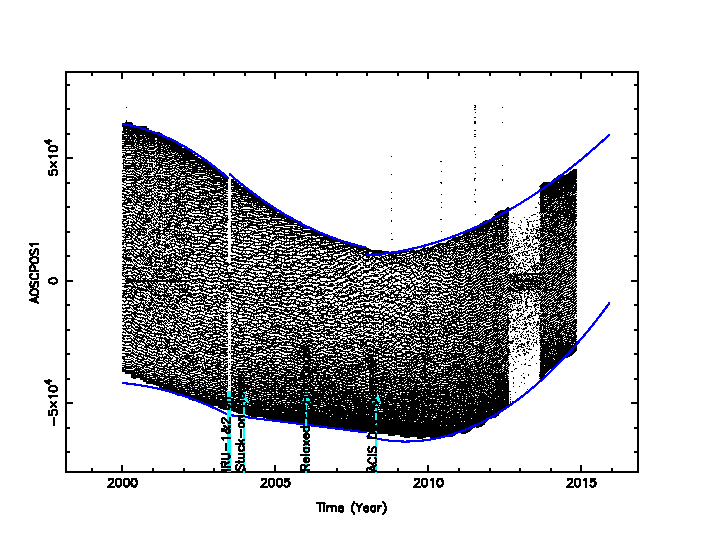
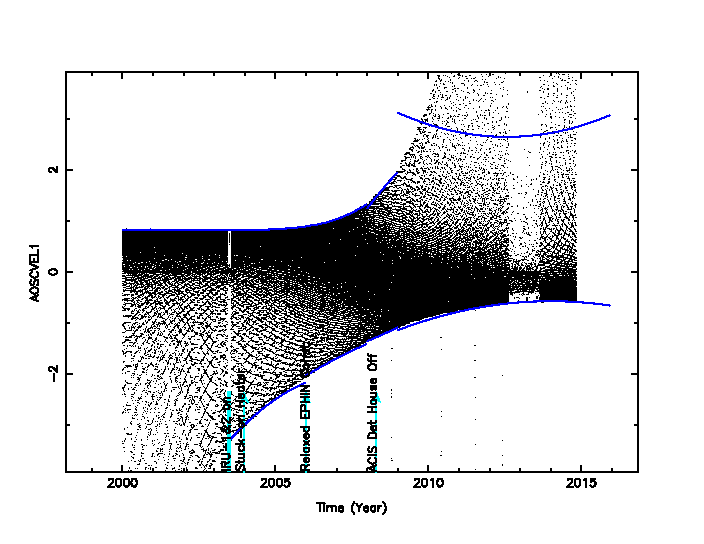
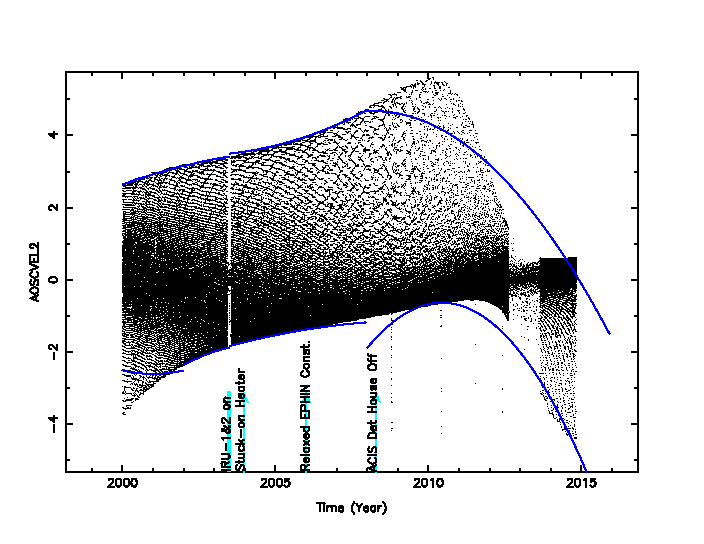
ACA Trending
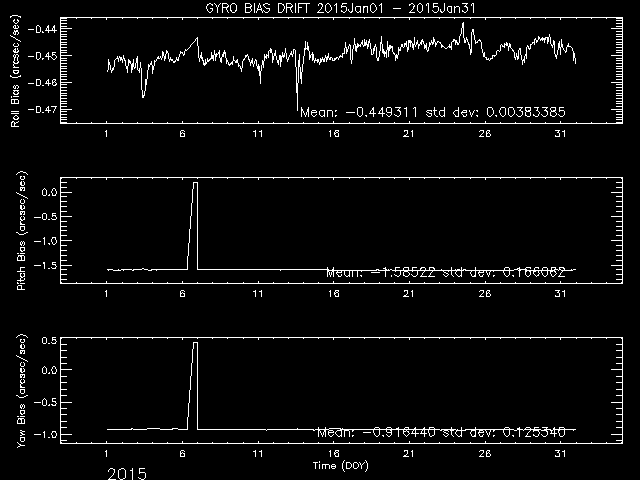
Gyro Bias Drift
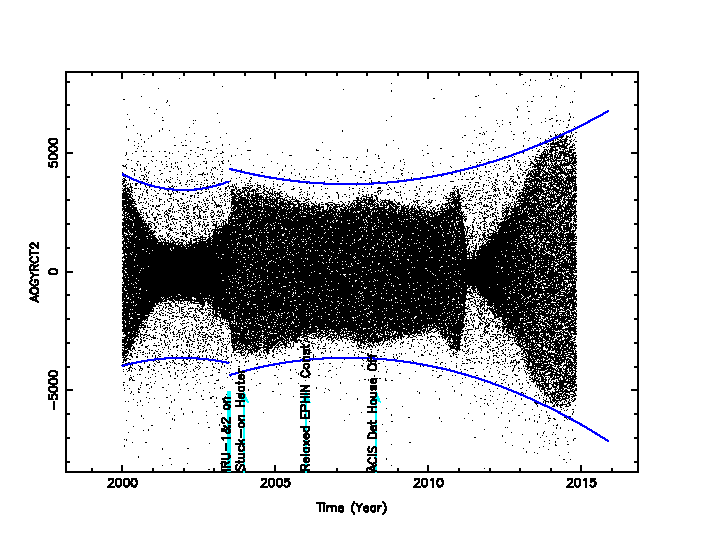
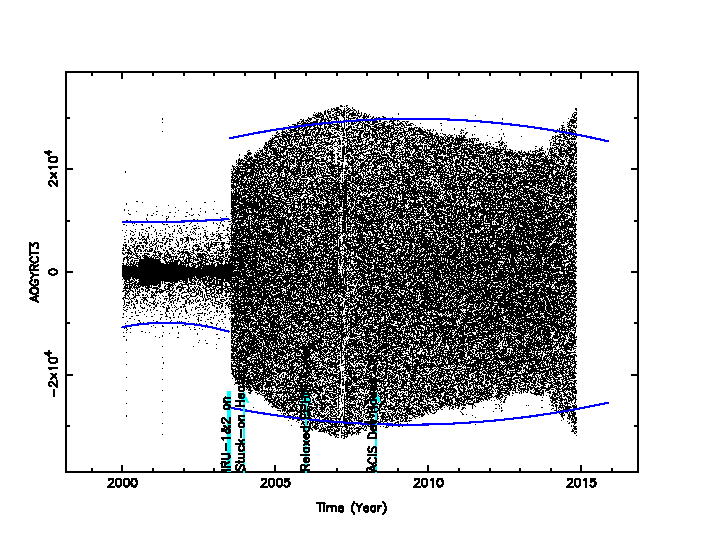
Radiation History
Radiation Zone Timing
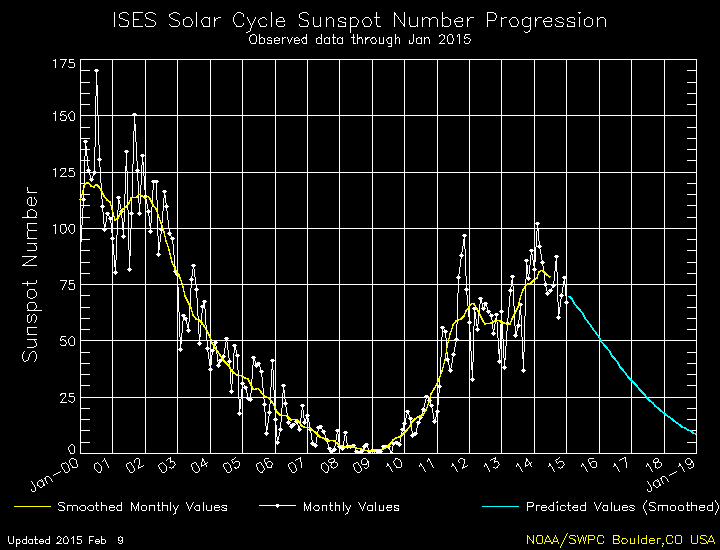
Sun Spot History
Trending
Quarterly Trends
- Spacecraft Electronics
| Previous Quarter | ||||||
| MSID | MEAN | RMS | DELTA/YR | DELTA/YR/YR | UNITS | DESCRIPTION |
| AWD1TQI | -0.17 | 4.198e-02 | -7.307e-02 | -6.066e-01 | AMP | WHEEL 1 TORQUE CURRENT |
| AWD4TQI | 0.12 | 4.390e-02 | -4.141e-02 | 1.031e+00 | AMP | WHEEL 4 TORQUE CURRENT |
| AWD5CV5V | 5.32 | 0.000e+00 | 0.000e+00 | 0.000e+00 | V | WDE-5 +5V CONVERTER VOLTAGE |
| AWD5TQI | -0.15 | 4.354e-02 | 2.423e-02 | 8.712e-01 | AMP | WHEEL 5 TORQUE CURRENT |
| ELBI | 56.33 | 1.29 | -3.479e-01 | 8.751e+00 | AMP | LOAD BUS CURRENT |
| ELBV | 28.34 | 0.12 | -7.922e-01 | 9.320e+00 | V | LOAD BUS VOLTAGE |
| OHRMAPWR | 52.99 | 2.15 | -3.583e+00 | 5.413e+01 | W | HRMA COMPUTED TOTAL POWER |
| OOBAPWR | 47.57 | 2.46 | 1.291e+00 | 5.737e+01 | W | OBA COMPUTED TOTAL POWER |
)
)
)
)
)
)
)
)
- Spacecraft Electronics Side A
| Previous Quarter | ||||||
| MSID | MEAN | RMS | DELTA/YR | DELTA/YR/YR | UNITS | DESCRIPTION |
| CPCA15V | 15.42 | 1.026e-02 | -1.366e-02 | -1.353e-01 | V | +15V RCTU_PC A |
| CPCA5V | 5.24 | 1.185e-03 | -2.371e-03 | -1.874e-02 | V | +5V RCTU_PC A |
| CRXAV | 4.04 | 2.595e-03 | -3.175e-03 | 1.832e-02 | V | RECEIVER A SECONDARY VOLTAGE |
| CTUA5V | 5.21 | 1.141e-02 | 4.425e-02 | 1.064e+00 | V | +5V CTU A |
| CUSOA28V | 24.49 | 2.068e-02 | 1.236e-01 | 2.239e-01 | V | +28V USO A |
)
)
)
)
)
Envelope Trending
PCAD Grad Drift
PCAD Grad Rate
Spacecraft Motions
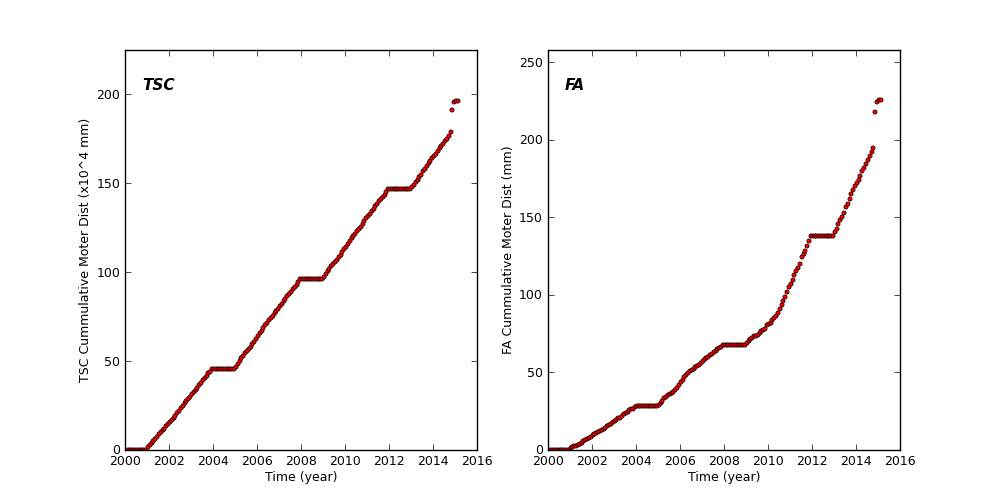
TSC and FA Cummulative Moter Distance
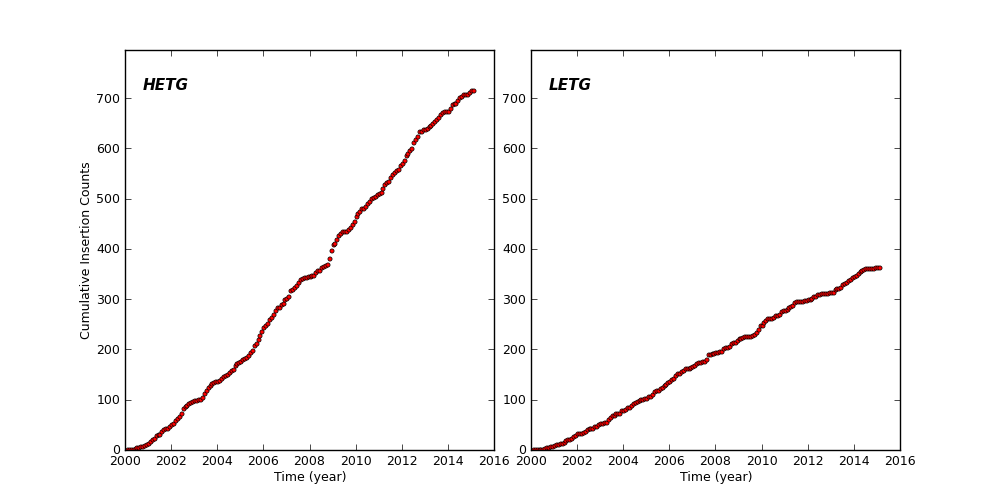
HETG and LETG Cummulative Insertion Counts
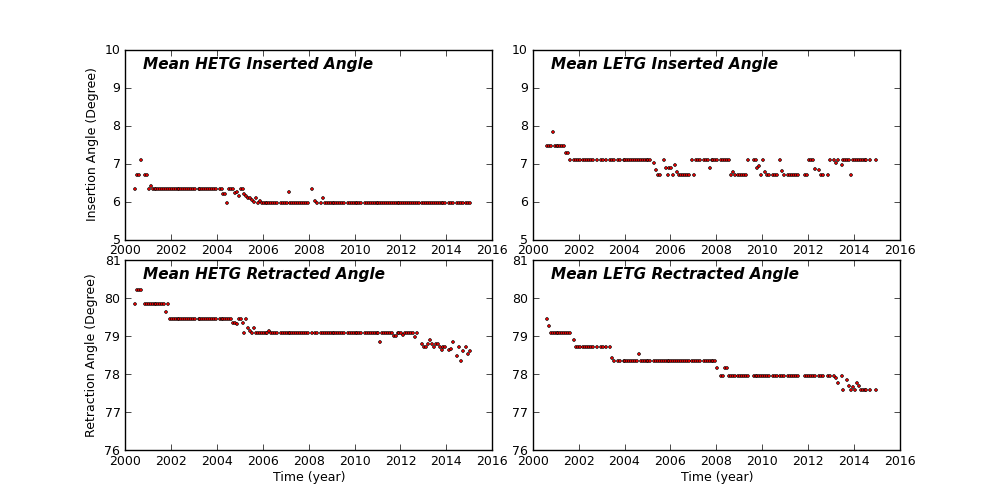
HETG/LETG Insertion/Retraction Angle
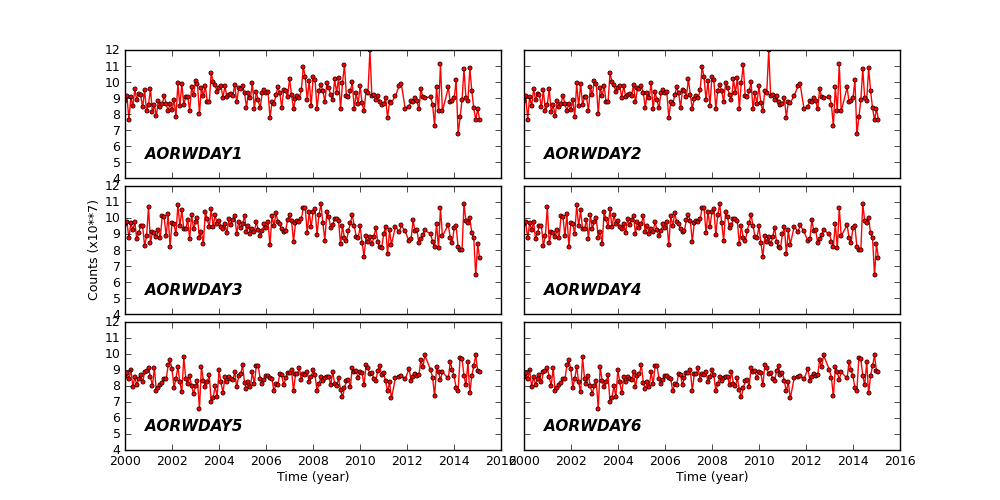
Reaction Wheel Rotations
Links to Past Monthly Reports
| Year | Month | |||||||||||
|---|---|---|---|---|---|---|---|---|---|---|---|---|
| 1999 | Jul | Aug | Sep | Oct | Nov | Dec | ||||||
| 2000 | Jan | Feb | Mar | Apr | May | Jun | Jul | Aug | Sep | Oct | Nov | Dec |
| 2001 | Jan | Feb | Mar | Apr | May | Jun | Jul | Aug | Sep | Oct | Nov | Dec |
| 2002 | Jan | Feb | Mar | Apr | May | Jun | Jul | Aug | Sep | Oct | Nov | Dec |
| 2003 | Jan | Feb | Mar | Apr | May | Jun | Jul | Aug | Sep | Oct | Nov | Dec |
| 2004 | Jan | Feb | Mar | Apr | May | Jun | Jul | Aug | Sep | Oct | Nov | Dec |
| 2005 | Jan | Feb | Mar | Apr | May | Jun | Jul | Aug | Sep | Oct | Nov | Dec |
| 2006 | Jan | Feb | Mar | Apr | May | Jun | Jul | Aug | Sep | Oct | Nov | Dec |
| 2007 | Jan | Feb | Mar | Apr | May | Jun | Jul | Aug | Sep | Oct | Nov | Dec |
| 2008 | Jan | Feb | Mar | Apr | May | Jun | Jul | Aug | Sep | Oct | Nov | Dec |
| 2009 | Jan | Feb | Mar | Apr | May | Jun | Jul | Aug | Sep | Oct | Nov | Dec |
| 2010 | Jan | Feb | Mar | Apr | May | Jun | Jul | Aug | Sep | Oct | Nov | Dec |
| 2011 | Jan | Feb | Mar | Apr | May | Jun | Jul | Aug | Sep | Oct | Nov | Dec |
| 2012 | Jan | Feb | Mar | Apr | May | Jun | Jul | Aug | Sep | Oct | Nov | Dec |
| 2013 | Jan | Feb | Mar | Apr | May | Jun | Jul | Aug | Sep | Oct | Nov | Dec |
| 2014 | Jan | Feb | Mar | Apr | May | Jun | Jul | Aug | Sep | Oct | Nov | Dec |