ACIS
ACIS DOSE Registered-Photon-Map
The steps we took to compute the dose map are;
- Level 1 Event files for a specified month are obtained from archive.
- Image data including I2, I3, S2, S3 CCDs are extracted from all event files.
- All the extracted image data were merged to create a month long exposure map for the month.
- The exposure map is opened with ds9, and check a distribution of count rates against energy. From this, estimate the upper threshold value. Any events beyond this upper threshold are assumed erroneous events such as bad pixels.
- Using this upper threshold, the data is filtered, and create a cleaned exposure map for the month.
- The exposure map from each month from the Sep 1999 is added up to create a cumulative exposure map for each month.
- Using fimgstatistic, we compute count rate statistics for each CCDs.
- For observations with high data drop rates (e.g., Crab nebula, Cas A), we corrected the observations by adding events.
Please check more detail plots at Telemetered Photon Dose Trend page.
)
)
)
Statistics:
# IMAGE     NPIX     MEAN        RMS        MIN     MAX
ACIS_feb15 6004901   8.186       13.033     0.0     1861


I2 node 0  262654   7.185688     3.188100   0.0   62.0
I2 node 1  262654   7.480994     3.561504   0.0  502.0
I2 node 2  262654   7.360120     3.223152   0.0   63.0
I2 node 3  262654   7.352103     5.576301   0.0 1513.0

I3 node 0  262654   7.828798     3.650450   0.0   55.0
I3 node 1  262654   8.078702     7.929561   0.0 1861.0
I3 node 2  262654   7.296066     3.187932   0.0   81.0
I3 node 3  262654   7.315676     3.248323   0.0   91.0

S2 node 0  262654   9.725245     6.843284   0.0   98.0
S2 node 1  262654   10.286026    6.005104   0.0   87.0
S2 node 2  262654   14.007525   10.478198   0.0 1270.0
S2 node 3  262654   16.881576   11.255541   0.0  409.0

S3 node 0  262654   13.379515   13.996296   0.0  351.0
S3 node 1  262654   15.839115   13.504099   0.0  244.0
S3 node 2  262654   18.785769   19.692259   0.0  283.0
S3 node 3  262654   15.906540   25.098970   0.0  343.0
)
)
)
Statistics:
 IMAGE     NPIX      MEAN        RMS        MIN      MAX
ACIS_total 6004901   1864.979    2445.779   0.0     108038


I2 node 0  262654   1566.331275  299.935269   293.0   9086.0
I2 node 1  262654   1651.172091  413.906427   326.0  38041.0
I2 node 2  262654   1681.196440  351.551578   326.0   9207.0
I2 node 3  262654   1679.114159  422.970066   310.0  28020.0

I3 node 0  262654   1764.342361  420.170842   308.0   6924.0
I3 node 1  262654   1851.806140 1402.453051   313.0  35468.0
I3 node 2  262654   1618.484150  290.527392   299.0   8312.0
I3 node 3  262654   1604.195454  311.086065   284.0  27230.0

S2 node 0  262654   2183.872855  316.843158  1155.0  21225.0
S2 node 1  262654   2323.565671  508.059917  1217.0  12860.0
S2 node 2  262654   2562.227562  485.020076  1540.0  19358.0
S2 node 3  262654   2487.315999  345.879403  1447.0  42378.0

S3 node 0  262654   3881.613940 1797.793241  1595.0  13564.0
S3 node 1  262654   5054.983680 2079.934231     0.0  14039.0
S3 node 2  262654   3860.056392  985.810965  1584.0   9377.0
S3 node 3  262654   2995.327708  452.030222  1713.0  10356.0
)
|
)
|
)
|
)
|
| Nov 2014 | Aug 2014 | May 2014 | Feb 2014 |
|---|
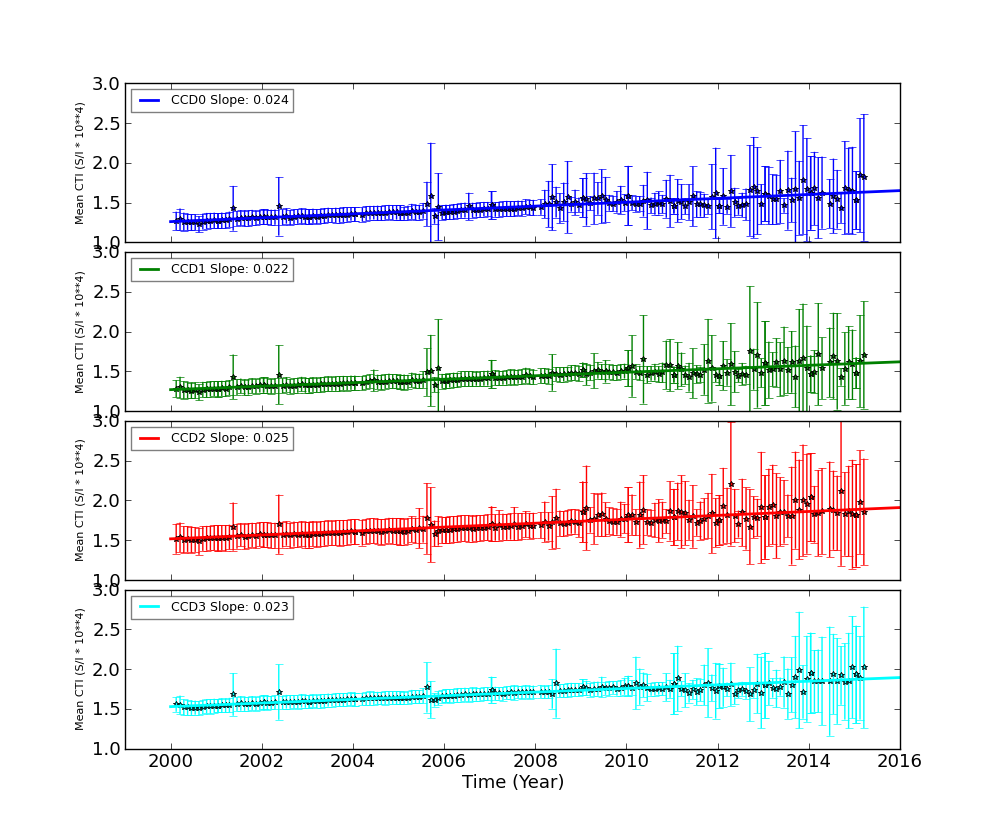
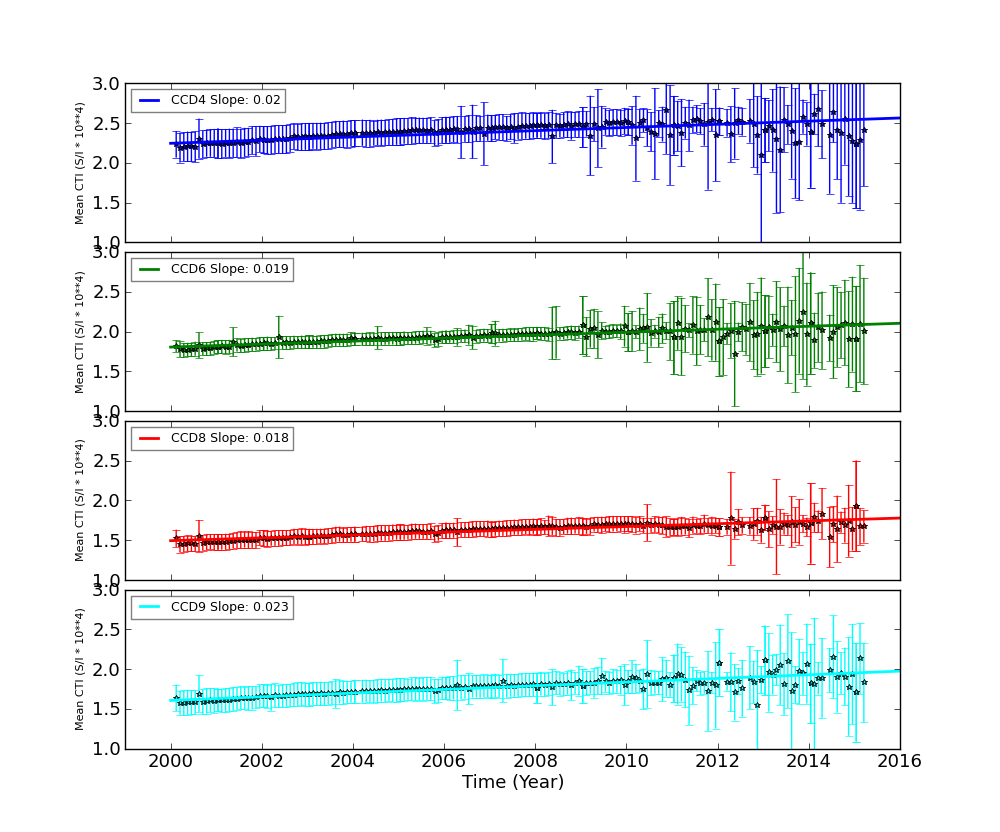
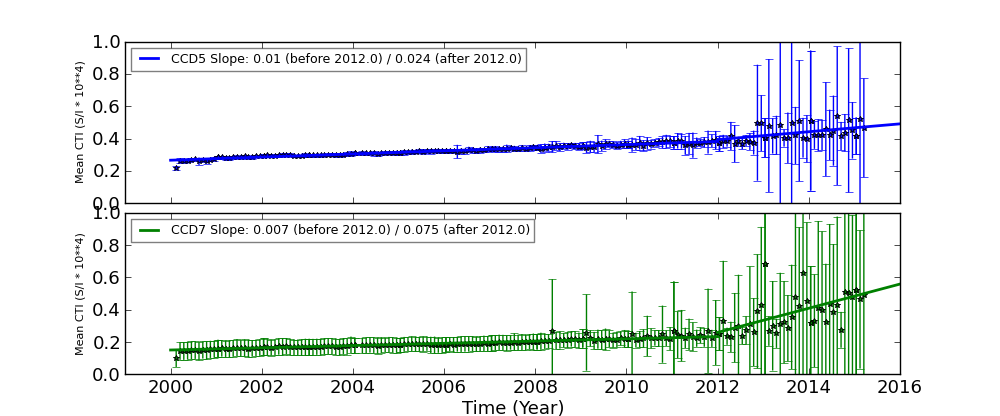
The Mean Detrended CTI
We report CTIs with a refined data definition. CTIs were computed for the temperature dependency corrected data. Please see CTI page for detailed explanation. CTI's are computed for Mn K alpha, and defined as slope/intercept x10^4 of row # vs ADU. Data file: here
Imaging CCDs
Spectral CCDs
Backside CCDs
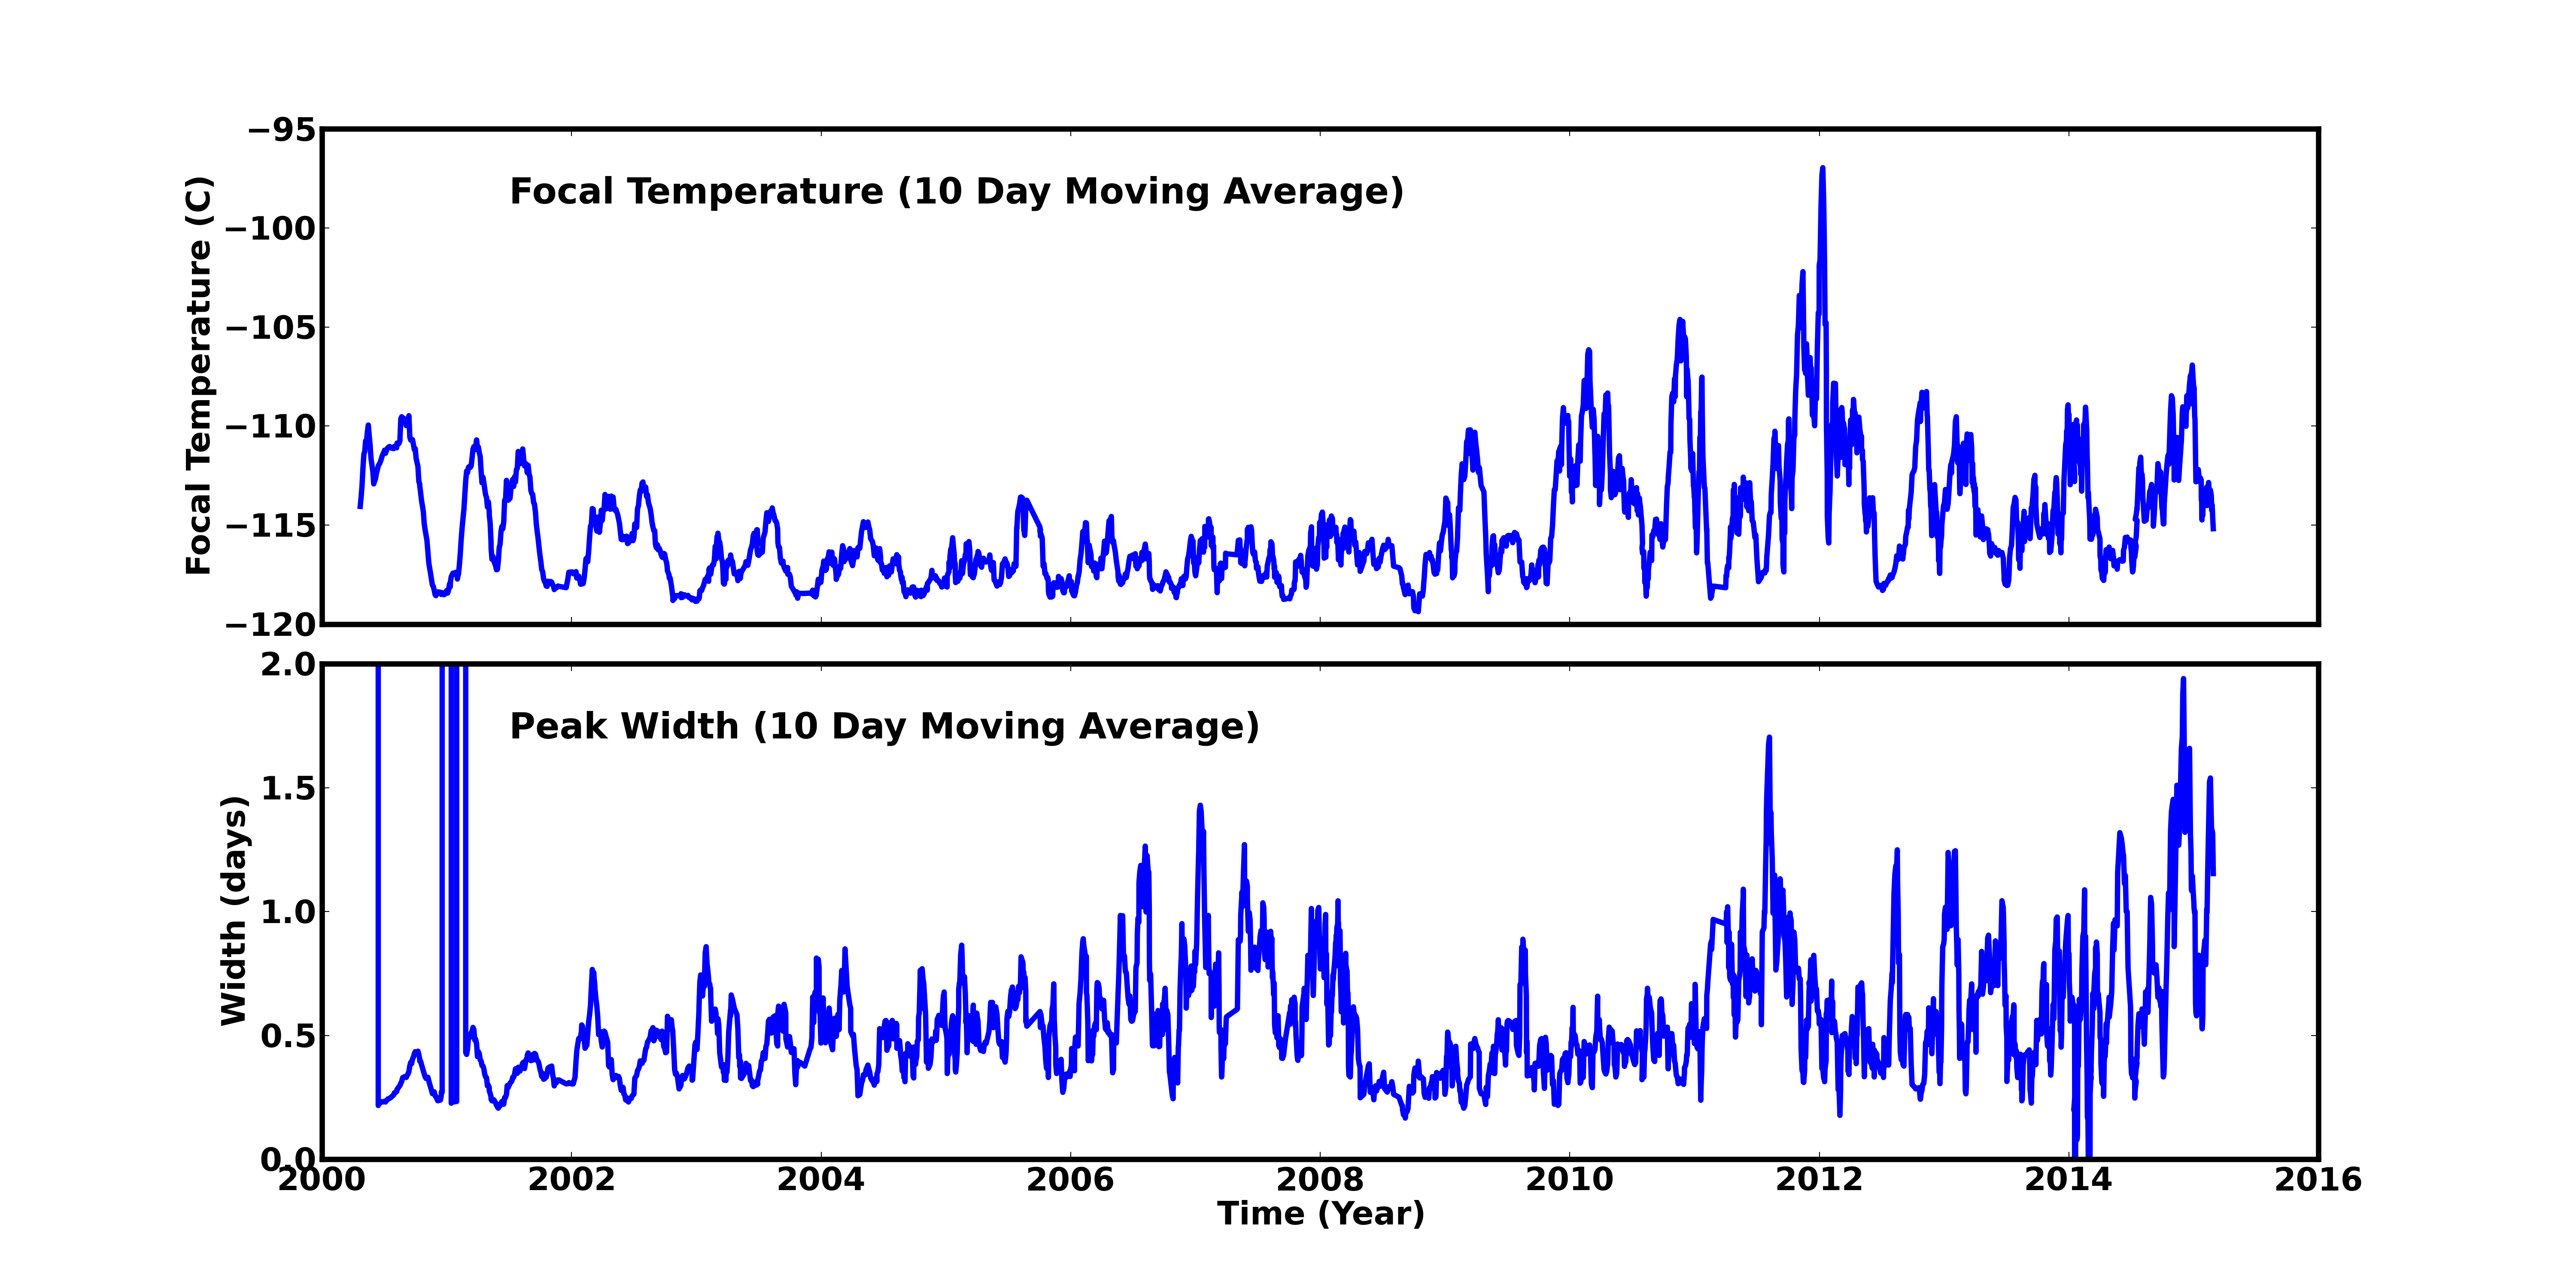
Focal Plane Temperature
Feb 2015 Focal Temperature
| The Mean (max) FPT: | |
|---|---|
| -114.45 | +/- 2.73 C |
| Mean Width: | |
| 1.15 | +/- 0.76 days |
Averaged Focal Plane Temperature
We are using 10 period moving averages to show trends of peak temperatures and peak widths. Note, the gaps in the width plot are due to missing/corrupted data.
Focal Plane Temperature, Sun Angle and Altitude
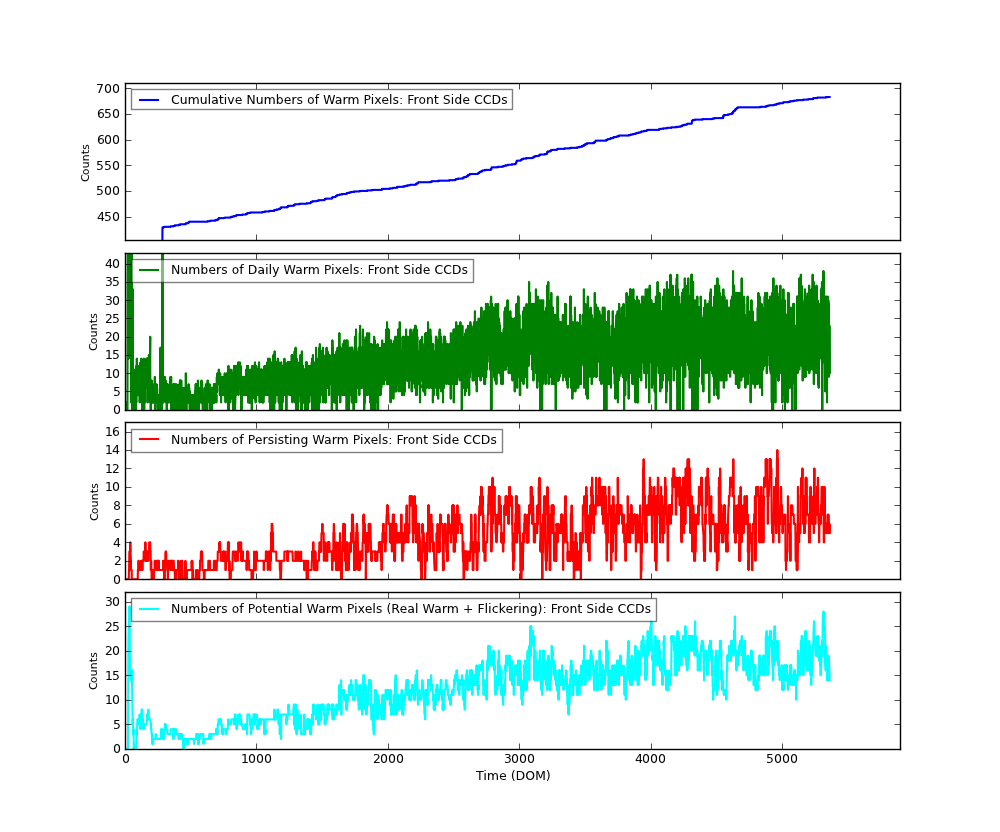
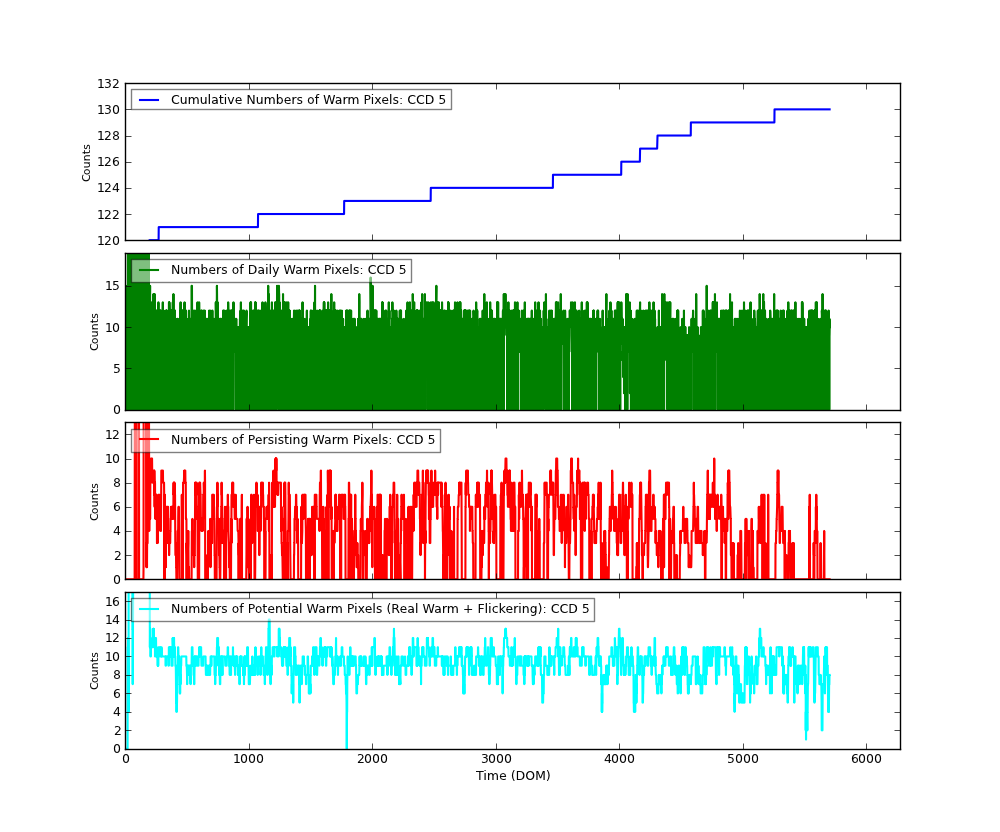
Bad Pixels
The plots below were generated with a new warm pixel finding script. Please see Acis Bad Pixel Page for details.
Front Side CCDs
Back Side CCD (CCD5)
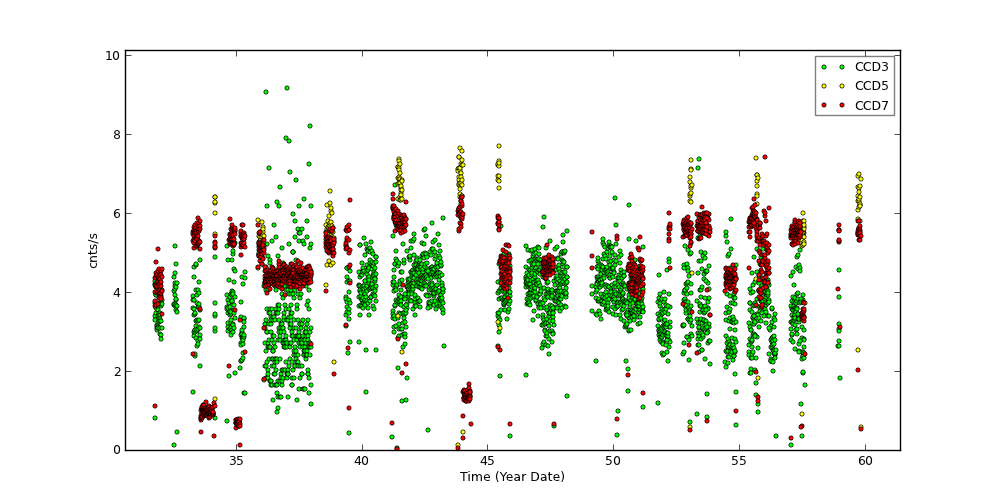
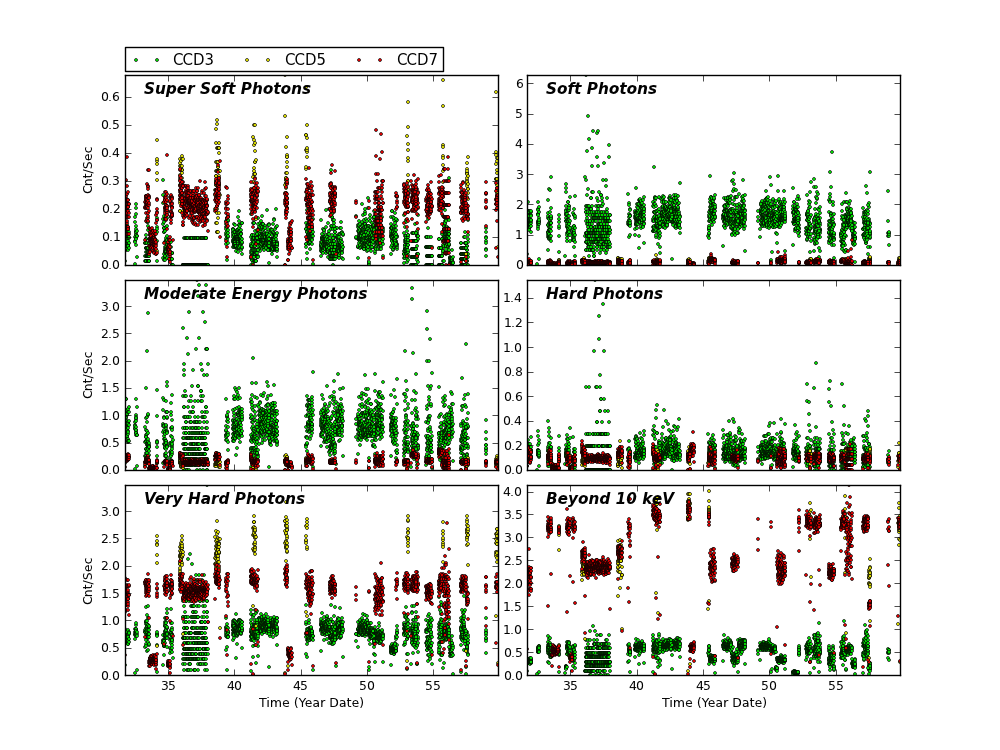
Science Instrument Background Rates
| Name | Low (keV) | High(KeV) | Description |
|---|---|---|---|
| SSoft | 0.00 | 0.50 | Super soft photons |
| Soft | 0.50 | 1.00 | Soft photons |
| Med | 1.00 | 3.00 | Moderate energy photons |
| Hard | 3.00 | 5.00 | Hard Photons |
| Harder | 5.00 | 10.00 | Very Hard photons |
| Hardest | 10.00 | Beyond 10 keV |
HRC
DOSE of Central 4K Pore-Pairs
Please refer to Maximum Dose Trends for more details.
)
|
|---|
         IMAGE                NPIX      MEAN    STDDEV      MIN       MAX
HRCI_02_2015.fits          16777216   0.005    0.0674      0.0       2.0
)
        IMAGE                NPIX      MEAN    STDDEV      MIN       MAX
HRCI_08_1999_02_2015.fits  16777216   4.309    4.896       0.0       292.0
No Data
)
        IMAGE                NPIX     MEAN      STDDEV      MIN      MAX
HRCS_08_1999_02_2015.fits  16777216  15.588     27.267      0.0      1681.0
|
|
Max dose trend plots corrected for events that "pile-up"
in the center of the taps due to bad position information.
|
)
|
)
|
)
|
)
|
| Feb 2015 | Aug 2014 | May 2014 | Feb 2014 |
|---|
)
|
)
|
)
|
)
|
| Nov 2014 | Aug 2014 | May 2014 | Feb 2014 |
|---|
HRMA Focus
Plots below show various characteristics of detected imaging sources. Standard level 2 data products (*src2.fits) are used. Only observations with focus (sim_x) within 0.01 mm of nominal value for given SI configuration are used. Sources are also filtered for strength (SNR > 15).
For individual detectors, please go to MTA SRC2 Monitoring page.
Source Sky Position
PSF vs Time
Source Ellipse Roundness
80% Encircled Energy Radius
Signal-to-Noise Ratio
Rotation
)
)
)
|
)
|
)
|
)
|
)
|
)
|
)
|
)
|
Gratings
Focus
We plot the width of the zero order streak of ACIS/HETG observations and the width of the zero order image for HRC/LETG observations of point sources. No significant defocusing trend is seen at this time. See Gratings Focus pages.
PCAD
ACA Trending
Gyro Bias Drift
ACIS-S and HRC Celestial Location Monitoring
Science Instrument Positional Change Monitoring
The following plots are the difference between coordinates obtained from Chandra observations and those obtained from existing catalogs vs time in day of mission.
The following steps are taken to generate these plots.
- all observations with grating are selected
- even if the observation is not grating one, if it is a known point source, it is added to the list.
- observed ra, jan, target ra, jan, nominal ra, jan and a ratio of a target elliptical to psf (psfratio are extracted from src fits files.
- the observations with psfratio smaller than 4 are selected
- the differences between observed coordinates and targeted coordinates (if not available nominal coordinates) are computed
- if the differences are larger than 6 arcsec, the points are dropped
The large dispersion around DOM ~ 2400 (Jan 2005) are all due to none grating Capella observations. Many observations are off-axis observations (e.g., obsid 6558).
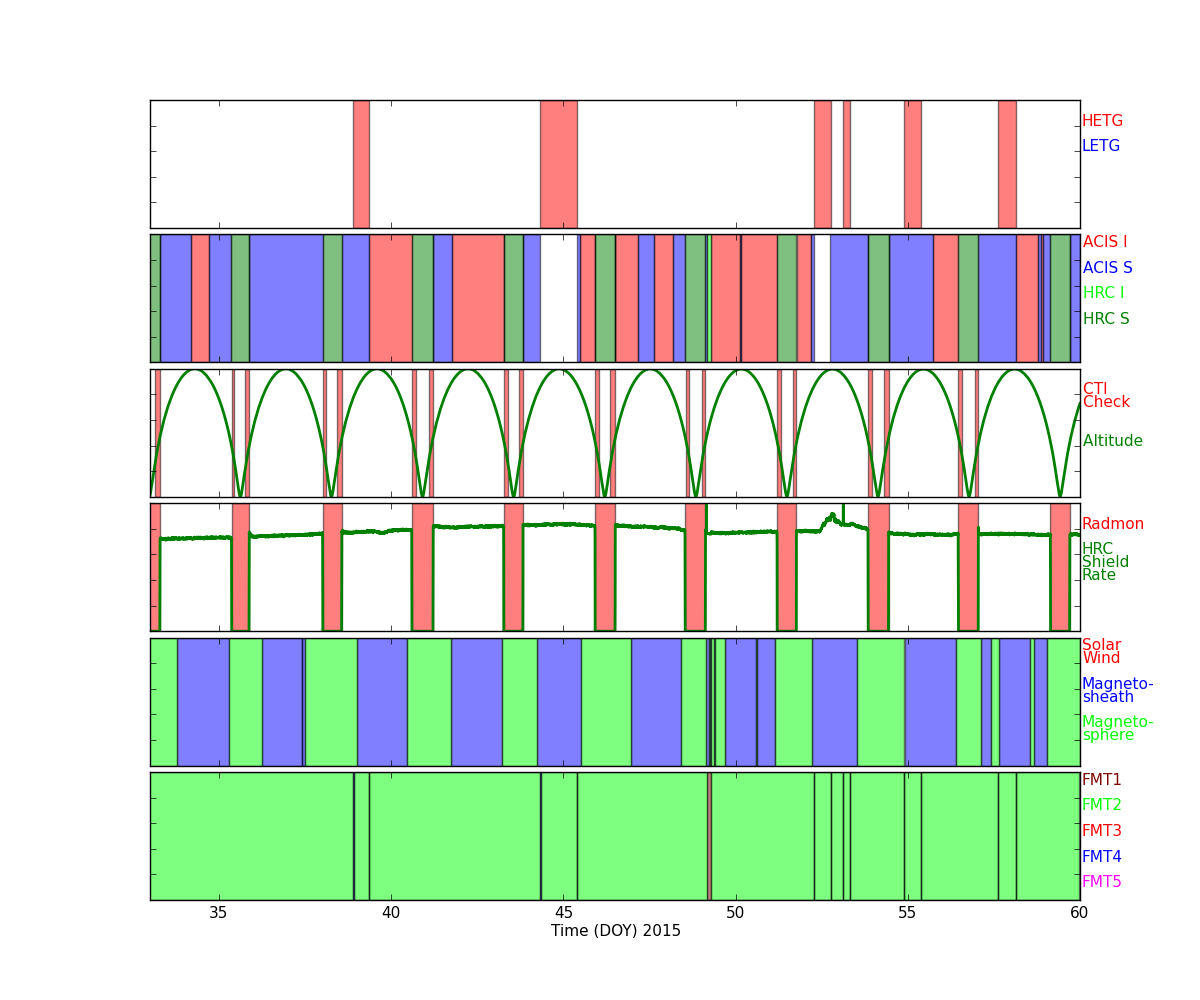
Radiation History
Radiation Zone Timing
Plotted below are radiation zone timing plots based on the following definitions of radiation zone:
- RADZONE - Ephin levels (in any of the E1300,P4GM,P41GM channels) are more than 1/3 of RADMON safing thresholds.
- RADMON - Radmon is disabled for radiation zone (as commanded based on OFLS model, for comparison with actual radiation levels).
- PERIGEE - Time of closest earth approach (for comparison)
Radiation Count Rates of Feb 2015
Sun Spot History
Trending
Quarterly Trends
- OBA Heaters
| Previous Quarter | ||||||
| MSID | MEAN | RMS | DELTA/YR | DELTA/YR/YR | UNITS | DESCRIPTION |
| OOBTHR04 | 294.97 | 0.90 | 1.648e+00 | -2.071e+01 | K | RT 27: HRMA STRUT |
| OOBTHR08 | 292.48 | 3.10 | 1.391e+01 | 6.307e+02 | K | RT 31: OBA CONE |
| OOBTHR14 | 290.41 | 2.45 | 1.107e+01 | 4.831e+02 | K | RT 37: OBA CONE |
| OOBTHR22 | 291.35 | 2.95 | 1.180e+01 | 5.358e+02 | K | RT 44: OBA CONE |
| OOBTHR40 | 288.46 | 1.77 | 8.437e+00 | 3.534e+02 | K | RT 62: TFTE CONE |
| OOBTHR59 | 295.56 | 1.39 | 1.778e+00 | -2.152e+01 | K | RT 152: OBA CONE |
)
)
)
)
)
)
- HRMA Heaters
| Previous Quarter | ||||||
| MSID | MEAN | RMS | DELTA/YR | DELTA/YR/YR | UNITS | DESCRIPTION |
| OHRTHR02 | 295.30 | 2.917e-03 | -9.632e-03 | 6.374e-02 | K | RT 2: HRMA FORWARD APERTURE PLATE |
| OHRTHR19 | 294.58 | 1.332e-02 | 2.353e-02 | 5.781e-02 | K | RT 132: HRMA AFT HEATER PLATE |
| OHRTHR44 | 295.29 | 7.815e-03 | -3.082e-02 | -1.025e-02 | K | RT 1: HRMA FORWARD APERTURE PLATE |
| OHRTHR59 | 295.30 | 4.270e-03 | -2.700e-03 | 6.340e-02 | K | RT 119: HRMA PRECOLLIMATOR PLATE 10 |
)
)
)
)
Envelope Trending
PCAD Temperature


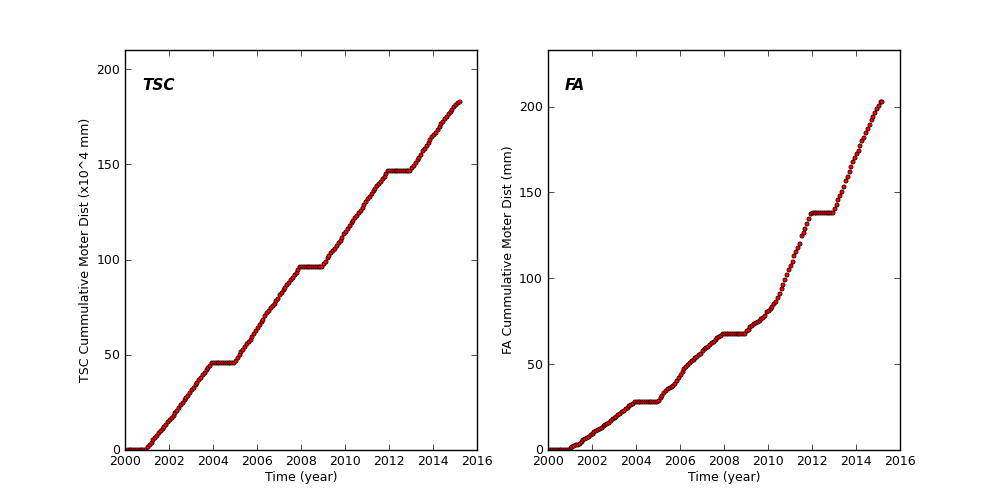
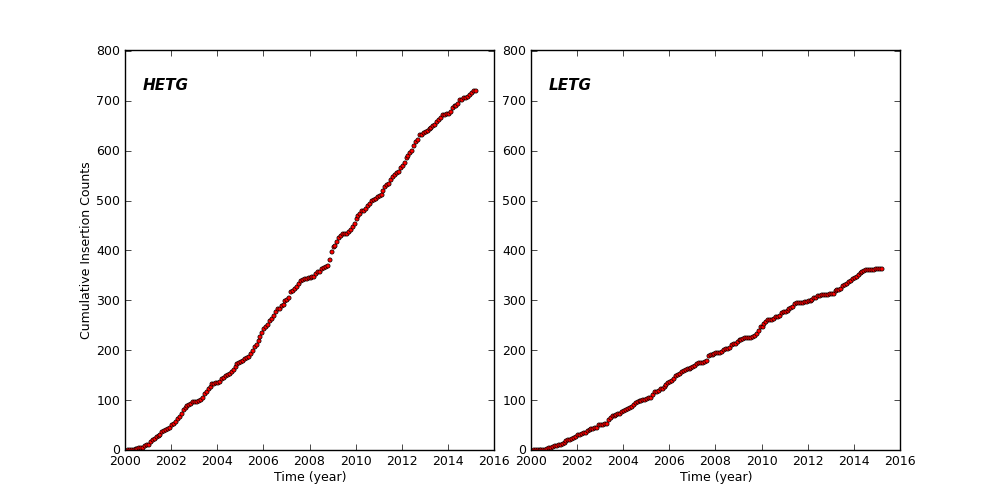
Spacecraft Motions
TSC and FA Cummulative Moter Distance
HETG and LETG Cummulative Insertion Counts
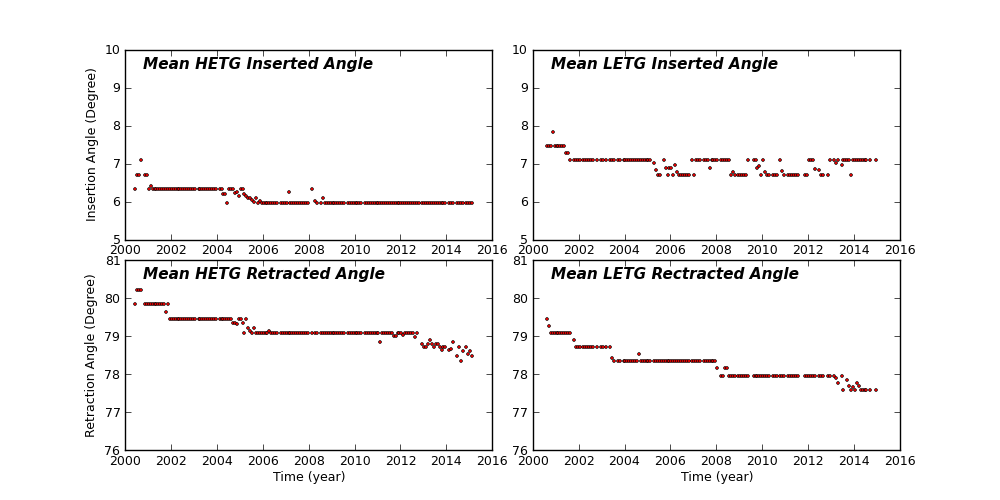
HETG/LETG Insertion/Retraction Angle
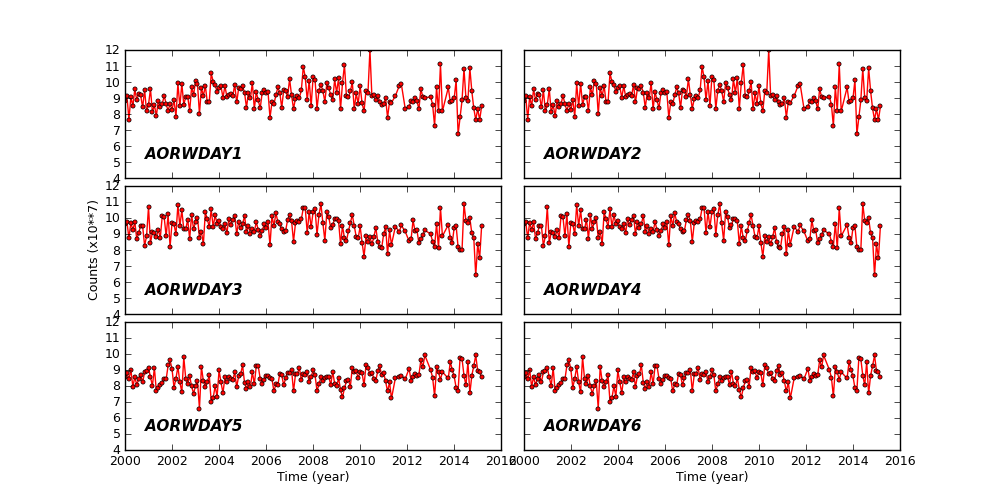
Reaction Wheel Rotations
Links to Past Monthly Reports
| Year | Month | |||||||||||
|---|---|---|---|---|---|---|---|---|---|---|---|---|
| 2015 | Jan | |||||||||||
| 2014 | Jan | Feb | Mar | Apr | May | Jun | Jul | Aug | Sep | Oct | Nov | Dec |
| 2013 | Jan | Feb | Mar | Apr | May | Jun | Jul | Aug | Sep | Oct | Nov | Dec |
| 2012 | Jan | Feb | Mar | Apr | May | Jun | Jul | Aug | Sep | Oct | Nov | Dec |
| 2011 | Jan | Feb | Mar | Apr | May | Jun | Jul | Aug | Sep | Oct | Nov | Dec |
| 2010 | Jan | Feb | Mar | Apr | May | Jun | Jul | Aug | Sep | Oct | Nov | Dec |
| 2009 | Jan | Feb | Mar | Apr | May | Jun | Jul | Aug | Sep | Oct | Nov | Dec |
| 2008 | Jan | Feb | Mar | Apr | May | Jun | Jul | Aug | Sep | Oct | Nov | Dec |
| 2007 | Jan | Feb | Mar | Apr | May | Jun | Jul | Aug | Sep | Oct | Nov | Dec |
| 2006 | Jan | Feb | Mar | Apr | May | Jun | Jul | Aug | Sep | Oct | Nov | Dec |
| 2005 | Jan | Feb | Mar | Apr | May | Jun | Jul | Aug | Sep | Oct | Nov | Dec |
| 2004 | Jan | Feb | Mar | Apr | May | Jun | Jul | Aug | Sep | Oct | Nov | Dec |
| 2003 | Jan | Feb | Mar | Apr | May | Jun | Jul | Aug | Sep | Oct | Nov | Dec |
| 2002 | Jan | Feb | Mar | Apr | May | Jun | Jul | Aug | Sep | Oct | Nov | Dec |
| 2001 | Jan | Feb | Mar | Apr | May | Jun | Jul | Aug | Sep | Oct | Nov | Dec |
| 2000 | Jan | Feb | Mar | Apr | May | Jun | Jul | Aug | Sep | Oct | Nov | Dec |
| 1999 | Jul | Aug | Sep | Oct | Nov | Dec | ||||||