ACIS
ACIS DOSE Registered-Photon-Map
The steps we took to compute the dose map are;
- Level 1 Event files for a specified month are obtained from archive.
- Image data including I2, I3, S2, S3 CCDs are extracted from all event files.
- All the extracted image data were merged to create a month long exposure map for the month.
- The exposure map is opened with ds9, and check a distribution of count rates against energy. From this, estimate the upper threshold value. Any events beyond this upper threshold are assumed erroneous events such as bad pixels.
- Using this upper threshold, the data is filtered, and create a cleaned exposure map for the month.
- The exposure map from each month from the Sep 1999 is added up to create a cumulative exposure map for each month.
- Using fimgstatistic, we compute count rate statistics for each CCDs.
- For observations with high data drop rates (e.g., Crab nebula, Cas A), we corrected the observations by adding events.
Please check more detail plots at Telemetered Photon Dose Trend page.
)
)
)
Statistics:
# IMAGE     NPIX     MEAN        RMS        MIN     MAX
ACIS_may15 6004901   9.426       17.350     0.0     1622

I2 node 0  262654   8.129460     3.501962    0.0     57.0
I2 node 1  262654   8.592272     4.116625    0.0    823.0
I2 node 2  262654   8.646683     3.843600    0.0     72.0
I2 node 3  262654   8.643595     3.896929    0.0     82.0

I3 node 0  262654   8.619428     3.972842    0.0     62.0
I3 node 1  262654   8.689698     7.942780    0.0    173.0
I3 node 2  262654   7.935561     3.367939    0.0     74.0
I3 node 3  262654   7.897065     3.587679    0.0    479.0

S2 node 0  262654   8.362228     4.511288    0.0   1622.0
S2 node 1  262654   8.709897     3.628653    0.0     50.0
S2 node 2  262654   9.224644     3.627929    0.0     95.0
S2 node 3  262654   9.668604     4.596014    0.0    391.0

S3 node 0  262654   14.963595   17.655129    0.0    138.0
S3 node 1  262654   37.894320   41.882657    0.0    379.0
S3 node 2  262654   35.985800   31.019335    0.0    214.0
S3 node 3  262654   11.551074    8.894275    0.0    125.0
)
)
)
Statistics:
 IMAGE     NPIX      MEAN        RMS        MIN      MAX
ACIS_total 6004901   1893.172    2478.966   0.0     109032


I2 node 0  262654   1588.489149  304.637461  300.0    9116.0
I2 node 1  262654   1675.312964  422.050918  331.0   40142.0
I2 node 2  262654   1709.119752  360.949448  330.0    9245.0
I2 node 3  262654   1706.638753  431.677427  314.0   28066.0

I3 node 0  262654   1793.561376  429.335248  313.0    7011.0
I3 node 1  262654   1883.052035 1422.787205  320.0   35900.0
I3 node 2  262654   1641.854689  296.131313  302.0    8499.0
I3 node 3  262654   1626.825484  315.556816  285.0   27509.0

S2 node 0  262654   2209.064511  320.163435  1173.0  21242.0
S2 node 1  262654   2350.709695  514.067698  1234.0  12986.0
S2 node 2  262654   2595.408674  492.204671  1573.0  19673.0
S2 node 3  262654   2525.463515  354.776459  1484.0  43210.0

S3 node 0  262654   3931.133938 1803.672501  1624.0  13612.0
S3 node 1  262654   5157.733396 2117.353895     0.0  14088.0
S3 node 2  262654   3946.693876 1030.840795  1603.0   9596.0
S3 node 3  262654   3030.817546  464.653454  1737.0  10427.0
)
|
)
|
)
|
)
|
| Feb 2015 | Nov 2014 | Aug 2014 | May 2014 |
|---|
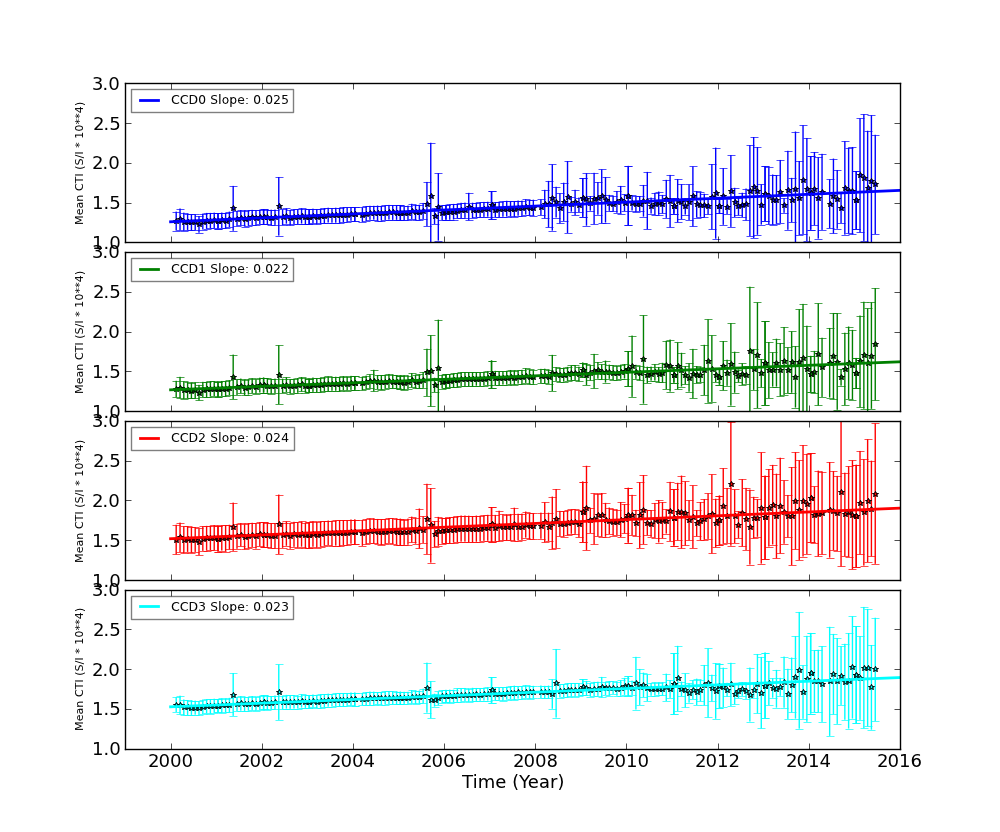
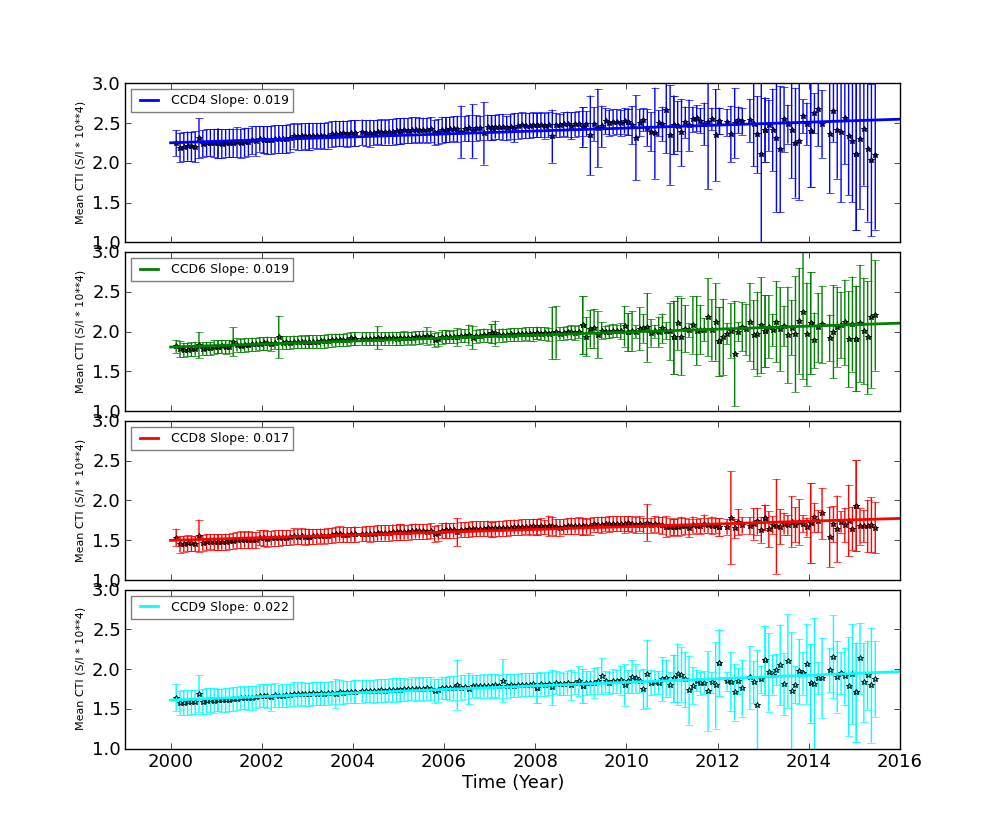
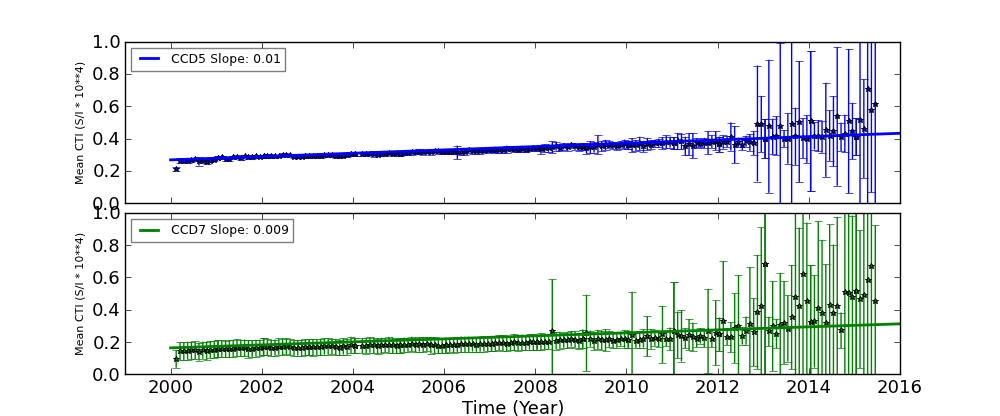
The Mean Detrended CTI
We report CTIs with a refined data definition. CTIs were computed for the temperature dependency corrected data. Please see CTI page for detailed explanation. CTI's are computed for Mn K alpha, and defined as slope/intercept x10^4 of row # vs ADU. Data file: here
Imaging CCDs
Spectral CCDs
Backside CCDs
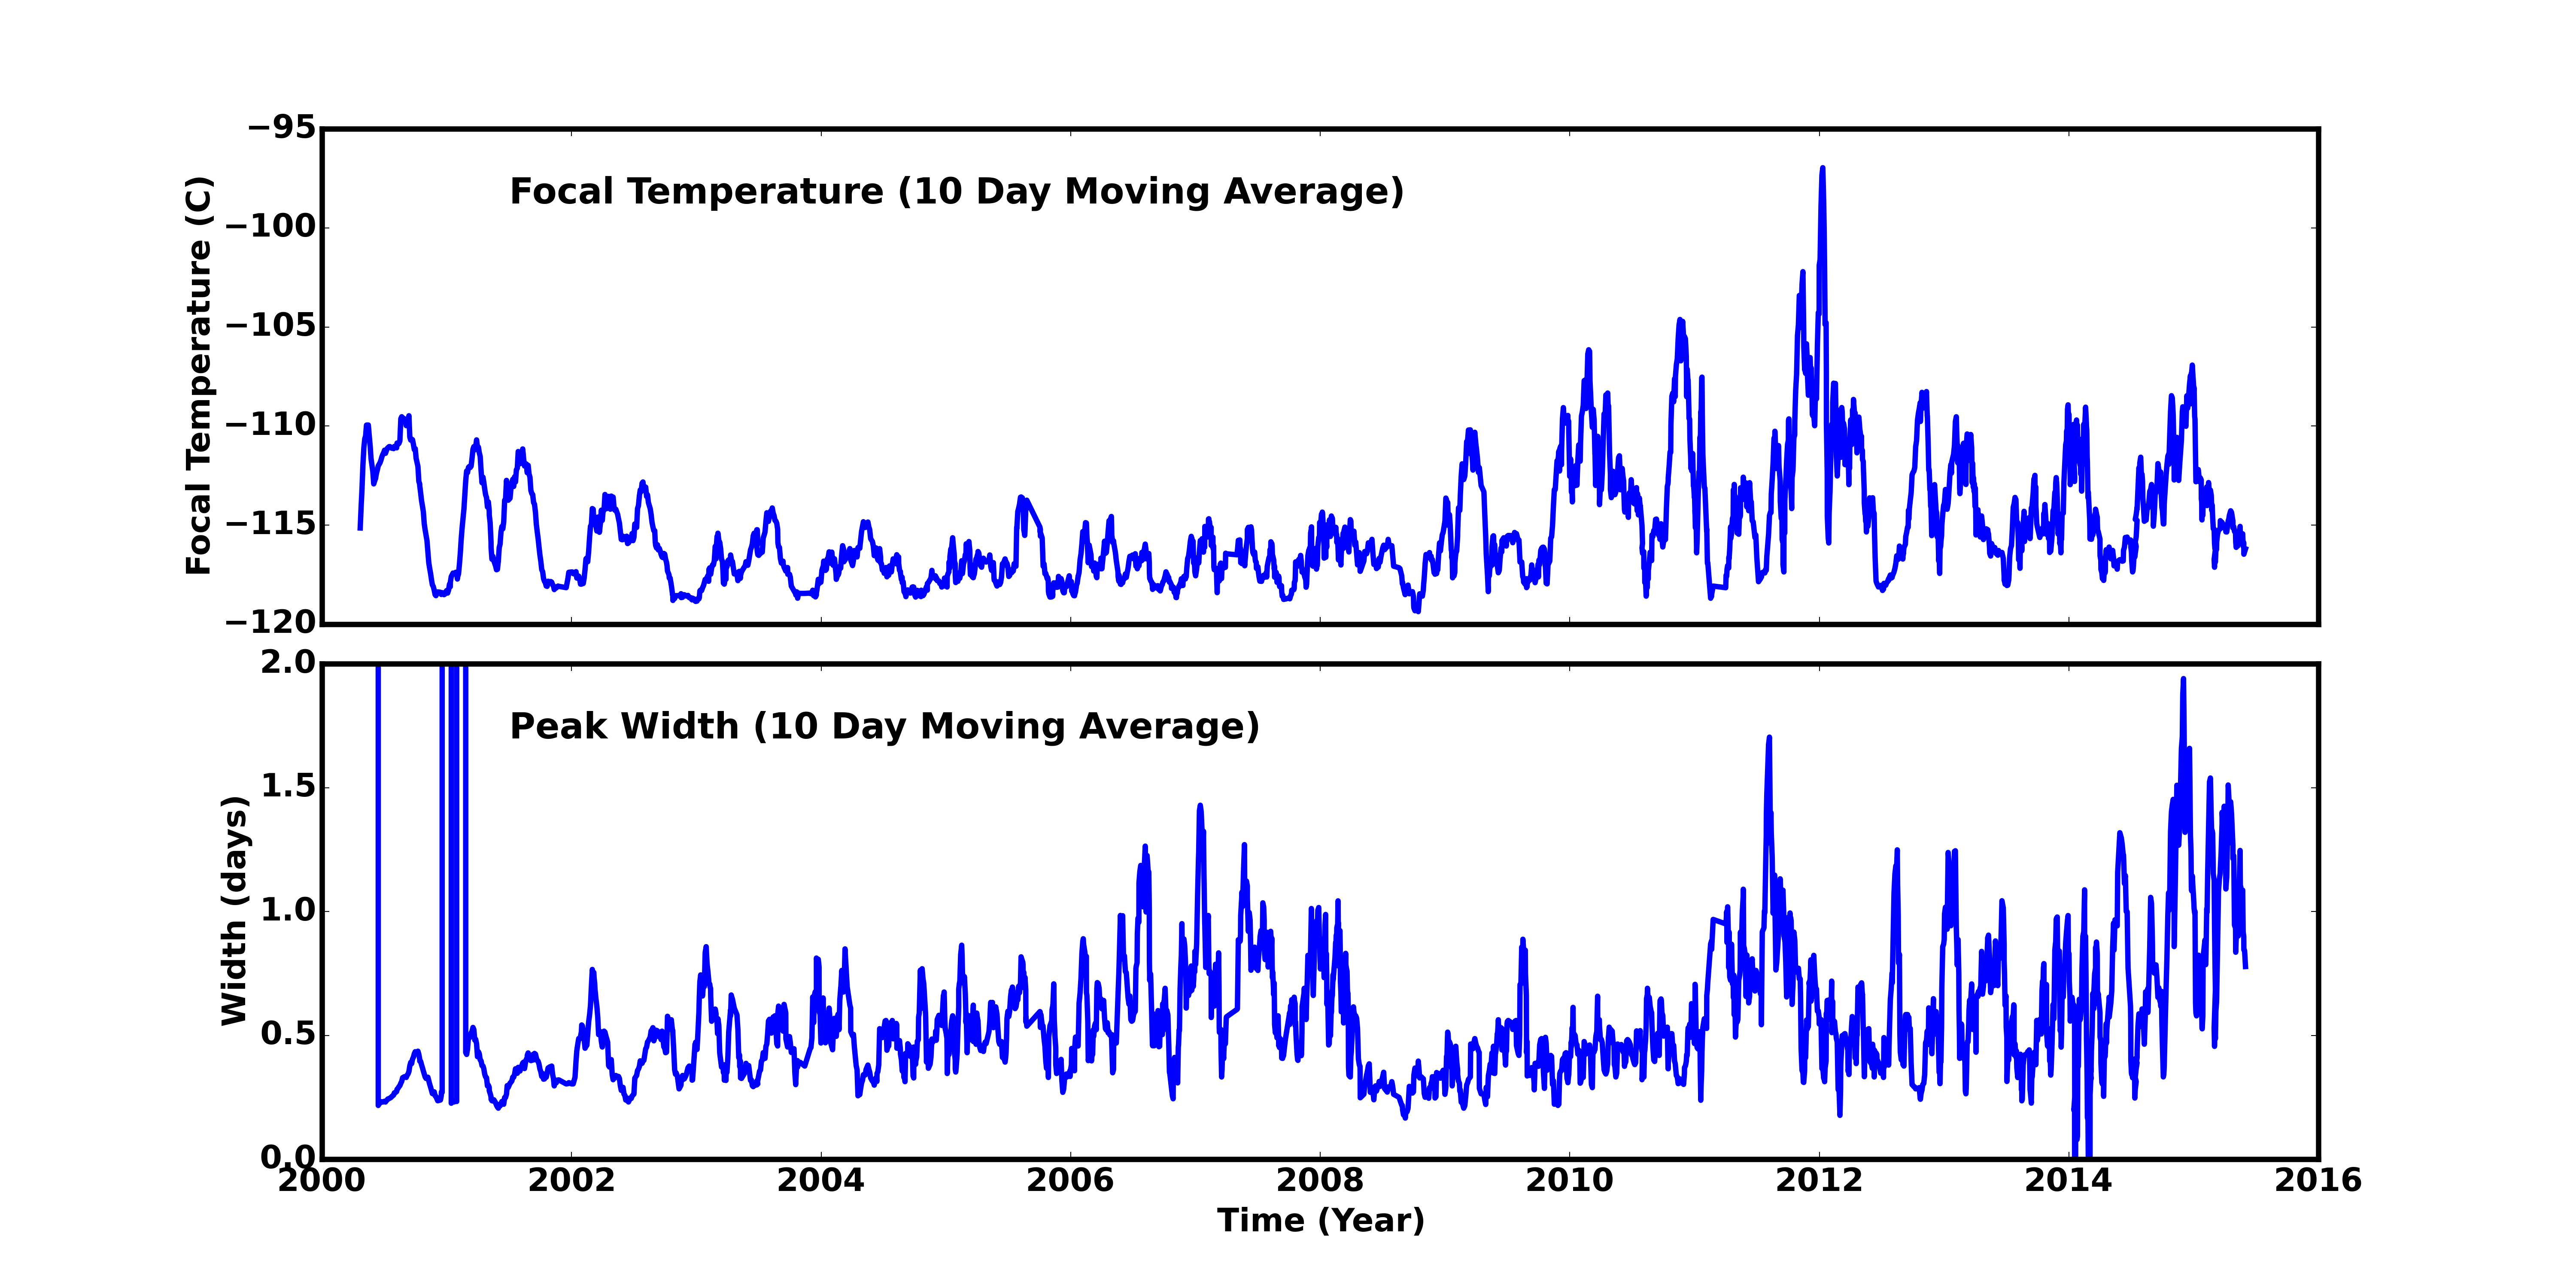
Focal Plane Temperature
May 2015 Focal Temperature
| The Mean (max) FPT: | |
|---|---|
| -115.71 | +/- 2.01 C |
| Mean Width: | |
| 0.99 | +/- 0.72 days |
Averaged Focal Plane Temperature
We are using 10 period moving averages to show trends of peak temperatures and peak widths. Note, the gaps in the width plot are due to missing/corrupted data.
Focal Plane Temperature, Sun Angle and Altitude
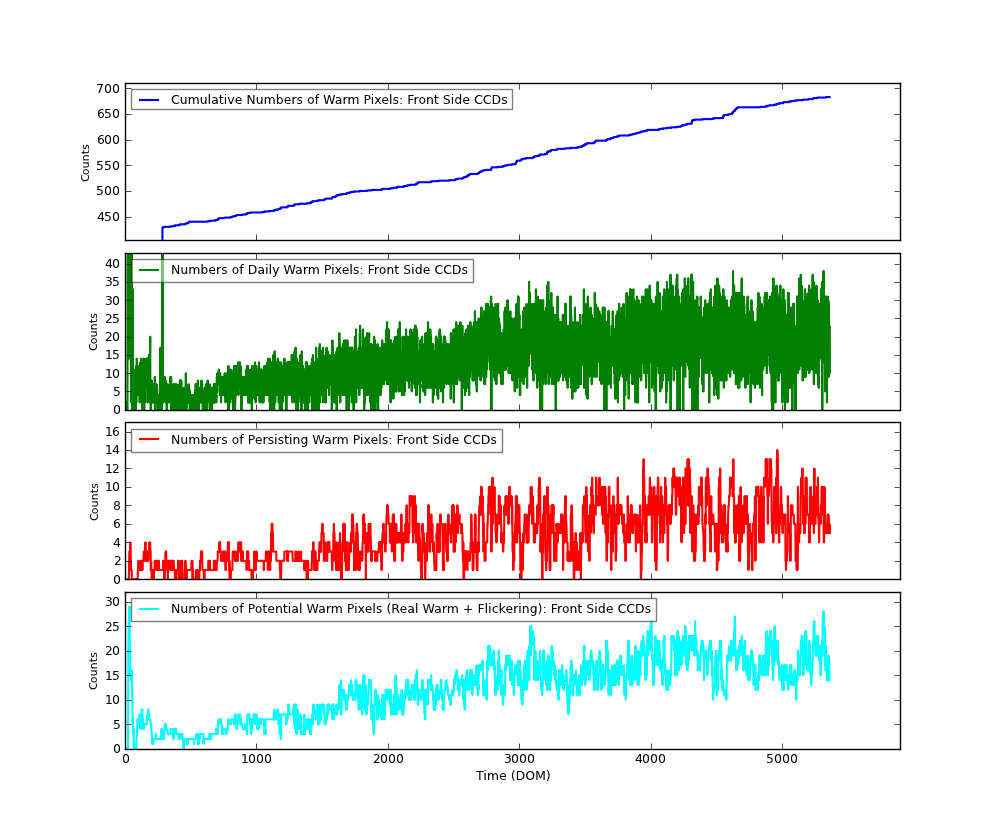
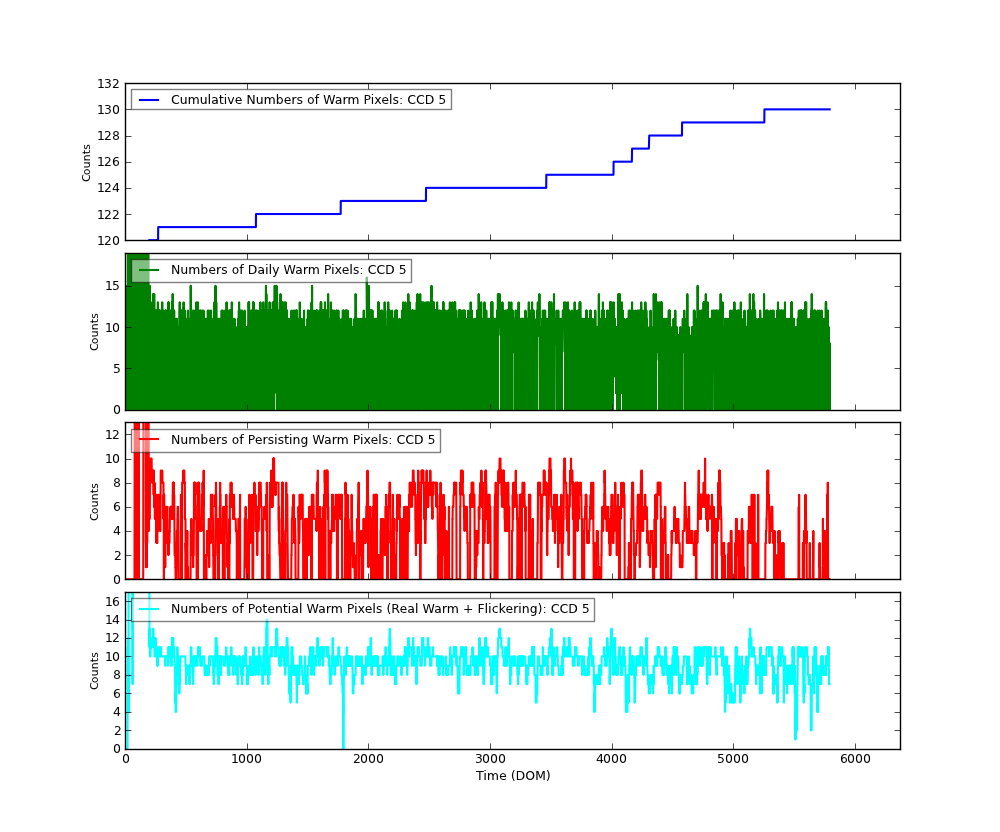
Bad Pixels
The plots below were generated with a new warm pixel finding script. Please see Acis Bad Pixel Page for details.
Front Side CCDs
Back Side CCD (CCD5)
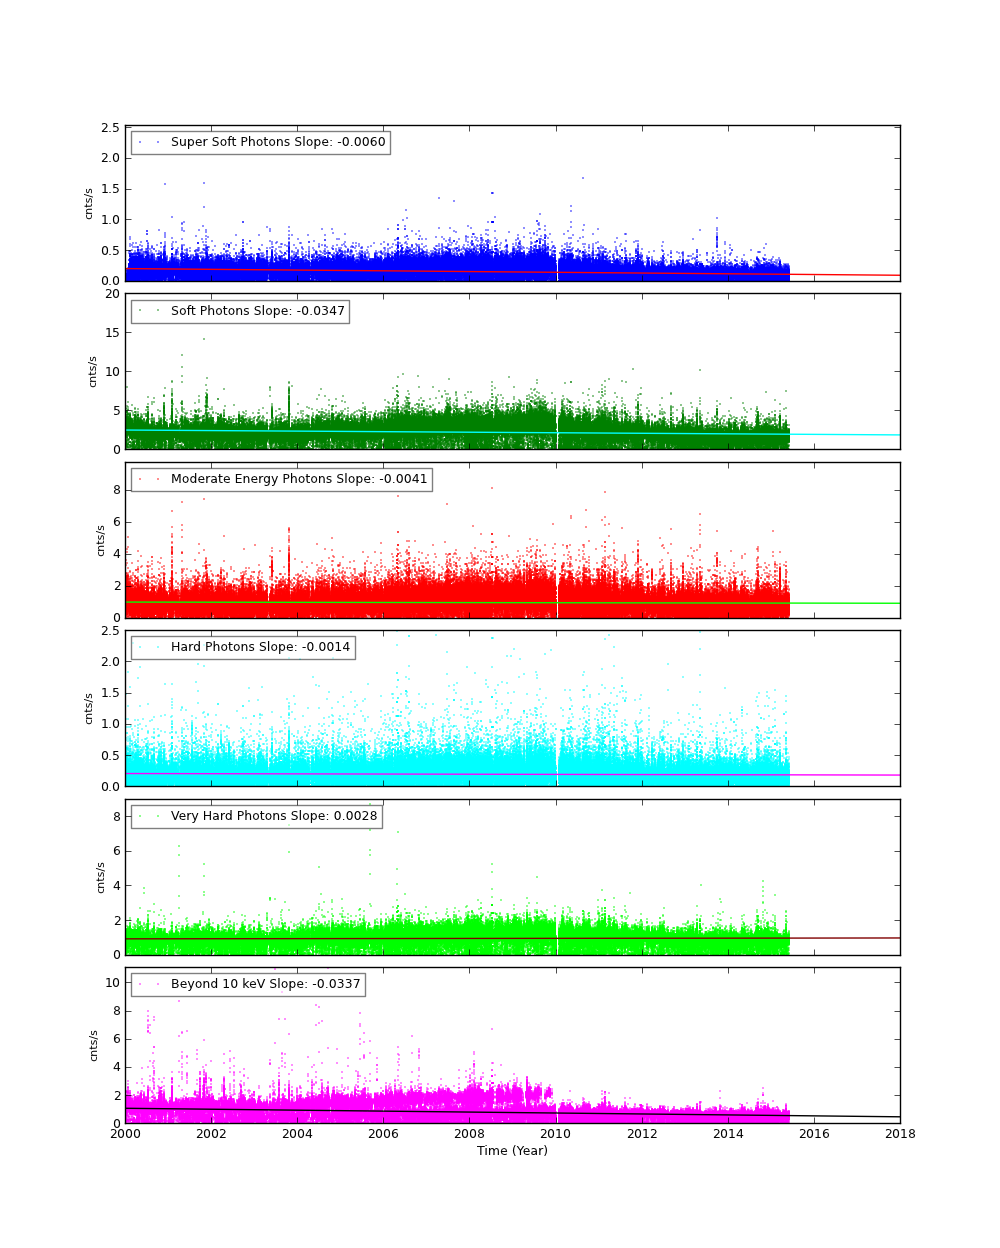
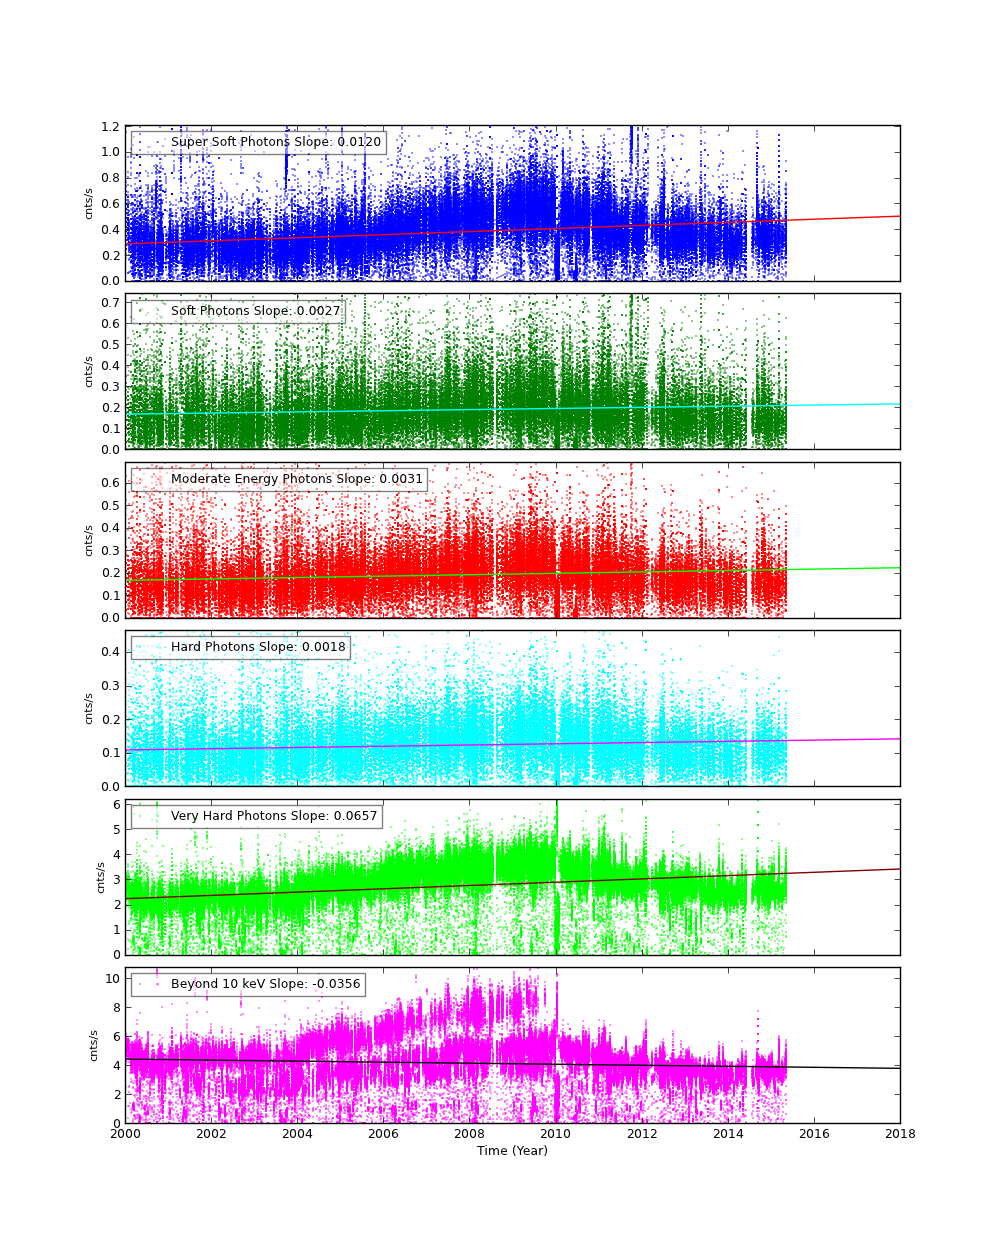
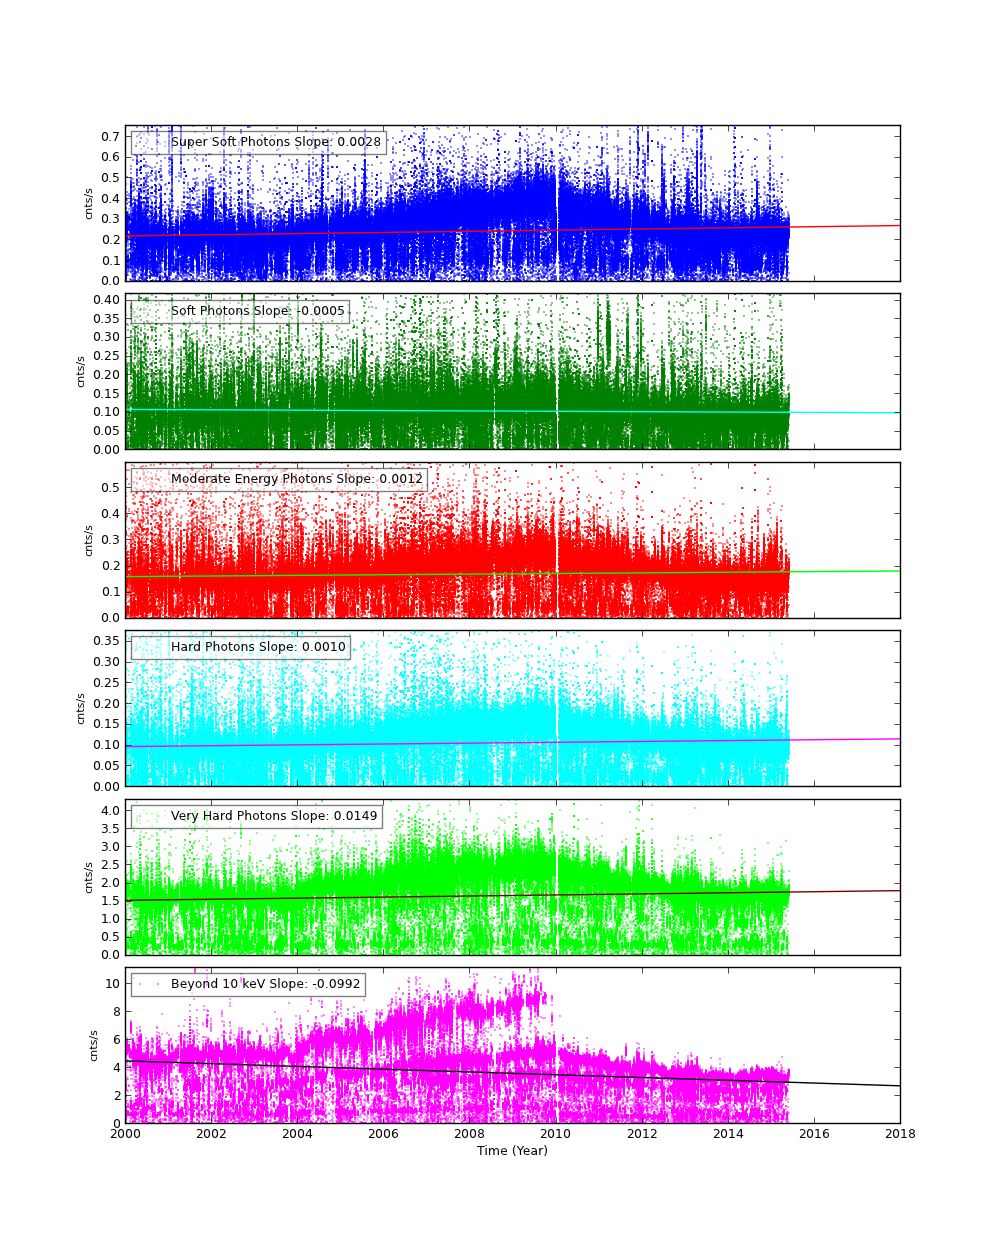
Science Instrument Background Rates
| Name | Low (keV) | High(KeV) | Description |
|---|---|---|---|
| SSoft | 0.00 | 0.50 | Super soft photons |
| Soft | 0.50 | 1.00 | Soft photons |
| Med | 1.00 | 3.00 | Moderate energy photons |
| Hard | 3.00 | 5.00 | Hard Photons |
| Harder | 5.00 | 10.00 | Very Hard photons |
| Hardest | 10.00 | Beyond 10 keV |
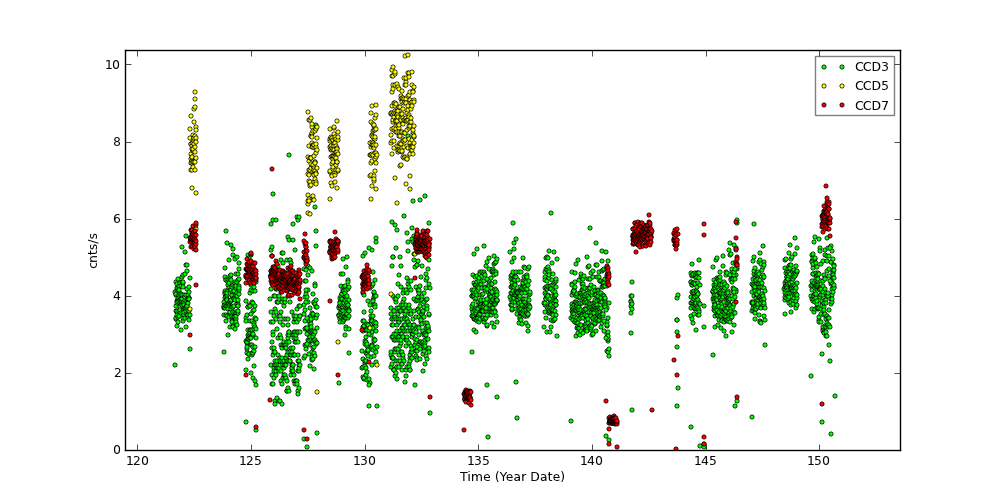
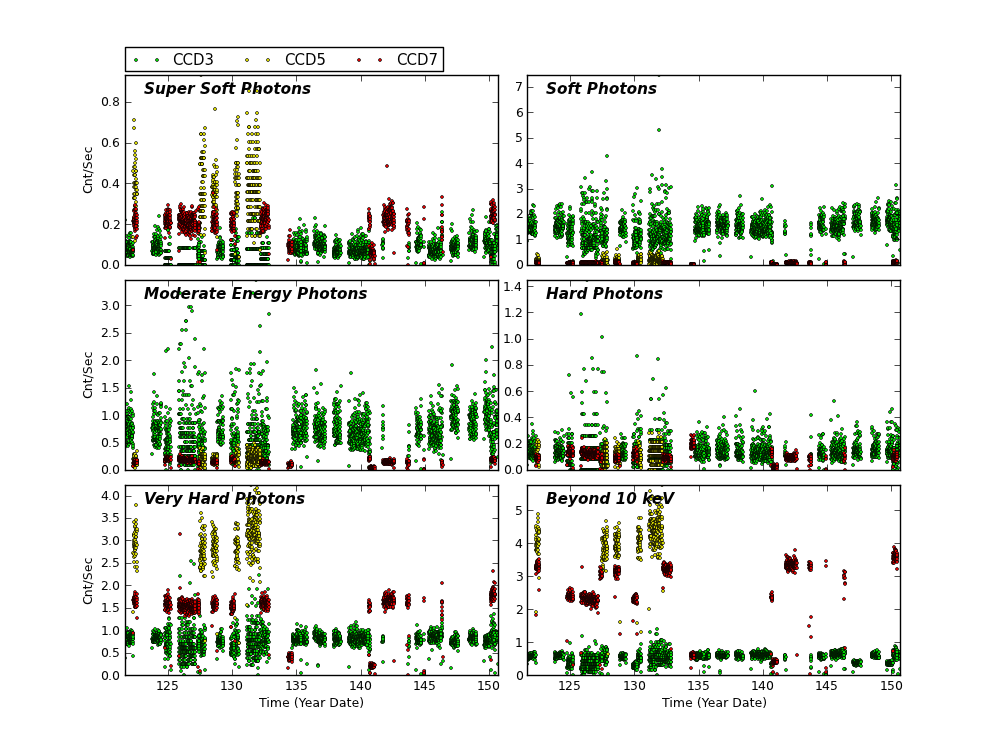
The following three plots show trends of SIB from year 2000. CCDs shown here are CCD3, CCD5, and CCD7. Fitted lines are linear fit after eliminating extreme outliers. For >10 keV plots, 2 lines are fit. One is with a 13 keV filter, and another without.
CCD 3
CCD 5
CCD 7
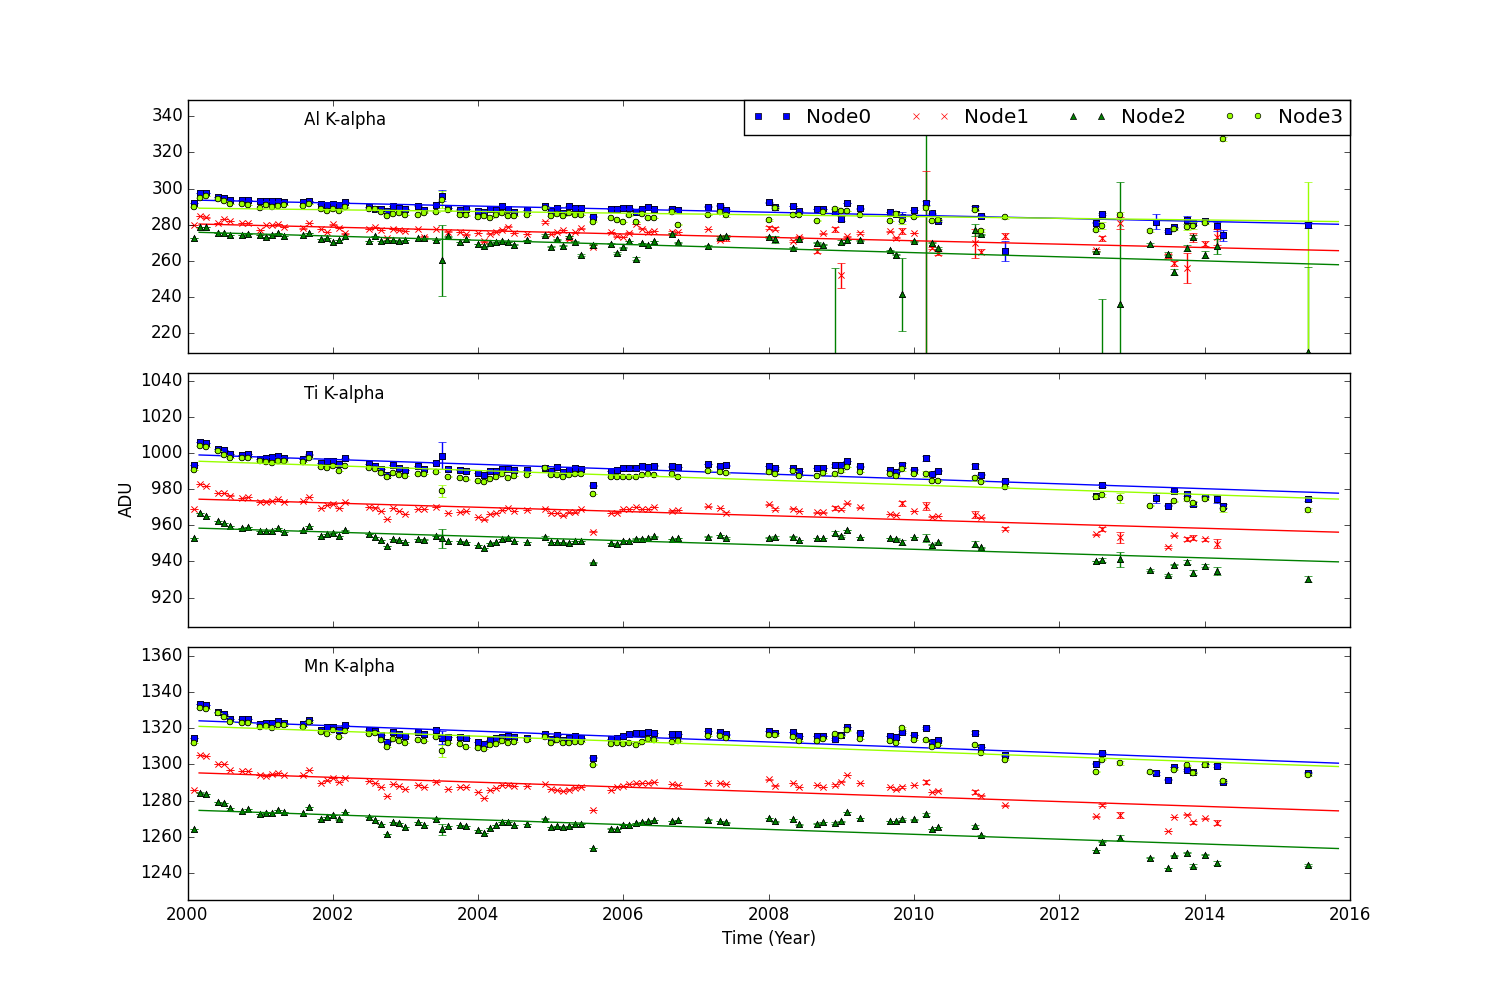
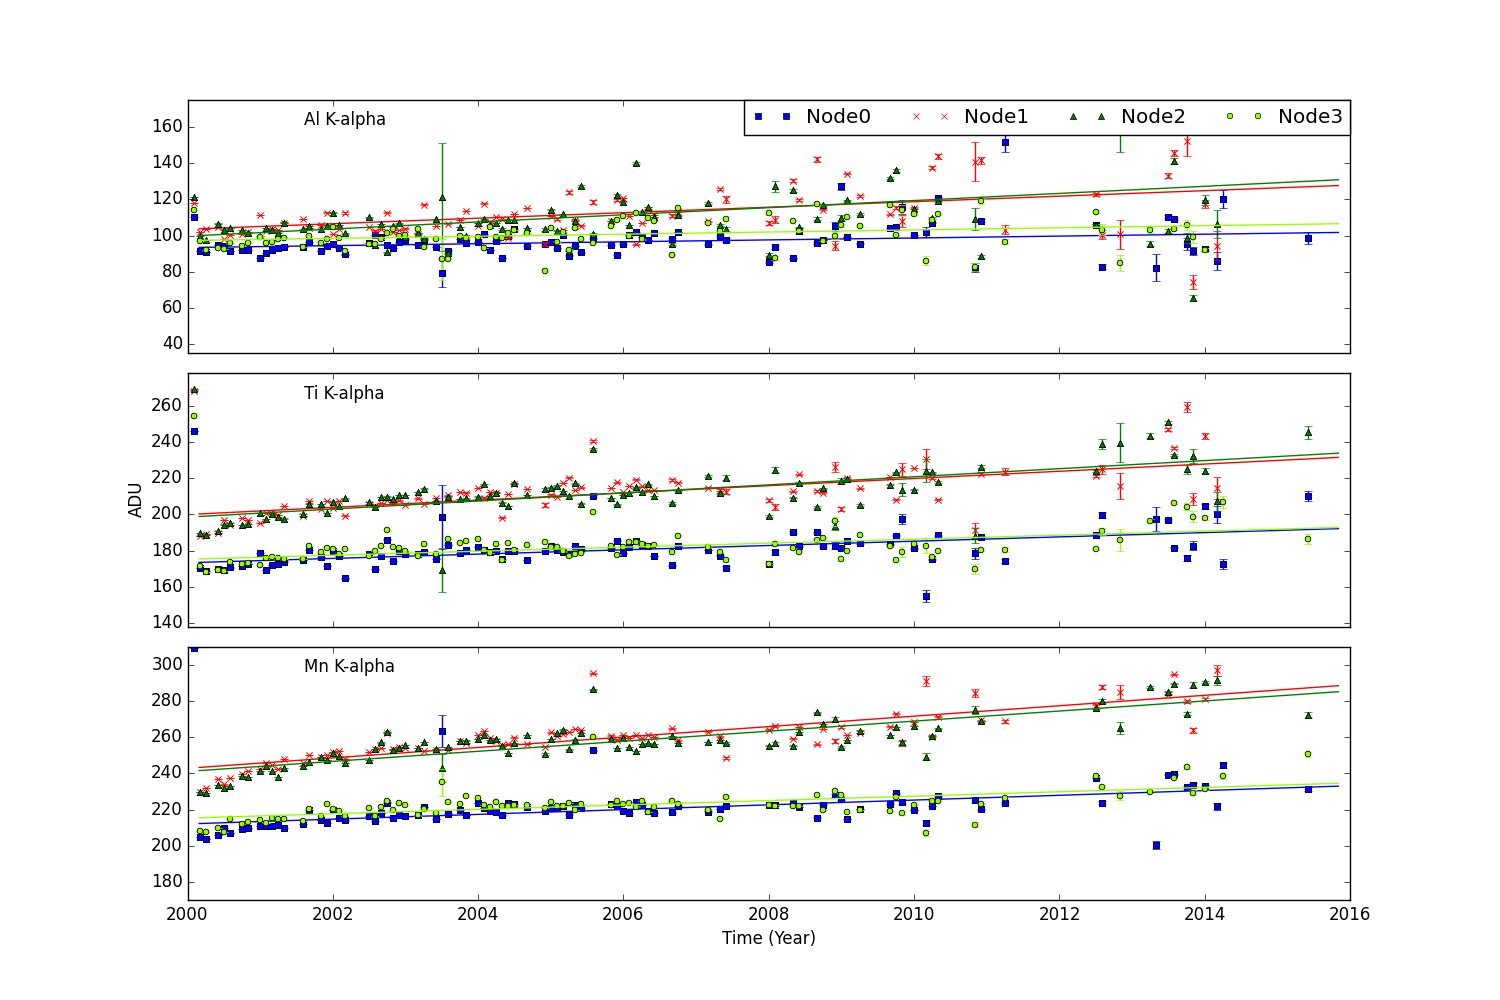
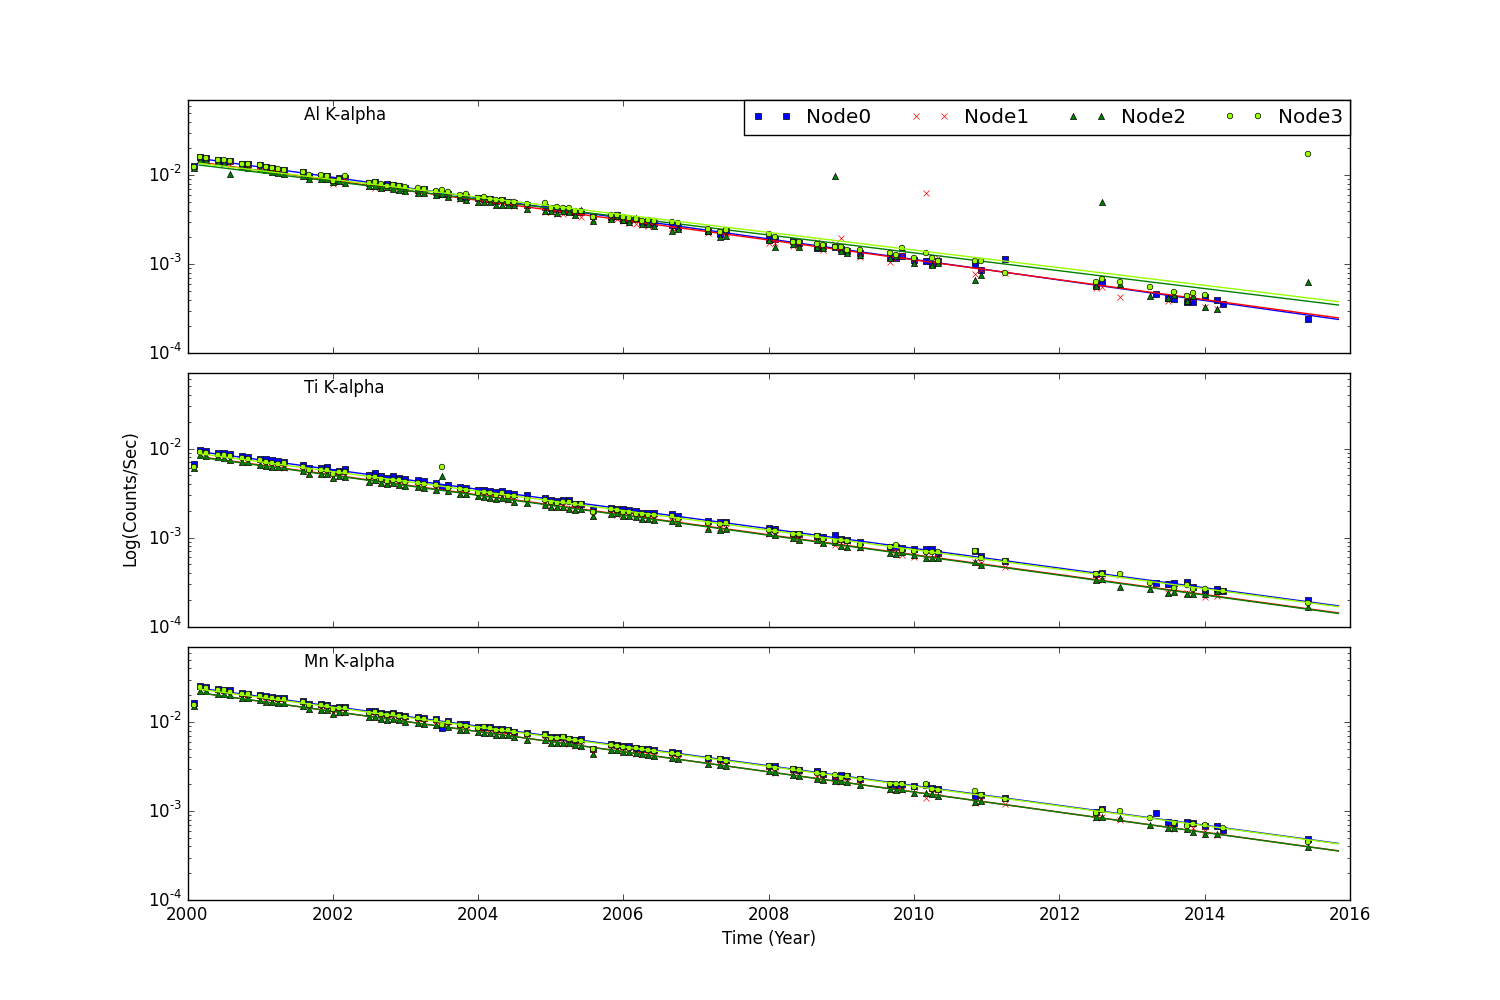
ACIS Histogram Mode Trends
We collected data from acis histogram mode data, and created trend plots of peak portions and peak widths against time (DOM). The peaks were estimated by fitting a simple Gaussian on three peaks (Al, Ti, and Mn), and the widths were estimated by a width at the half max from the peak.
All histogram data are taken under TIMED and GRADED_HIST mode, SIM position is at an external calibration source position, the focal temperature is around -119.7 C, and parameter settings in aciselec, acistemp are set to about same for all.
CCD 3, Peak Position
CCD 3, Peak Widths
CCD 3, Count Rates
HRC
DOSE of Central 4K Pore-Pairs
Please refer to Maximum Dose Trends for more details.
)
|
|---|
        IMAGE                NPIX      MEAN    STDDEV      MIN       MAX
HRCI_05_2015.fits          16777216   0.012    0.1198      0.0       7.0
)
        IMAGE                NPIX      MEAN    STDDEV      MIN       MAX
HRCI_08_1999_05_2015.fits  16777216   4.326    4.917       0.0       292.0
)
     IMAGE                NPIX      MEAN    STDDEV      MIN       MAX
HRCS_05_2015.fits          16777216     0.043    0.4901     0.0        69.0
)
        IMAGE                NPIX     MEAN      STDDEV      MIN      MAX
HRCS_08_1999_05_2015.fits  16777216  15.700     27.718      0.0      1684.0
|
|
Max dose trend plots corrected for events that "pile-up"
in the center of the taps due to bad position information.
|
)
|
)
|
)
|
)
|
| Feb 2015 | Nov 2014 | Feb 2014 | May 2014 |
|---|
)
|
)
|
)
|
)
|
| Feb 2015 | Nov 2014 | Aug 2014 | May 2014 |
|---|
Gratings
Focus
We plot the width of the zero order streak of ACIS/HETG observations and the width of the zero order image for HRC/LETG observations of point sources. No significant defocusing trend is seen at this time. See Gratings Focus pages.
PCAD
ACA Trending
Gyro Bias Drift
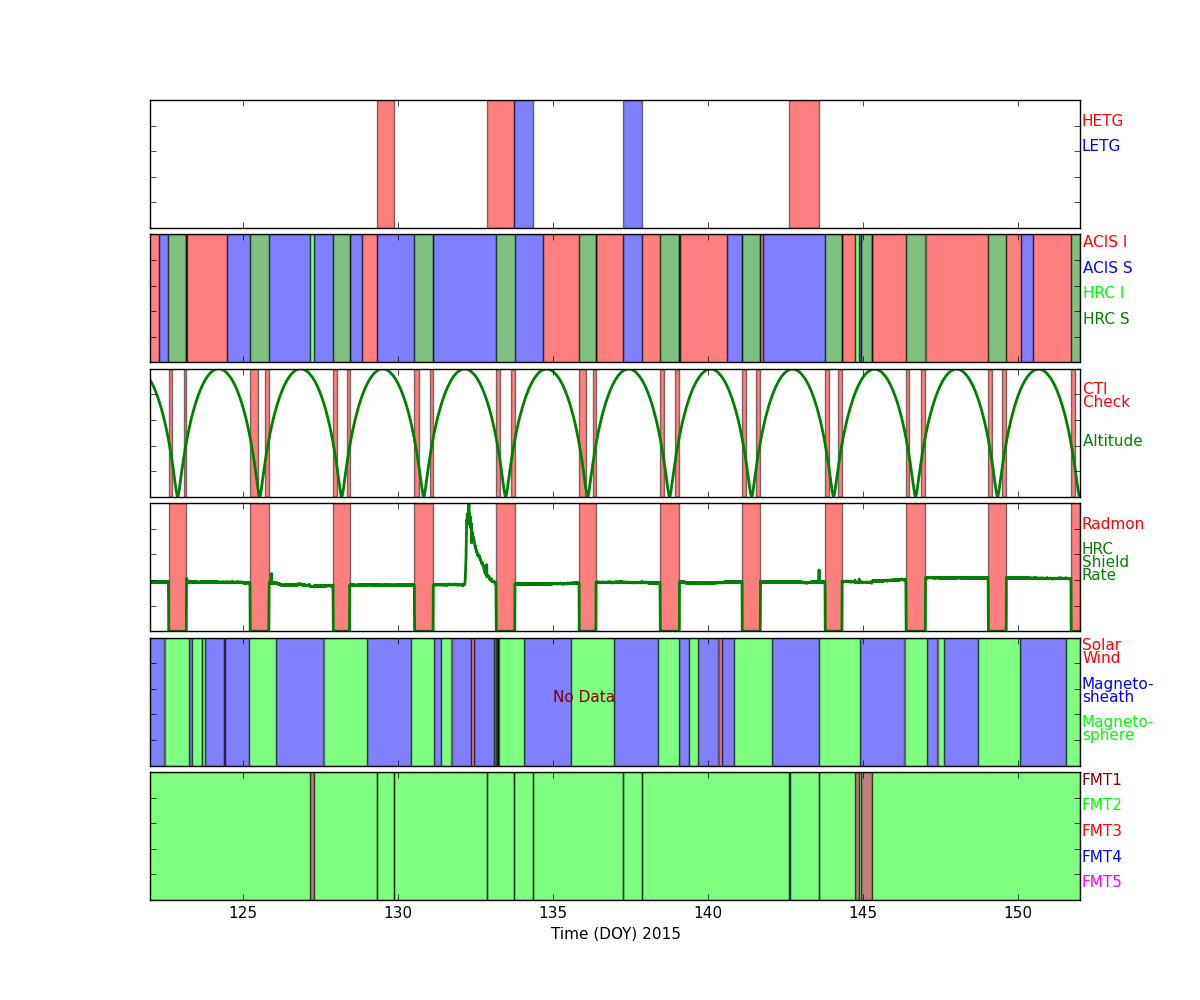
Radiation History
Radiation Zone Timing
Plotted below are radiation zone timing plots based on the following definitions of radiation zone:
- RADZONE - Ephin levels (in any of the E1300,P4GM,P41GM channels) are more than 1/3 of RADMON safing thresholds.
- RADMON - Radmon is disabled for radiation zone (as commanded based on OFLS model, for comparison with actual radiation levels).
- PERIGEE - Time of closest earth approach (for comparison)
Radiation Count Rates of May 2015
Sun Spot History
Trending
Quarterly Trends
- DEA HK Temperature
| Previous Quarter | ||||||
| MSID | MEAN | RMS | DELTA/YR | DELTA/YR/YR | UNITS | DESCRIPTION |
| DEAHK1 | 23.70 | 8.55 | -1.008e+01 | 6.117e+01 | C | DPA Thermistor 1 - BEP PC Board |
| DEAHK2 | 21.98 | 8.73 | -1.026e+01 | 6.781e+01 | C | DPA Thermistor 2 - BEP Oscillator |
| DEAHK3 | 22.90 | 10.11 | -1.644e+01 | 1.322e+02 | C | DPA Thermistor 3 - FEP 0 Mongoose |
| DEAHK4 | 21.90 | 9.59 | -1.400e+01 | 1.054e+02 | C | DPA Thermistor 4 - FEP 0 PC Board |
| DEAHK5 | 23.29 | 9.92 | -1.572e+01 | 1.372e+02 | C | DPA Thermistor 5 - FEP 0 ACTEL |
| DEAHK6 | 23.22 | 9.76 | -1.448e+01 | 1.291e+02 | C | DPA Thermistor 6 - FEP 0 RAM |
| DEAHK7 | 20.45 | 9.52 | -1.275e+01 | 1.048e+02 | C | DPA Thermistor 7 - FEP 0 Frame Buf. |
| DEAHK8 | 28.47 | 9.51 | -1.034e+01 | 1.231e+02 | C | DPA Thermistor 8 - FEP 1 Mongoose |
| DEAHK9 | 25.49 | 9.46 | -1.046e+01 | 1.026e+02 | C | DPA Thermistor 9 - FEP 1 PC Board |
| DEAHK10 | 27.84 | 9.60 | -1.073e+01 | 1.319e+02 | C | DPA Thermistor 10- FEP 1 ACTEL |
| DEAHK11 | 26.86 | 9.63 | -1.099e+01 | 1.250e+02 | C | DPA Thermistor 11- FEP 1 RAM |
| DEAHK12 | 22.06 | 9.65 | -1.089e+01 | 1.013e+02 | C | DPA Thermistor 12- FEP 1 Frame Buf. |
| DEAHK15 | -248.64 | 0.19 | -3.063e-01 | 7.203e+00 | C | Focal Plane Temp. Board 12 |
| DEAHK16 | -117.81 | 1.94 | -1.907e+00 | -2.682e+01 | C | Focal Plane Temp. Board 11 |
)
)
)
)
)
)
)
)
)
)
)
)
)
)
- DEA HK Electronics
| Previous Quarter | ||||||
| MSID | MEAN | RMS | DELTA/YR | DELTA/YR/YR | UNITS | DESCRIPTION |
| DEAHK17 | -0.16 | 1.431e-02 | 1.543e-02 | 1.491e-01 | Volt | DPA Ground Reference 1 |
| DEAHK18 | 5.04 | 1.517e-02 | 2.469e-02 | -1.061e-02 | Volt | DPA 5V Housekeeping A |
| DEAHK19 | -0.16 | 1.543e-02 | 1.652e-02 | 1.218e-02 | Volt | DPA Ground Reference 2 |
| DEAHK20 | 5.05 | 1.832e-02 | 1.698e-02 | -3.006e-01 | Volt | DPA 5V Housekeeping B |
| DEAHK25 | 30.56 | 0.11 | -4.490e-02 | 2.187e+00 | Volt | Primary Raw DEA 28V DC |
| DEAHK26 | 24.84 | 0.12 | 2.162e-02 | 2.977e-01 | Volt | Primary Raw DEA 24V DC |
| DEAHK27 | -16.23 | 0.36 | 1.912e-01 | -2.127e+00 | Volt | Primary Raw DEA -15.5V |
| DEAHK28 | 15.85 | 0.26 | -1.349e-01 | 1.281e+00 | Volt | Primary Raw DEA +15.5V |
| DEAHK29 | -6.32 | 8.794e-02 | 5.379e-02 | -5.492e-01 | Volt | Primary Raw DEA -6V DC |
| DEAHK30 | 6.07 | 2.061e-02 | 2.829e-02 | -3.469e-01 | Volt | Primary Raw DEA +6V DC |
| DEAHK31 | 0.05 | 1.313e-03 | 8.543e-04 | -8.800e-02 | mAmp | Relative Dose Rad. Monitor Side A |
| DEAHK32 | -1.476e-05 | 1.688e-04 | 5.256e-05 | 3.287e-05 | Volt | Interface Ground Reference |
| DEAHK33 | -0.01 | 7.433e-03 | -6.300e-03 | -2.944e-01 | Volt | Backup Raw DEA 28V DC |
| DEAHK34 | -0.08 | 7.383e-03 | 1.029e-02 | -2.871e-01 | Volt | Backup DEA 24V DC |
| DEAHK35 | -0.02 | 4.405e-03 | 5.335e-03 | -8.859e-02 | Volt | Backup DEA -15.5V DC |
)
)
)
)
)
)
)
)
)
)
)
)
)
)
)
Envelope Trending
ACIS Electronics Side A
ACIS Temperature
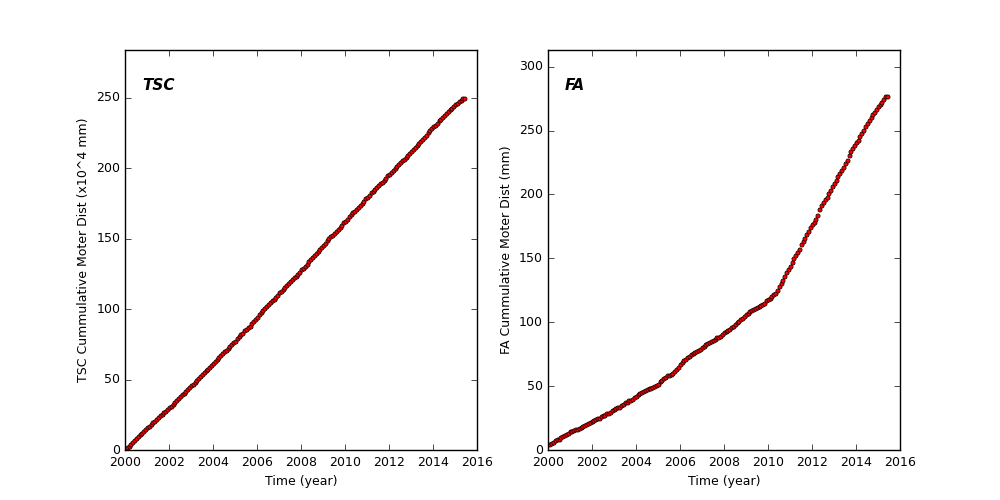
Spacecraft Motions
TSC and FA Cummulative Moter Distance
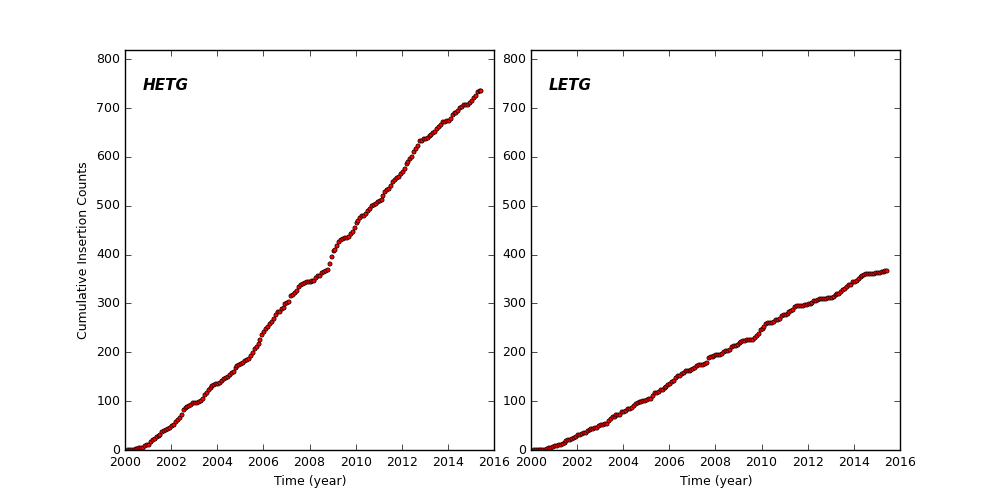
HETG and LETG Cummulative Insertion Counts
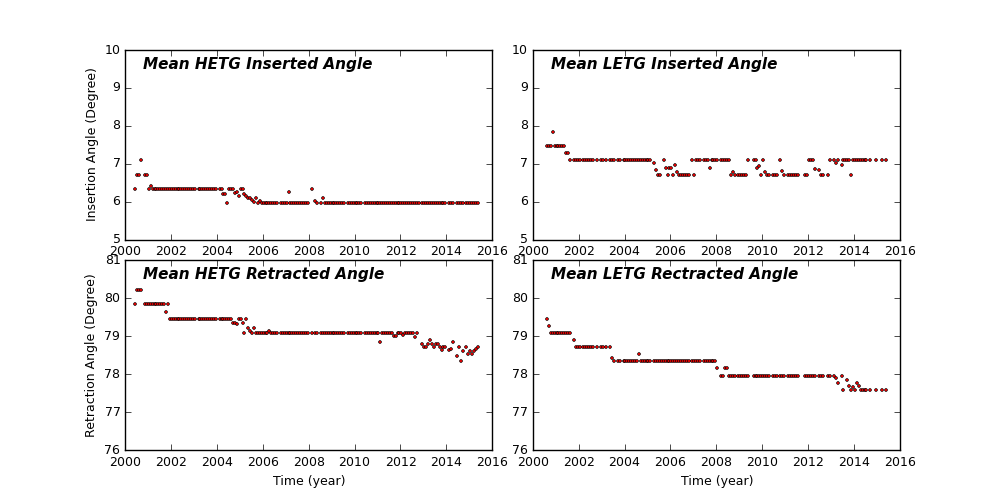
HETG/LETG Insertion/Retraction Angle
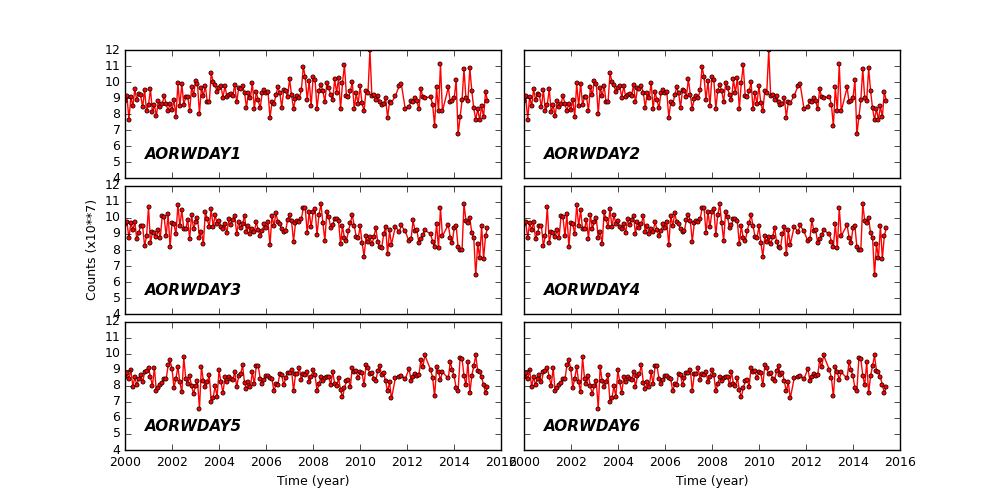
Reaction Wheel Rotations
Links to Past Monthly Reports
| Year | Month | |||||||||||
|---|---|---|---|---|---|---|---|---|---|---|---|---|
| 2015 | Jan | Feb | Mar | Apr | ||||||||
| 2014 | Jan | Feb | Mar | Apr | May | Jun | Jul | Aug | Sep | Oct | Nov | Dec |
| 2013 | Jan | Feb | Mar | Apr | May | Jun | Jul | Aug | Sep | Oct | Nov | Dec |
| 2012 | Jan | Feb | Mar | Apr | May | Jun | Jul | Aug | Sep | Oct | Nov | Dec |
| 2011 | Jan | Feb | Mar | Apr | May | Jun | Jul | Aug | Sep | Oct | Nov | Dec |
| 2010 | Jan | Feb | Mar | Apr | May | Jun | Jul | Aug | Sep | Oct | Nov | Dec |
| 2009 | Jan | Feb | Mar | Apr | May | Jun | Jul | Aug | Sep | Oct | Nov | Dec |
| 2008 | Jan | Feb | Mar | Apr | May | Jun | Jul | Aug | Sep | Oct | Nov | Dec |
| 2007 | Jan | Feb | Mar | Apr | May | Jun | Jul | Aug | Sep | Oct | Nov | Dec |
| 2006 | Jan | Feb | Mar | Apr | May | Jun | Jul | Aug | Sep | Oct | Nov | Dec |
| 2005 | Jan | Feb | Mar | Apr | May | Jun | Jul | Aug | Sep | Oct | Nov | Dec |
| 2004 | Jan | Feb | Mar | Apr | May | Jun | Jul | Aug | Sep | Oct | Nov | Dec |
| 2003 | Jan | Feb | Mar | Apr | May | Jun | Jul | Aug | Sep | Oct | Nov | Dec |
| 2002 | Jan | Feb | Mar | Apr | May | Jun | Jul | Aug | Sep | Oct | Nov | Dec |
| 2001 | Jan | Feb | Mar | Apr | May | Jun | Jul | Aug | Sep | Oct | Nov | Dec |
| 2000 | Jan | Feb | Mar | Apr | May | Jun | Jul | Aug | Sep | Oct | Nov | Dec |
| 1999 | Jul | Aug | Sep | Oct | Nov | Dec | ||||||