ACIS
ACIS DOSE Registered-Photon-Map
The steps we took to compute the dose map are;
- Level 1 Event files for a specified month are obtained from archive.
- Image data including I2, I3, S2, S3 CCDs are extracted from all event files.
- All the extracted image data were merged to create a month long exposure map for the month.
- The exposure map is opened with ds9, and check a distribution of count rates against energy. From this, estimate the upper threshold value. Any events beyond this upper threshold are assumed erroneous events such as bad pixels.
- Using this upper threshold, the data is filtered, and create a cleaned exposure map for the month.
- The exposure map from each month from the Sep 1999 is added up to create a cumulative exposure map for each month.
- Using fimgstatistic, we compute count rate statistics for each CCDs.
- For observations with high data drop rates (e.g., Crab nebula, Cas A), we corrected the observations by adding events.
Please check more detail plots at Telemetered Photon Dose Trend page.
)
)
)
Statistics:
# IMAGE     NPIX     MEAN        RMS        MIN     MAX
ACIS_sep15 6004901   6.535       12.140     0.0     9450


I2 node 0  262654   7.256949    3.239351    0.0     54.0
I2 node 1  262654   7.634983    4.502908    0.0   1255.0
I2 node 2  262654   7.506838    3.316867    0.0     87.0
I2 node 3  262654   7.644837   22.075913    0.0   9298.0

I3 node 0  262654   9.004143    4.222815    0.0    344.0
I3 node 1  262654   9.073072    8.134519    0.0    190.0
I3 node 2  262654   8.334269    3.464274    0.0     82.0
I3 node 3  262654   8.439702   26.891918    0.0   9450.0

S2 node 0  262654   6.700881    3.711430    0.0   1061.0
S2 node 1  262654   6.777346    3.294918    0.0     48.0
S2 node 2  262654   6.838902    3.204373    0.0     91.0
S2 node 3  262654   6.778767    3.198578    0.0    382.0

S3 node 0  262654   10.755316   3.613484    0.0     47.0
S3 node 1  262654   12.197650   4.261862    0.0    102.0
S3 node 2  262654   12.057177   3.658086    0.0     49.0
S3 node 3  262654   10.879334   3.489802    0.0     79.0
)
)
)
Statistics:
 IMAGE     NPIX      MEAN        RMS          MIN      MAX
ACIS_total 6004901   1953.544    2553.51      0.0   112293


I2 node 0  262654   1650.811319  316.412980   328.0   9215.0
I2 node 1  262654   1739.279983  437.140716   358.0  43241.0
I2 node 2  262654   1771.936132  371.440986   353.0   9314.0
I2 node 3  262654   1770.417657  446.726315   339.0  28159.0

I3 node 0  262654   1861.635829  444.779729   327.0   7248.0
I3 node 1  262654   1951.412805 1471.340271   340.0  36879.0
I3 node 2  262654   1704.188185  306.352212   325.0   8943.0
I3 node 3  262654   1691.904106  328.776730   300.0  28140.0

S2 node 0  262654   2281.389300  331.847946  1210.0  21330.0
S2 node 1  262654   2424.448603  528.604964  1283.0  13321.0
S2 node 2  262654   2678.835061  513.004152  1635.0  27299.0
S2 node 3  262654   2617.026834  372.219792  1543.0  44893.0

S3 node 0  262654   4048.225111 1830.505882  1685.0  13787.0
S3 node 1  262654   5269.786850 2131.592897     0.0  14252.0
S3 node 2  262654   4052.524851 1041.027607  1654.0   9791.0
S3 node 3  262654   3122.199829  476.818892  1787.0  10624.0
)
|
)
|
)
|
)
|
| Jun 2015 | Mar 2015 | Dec 2014 | Sep 2014 |
|---|
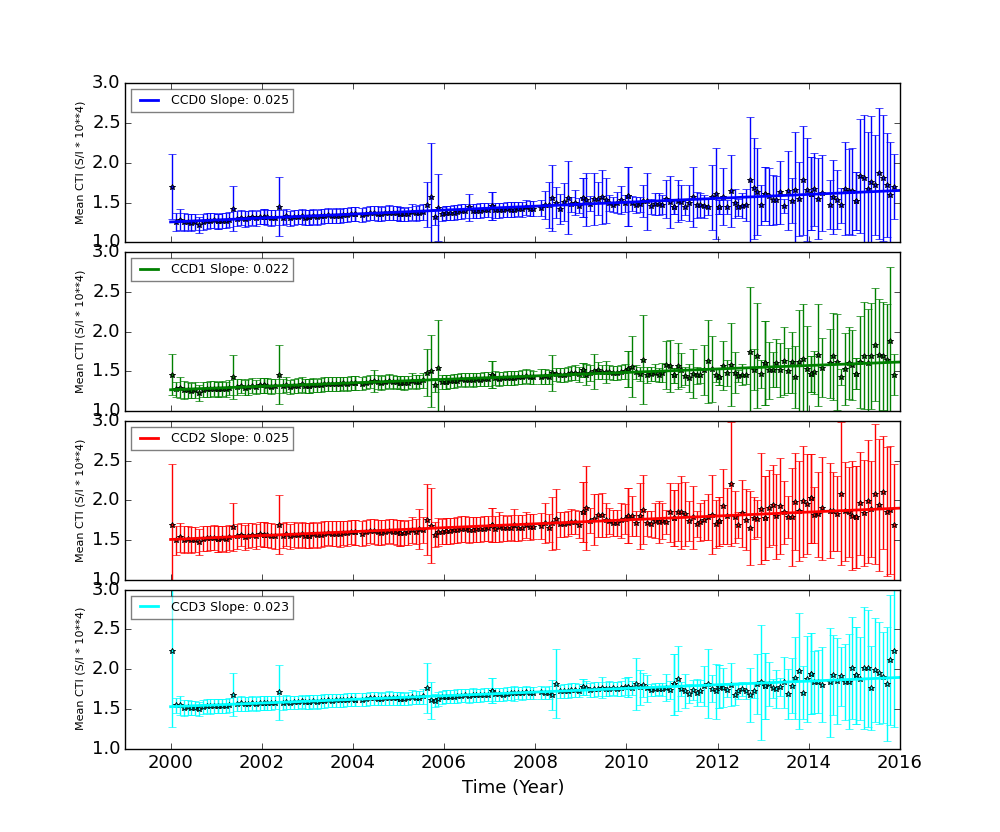
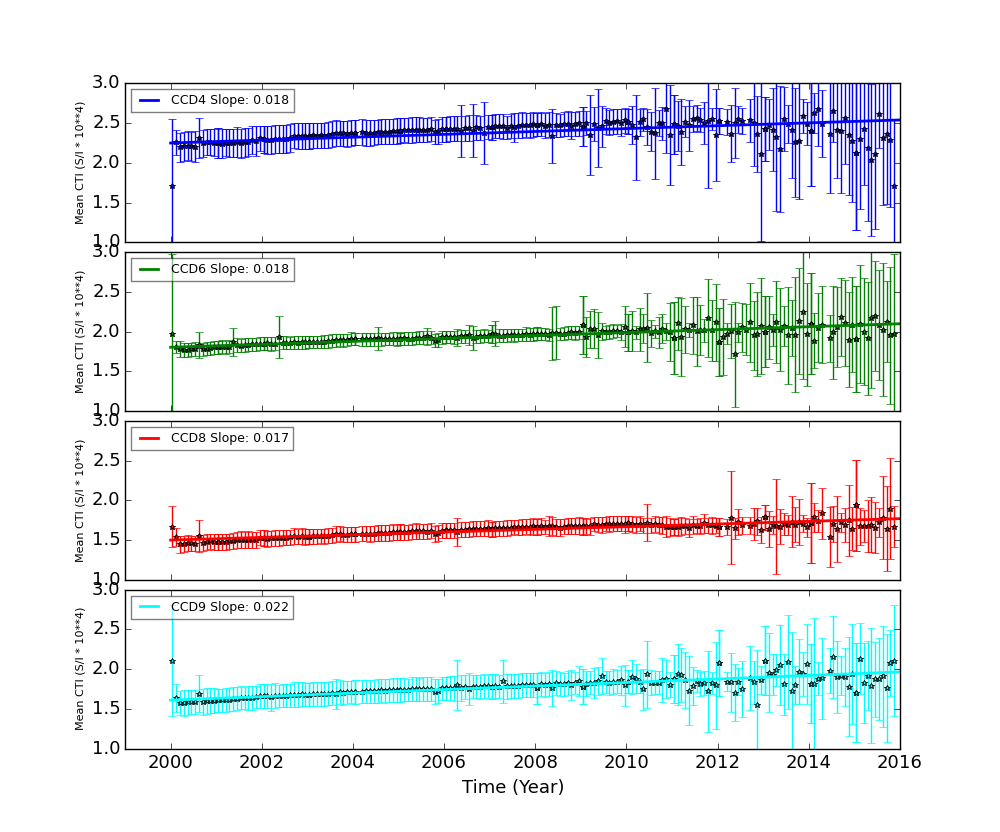
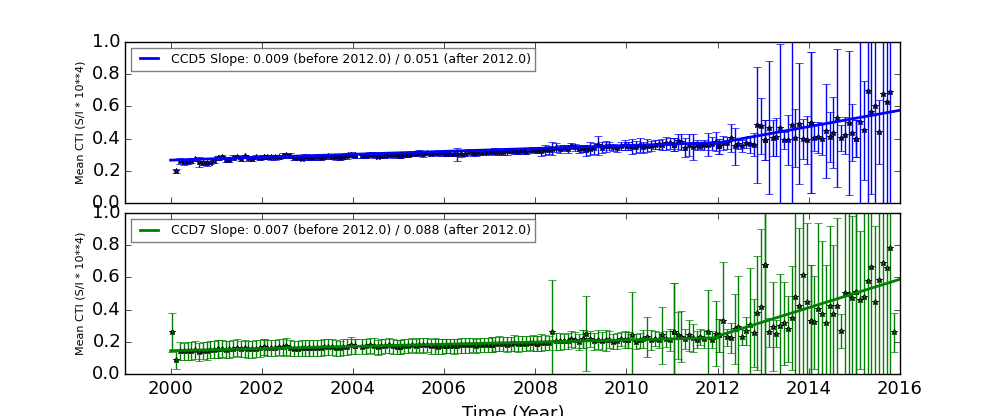
The Mean Detrended CTI
We report CTIs with a refined data definition. CTIs were computed for the temperature dependency corrected data. Please see CTI page for detailed explanation. CTI's are computed for Mn K alpha, and defined as slope/intercept x10^4 of row # vs ADU. Data file: here
Imaging CCDs
Spectral CCDs
Backside CCDs
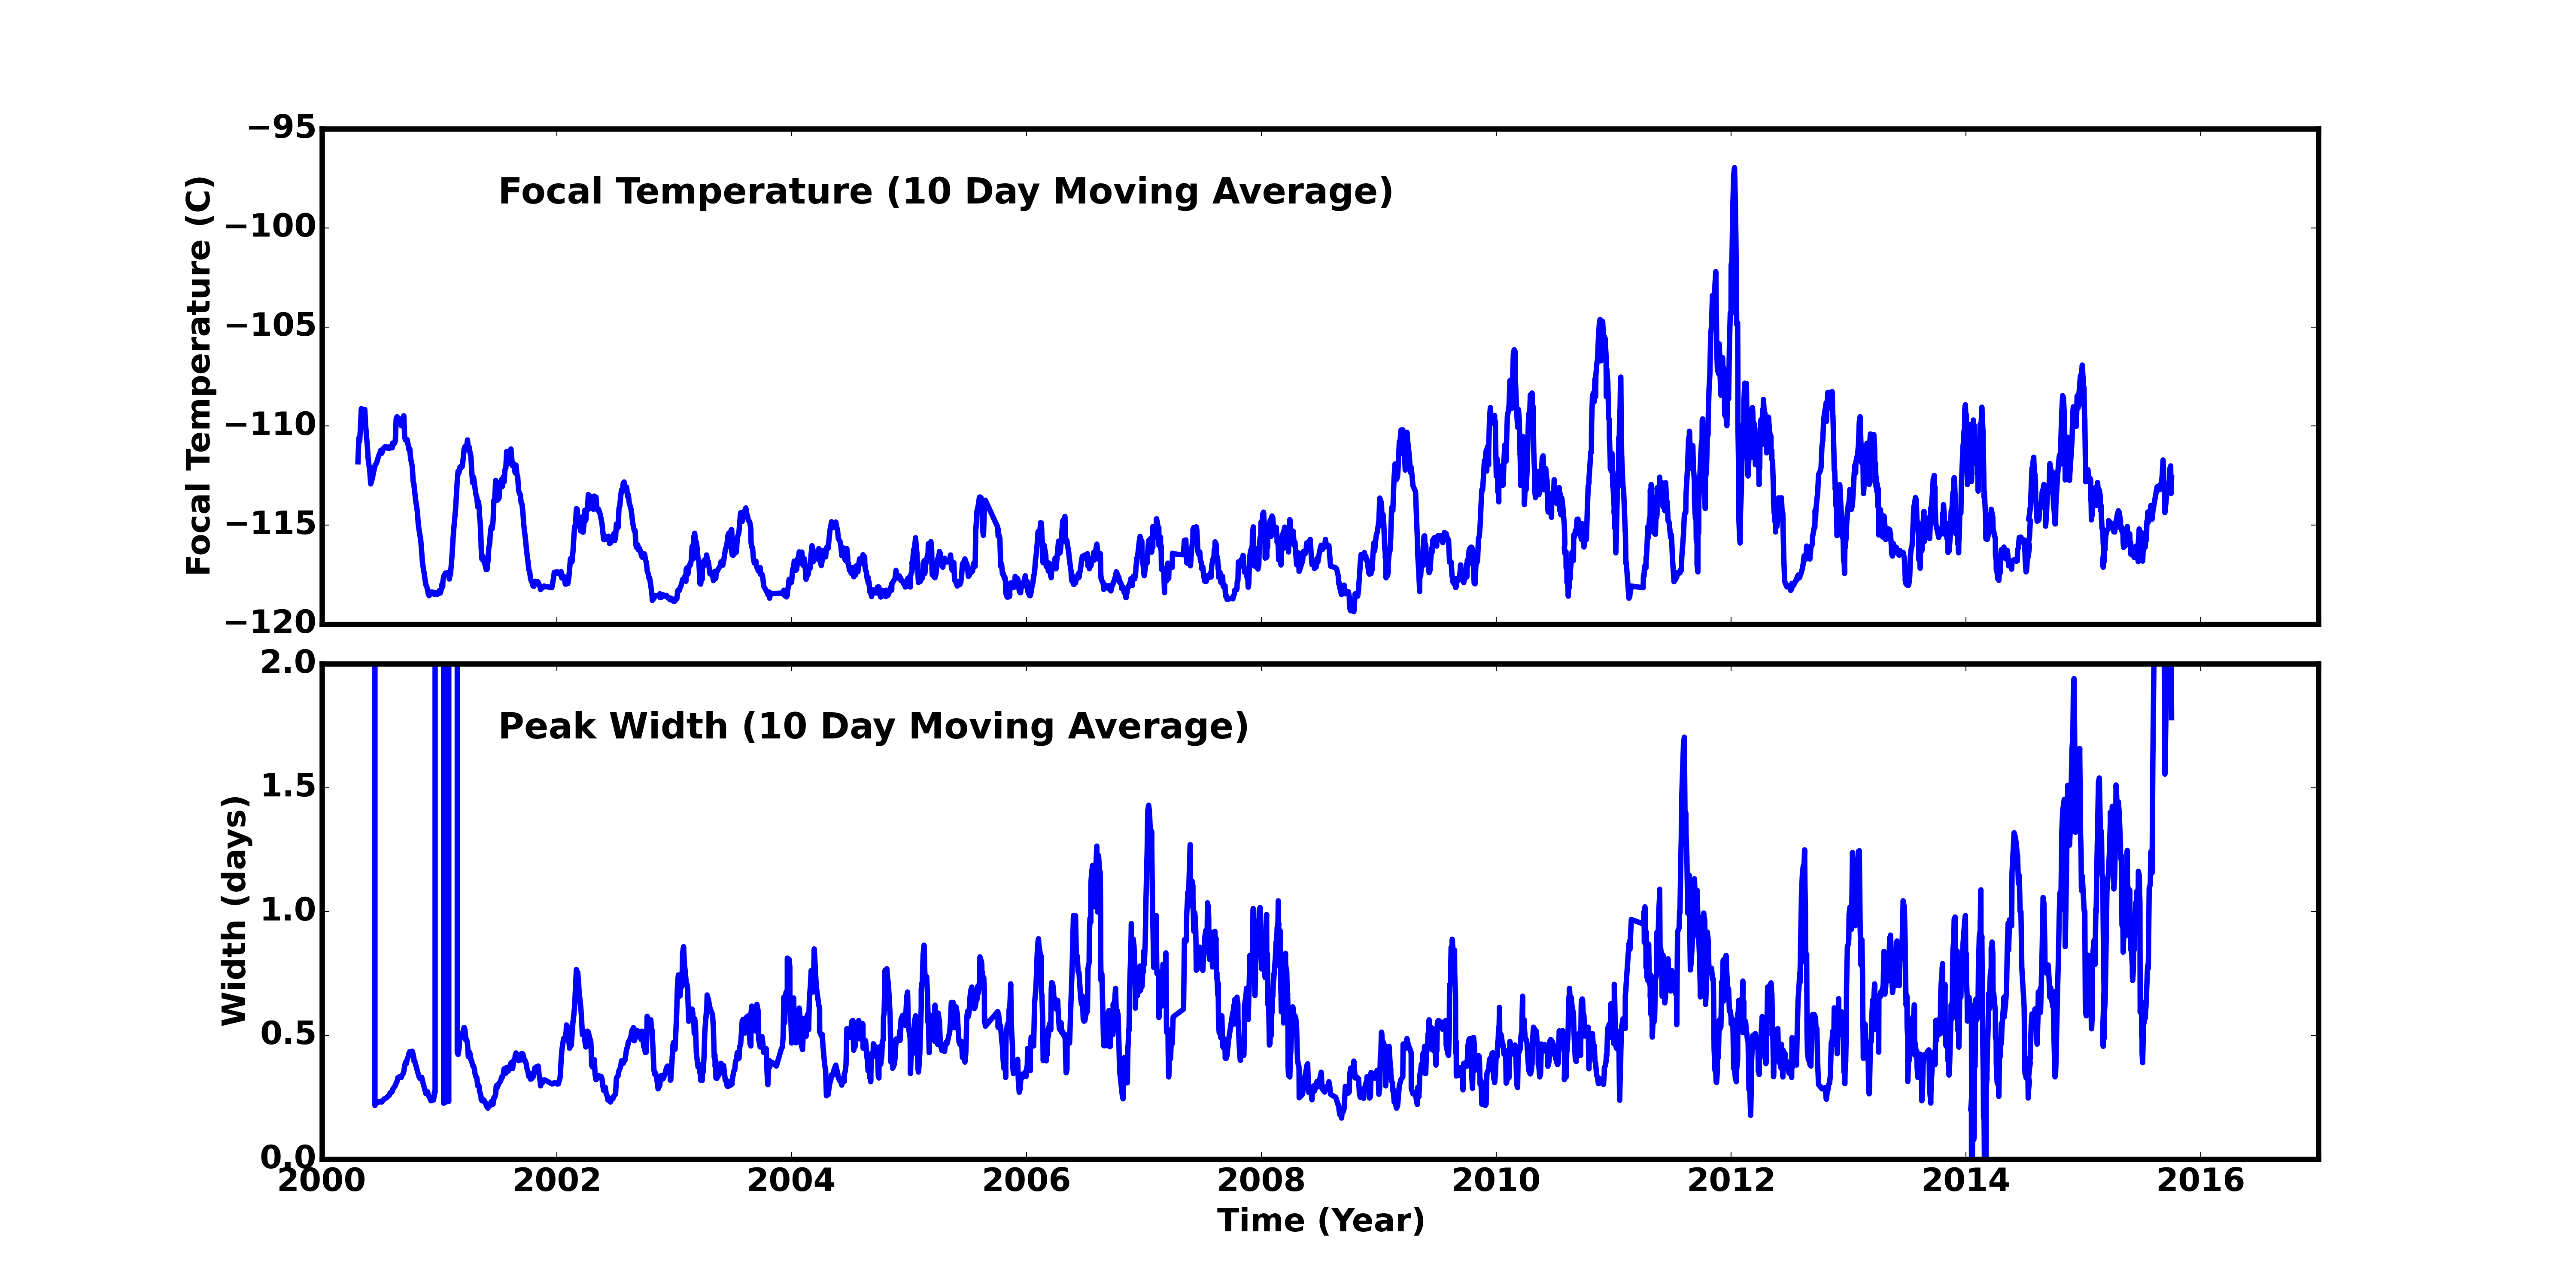
Focal Plane Temperature
Sep 2015 Focal Temperature
| The Mean (max) FPT: | |
|---|---|
| -112.33 | +/- 4.78 C |
| Mean Width: | |
| 1.76 | +/- 2.03 days |
Averaged Focal Plane Temperature
We are using 10 period moving averages to show trends of peak temperatures and peak widths. Note, the gaps in the width plot are due to missing/corrupted data.
Focal Plane Temperature, Sun Angle and Altitude
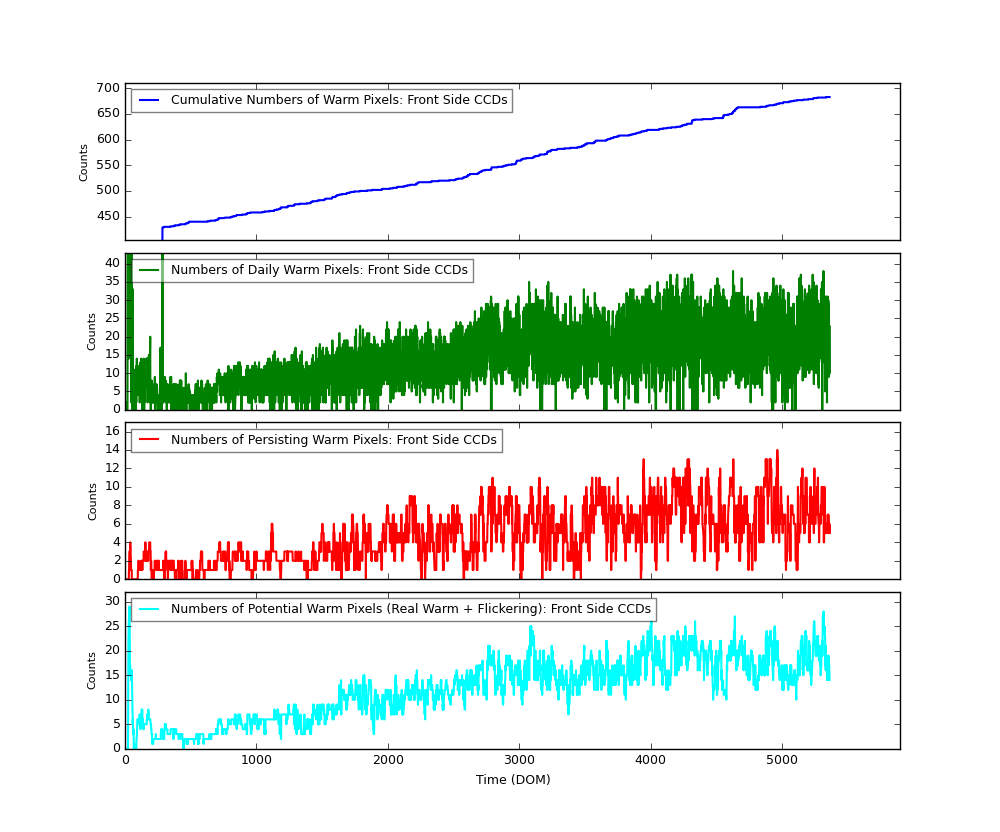
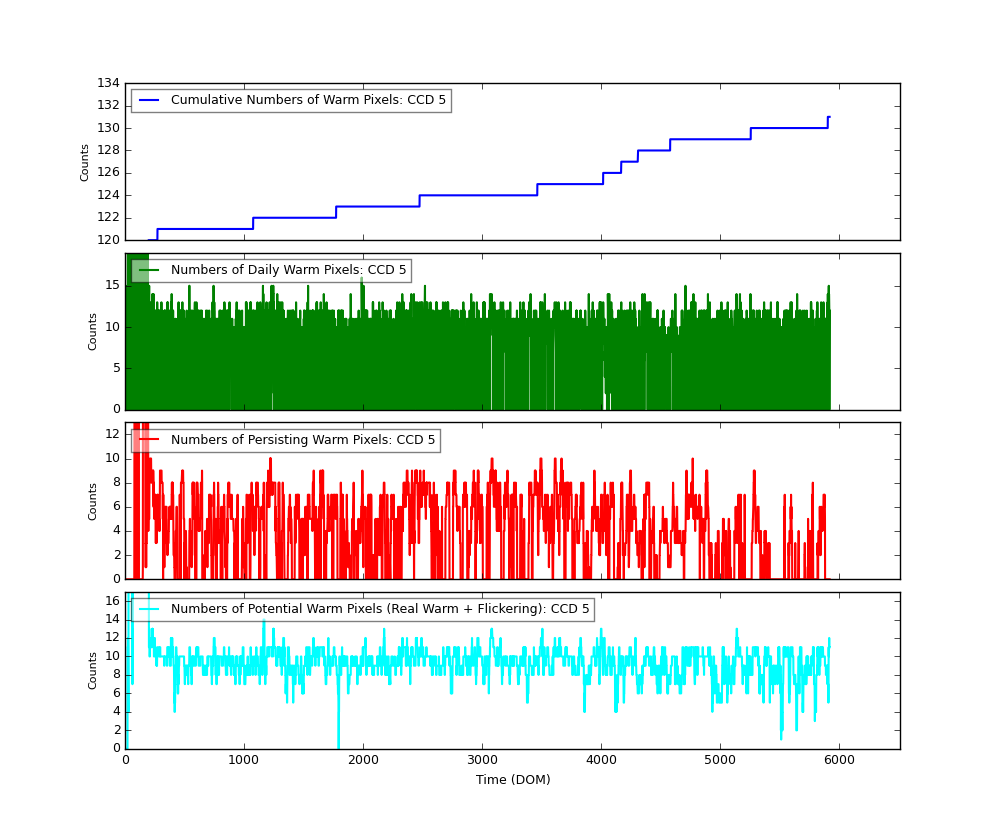
Bad Pixels
The plots below were generated with a new warm pixel finding script. Please see Acis Bad Pixel Page for details.
Front Side CCDs
Back Side CCD (CCD5)
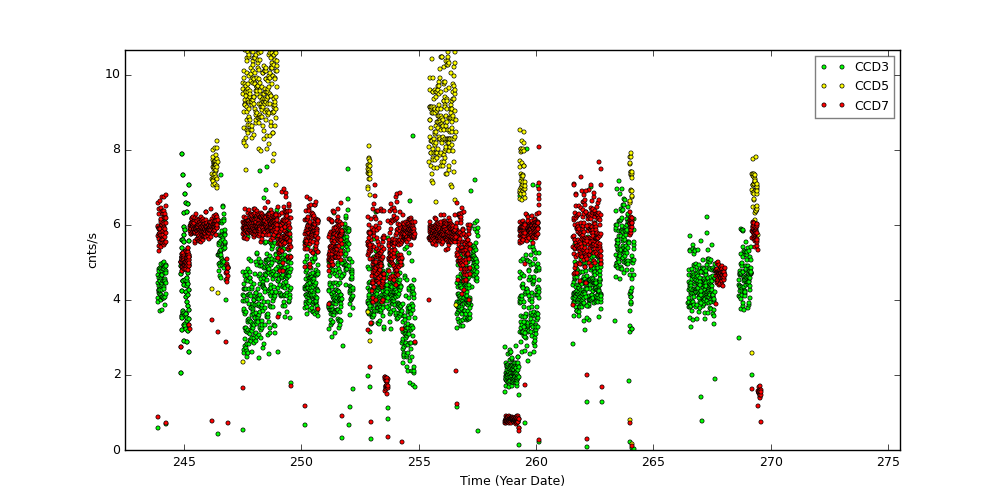
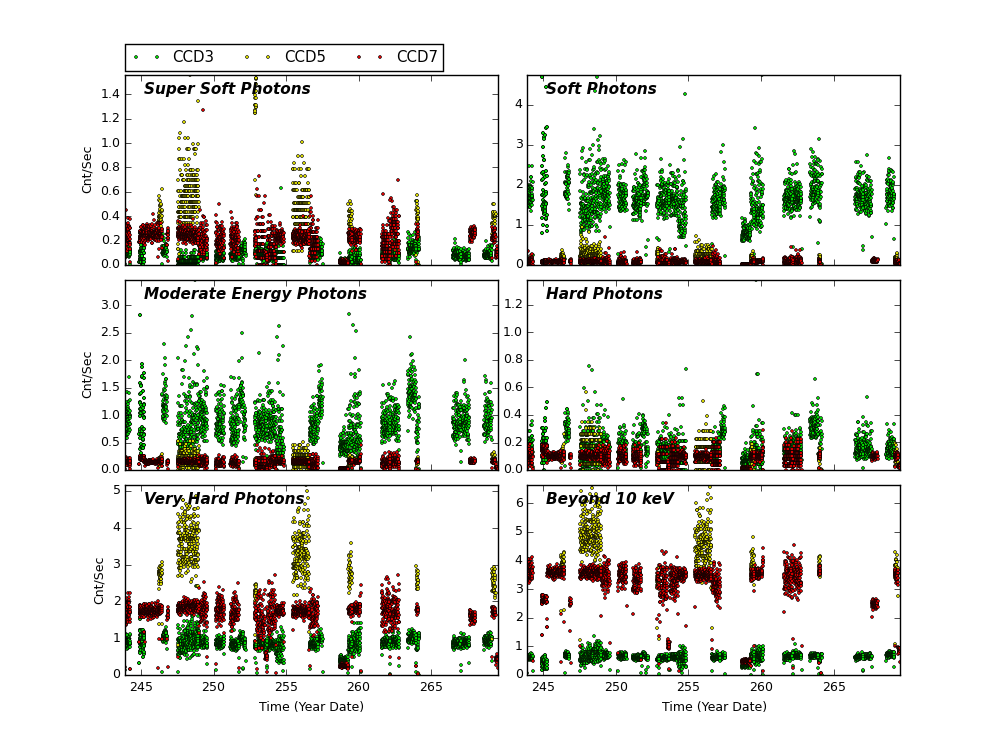
Science Instrument Background Rates
| Name | Low (keV) | High(KeV) | Description |
|---|---|---|---|
| SSoft | 0.00 | 0.50 | Super soft photons |
| Soft | 0.50 | 1.00 | Soft photons |
| Med | 1.00 | 3.00 | Moderate energy photons |
| Hard | 3.00 | 5.00 | Hard Photons |
| Harder | 5.00 | 10.00 | Very Hard photons |
| Hardest | 10.00 | Beyond 10 keV |
ACIS Rejected Events
The links below are plots of stat1 quantities, showing on-board rejected events. The average EVTSENT, DROP_AMP, DROP_POS, DROP_GRD, THR_PIX, and maximum BERR_SUM obtained from L1 acis*stat1.fits files are plotted for each observation. CTI observations are plotted separately from regular science observations.
Column definitions:
- EVTSENT - number of events sent in data record
- DROP_AMP - number of discarded events due to corrected amplitude
- DROP_POS - number of discarded events due to CCD position
- DROP_GRD - number of discarded events due to grade code
- THR_PIX - number of pixels above respective threshold level
- BERR_SUM - number of pixel bias errors so far in science run
Note the half-life decline of the CTI source is clearly evidenced in the steady janline of EVTSENT.
CCD3 CTI Observations
CCD3 Science Observations
CCD7 CTI Observations
CCD7 Science Observations
ACIS Gain Trends
We computed ACIS gain and offset from ACIS event1 files used in CTI computation, following the step described by C. Grant ACIS gain @ -120C page.
Instead computing gains and offsets from individual observations, we combined all data from each month and computed an monthly averaged gain and offset.
The following plots show CCD3 and CCD5 gains and offset trends.
| CCD 3 | |
)
|
)
|
| CCD 5 | |
)
|
)
|
HRC
DOSE of Central 4K Pore-Pairs
Please refer to Maximum Dose Trends for more details.
)
|
|---|
        IMAGE                NPIX      MEAN    STDDEV      MIN       MAX
HRCI_09_2015.fits          16777216   0.022    0.1582      0.0       10.0
)
        IMAGE                NPIX      MEAN    STDDEV      MIN       MAX
HRCI_08_1999_09_2015.fits  16777216   4.350    4.933       0.0       292.0
No Data
)
        IMAGE                NPIX     MEAN      STDDEV      MIN      MAX
HRCS_08_1999_09_2015.fits  16777216  15.747     27.909      0.0      1691.0
|
|
Max dose trend plots corrected for events that "pile-up"
in the center of the taps due to bad position information.
|
)
|
)
|
)
|
)
|
| Jun 2015 | Mar 2015 | Dec 2014 | Sep 2014 |
|---|
)
|
)
|
)
|
)
|
| Jun 2015 | Mar 2015 | Dec 2014 | Sep 2014 |
|---|
Gratings
Focus
We plot the width of the zero order streak of ACIS/HETG observations and the width of the zero order image for HRC/LETG observations of point sources. No significant defocusing trend is seen at this time. See Gratings Focus pages.
PCAD
ACA Trending
Gyro Bias Drift
Radiation History
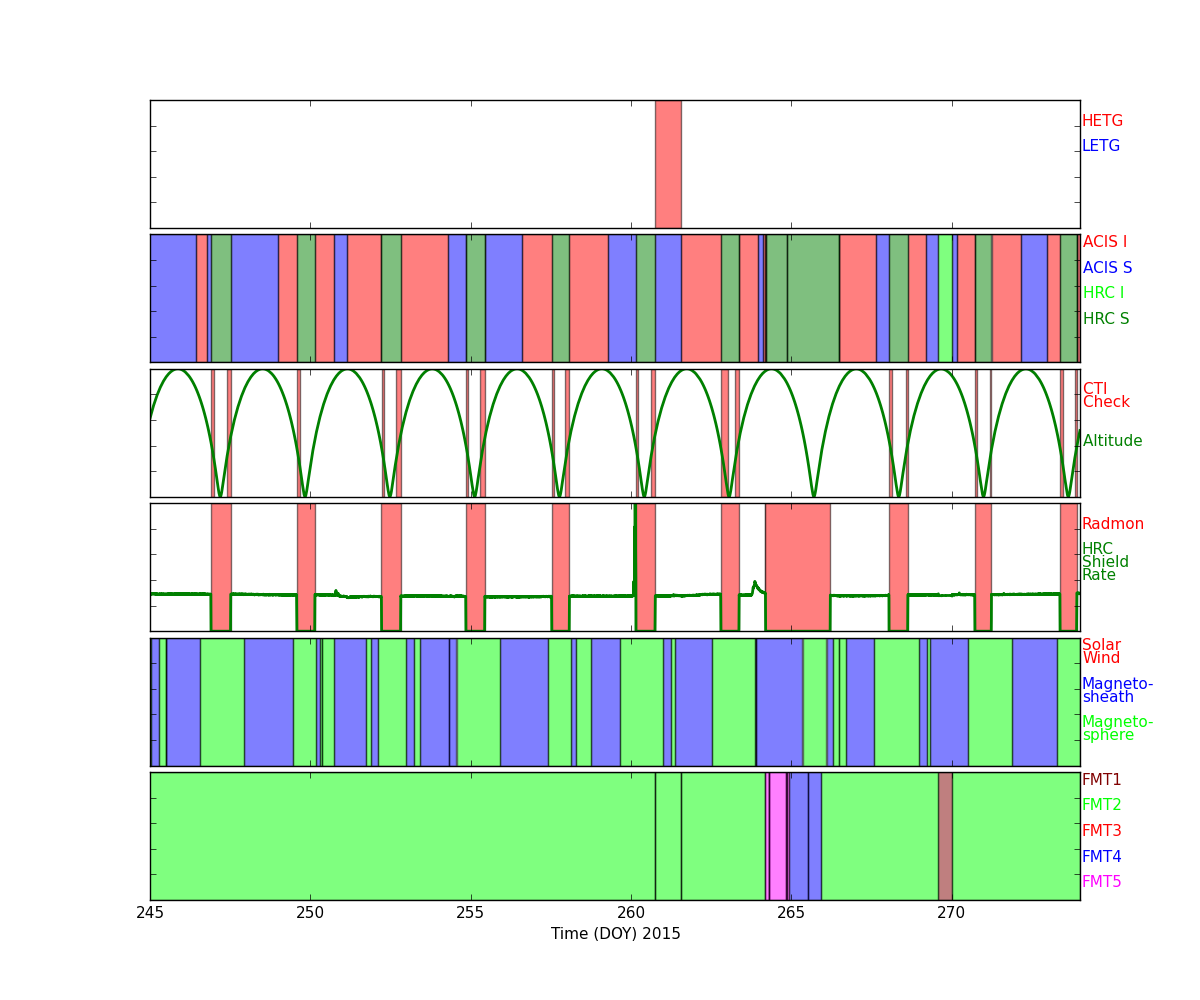
Radiation Zone Timing
Plotted below are radiation zone timing plots based on the following definitions of radiation zone:
- RADZONE - Ephin levels (in any of the E1300,P4GM,P41GM channels) are more than 1/3 of RADMON safing thresholds.
- RADMON - Radmon is disabled for radiation zone (as commanded based on OFLS model, for comparison with actual radiation levels).
- PERIGEE - Time of closest earth approach (for comparison)
Radiation Count Rates of Sep 2015
Sun Spot History
Trending
Critical Trends
| ACIS Temperatures - Daily Maximums | ||||||
|---|---|---|---|---|---|---|
| MSID | MEAN | RMS | DELTA/YR | DELTA/YR/YR | UNITS | DESCRIPTION |
| 1PDEAAT | 304.88 | 8.80 | -3.543e-01 | 2.807e-01 | K | PSMC DEA PS A TEMP |
| 1PIN1AT | 291.78 | 7.85 | -1.369e-01 | 2.463e-01 | K | PSMC TEMP 1A |
)
)
| HRMA Computed Averages - Daily Maximums | ||||||
|---|---|---|---|---|---|---|
| MSID | MEAN | RMS | DELTA/YR | DELTA/YR/YR | UNITS | DESCRIPTION |
| OBAAVG | 291.34 | 1.87 | 1.183e-01 | 1.570e+00 | TEMP | OBA/TFTE |
)
| EPHIN Temperatures - Daily Maximums | ||||||
|---|---|---|---|---|---|---|
| TEIO | 329.61 | 21.21 | 4.731e+00 | -8.006e+00 | K | EPHIN ELECTRONICS HOUSING TEMP |
| TEPHIN | 333.92 | 6.62 | -6.910e-01 | 4.284e+00 | K | EPHIN SENSOR HOUSING TEMP |
)
)
| S/C Main Temperatures - Daily Maximums | ||||||
|---|---|---|---|---|---|---|
| MSID | MEAN | RMS | DELTA/YR | DELTA/YR/YR | UNITS | DESCRIPTION |
| TCYLFMZM | 305.88 | 25.95 | 1.467e+00 | -4.189e+00 | K | CNT CYL TEMP:-Z SIDE UNDER LAE-1 |
| TCYLFMZP | 307.98 | 24.74 | 1.429e+00 | -3.986e+00 | K | CNT CYL TEMP:-Z SIDE UNDER LAE-2 |
)
)
| S/C Ancillary Temperatures - Daily Maximums | ||||||
|---|---|---|---|---|---|---|
| MSID | MEAN | RMS | DELTA/YR | DELTA/YR/YR | UNITS | DESCRIPTION |
| TFSSBKT1 | 344.68 | 18.32 | -4.833e+00 | 1.670e+01 | K | FSS BRACKET-1 TEMP (+Y) |
| TFSSBKT2 | 339.04 | 25.45 | -6.279e+00 | -3.153e+01 | K | FSS BRACKET-2 TEMP (+Y) |
| TSCTSF1 | 303.18 | 3.34 | 1.013e+00 | -1.733e+00 | K | SC-TS FITTING -1 TEMP |
| TSCTSF6 | 305.21 | 3.76 | 1.085e+00 | -4.657e-01 | K | SC-TS FITTING -6 TEMP |
)
)
)
)
| MUPS - Daily Maximums | ||||||
|---|---|---|---|---|---|---|
| MSID | MEAN | RMS | DELTA/YR | DELTA/YR/YR | UNITS | DESCRIPTION |
| PM1THV1T | 333.47 | 8.23 | -2.762e-01 | -1.892e+02 | K | MUPS 1 THRUSTER VALVE 01 TEMP |
| PLINE02T | 317.64 | 11.13 | 3.347e+00 | 5.826e+00 | K | PROP LINE TEMP 02 |
| PLINE03T | 316.64 | 13.64 | 3.278e+00 | 7.846e+00 | K | PROP LINE TEMP 03 |
| PLINE04T | 302.24 | 12.73 | 3.233e+00 | 7.055e+00 | K | PROP LINE TEMP 04 |
)
)
)
)
Quarterly Trends
- Spacecraft Electronics
| Previous Quarter | ||||||
| MSID | MEAN | RMS | DELTA/YR | DELTA/YR/YR | UNITS | DESCRIPTION |
| AWD1TQI | -0.17 | 3.933e-02 | 1.992e-02 | 2.237e+00 | AMP | WHEEL 1 TORQUE CURRENT |
| AWD2TQI | 0.10 | 3.642e-02 | 3.397e-02 | 2.004e+00 | AMP | WHEEL 2 TORQUE CURRENT |
| AWD3TQI | -0.23 | 4.784e-02 | -2.123e-01 | 1.581e+00 | AMP | WHEEL 3 TORQUE CURRENT |
| ELBI | 56.65 | 1.29 | 2.330e+00 | -2.568e+01 | AMP | LOAD BUS CURRENT |
| ELBV | 28.88 | 0.15 | -1.379e+00 | -7.587e+00 | V | LOAD BUS VOLTAGE |
| OHRMAPWR | 51.12 | 2.33 | 4.951e+00 | -3.408e+02 | W | HRMA COMPUTED TOTAL POWER |
| OOBAPWR | 46.58 | 2.50 | 3.222e+00 | -1.870e+02 | W | OBA COMPUTED TOTAL POWER |
)
)
)
)
)
)
)
- Spacecraft Electronics Side A
| Previous Quarter | ||||||
| MSID | MEAN | RMS | DELTA/YR | DELTA/YR/YR | UNITS | DESCRIPTION |
| CPCA5V | 5.24 | 1.073e-03 | -6.639e-04 | -1.783e-02 | V | +5V RCTU_PC A |
| CRXAV | 4.04 | 2.617e-03 | 2.766e-03 | -1.123e-03 | V | RECEIVER A SECONDARY VOLTAGE |
| CSITA15V | 15.46 | 4.881e-02 | -3.728e-02 | 1.772e+00 | V | +15V RCTU-SI TP-A |
| CTUA5V | 5.21 | 1.120e-02 | -3.360e-02 | 4.659e-01 | V | +5V CTU A |
| CUSOA28V | 24.49 | 1.942e-02 | 7.584e-02 | 1.005e+00 | V | +28V USO A |
)
)
)
)
)
- OBA Heaters
| Previous Quarter | ||||||
| MSID | MEAN | RMS | DELTA/YR | DELTA/YR/YR | UNITS | DESCRIPTION |
| OOBTHR06 | 291.70 | 0.85 | 4.430e+00 | -2.236e+01 | K | RT 29: HRMA STRUT |
| OOBTHR12 | 291.93 | 1.59 | 7.143e+00 | -6.610e+01 | K | RT 35: OBA CONE |
| OOBTHR18 | 293.57 | 1.66 | 7.466e+00 | -6.871e+01 | K | RT 40: OBA CONE |
| OOBTHR39 | 292.97 | 1.29 | 5.888e+00 | -4.091e+01 | K | RT 61: TFTE CONE |
| OOBTHR61 | 292.39 | 2.31 | 8.811e+00 | -1.126e+02 | K | RT 154: OBA CONE |
)
)
)
)
)
Envelope Trending
Spacecraft Anc Temperature
Spacecaft Main Temperature
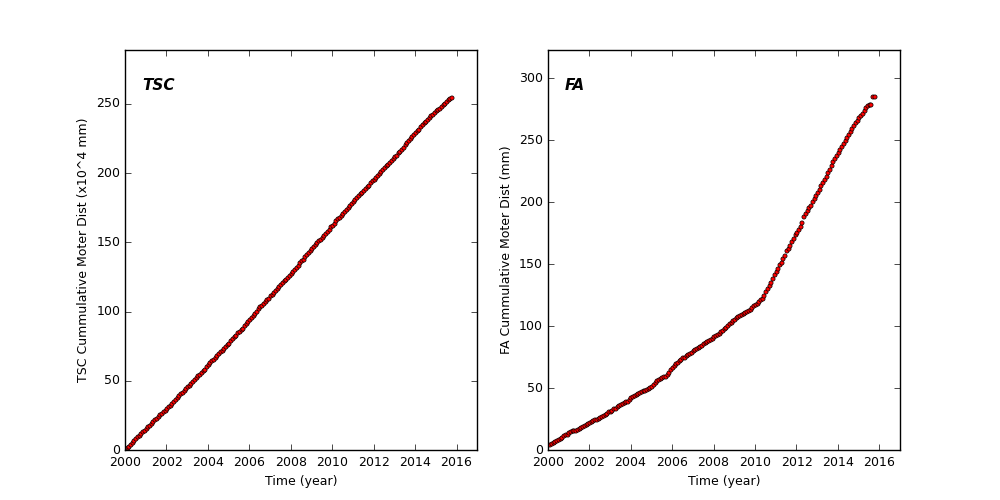
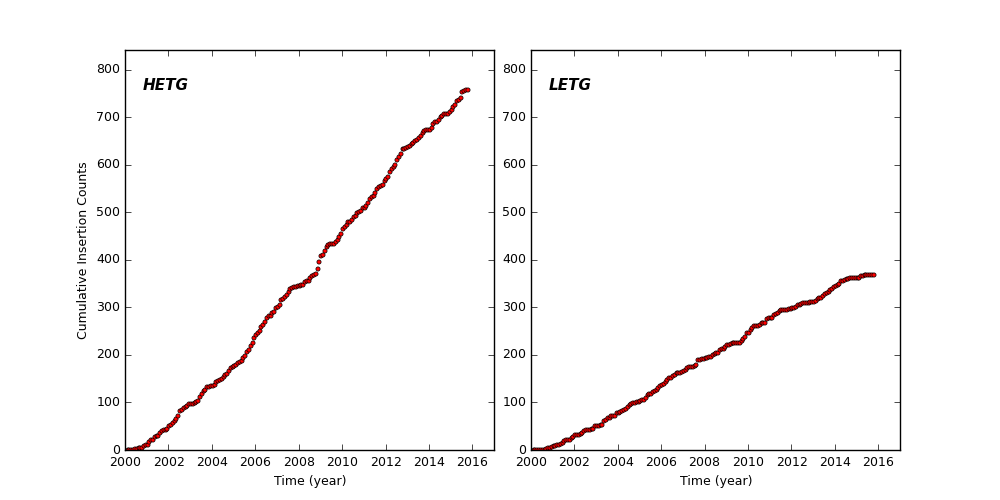
Spacecraft Motions
TSC and FA Cummulative Moter Distance
HETG and LETG Cummulative Insertion Counts
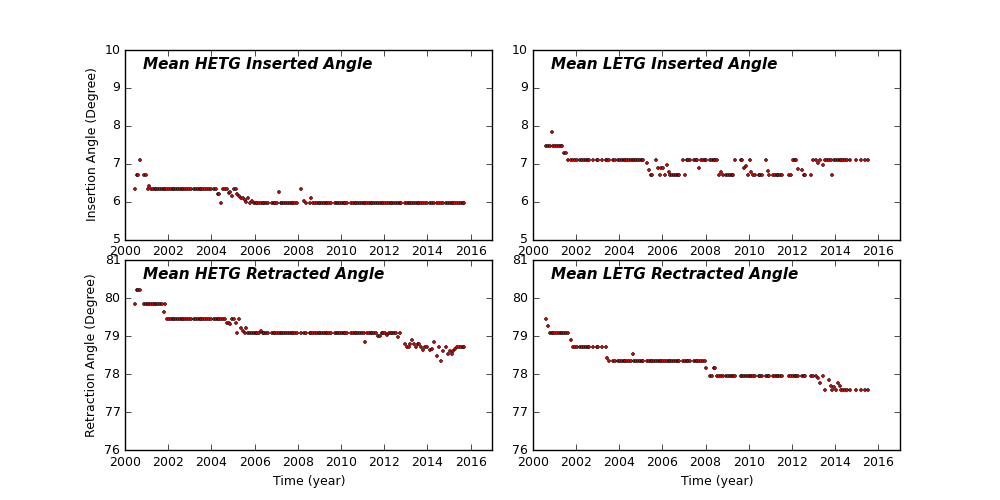
HETG/LETG Insertion/Retraction Angle
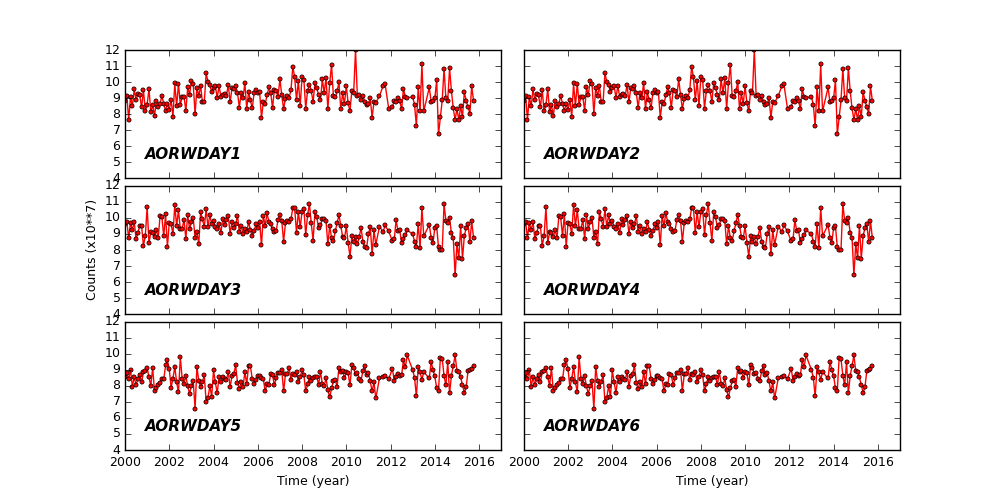
Reaction Wheel Rotations
Links to Past Monthly Reports
| Year | Month | |||||||||||
|---|---|---|---|---|---|---|---|---|---|---|---|---|
| 2015 | Jan | Feb | Mar | Apr | May | Jun | Jul | Aug | ||||
| 2014 | Jan | Feb | Mar | Apr | May | Jun | Jul | Aug | Sep | Oct | Nov | Dec |
| 2013 | Jan | Feb | Mar | Apr | May | Jun | Jul | Aug | Sep | Oct | Nov | Dec |
| 2012 | Jan | Feb | Mar | Apr | May | Jun | Jul | Aug | Sep | Oct | Nov | Dec |
| 2011 | Jan | Feb | Mar | Apr | May | Jun | Jul | Aug | Sep | Oct | Nov | Dec |
| 2010 | Jan | Feb | Mar | Apr | May | Jun | Jul | Aug | Sep | Oct | Nov | Dec |
| 2009 | Jan | Feb | Mar | Apr | May | Jun | Jul | Aug | Sep | Oct | Nov | Dec |
| 2008 | Jan | Feb | Mar | Apr | May | Jun | Jul | Aug | Sep | Oct | Nov | Dec |
| 2007 | Jan | Feb | Mar | Apr | May | Jun | Jul | Aug | Sep | Oct | Nov | Dec |
| 2006 | Jan | Feb | Mar | Apr | May | Jun | Jul | Aug | Sep | Oct | Nov | Dec |
| 2005 | Jan | Feb | Mar | Apr | May | Jun | Jul | Aug | Sep | Oct | Nov | Dec |
| 2004 | Jan | Feb | Mar | Apr | May | Jun | Jul | Aug | Sep | Oct | Nov | Dec |
| 2003 | Jan | Feb | Mar | Apr | May | Jun | Jul | Aug | Sep | Oct | Nov | Dec |
| 2002 | Jan | Feb | Mar | Apr | May | Jun | Jul | Aug | Sep | Oct | Nov | Dec |
| 2001 | Jan | Feb | Mar | Apr | May | Jun | Jul | Aug | Sep | Oct | Nov | Dec |
| 2000 | Jan | Feb | Mar | Apr | May | Jun | Jul | Aug | Sep | Oct | Nov | Dec |
| 1999 | Jul | Aug | Sep | Oct | Nov | Dec | ||||||