ACIS
ACIS DOSE Registered-Photon-Map
The steps we took to compute the dose map are;
- Level 1 Event files for a specified month are obtained from archive.
- Image data including I2, I3, S2, S3 CCDs are extracted from all event files.
- All the extracted image data were merged to create a month long exposure map for the month.
- The exposure map is opened with ds9, and check a distribution of count rates against energy. From this, estimate the upper threshold value. Any events beyond this upper threshold are assumed erroneous events such as bad pixels.
- Using this upper threshold, the data is filtered, and create a cleaned exposure map for the month.
- The exposure map from each month from the Sep 1999 is added up to create a cumulative exposure map for each month.
- Using fimgstatistic, we compute count rate statistics for each CCDs.
- For observations with high data drop rates (e.g., Crab nebula, Cas A), we corrected the observations by adding events.
Please check more detail plots at Telemetered Photon Dose Trend page.
)
)
)
Statistics:
# IMAGE     NPIX     MEAN        RMS        MIN     MAX
ACIS_oct15 6004901  5.779       9.293       0.0     2601


I2 node 0  262654   7.901992    3.420485    0.0      66.0
I2 node 1  262654   8.374425    3.916951    0.0     543.0
I2 node 2  262654   8.243651    3.502990    0.0      77.0
I2 node 3  262654   8.349630   10.687899    0.0    2220.0

I3 node 0  262654   8.782457    4.560655    0.0      53.0
I3 node 1  262654   8.255745    7.760348    0.0     922.0
I3 node 2  262654   7.662469    3.504766    0.0      71.0
I3 node 3  262654   7.631104    6.258767    0.0    2601.0

S2 node 0  262654   5.752382    4.120810    0.0     512.0
S2 node 1  262654   5.808240    4.334957    0.0     579.0
S2 node 2  262654   5.873280    5.256345    0.0    1130.0
S2 node 3  262654   5.781927    3.992298    0.0     574.0

S3 node 0  262654   8.010474   12.237298    0.0     373.0
S3 node 1  262654   8.423035    3.879475    0.0     127.0
S3 node 2  262654   8.170964    3.519084    0.0     168.0
S3 node 3  262654   7.420580    3.268850    0.0     146.0
)
)
)
Statistics:
 IMAGE     NPIX      MEAN        RMS          MIN      MAX
ACIS_total 6004901   1960.164    2561.575     0.0   112584


I2 node 0  262654   1660.079165  318.456225  329.0   9228.0
I2 node 1  262654   1749.128661  439.940733  360.0  43904.0
I2 node 2  262654      8.243651    3.502990    0.0     77.0
I2 node 3  262654   1780.211568  449.483724  340.0  28171.0

I3 node 0  262654   1871.799821  447.913359  332.0   7284.0
I3 node 1  262654   1961.136581 1479.198320  341.0  37061.0
I3 node 2  262654   1713.225154  308.293441  325.0   9007.0
I3 node 3  262654      7.631104    6.258767    0.0   2601.0

S2 node 0  262654   2287.686573  332.883845 1215.0  21342.0
S2 node 1  262654      5.808240    4.334957    0.0    579.0
S2 node 2  262654   2685.309207  513.765522 1640.0  27302.0
S2 node 3  262654   2623.391180  372.282104 1546.0  45071.0

S3 node 0  262654   4057.173296 1831.780013 1690.0  13797.0
S3 node 1  262654   5279.283462 2132.023858    0.0  14259.0
S3 node 2  262654   4061.742724 1041.168214 1669.0   9811.0
S3 node 3  262654   3130.586099  476.503683 1796.0  10635.0
)
|
)
|
)
|
)
|
| Jul 2015 | Apr 2015 | Jan 2015 | Oct 2014 |
|---|
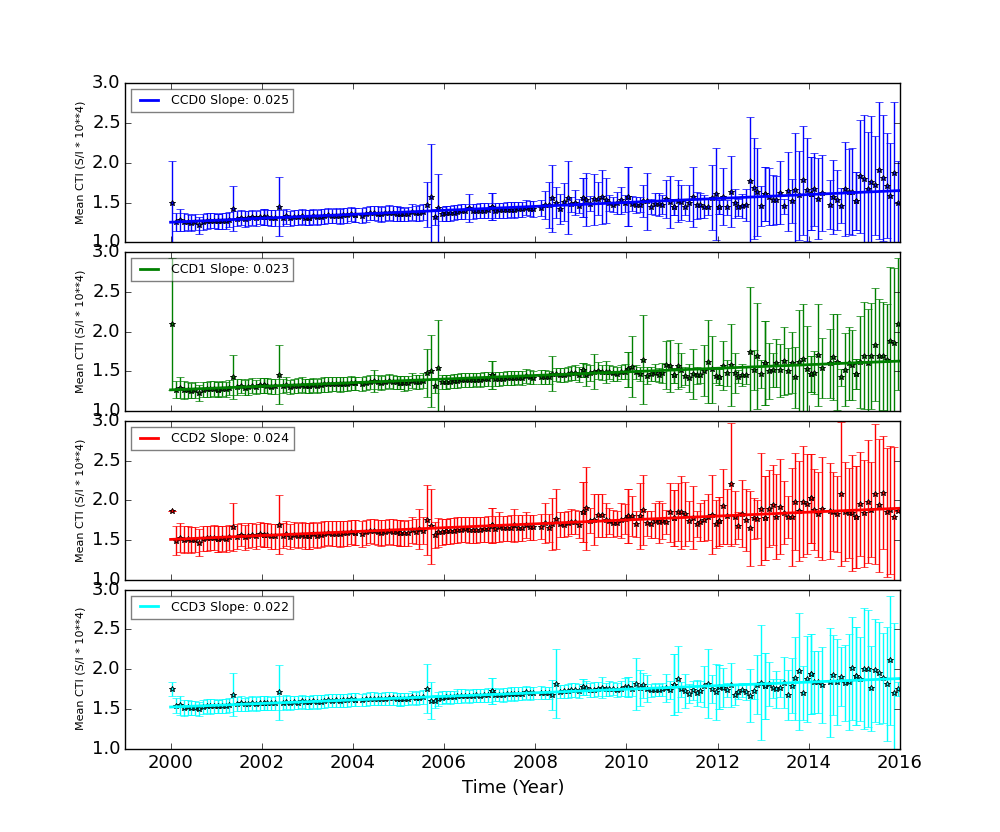
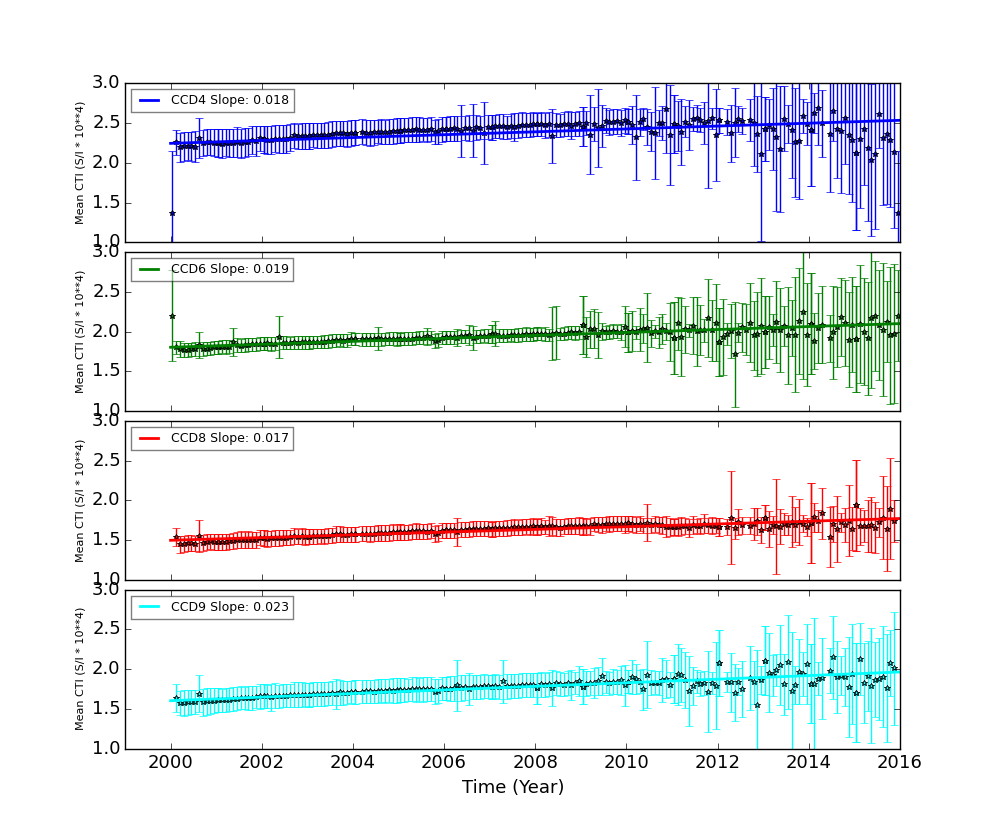
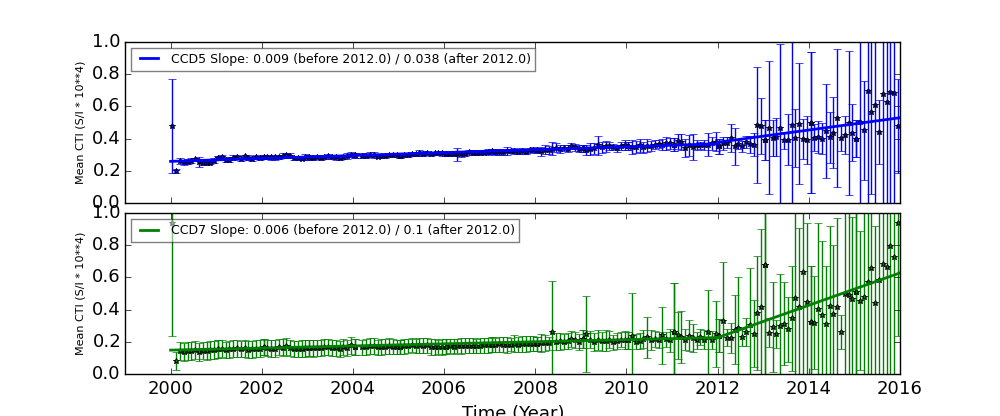
The Mean Detrended CTI
We report CTIs with a refined data definition. CTIs were computed for the temperature dependency corrected data. Please see CTI page for detailed explanation. CTI's are computed for Mn K alpha, and defined as slope/intercept x10^4 of row # vs ADU. Data file: here
Imaging CCDs
Spectral CCDs
Backside CCDs
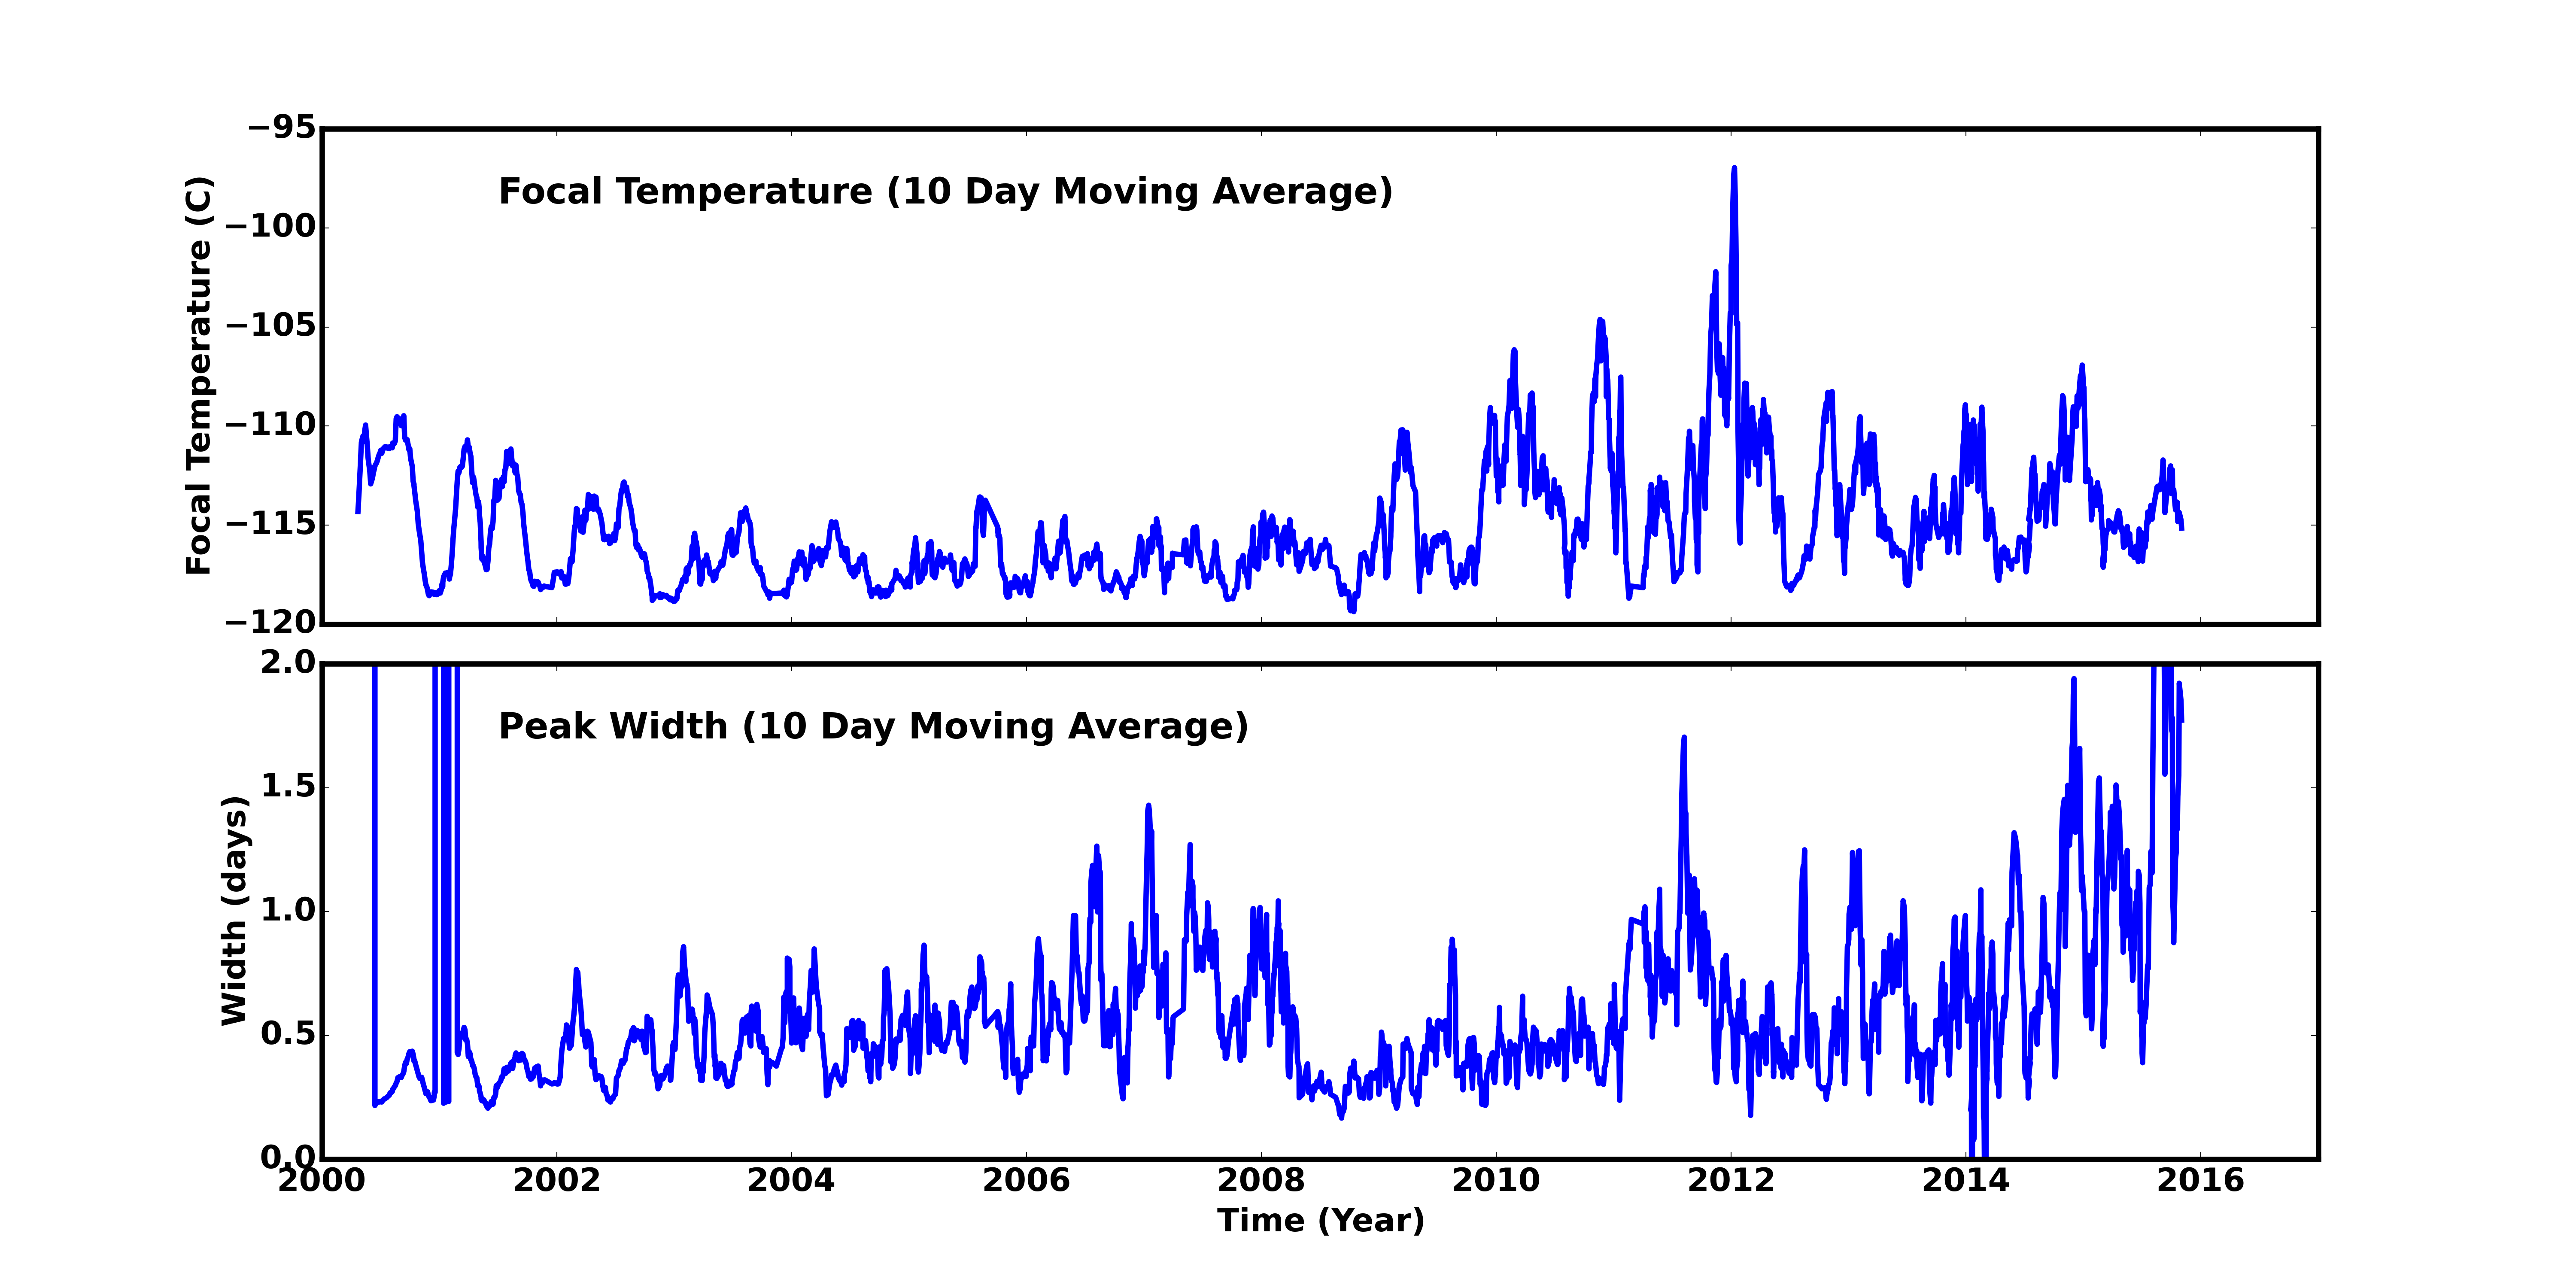
Focal Plane Temperature
Sep 2015 Focal Temperature
| The Mean (max) FPT: | |
|---|---|
| -114.94 | +/- 1.83 C |
| Mean Width: | |
| 1.55 | +/- 1.30 days |
Averaged Focal Plane Temperature
We are using 10 period moving averages to show trends of peak temperatures and peak widths. Note, the gaps in the width plot are due to missing/corrupted data.
Focal Plane Temperature, Sun Angle and Altitude
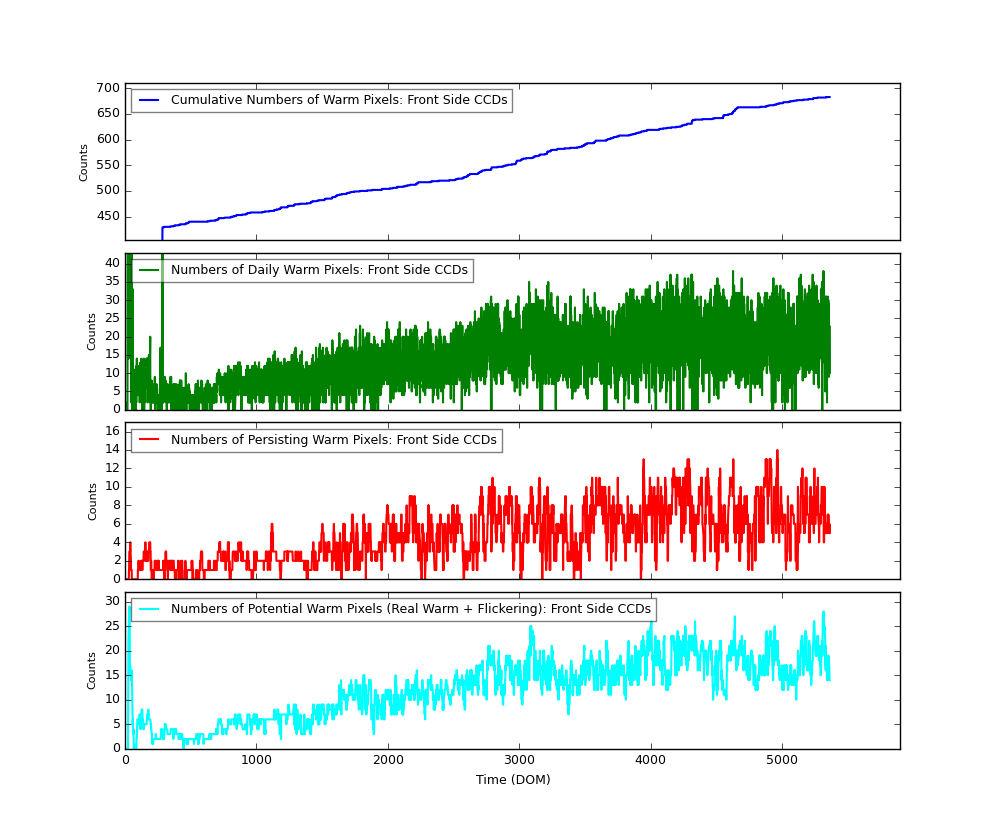
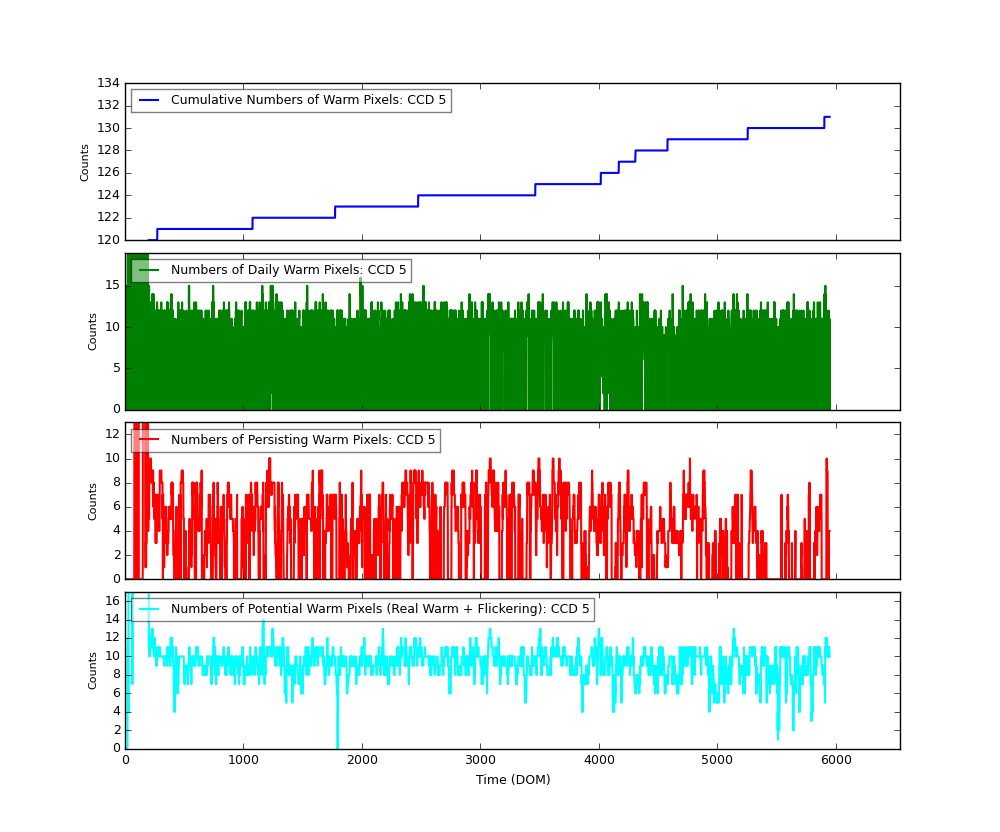
Bad Pixels
The plots below were generated with a new warm pixel finding script. Please see Acis Bad Pixel Page for details.
Front Side CCDs
Back Side CCD (CCD5)
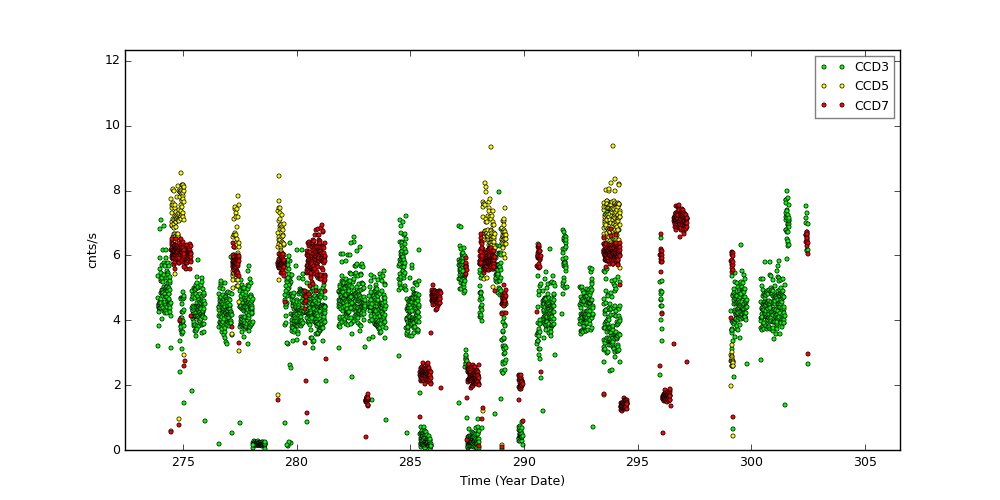
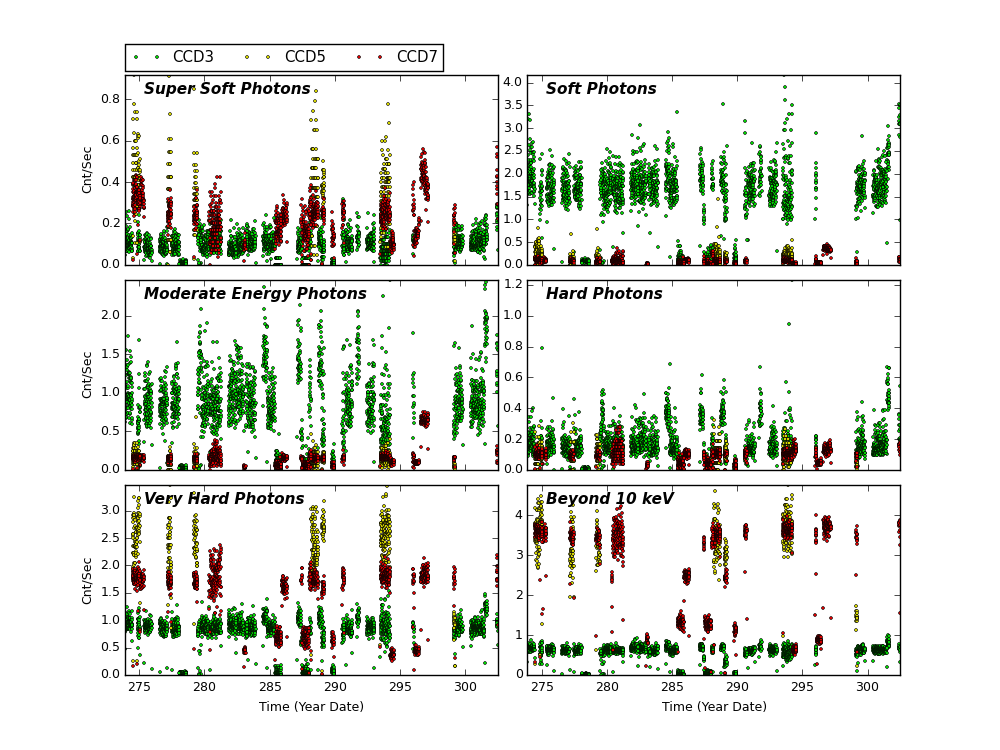
Science Instrument Background Rates
| Name | Low (keV) | High(KeV) | Description |
|---|---|---|---|
| SSoft | 0.00 | 0.50 | Super soft photons |
| Soft | 0.50 | 1.00 | Soft photons |
| Med | 1.00 | 3.00 | Moderate energy photons |
| Hard | 3.00 | 5.00 | Hard Photons |
| Harder | 5.00 | 10.00 | Very Hard photons |
| Hardest | 10.00 | Beyond 10 keV |
HRC
DOSE of Central 4K Pore-Pairs
Please refer to Maximum Dose Trends for more details.
)
|
|---|
        IMAGE                NPIX      MEAN    STDDEV      MIN       MAX
HRCI_10_2015.fits          16777216   0.007    0.0894      0.0       6.0
)
        IMAGE                NPIX      MEAN    STDDEV      MIN       MAX
HRCI_08_1999_10_2015.fits  16777216   4.357    4.943       0.0       292.0
)
     IMAGE                NPIX      MEAN    STDDEV      MIN       MAX
HRCS_10_2015.fits         16777216  0.073    0.4645     0.0        37.0
)
        IMAGE                NPIX     MEAN      STDDEV      MIN      MAX
HRCS_08_1999_10_2015.fits  16777216  15.819     28.131      0.0      1691.0
|
|
Max dose trend plots corrected for events that "pile-up"
in the center of the taps due to bad position information.
|
)
|
)
|
)
|
)
|
| Jul 2015 | Apr 2015 | Jan 2015 | Oct 2014 |
|---|
)
|
)
|
)
|
)
|
| Jul 2015 | Apr 2015 | Jan 2015 | Oct 2014 |
|---|
adiation Count Rates of Oct 2015
Focus
We plot the width of the zero order streak of ACIS/HETG observations and the width of the zero order image for HRC/LETG observations of point sources. No significant defocusing trend is seen at this time. See Gratings Focus pages.
Gratings Resolving Power
We plot E/dE vs. E for fits to detected lines with fwhm_error/fwhm less than 0.15 for the plus and minus arms of HEG, MEG, and LEG. Also shown are conservative (dotted line) and optimistic (dashed line) pre-launch resolving power expectations.
We have selected only calibration observations of Capella, HR1099, and Sigma Gem. See MIT technotes for a parallel analysis.
| Plot symbol indicates dispersion arm: | Color indicates observation date: |
Minus side = cross (x) |
2002-2004 blue 2005-2006 yellow 2007-2009 orange |
PCAD
ACA Trending
Gyro Bias Drift
Radiation History
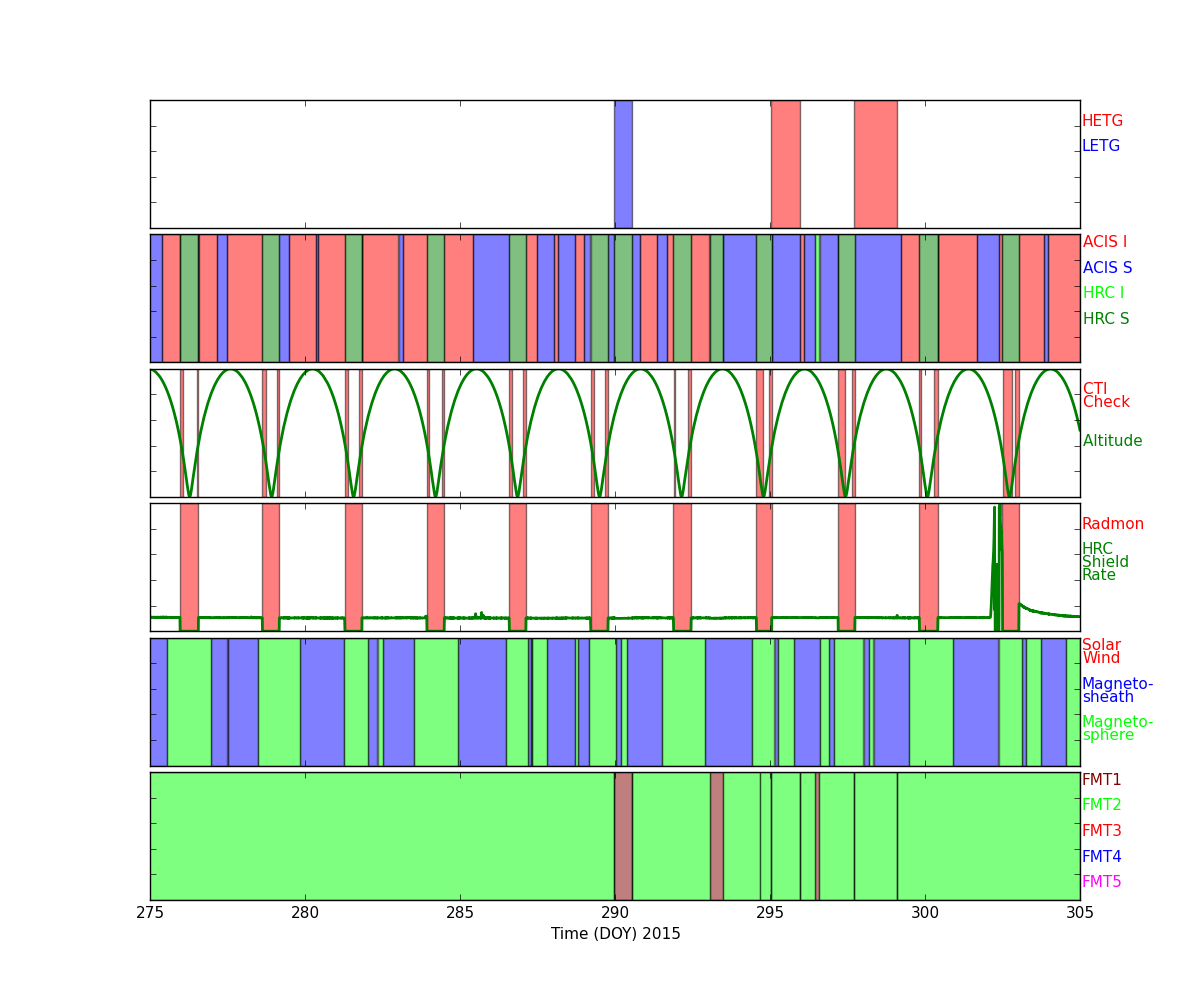
Radiation Zone Timing
Plotted below are radiation zone timing plots based on the following definitions of radiation zone:
- RADZONE - Ephin levels (in any of the E1300,P4GM,P41GM channels) are more than 1/3 of RADMON safing thresholds.
- RADMON - Radmon is disabled for radiation zone (as commanded based on OFLS model, for comparison with actual radiation levels).
- PERIGEE - Time of closest earth approach (for comparison)
Radiation Count Rates of Oct 2015
Sun Spot History
SIM
SIM Shift and Twist
SIM Shift and Twist Trend The following plots show trends of SIM shifts (dy and dz) and twist (dtheta). All quantities are directly taken from pcaf*_asol1.fits files. The units are mm for dy and dz, and degree for dtheta. We fit three lines separated before and after (Days of Mission)= 1400 (May 21, 2003), 2700 (Dec 11, 2006), and 4400 (Aug 07, 2011). The unit of slopes are mm per day or degree per day.
The sudden shift around DOM = 1400, 2700 and 4400 are due to fid light drift (see a memo by Aldcroft fiducial light drift). On the dtheta plot, two tracks are clearly observed. The track around 0.01 is due to HRC-I, and all others are clustered around -0.002. For more detail, please see SIM Shift and Twist Trend page
Trending
Quarterly Trends
- HRMA Heaters
| Previous Quarter | ||||||
| MSID | MEAN | RMS | DELTA/YR | DELTA/YR/YR | UNITS | DESCRIPTION |
| OHRTHR02 | 295.30 | 4.870e-03 | -1.704e-02 | 6.265e-02 | K | RT 2: HRMA FORWARD APERTURE PLATE |
| OHRTHR09 | 294.47 | 5.785e-02 | 7.418e-03 | -4.300e-01 | K | RT 105: HRMA CAP |
| OHRTHR23 | 295.25 | 6.007e-03 | -5.470e-02 | 2.801e-02 | K | RT 8: HRMA PRECOLLIMATOR PLATE 10 |
| OHRTHR44 | 295.29 | 4.328e-03 | -1.110e-02 | -1.577e-01 | K | RT 1: HRMA FORWARD APERTURE PLATE |
| OHRTHR59 | 295.30 | 3.843e-03 | -5.457e-03 | 2.027e-02 | K | RT 119: HRMA PRECOLLIMATOR PLATE 10 |
)
)
)
)
)
- HRMA Thermal
| Previous Quarter | ||||||
| MSID | MEAN | RMS | DELTA/YR | DELTA/YR/YR | UNITS | DESCRIPTION |
| 4RT568T | 292.57 | 1.18 | 3.489e-01 | -1.404e+01 | K | RT 568 - HRMA TEMP |
| 4RT569T | 294.49 | 0.14 | -1.688e-01 | 3.722e+00 | K | RT 569 - HRMA TEMP |
| 4RT570T | 294.40 | 5.698e-02 | 8.595e-03 | -7.656e-01 | K | RT 570 - HRMA TEMP |
| 4RT575T | 295.61 | 1.57 | -1.849e-01 | -3.491e+00 | K | RT 575 - OB CONE TEMP |
| 4RT577T | 296.22 | 2.75 | 4.637e-01 | -2.795e+01 | K | RT 577 - OB CONE TEMP |
| 4RT578T | 293.72 | 2.40 | 9.599e-01 | -2.949e+01 | K | RT 578 - OB CONE TEMP |
)
)
)
)
)
)
- OB Forward Bulck Head Temperature
| Previous Quarter | ||||||
| MSID | MEAN | RMS | DELTA/YR | DELTA/YR/YR | UNITS | DESCRIPTION |
| 4RT700T | 296.34 | 1.60 | -2.650e-01 | -1.507e+00 | K | RT 700 - OB BULKHEAD TEMP |
| 4RT701T | 293.83 | 1.41 | 2.421e-02 | -1.001e+01 | K | RT 701 - OB BULKHEAD TEMP |
| 4RT706T | 284.71 | 1.14 | 3.156e-01 | -1.581e+01 | K | RT 706 - OB BULKHEAD TEMP |
| 4RT707T | 287.33 | 1.17 | 4.134e-01 | -1.587e+01 | K | RT 707 - OB BULKHEAD TEMP |
)
)
)
)
Envelope Trending
SIM Temperature
Spacecaft Electronics
Spacecraft Motions
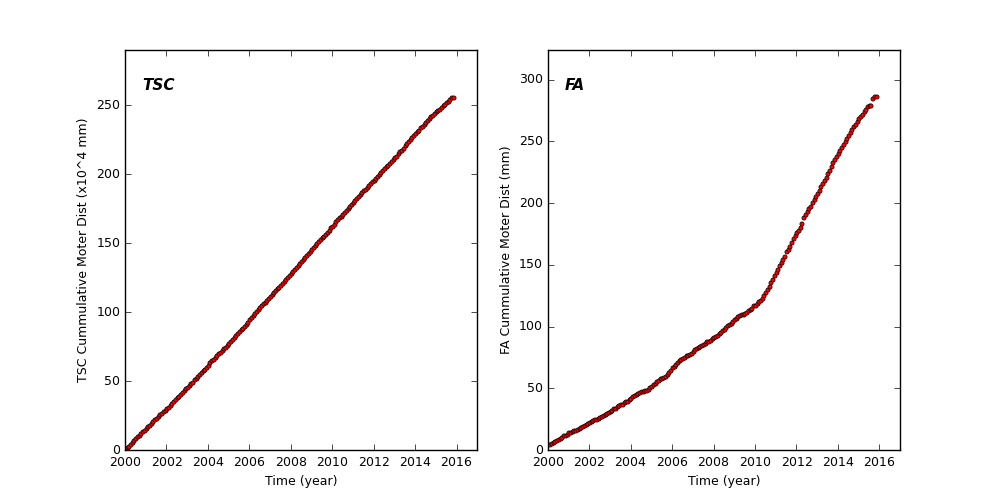
TSC and FA Cummulative Moter Distance
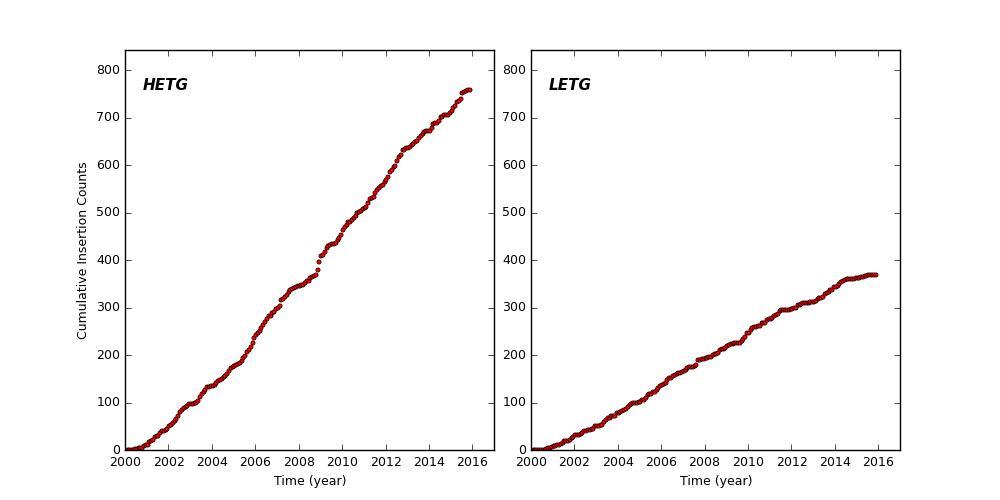
HETG and LETG Cummulative Insertion Counts
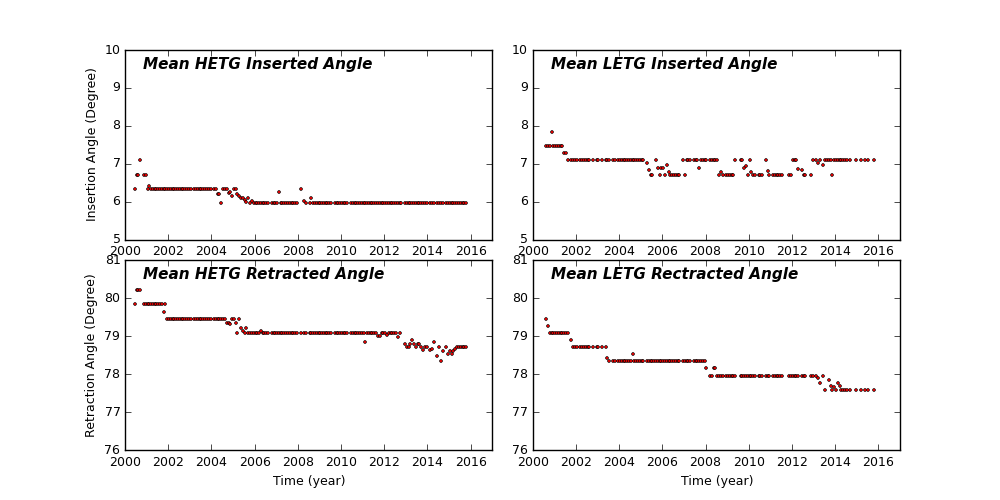
HETG/LETG Insertion/Retraction Angle
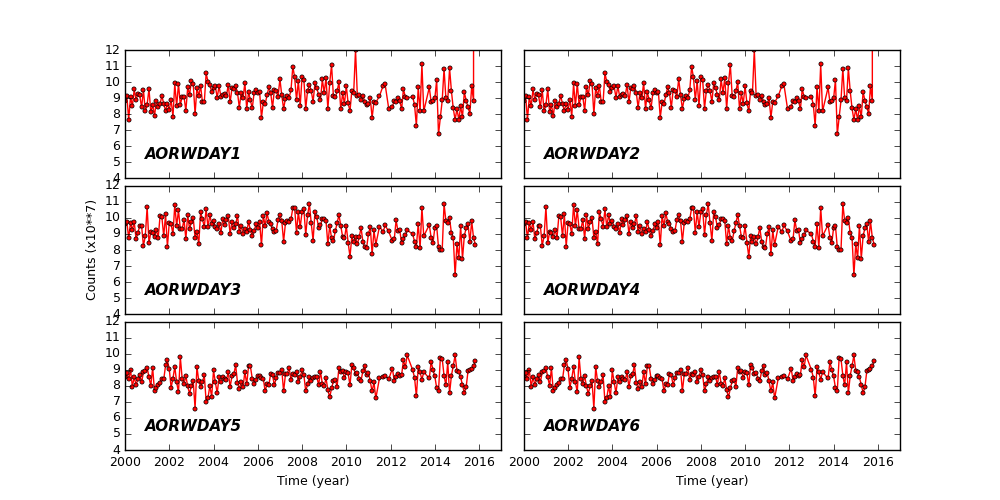
Reaction Wheel Rotations
Links to Past Monthly Reports
| Year | Month | |||||||||||
|---|---|---|---|---|---|---|---|---|---|---|---|---|
| 2015 | Jan | Feb | Mar | Apr | May | Jun | Jul | Aug | Sep | |||
| 2014 | Jan | Feb | Mar | Apr | May | Jun | Jul | Aug | Sep | Oct | Nov | Dec |
| 2013 | Jan | Feb | Mar | Apr | May | Jun | Jul | Aug | Sep | Oct | Nov | Dec |
| 2012 | Jan | Feb | Mar | Apr | May | Jun | Jul | Aug | Sep | Oct | Nov | Dec |
| 2011 | Jan | Feb | Mar | Apr | May | Jun | Jul | Aug | Sep | Oct | Nov | Dec |
| 2010 | Jan | Feb | Mar | Apr | May | Jun | Jul | Aug | Sep | Oct | Nov | Dec |
| 2009 | Jan | Feb | Mar | Apr | May | Jun | Jul | Aug | Sep | Oct | Nov | Dec |
| 2008 | Jan | Feb | Mar | Apr | May | Jun | Jul | Aug | Sep | Oct | Nov | Dec |
| 2007 | Jan | Feb | Mar | Apr | May | Jun | Jul | Aug | Sep | Oct | Nov | Dec |
| 2006 | Jan | Feb | Mar | Apr | May | Jun | Jul | Aug | Sep | Oct | Nov | Dec |
| 2005 | Jan | Feb | Mar | Apr | May | Jun | Jul | Aug | Sep | Oct | Nov | Dec |
| 2004 | Jan | Feb | Mar | Apr | May | Jun | Jul | Aug | Sep | Oct | Nov | Dec |
| 2003 | Jan | Feb | Mar | Apr | May | Jun | Jul | Aug | Sep | Oct | Nov | Dec |
| 2002 | Jan | Feb | Mar | Apr | May | Jun | Jul | Aug | Sep | Oct | Nov | Dec |
| 2001 | Jan | Feb | Mar | Apr | May | Jun | Jul | Aug | Sep | Oct | Nov | Dec |
| 2000 | Jan | Feb | Mar | Apr | May | Jun | Jul | Aug | Sep | Oct | Nov | Dec |
| 1999 | Jul | Aug | Sep | Oct | Nov | Dec | ||||||