ACIS
ACIS DOSE Registered-Photon-Map
The steps we took to compute the dose map are;
- Level 1 Event files for a specified month are obtained from archive.
- Image data including I2, I3, S2, S3 CCDs are extracted from all event files.
- All the extracted image data were merged to create a month long exposure map for the month.
- The exposure map is opened with ds9, and check a distribution of count rates against energy. From this, estimate the upper threshold value. Any events beyond this upper threshold are assumed erroneous events such as bad pixels.
- Using this upper threshold, the data is filtered, and create a cleaned exposure map for the month.
- The exposure map from each month from the Sep 1999 is added up to create a cumulative exposure map for each month.
- Using fimgstatistic, we compute count rate statistics for each CCDs.
- For observations with high data drop rates (e.g., Crab nebula, Cas A), we corrected the observations by adding events.
Please check more detail plots at Telemetered Photon Dose Trend page.
)
)
)
Statistics:
# IMAGE     NPIX     MEAN        RMS        MIN     MAX


ACIS_dec15 6004901   6.896       9.583      0.0   2518


I2 node 0  262654    5.800047   2.865008    0.0   76.0
I2 node 1  262654    6.026780   3.055319    0.0  264.0
I2 node 2  262654    6.001139   2.875962    0.0   70.0
I2 node 3  262654    5.976039   4.493803    0.0 1696.0

I3 node 0  262654    7.683402   4.407162    0.0 1347.0
I3 node 1  262654    7.913799   6.904789    0.0  148.0
I3 node 2  262654    7.175073   3.131935    0.0   63.0
I3 node 3  262654    7.179175   3.379653    0.0  515.0

S2 node 0  262654    9.172319   7.699905    0.0 2481.0
S2 node 1  262654    9.361706   3.988363    0.0   73.0
S2 node 2  262654   10.112864   5.783237    0.0 2141.0
S2 node 3  262654   10.464745   6.876640    0.0 2518.0

S3 node 0  262654   13.347852   7.964408    0.0  155.0
S3 node 1  262654   13.709314   4.820016    0.0  111.0
S3 node 2  262654   12.209459   3.805599    0.0   48.0
S3 node 3  262654   10.937749   3.593359    0.0   32.0
)
)
)
Statistics:
 IMAGE     NPIX      MEAN        RMS          MIN    MAX


ACIS_total 6004901  1975.613    2580.509      0.0   113377


I2 node 0  262654   1677.402806  322.246167   335.0   9241.0
I2 node 1  262654   1767.234166  444.854615   362.0  44861.0
I2 node 2  262654      6.001139    2.875962     0.0     70.0
I2 node 3  262654   1798.248695  454.210191   342.0  28194.0

I3 node 0  262654   1892.323281  453.303839   334.0   7374.0
I3 node 1  262654   1982.313035 1496.065887   343.0  37399.0
I3 node 2  262654   1732.400487  312.149055   329.0   9182.0
I3 node 3  262654      7.179175    3.379653     0.0    515.0

S2 node 0  262654   2305.197292  336.286709  1222.0  21373.0
S2 node 1  262654      9.361706    3.988363     0.0     73.0
S2 node 2  262654   2703.787263  516.178063  1652.0  27319.0
S2 node 3  262654   2642.190208  373.319106  1553.0  45595.0

S3 node 0  262654   4092.420454 1832.913195  1703.0  13822.0
S3 node 1  262654   5304.269087 2133.945006     0.0  14288.0
S3 node 2  262654   4083.379764 1041.965923  1689.0   9853.0
S3 node 3  262654   3150.129529  476.572592  1805.0  10673.0
)
|
)
|
)
|
)
|
| Sep 2015 | Jun 2015 | Mar 2015 | Dec 2014 |
|---|
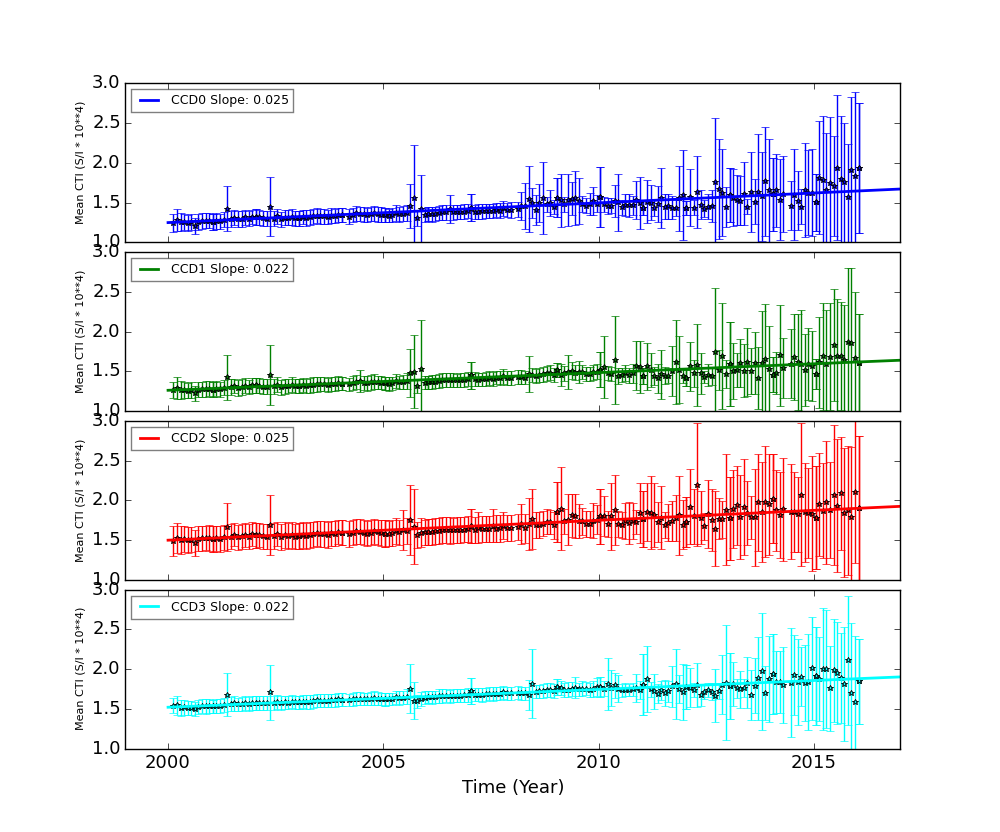
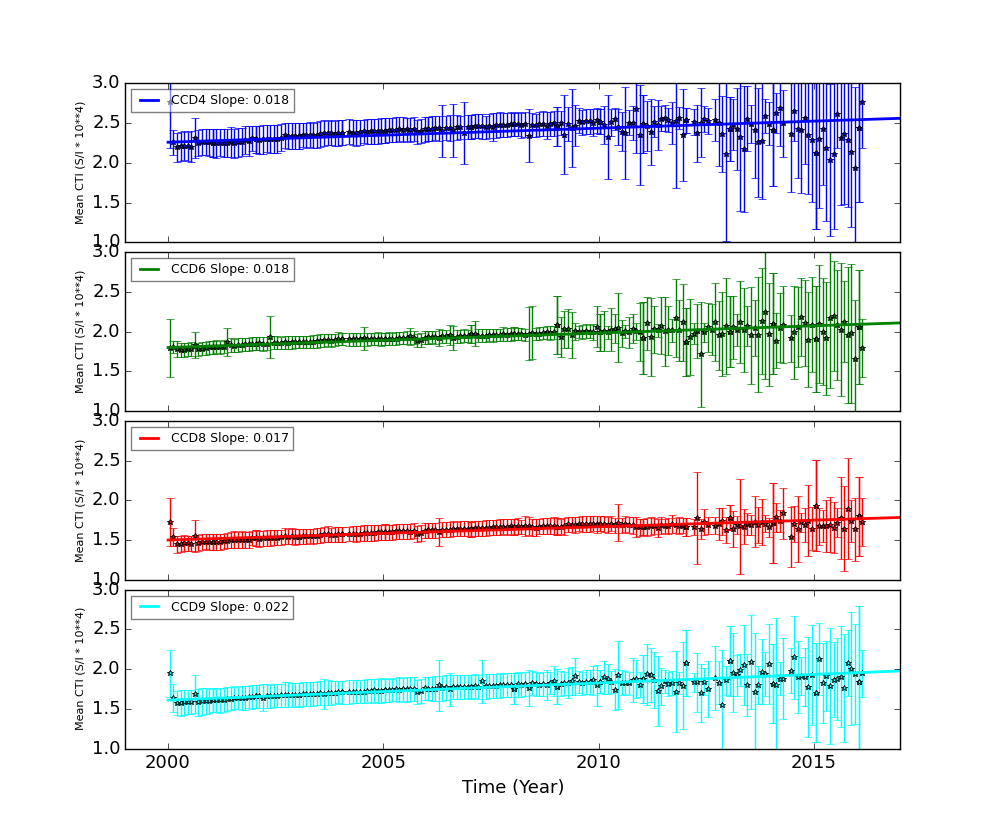
The Mean Detrended CTI
We report CTIs with a refined data definition. CTIs were computed for the temperature dependency corrected data. Please see CTI page for detailed explanation. CTI's are computed for Mn K alpha, and defined as slope/intercept x10^4 of row # vs ADU. Data file: here
Imaging CCDs
Spectral CCDs
Backside CCDs

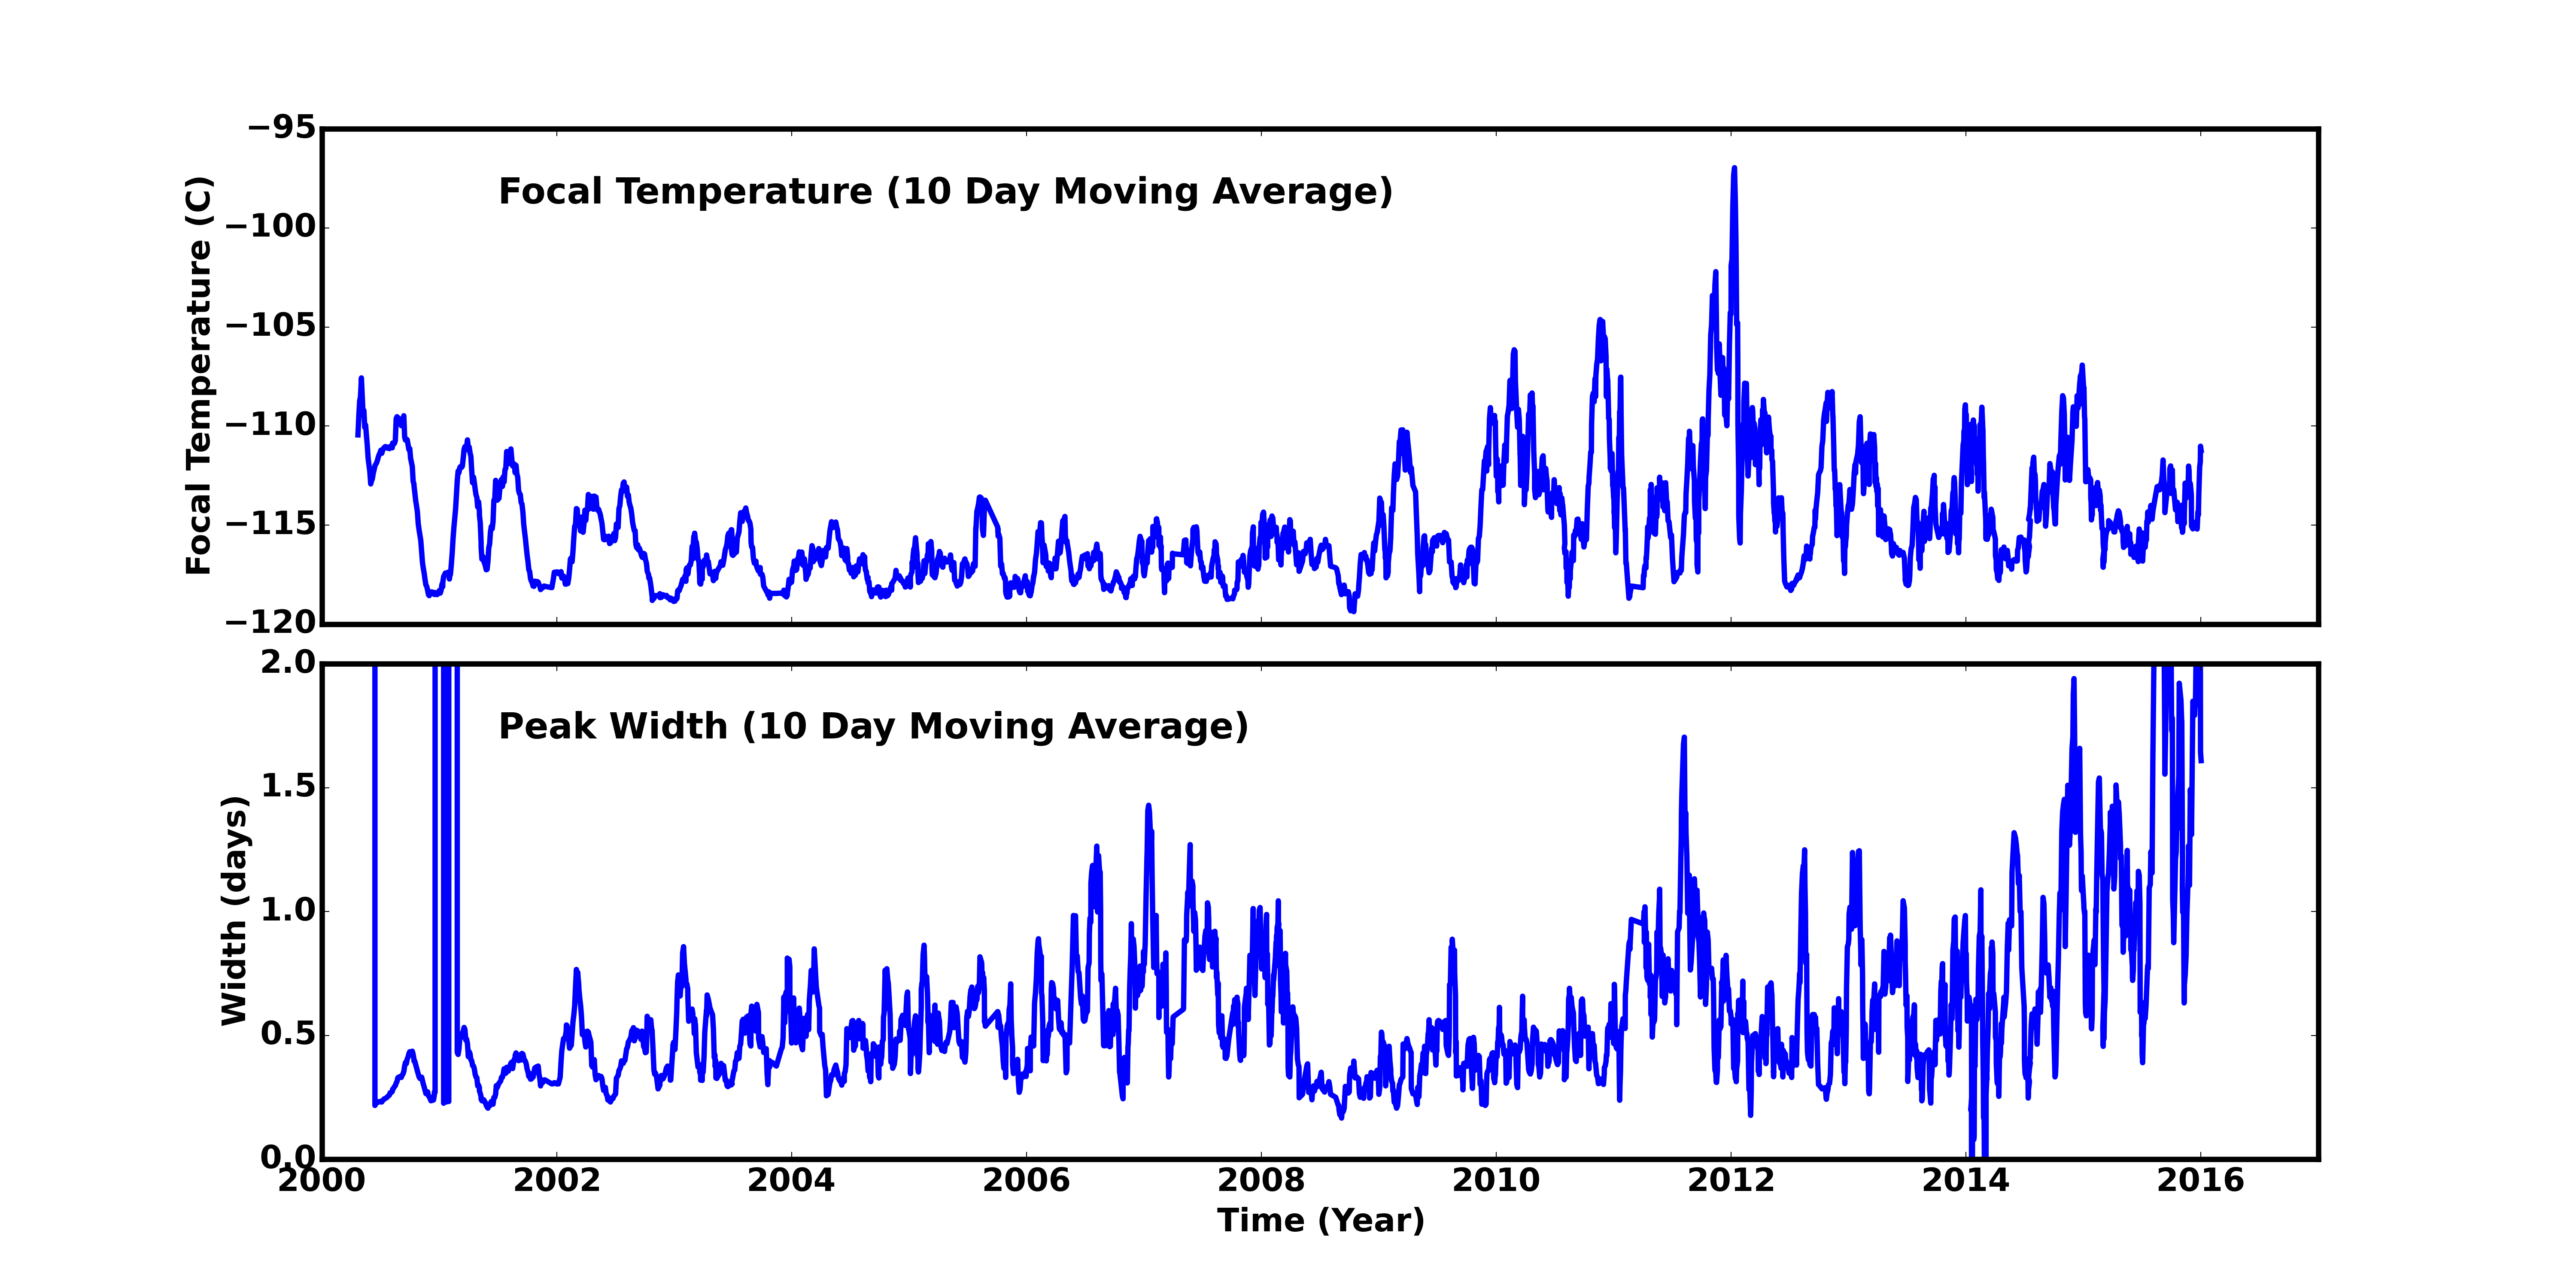
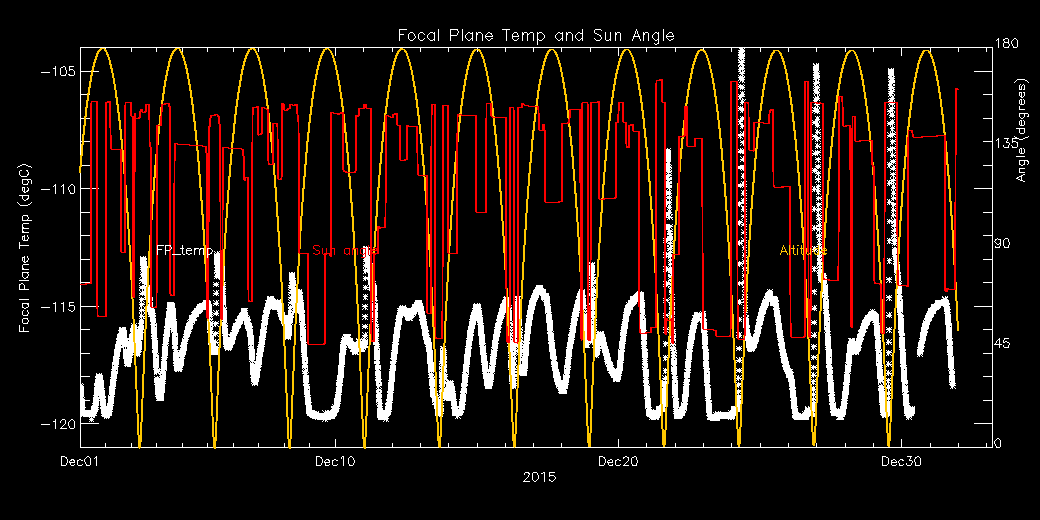
Focal Plane Temperature
Nov 2015 Focal Temperature
| The Mean (max) FPT: | |
|---|---|
| -112.43 | +/- 4.74 C |
| Mean Width: | |
| 1.79 | +/- 2.12 days |
Averaged Focal Plane Temperature
We are using 10 period moving averages to show trends of peak temperatures and peak widths. Note, the gaps in the width plot are due to missing/corrupted data.
Focal Plane Temperature, Sun Angle and Altitude
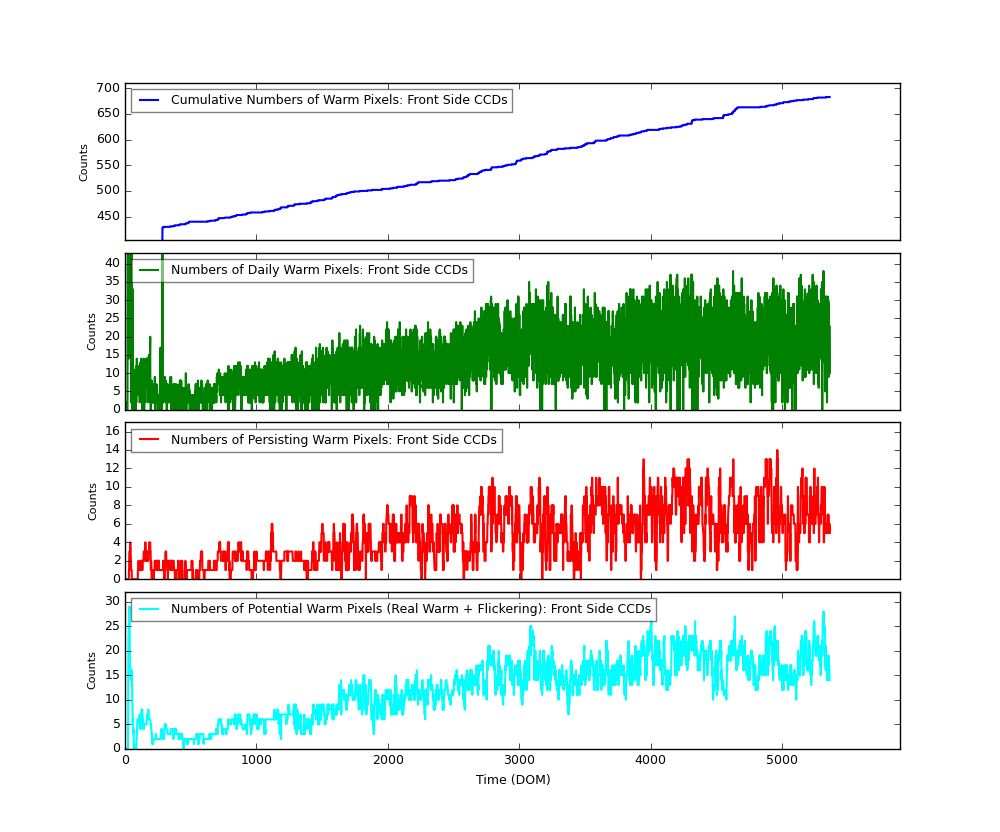
Bad Pixels
The plots below were generated with a new warm pixel finding script. Please see Acis Bad Pixel Page for details.
Front Side CCDs
Back Side CCD (CCD5)

Science Instrument Background Rates
| Name | Low (keV) | High(KeV) | Description |
|---|---|---|---|
| SSoft | 0.00 | 0.50 | Super soft photons |
| Soft | 0.50 | 1.00 | Soft photons |
| Med | 1.00 | 3.00 | Moderate energy photons |
| Hard | 3.00 | 5.00 | Hard Photons |
| Harder | 5.00 | 10.00 | Very Hard photons |
| Hardest | 10.00 | Beyond 10 keV |


HRC
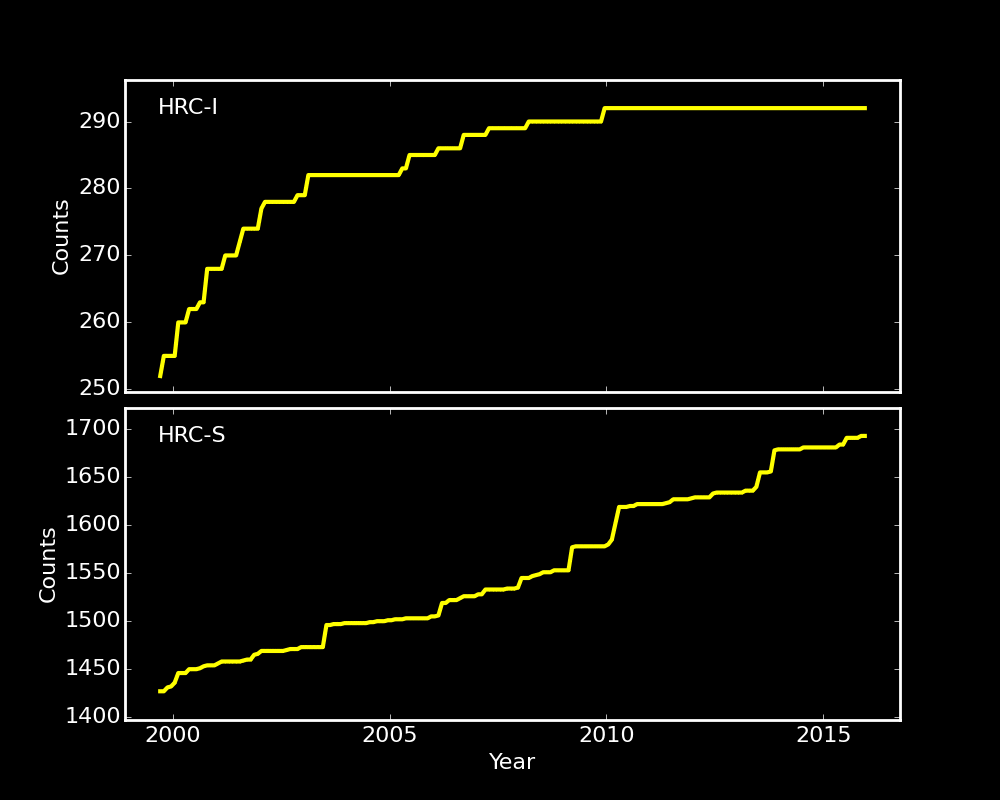
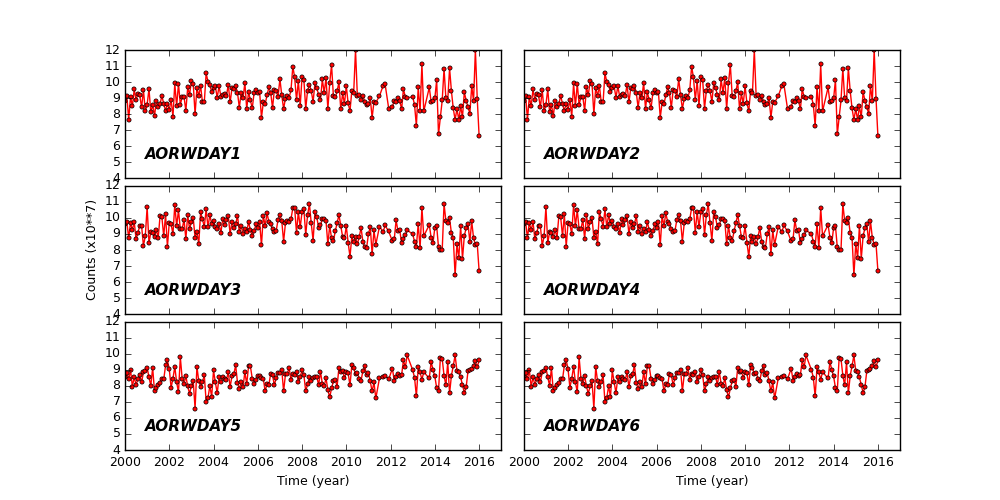
DOSE of Central 4K Pore-Pairs
Please refer to Maximum Dose Trends for more details.
)
|
|---|
        IMAGE                NPIX      MEAN    STDDEV      MIN       MAX
HRCI_12_2015.fits          16777216   0.018    0.1365      0.0       3.0
)
        IMAGE                NPIX      MEAN    STDDEV      MIN       MAX
HRCI_08_1999_12_2015.fits  16777216   4.375    4.955       0.0       292.0
No Data
)
        IMAGE                NPIX     MEAN      STDDEV      MIN      MAX
HRCS_08_1999_12_2015.fits  16777216  15.882     28.278      0.0      1693.0
|
|
Max dose trend plots corrected for events that "pile-up"
in the center of the taps due to bad position information.
|
)
|
)
|
)
|
)
|
| Sep 2015 | Jun 2015 | Mar 2015 | Dec 2014 |
|---|
)
|
)
|
)
|
)
|
| Sep 2015 | Jun 2015 | Mar 2015 | Dec 2014 |
|---|
Gratings
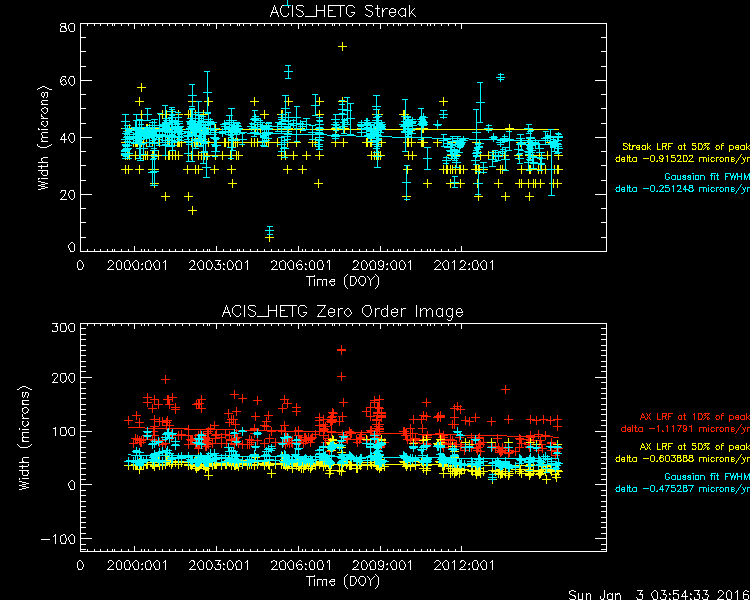
Focus
We plot the width of the zero order streak of ACIS/HETG observations and the width of the zero order image for HRC/LETG observations of point sources. No significant defocusing trend is seen at this time. See Gratings Focus pages.
PCAD
ACA Trending
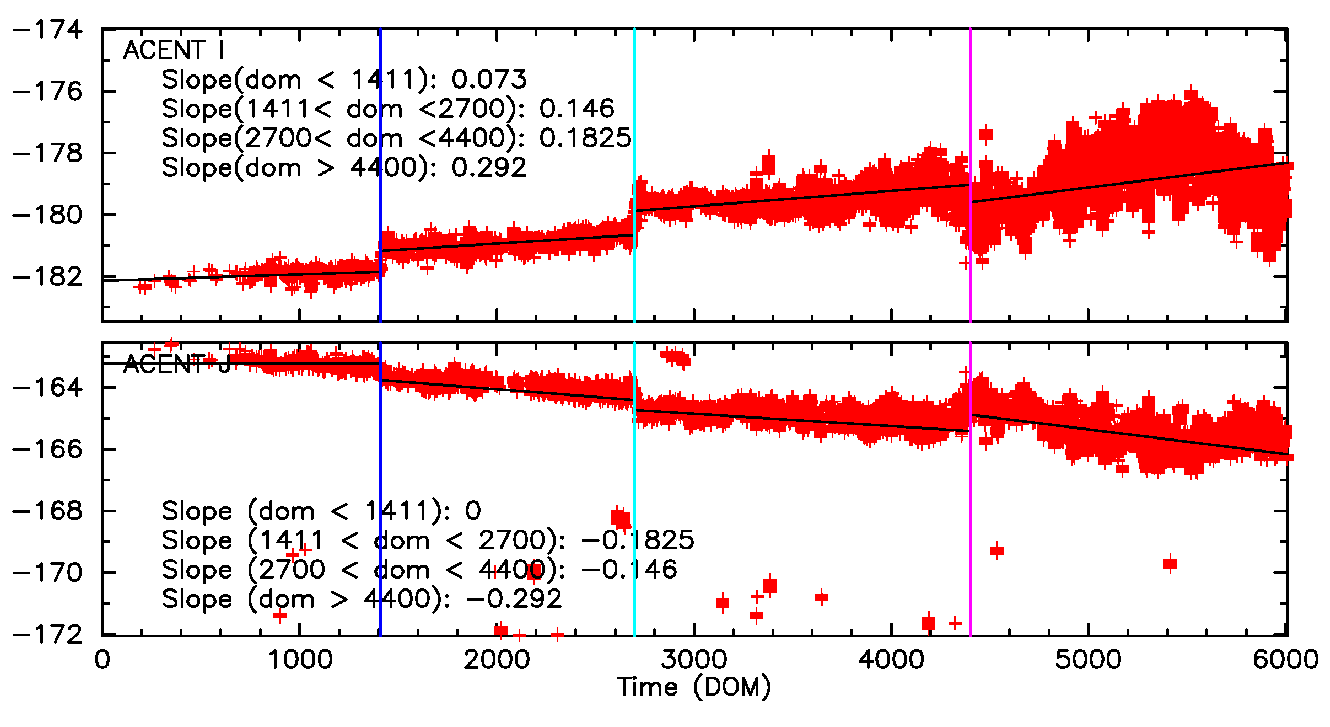
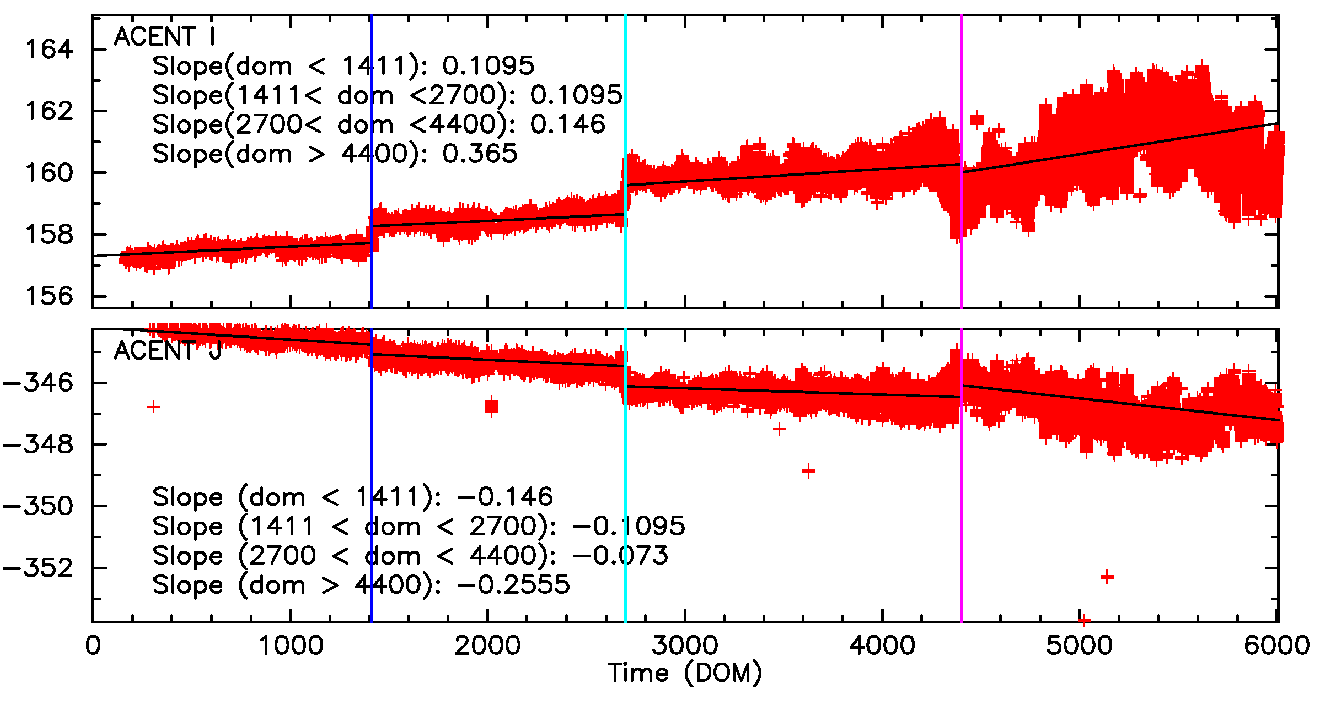
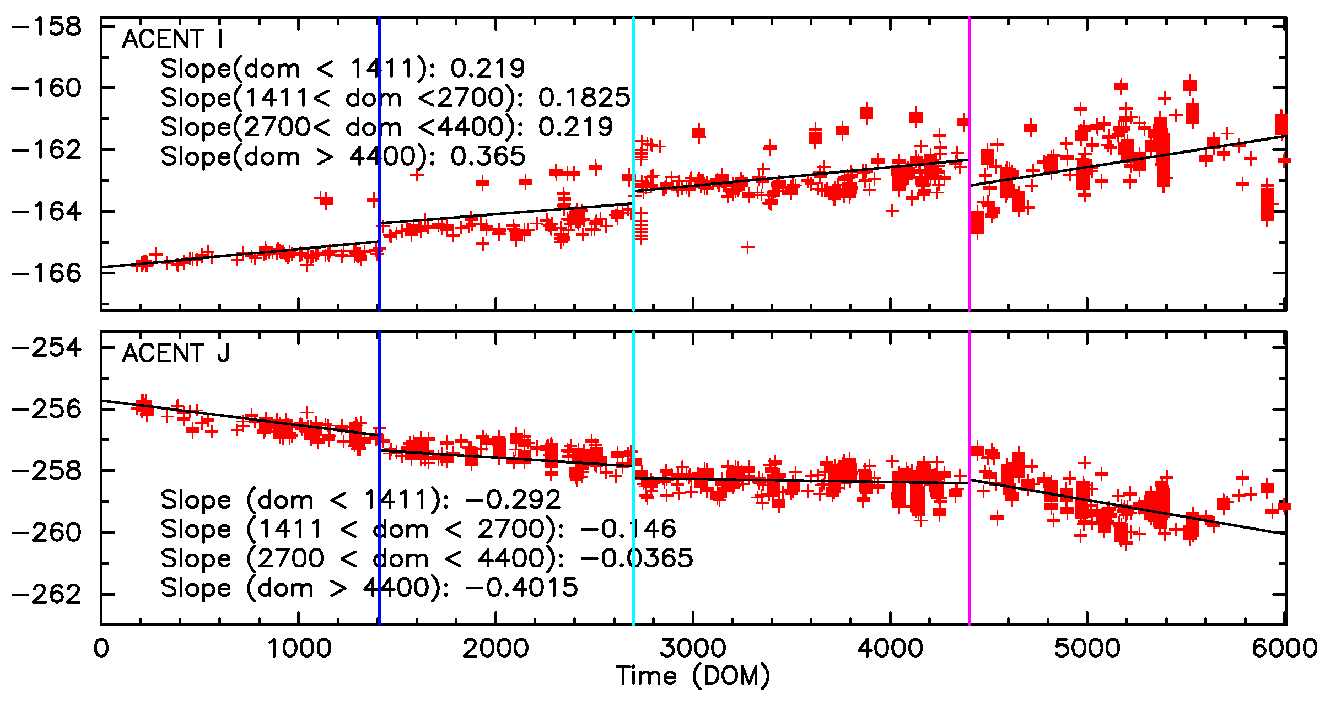
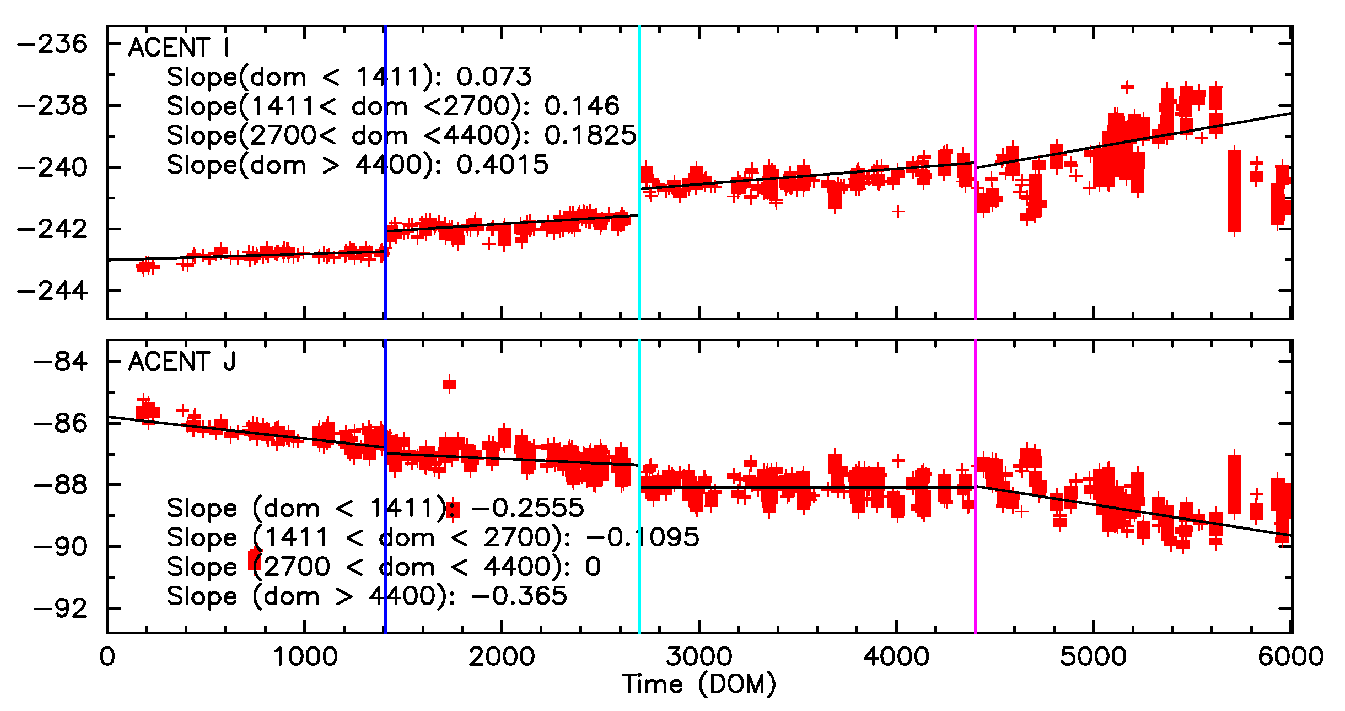
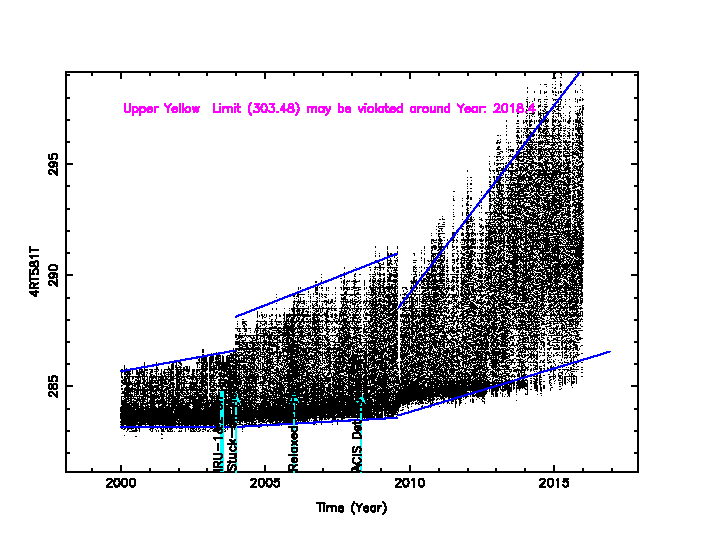
Fid Light Drift
Fid light positions on ACA drift with time. The drift trends of Fid light 2 with ACIS-I and ACIS-S configurations are shown below.
The top panel shows Fid light 2 drift in ACENT I (app. along with -Y axis), and the
bottom panel shows that in ACENT J (app. along with Z axis). The unit is a pixel, and
one pixel is approximately 0.5 arcsec. The slope listed at the top right corner is
the change in a position per year (arcsec/yr). The vertical line on DOM = 1411 (Jun 1, 2003)
indicates a transition date of use of IRU-1 to IRU-2.
See also Tom Aldcroft's updated page:
https://cxc.cfa.harvard.edu/mta/ASPECT/fid_drift
Fid 2 (ACIS-I)
Fid 2 (ACIS-S)
Fid 8 (HRC-I)
Fid 12 (HRC-S)
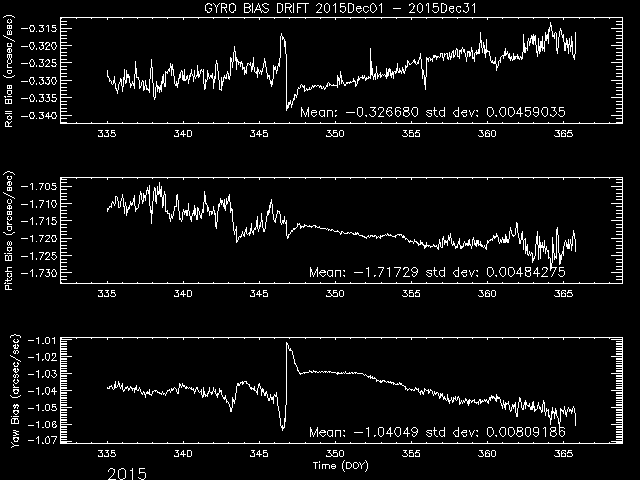
Gyro Bias Drift
Radiation History
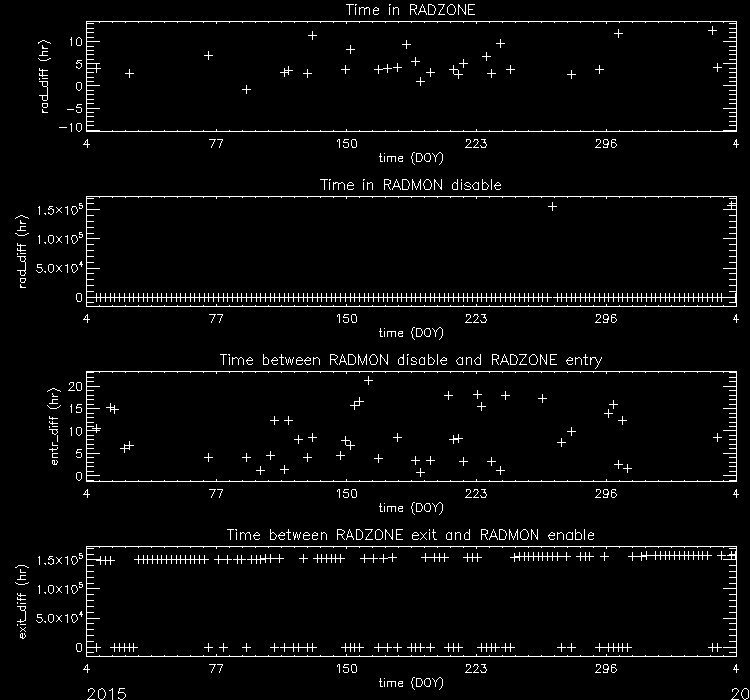
Radiation Zone Timing
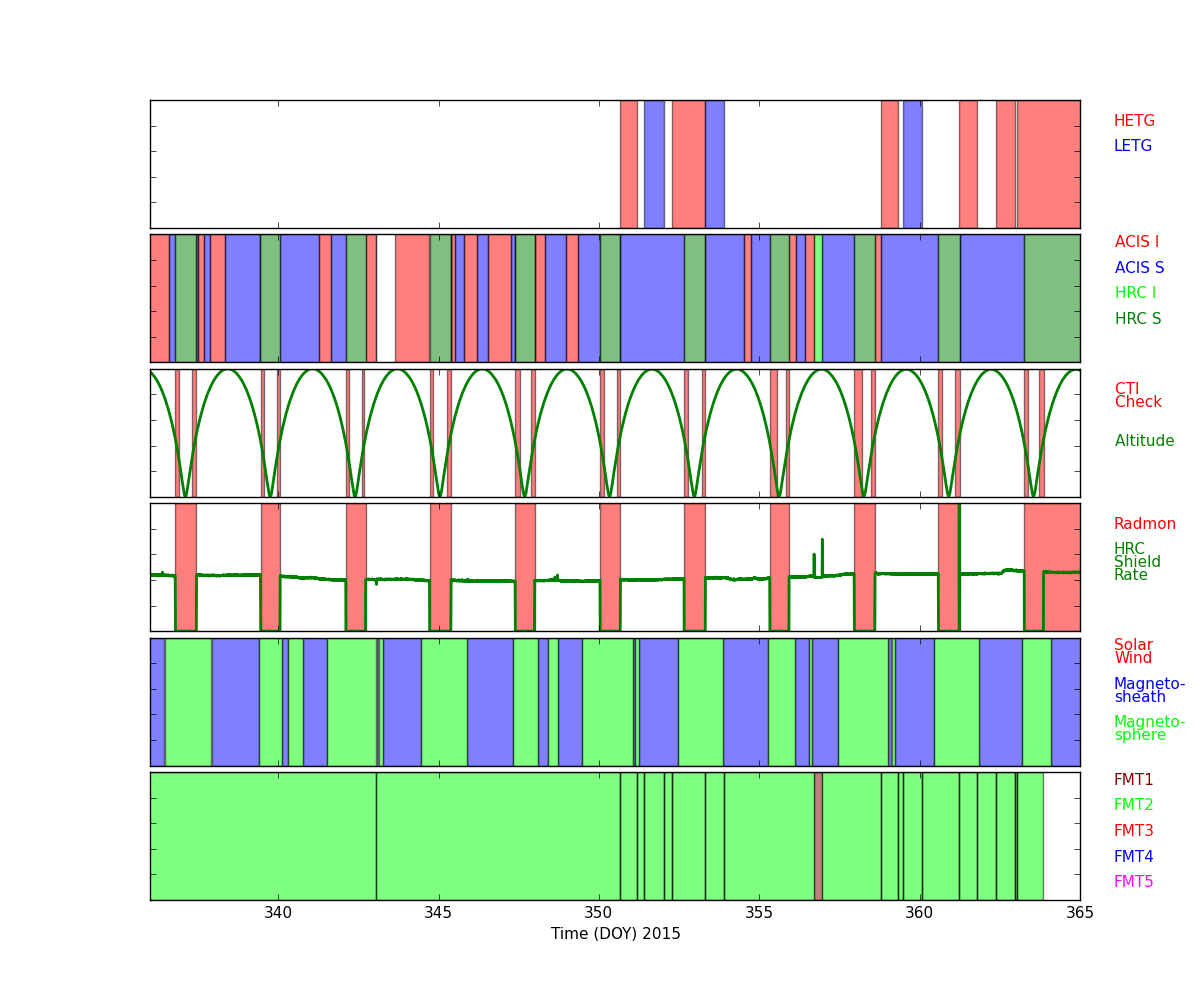
Plotted below are radiation zone timing plots based on the following definitions of radiation zone:
- RADZONE - Ephin levels (in any of the E1300,P4GM,P41GM channels) are more than 1/3 of RADMON safing thresholds.
- RADMON - Radmon is disabled for radiation zone (as commanded based on OFLS model, for comparison with actual radiation levels).
- PERIGEE - Time of closest earth approach (for comparison)
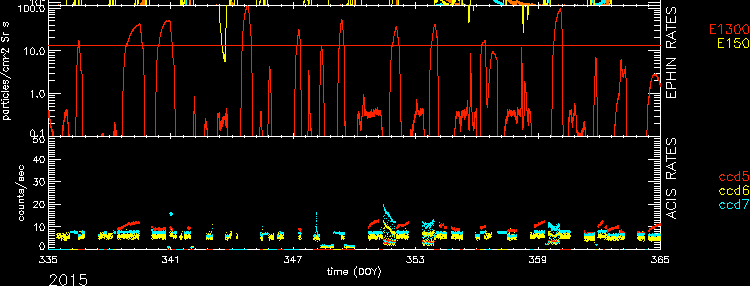
Radiation Count Rates of Dec 2015
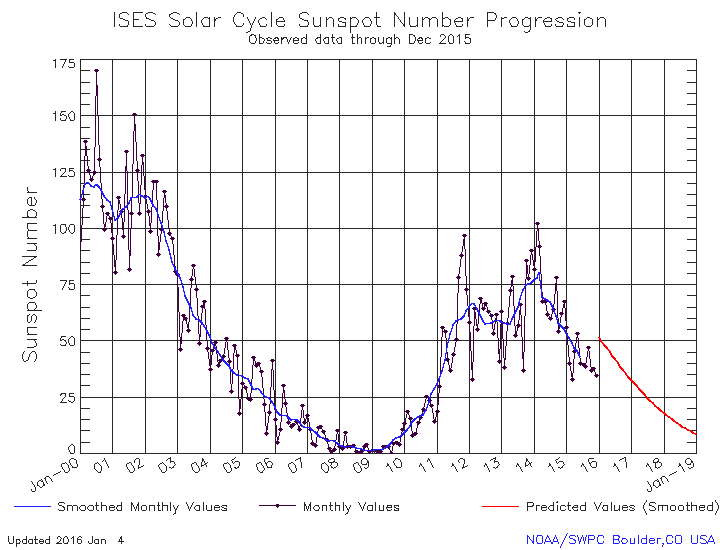
Sun Spot History
Trending
Critical Trends
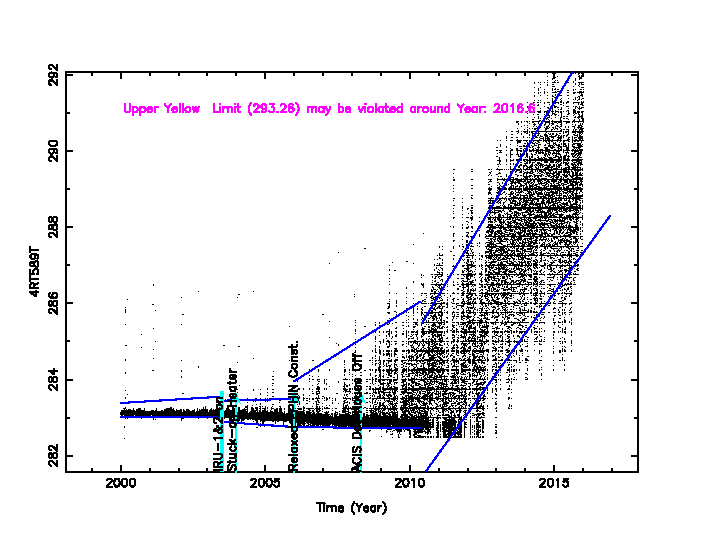
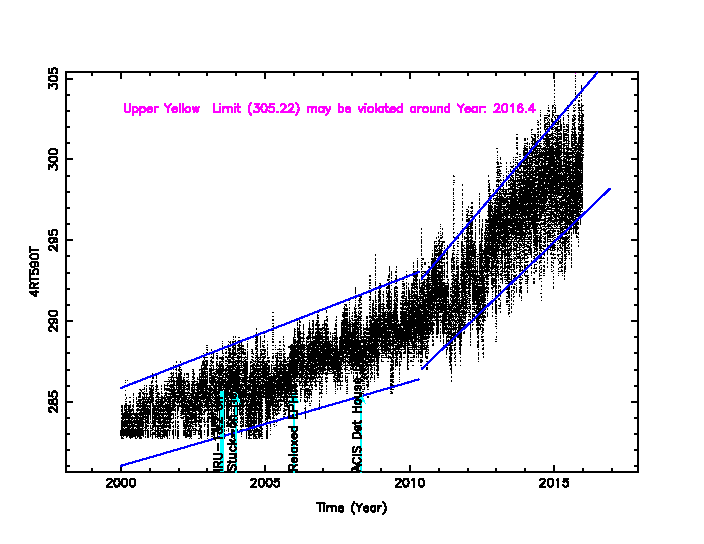
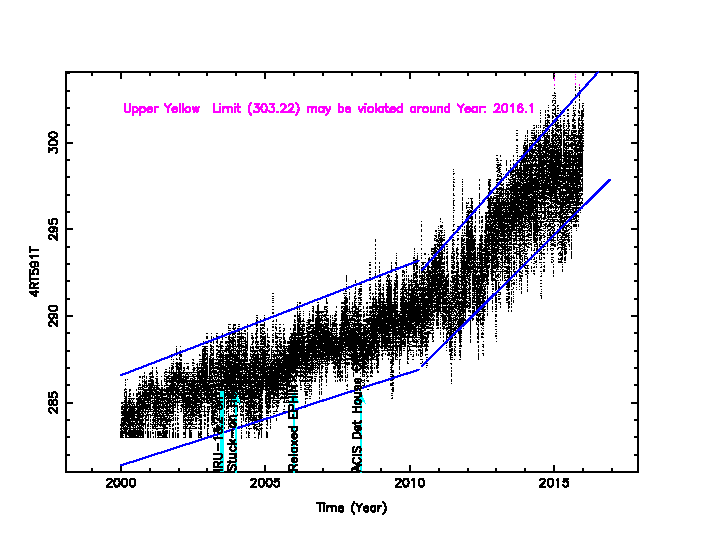
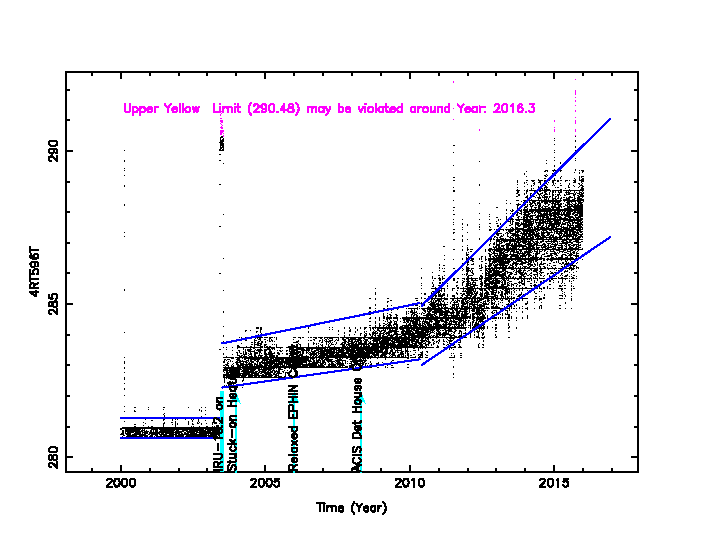
| ACIS Temperatures - Daily Maximums | ||||||
|---|---|---|---|---|---|---|
| MSID | MEAN | RMS | DELTA/YR | DELTA/YR/YR | UNITS | DESCRIPTION |
| 1PDEAAT | 305.37 | 8.90 | -3.771e-02 | 7.715e-01 | K | PSMC DEA PS A TEMP |
| 1PIN1AT | 292.24 | 8.01 | 1.595e-01 | 1.085e+00 | K | PSMC TEMP 1A |
)
)
| HRMA Computed Averages - Daily Maximums | ||||||
|---|---|---|---|---|---|---|
| MSID | MEAN | RMS | DELTA/YR | DELTA/YR/YR | UNITS | DESCRIPTION |
| OBAAVG | 291.50 | 1.78 | 6.386e-01 | 4.364e+00 | TEMP | OBA/TFTE |
)
| EPHIN Temperatures - Daily Maximums | ||||||
|---|---|---|---|---|---|---|
| TEIO | 329.50 | 20.49 | 4.011e+00 | -4.752e+00 | K | EPHIN ELECTRONICS HOUSING TEMP |
| TEPHIN | 334.11 | 6.22 | -2.138e-01 | -2.115e+00 | K | EPHIN SENSOR HOUSING TEMP |
)
)
| S/C Main Temperatures - Daily Maximums | ||||||
|---|---|---|---|---|---|---|
| MSID | MEAN | RMS | DELTA/YR | DELTA/YR/YR | UNITS | DESCRIPTION |
| TCYLFMZM | 306.51 | 25.42 | 1.436e+00 | -2.728e-01 | K | CNT CYL TEMP:-Z SIDE UNDER LAE-1 |
| TCYLFMZP | 308.63 | 24.25 | 1.454e+00 | -6.287e-01 | K | CNT CYL TEMP:-Z SIDE UNDER LAE-2 |
)
)
| S/C Ancillary Temperatures - Daily Maximums | ||||||
|---|---|---|---|---|---|---|
| MSID | MEAN | RMS | DELTA/YR | DELTA/YR/YR | UNITS | DESCRIPTION |
| TFSSBKT1 | 343.66 | 18.99 | -5.196e-01 | 1.142e+01 | K | FSS BRACKET-1 TEMP (+Y) |
| TFSSBKT2 | 339.90 | 25.63 | -1.719e-01 | 1.885e+01 | K | FSS BRACKET-2 TEMP (+Y) |
| TSCTSF1 | 303.37 | 3.57 | 1.978e+00 | 5.654e+00 | K | SC-TS FITTING -1 TEMP |
| TSCTSF6 | 305.39 | 3.97 | 2.086e+00 | 2.926e+00 | K | SC-TS FITTING -6 TEMP |
)
)
)
)
| MUPS - Daily Maximums | ||||||
|---|---|---|---|---|---|---|
| MSID | MEAN | RMS | DELTA/YR | DELTA/YR/YR | UNITS | DESCRIPTION |
| PM1THV1T | 333.47 | 8.23 | -2.762e-01 | -1.892e+02 | K | MUPS 1 THRUSTER VALVE 01 TEMP |
| PLINE02T | 317.64 | 11.13 | 3.347e+00 | 5.826e+00 | K | PROP LINE TEMP 02 |
| PLINE03T | 316.64 | 13.64 | 3.278e+00 | 7.846e+00 | K | PROP LINE TEMP 03 |
| PLINE04T | 302.24 | 12.73 | 3.233e+00 | 7.055e+00 | K | PROP LINE TEMP 04 |
)
)
)
)
Quarterly Trends
- EPHIN Temperature and Voltage
| Previous Quarter | ||||||
| MSID | MEAN | RMS | DELTA/YR | DELTA/YR/YR | UNITS | DESCRIPTION |
| 5EIOT | 355.40 | 18.52 | 1.099e+01 | -3.967e+02 | K | EIO TEMP |
| 5EPHINT | 333.31 | 6.07 | 2.367e+01 | 3.142e+01 | K | EPHIN TEMP |
| HKEBOXTEMP | 338.58 | 6.12 | 2.447e+01 | 1.514e+01 | K | EPHIN HOUSEKEEPING EBOX: TEMPERATURE (5EHSE300) |
| HKP5V | 5.08 | 6.174e-03 | -1.400e-02 | -3.999e-02 | V | HK 5 Volts Rail - Voltage |
| TEIO | 329.61 | 19.69 | 1.369e+01 | -5.176e+02 | K | EPHIN ELECTRONICS HOUSING TEMP |
| TEPHIN | 333.62 | 5.92 | 2.389e+01 | 7.363e+00 | K | EPHIN SENSOR HOUSING TEMP |
)
)
)
)
)
)
- HRC Temperature
| Previous Quarter | ||||||
| MSID | MEAN | RMS | DELTA/YR | DELTA/YR/YR | UNITS | DESCRIPTION |
| 2CEAHVPT | 299.83 | 2.20 | 8.657e-01 | -8.946e+01 | K | CEA RADIATOR TEMPERATURE AT CENTER |
| 2CHTRPZT | 296.35 | 2.18 | 1.736e+00 | -5.372e+01 | K | CENTRAL ELECTRONICS BOX TEMP |
| 2CONDMXT | 293.03 | 2.24 | 2.264e+00 | -5.398e+01 | K | CONDUIT -X FACE TEMPERATURE |
| 2DCENTRT | 292.18 | 2.06 | 1.405e+00 | -1.141e+02 | K | DETECTOR HOUSING TEMP 2 |
| 2DTSTATT | 293.02 | 1.97 | 1.943e+00 | -1.117e+02 | K | DETECTOR HOUSING TEMP 1 |
| 2FHTRMZT | 295.27 | 2.16 | 2.357e+00 | -1.067e+02 | K | FRONT END ELECTRONICS BOX TEMPERATURE |
| 2FRADPYT | 291.02 | 2.25 | 2.742e+00 | -9.990e+01 | K | FRONT END ASSEMBLY +Y AT RADIATOR CENTER TEMP |
| 2PMT1T | 293.91 | 2.76 | -1.099e+00 | -8.338e+01 | K | PMT 1 TEMPERATURE |
| 2PMT2T | 296.38 | 2.93 | -1.685e+00 | -6.383e+01 | K | PMT 2 TEMPERATURE |
| 2UVLSPXT | 288.16 | 2.72 | 7.574e-01 | -1.008e+02 | K | UV LIGHT SHIELD NEXT TO SNOUT TEMP |
)
)
)
)
)
)
)
)
)
)
- PCAD Temperature
| Previous Quarter | ||||||
| MSID | MEAN | RMS | DELTA/YR | DELTA/YR/YR | UNITS | DESCRIPTION |
| AACBPPT | 306.70 | 0.83 | 6.360e+00 | 9.914e+00 | K | AC BASEPLATE TEMP (PRIME) |
| AACBPRT | 301.58 | 0.83 | 6.409e+00 | 9.958e+00 | K | AC BASEPLATE TEMP (RDNT) |
| AACCCDPT | 258.14 | 0.80 | 6.003e+00 | 1.407e+01 | K | AC CCD TEMP (PRI) |
| AACCCDRT | 301.81 | 0.92 | 6.944e+00 | 1.309e+01 | K | AC CCD TEMP (RDNT) |
| AACH1T | 298.96 | 0.90 | 6.869e+00 | 1.465e+01 | K | AC HOUSING TEMP (ACH1) |
| AACH2T | 299.01 | 0.90 | 6.946e+00 | 1.565e+01 | K | AC HOUSING TEMP (ACH2) |
| AAOTALT | 298.61 | 0.89 | 6.805e+00 | 1.456e+01 | K | AC OPT TEL ASSY LENS TEMP |
| AAOTAPMT | 297.92 | 0.87 | 6.690e+00 | 1.050e+01 | K | AC OPT TEL ASSY PRIMARY MIRROR TEMP |
| AAOTASMT | 298.06 | 0.87 | 6.663e+00 | 1.234e+01 | K | AC OPT TEL ASSY SECONDARY MIRROR TEMP |
| AAOTH2MT | 298.53 | 0.88 | 6.709e+00 | 1.309e+01 | K | AC OPT TEL ASSY SECONDARY MIRROR TEMP (HRMA) |
)
)
)
)
)
)
)
)
)
)
Envelope Trending
HRMA Struts
HRMA Thermal
Spacecraft Motions
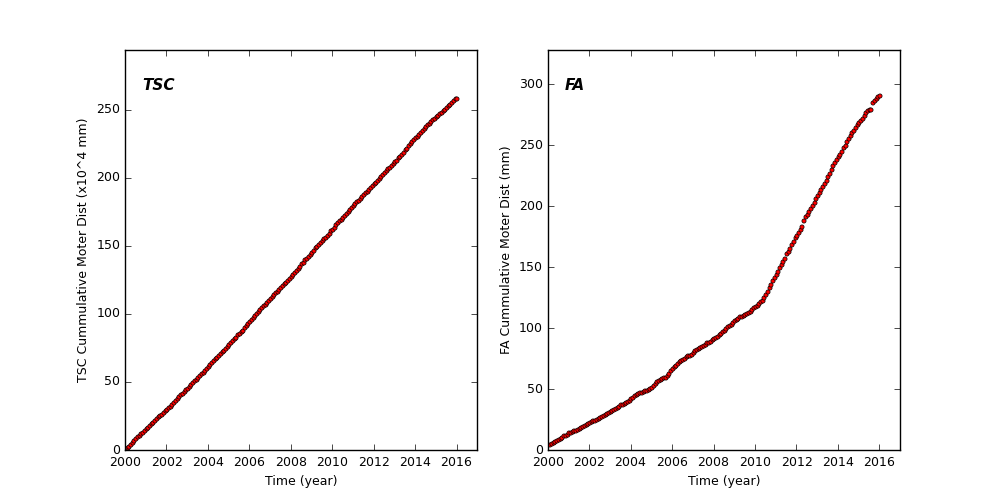
TSC and FA Cummulative Moter Distance
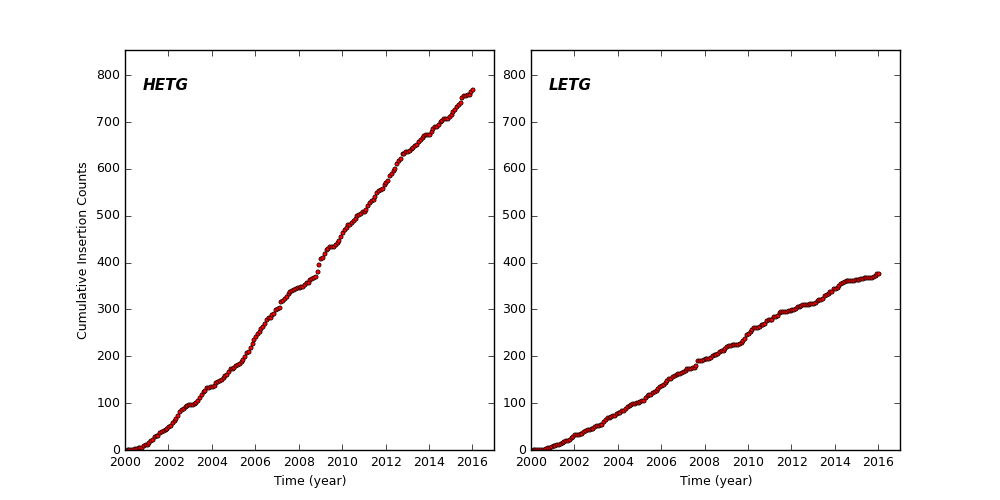
HETG and LETG Cummulative Insertion Counts
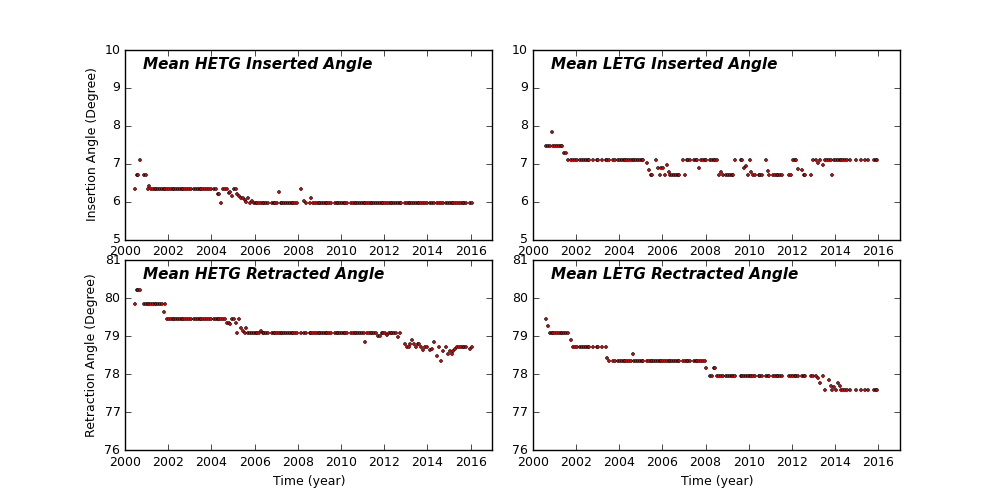
HETG/LETG Insertion/Retraction Angle
Reaction Wheel Rotations
Links to Past Monthly Reports
| Year | Month | |||||||||||
|---|---|---|---|---|---|---|---|---|---|---|---|---|
| 2015 | Jan | Feb | Mar | Apr | May | Jun | Jul | Aug | Sep | Oct | Nov | |
| 2014 | Jan | Feb | Mar | Apr | May | Jun | Jul | Aug | Sep | Oct | Nov | Dec |
| 2013 | Jan | Feb | Mar | Apr | May | Jun | Jul | Aug | Sep | Oct | Nov | Dec |
| 2012 | Jan | Feb | Mar | Apr | May | Jun | Jul | Aug | Sep | Oct | Nov | Dec |
| 2011 | Jan | Feb | Mar | Apr | May | Jun | Jul | Aug | Sep | Oct | Nov | Dec |
| 2010 | Jan | Feb | Mar | Apr | May | Jun | Jul | Aug | Sep | Oct | Nov | Dec |
| 2009 | Jan | Feb | Mar | Apr | May | Jun | Jul | Aug | Sep | Oct | Nov | Dec |
| 2008 | Jan | Feb | Mar | Apr | May | Jun | Jul | Aug | Sep | Oct | Nov | Dec |
| 2007 | Jan | Feb | Mar | Apr | May | Jun | Jul | Aug | Sep | Oct | Nov | Dec |
| 2006 | Jan | Feb | Mar | Apr | May | Jun | Jul | Aug | Sep | Oct | Nov | Dec |
| 2005 | Jan | Feb | Mar | Apr | May | Jun | Jul | Aug | Sep | Oct | Nov | Dec |
| 2004 | Jan | Feb | Mar | Apr | May | Jun | Jul | Aug | Sep | Oct | Nov | Dec |
| 2003 | Jan | Feb | Mar | Apr | May | Jun | Jul | Aug | Sep | Oct | Nov | Dec |
| 2002 | Jan | Feb | Mar | Apr | May | Jun | Jul | Aug | Sep | Oct | Nov | Dec |
| 2001 | Jan | Feb | Mar | Apr | May | Jun | Jul | Aug | Sep | Oct | Nov | Dec |
| 2000 | Jan | Feb | Mar | Apr | May | Jun | Jul | Aug | Sep | Oct | Nov | Dec |
| 1999 | Jul | Aug | Sep | Oct | Nov | Dec | ||||||