ACIS
ACIS DOSE Registered-Photon-Map
The steps we took to compute the dose map are;
- Level 1 Event files for a specified month are obtained from archive.
- Image data including I2, I3, S2, S3 CCDs are extracted from all event files.
- All the extracted image data were merged to create a month long exposure map for the month.
- The exposure map is opened with ds9, and check a distribution of count rates against energy. From this, estimate the upper threshold value. Any events beyond this upper threshold are assumed erroneous events such as bad pixels.
- Using this upper threshold, the data is filtered, and create a cleaned exposure map for the month.
- The exposure map from each month from the Sep 1999 is added up to create a cumulative exposure map for each month.
- Using fimgstatistic, we compute count rate statistics for each CCDs.
- For observations with high data drop rates (e.g., Crab nebula, Cas A), we corrected the observations by adding events.
Please check more detail plots at Telemetered Photon Dose Trend page.
)
)
)
Statistics:
# IMAGE     NPIX     MEAN        RMS        MIN     MAX

ACIS_nov15 6004901       7.270         13.595           0.0     2126


I2 node 0  262654   23.103619   8.424328    0.0 194.0
I2 node 1  262654   24.345712   10.037872   0.0 1677.0
I2 node 2  262654   24.056090   8.601658    0.0 240.0
I2 node 3  262654   24.301599   23.633650   0.0 6285.0

I3 node 0  262654   25.452936   10.339149   0.0 169.0
I3 node 1  262654   25.589828   27.686146   0.0 8472.0
I3 node 2  262654   23.623039   8.738319    0.0 210.0
I3 node 3  262654   23.357915   10.396805   0.0 2616.0

S2 node 0  262654   15.026383   33.949116   0.0 11057.0
S2 node 1  262654   14.971853   7.159323    0.0 585.0
S2 node 2  262654   15.195937   20.308327   0.0 7681.0
S2 node 3  262654   15.074908   6.702424    0.0 801.0

S3 node 0  262654   32.111282   40.320354   0.0 415.0
S3 node 1  262654   22.227681   12.079449   0.0 180.0
S3 node 2  262654   20.065928   6.828545    1.0 182.0
S3 node 3  262654   18.294884   6.415157    0.0 158.0
)
)
)
Statistics:
 IMAGE     NPIX      MEAN        RMS          MIN      MAX

öS_total   6004901       1968.717         2572.110           0.0   112979


I2 node 0  262654   1685.102304 324.063513  333.0   9255.0
I2 node 1  262654   1775.451865 447.560752  361.0   45766.0
I2 node 2  262654   24.056090   8.601658    0.0 240.0
I2 node 3  262654   1806.471290 457.526787  342.0   28208.0

I3 node 0  262654   1899.214736 455.644215  340.0   7392.0
I3 node 1  262654   1988.815439 1501.917802 347.0   37573.0
I3 node 2  262654   1738.813376 313.804866  327.0   9219.0
I3 node 3  262654   23.357915   10.396805   0.0 2616.0

S2 node 0  262654   2303.983142 339.146045  1227.0  21382.0
S2 node 1  262654   14.971853   7.159323    0.0 585.0
S2 node 2  262654   2701.702286 515.913091  1651.0  27318.0
S2 node 3  262654   2639.655047 372.423877  1551.0  45528.0

S3 node 0  262654   4090.864342 1833.305628 1704.0  13819.0
S3 node 1  262654   5303.344865 2133.140556 0.0 14286.0
S3 node 2  262654   4083.591850 1041.469783 1698.0  9855.0
S3 node 3  262654   3150.498389 475.805519  1808.0  10669.0
)
|
)
|
)
|
)
|
| Ayg 2015 | May 2015 | Feb 2015 | Nov 2014 |
|---|
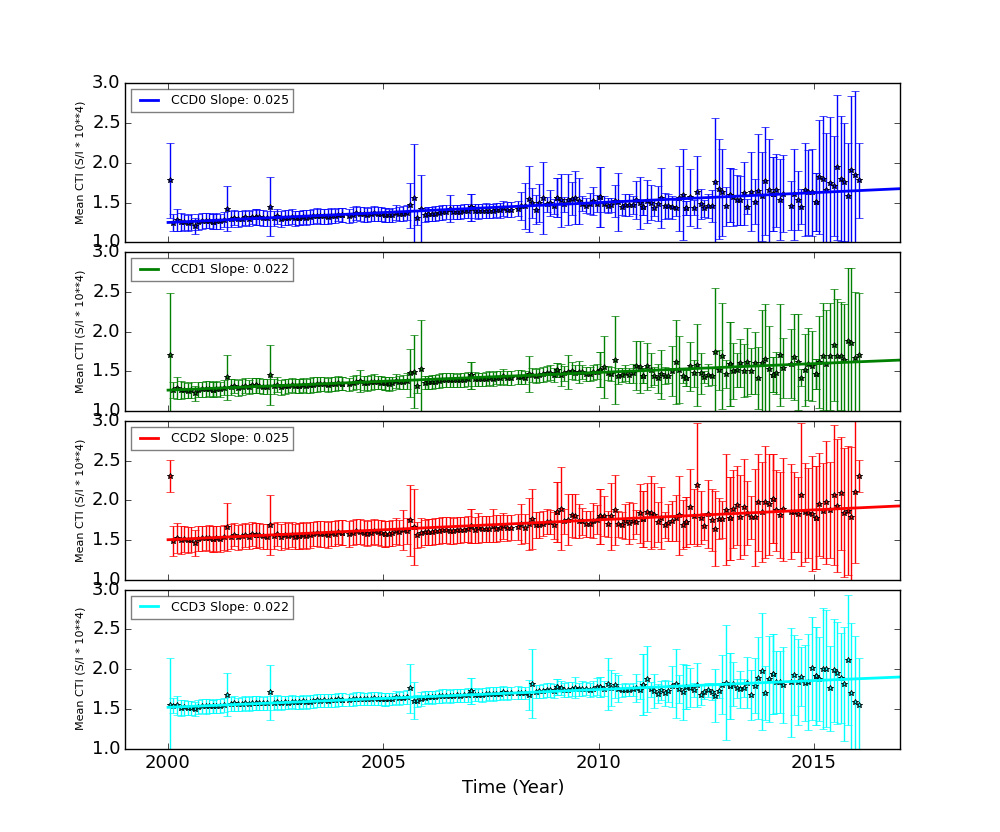
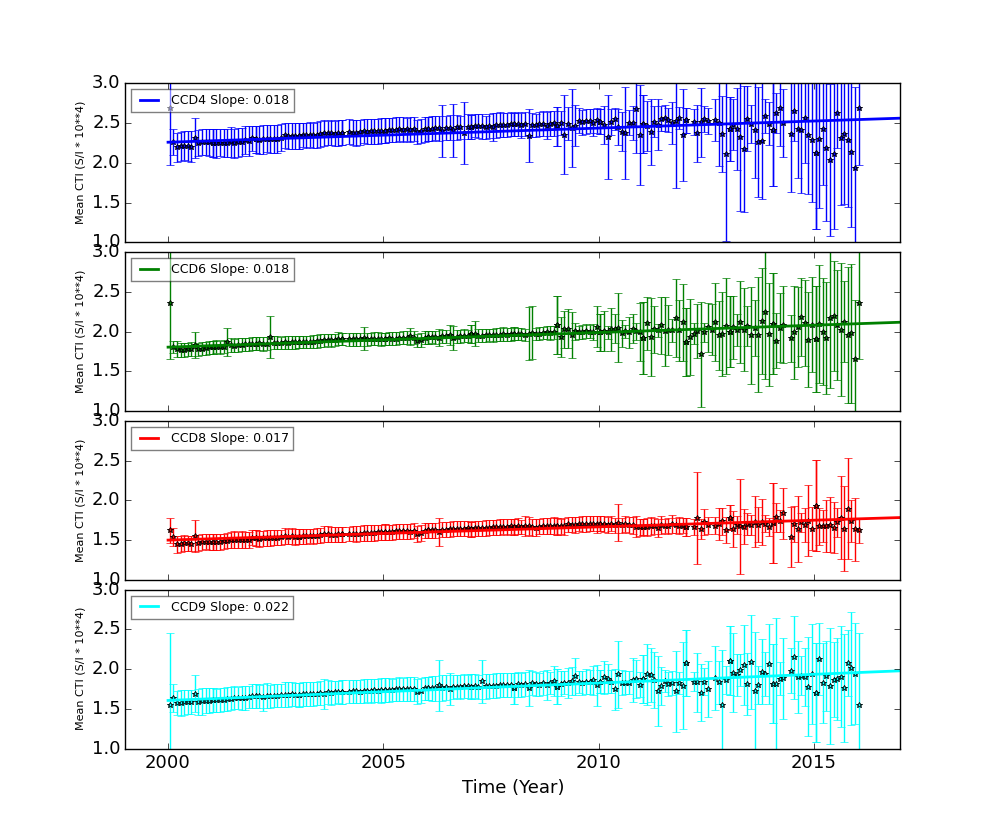
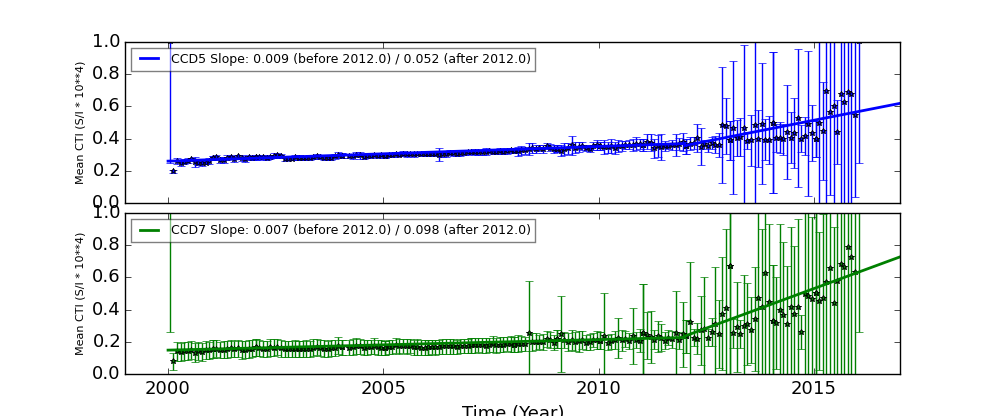
The Mean Detrended CTI
We report CTIs with a refined data definition. CTIs were computed for the temperature dependency corrected data. Please see CTI page for detailed explanation. CTI's are computed for Mn K alpha, and defined as slope/intercept x10^4 of row # vs ADU. Data file: here
Imaging CCDs
Spectral CCDs
Backside CCDs
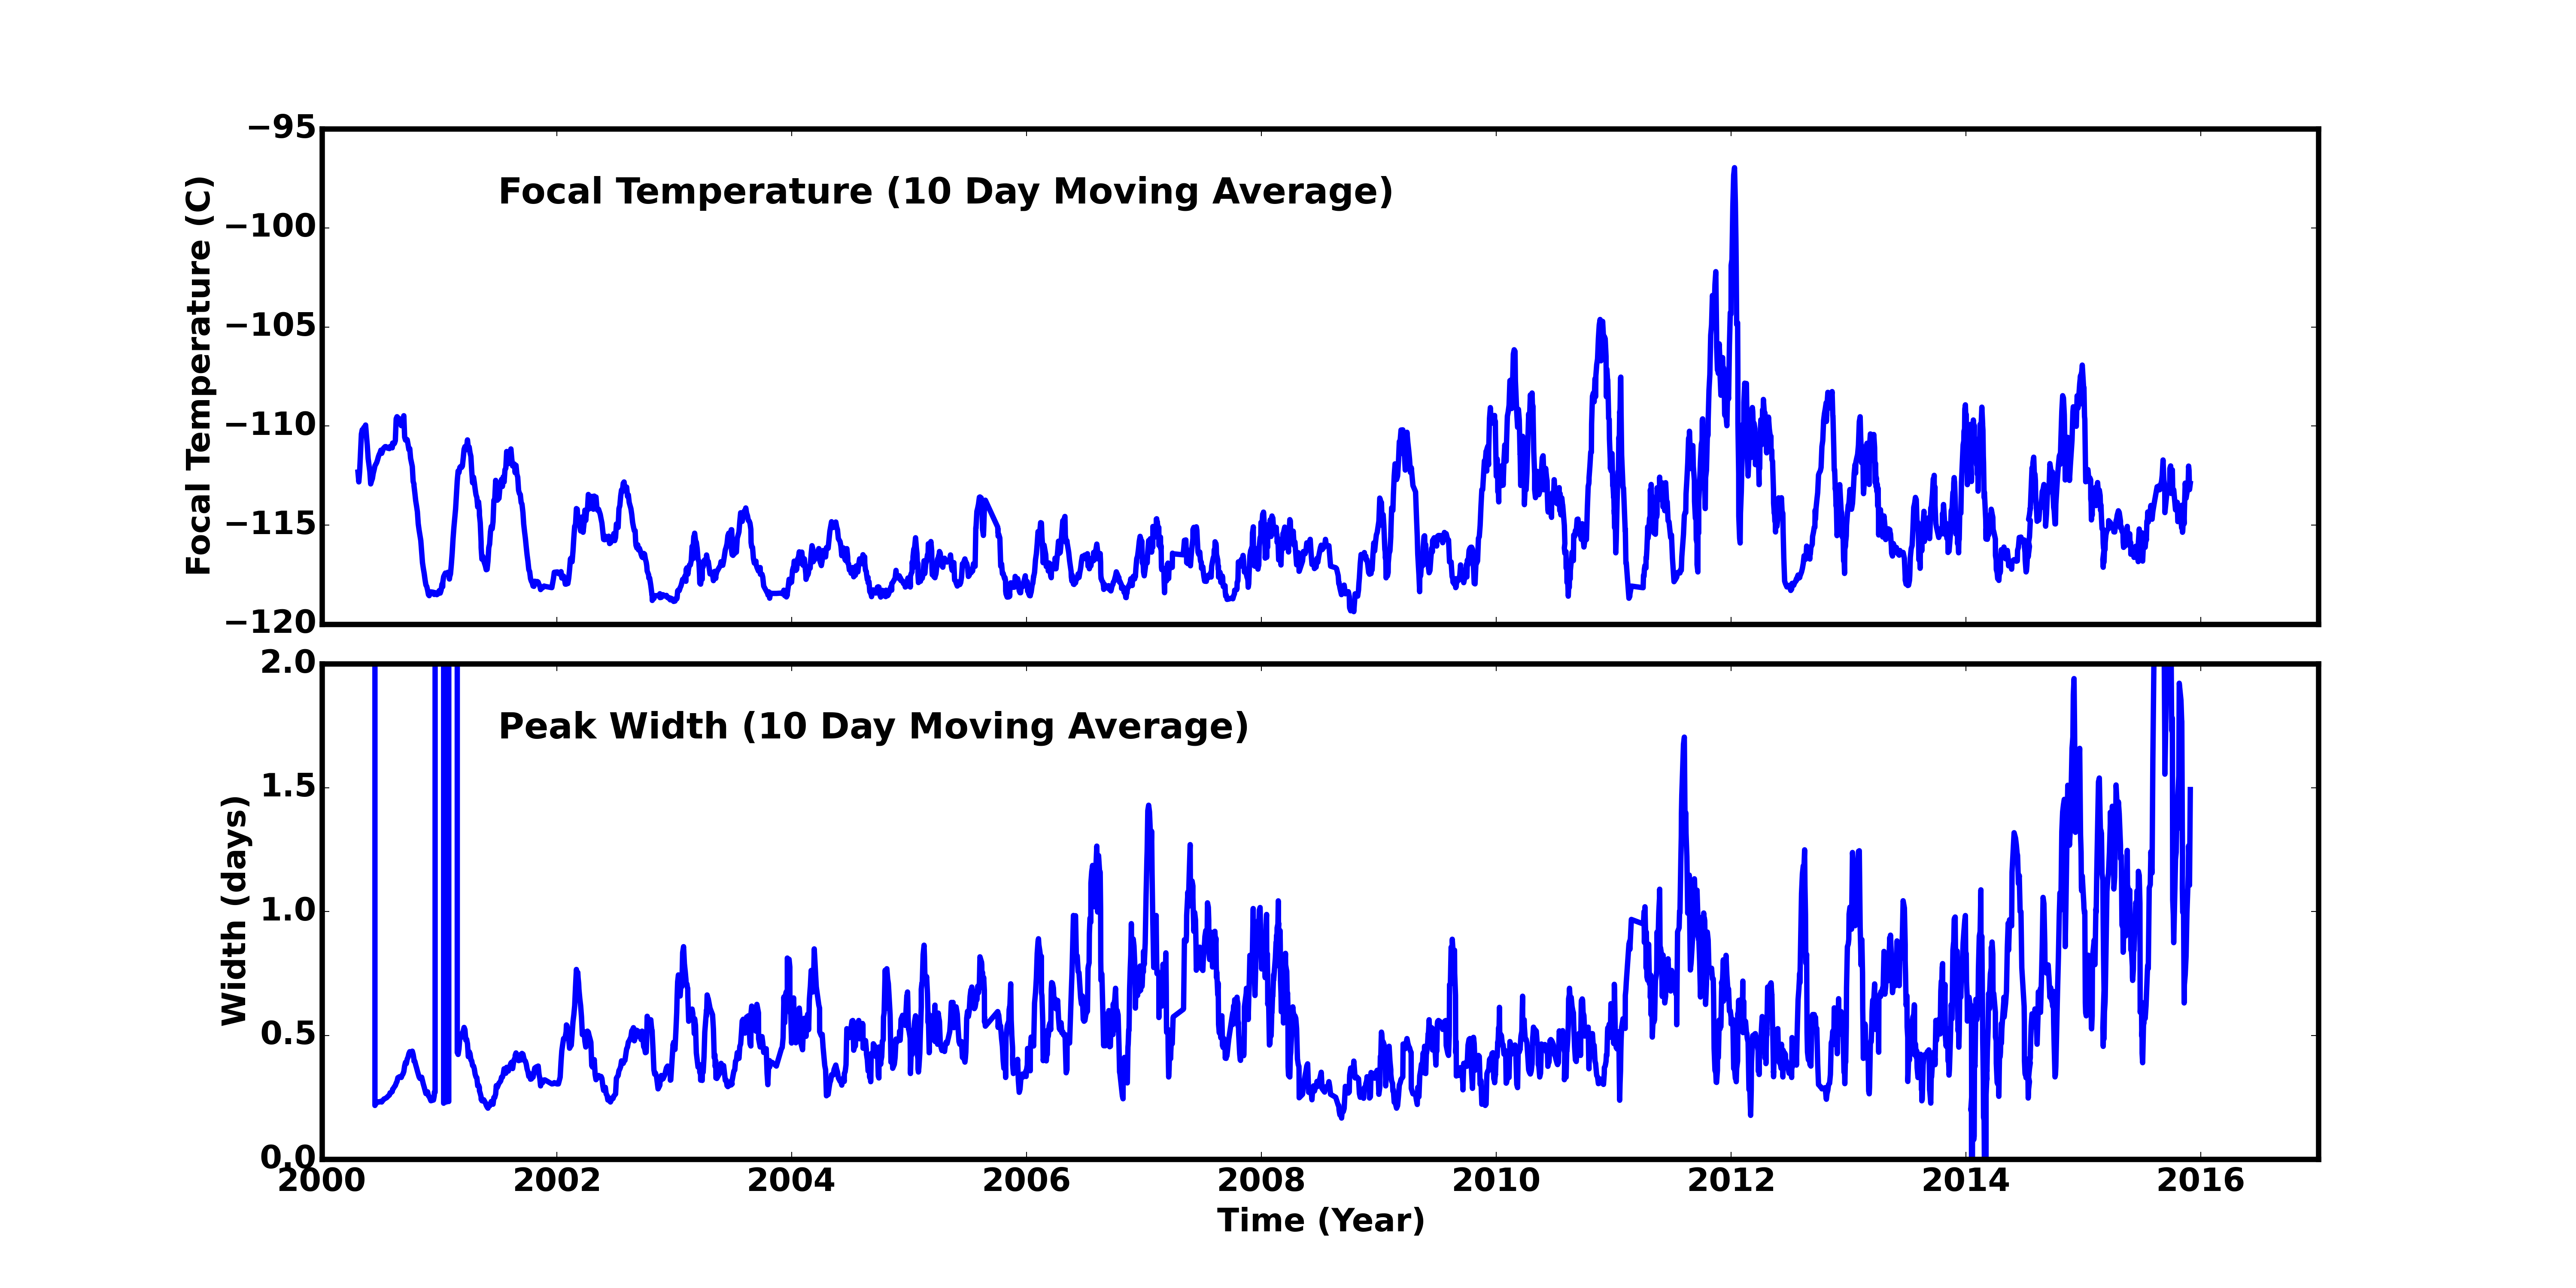
Focal Plane Temperature
Nov 2015 Focal Temperature
| The Mean (max) FPT: | |
|---|---|
| -113.50 | +/- 5.07 C |
| Mean Width: | |
| 1.12 | +/- 0.95 days |
Averaged Focal Plane Temperature
We are using 10 period moving averages to show trends of peak temperatures and peak widths. Note, the gaps in the width plot are due to missing/corrupted data.
Focal Plane Temperature, Sun Angle and Altitude
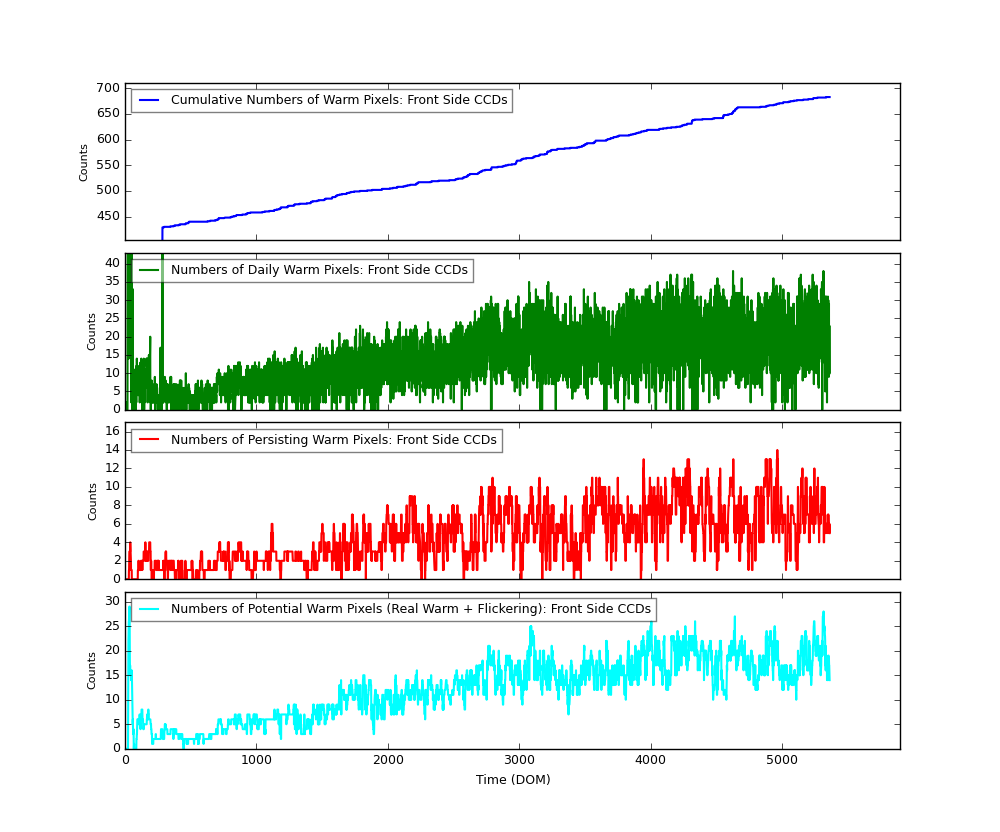
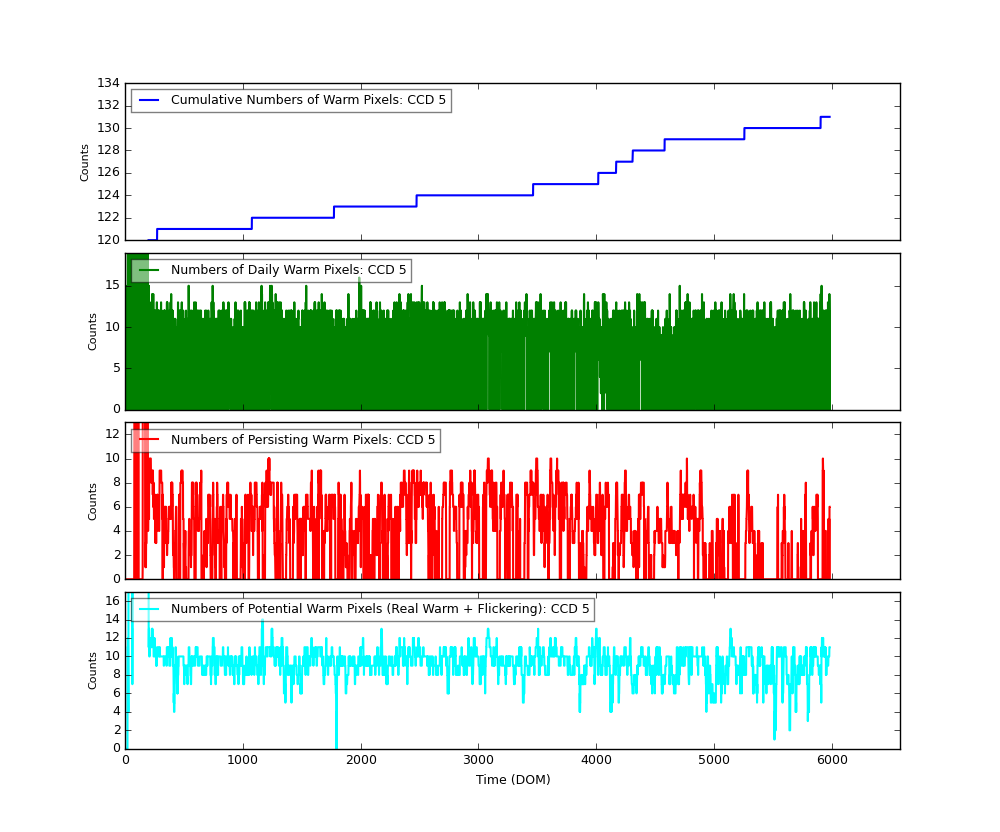
Bad Pixels
The plots below were generated with a new warm pixel finding script. Please see Acis Bad Pixel Page for details.
Front Side CCDs
Back Side CCD (CCD5)
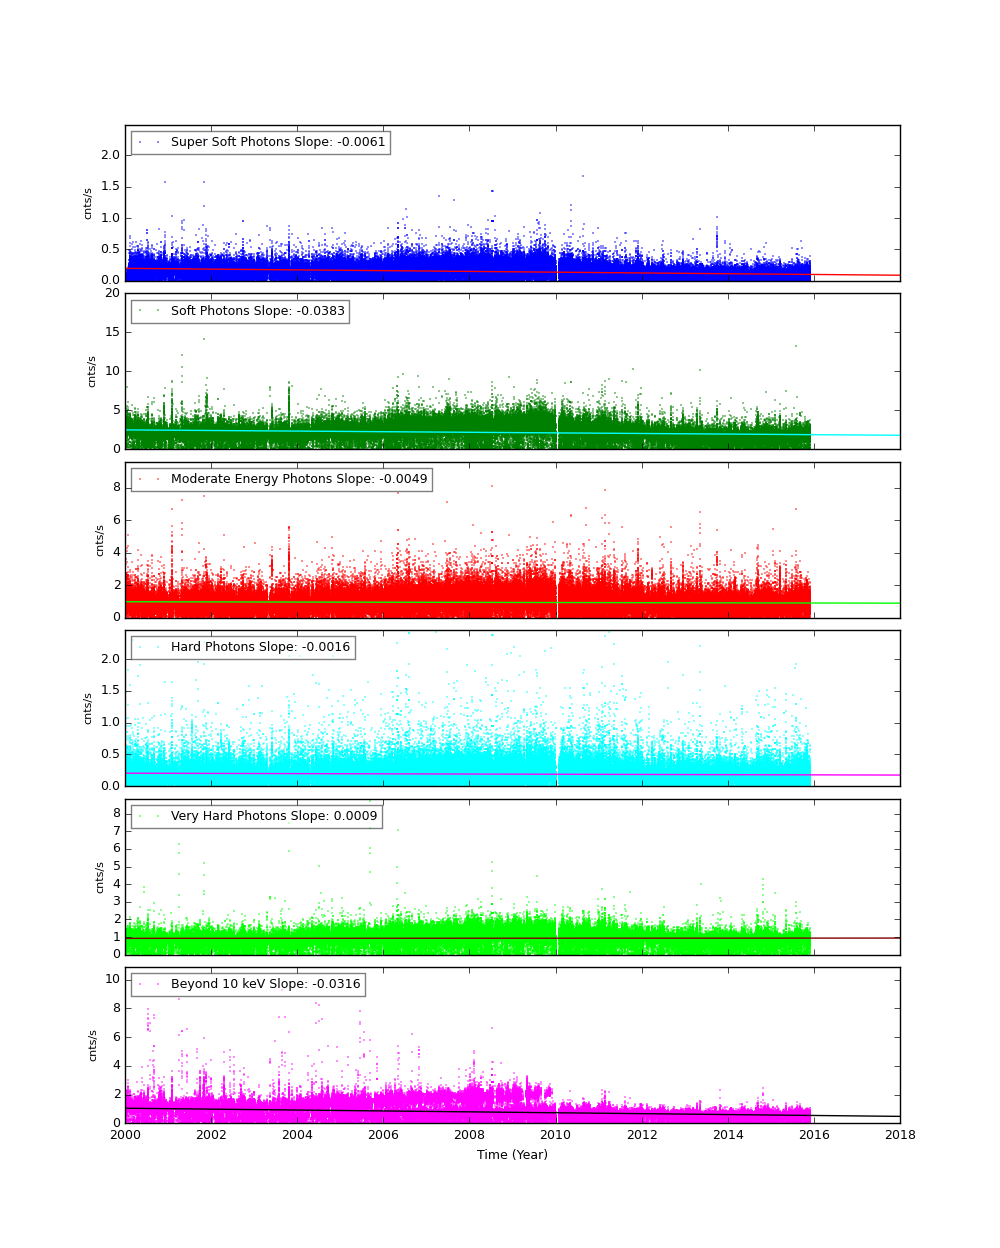
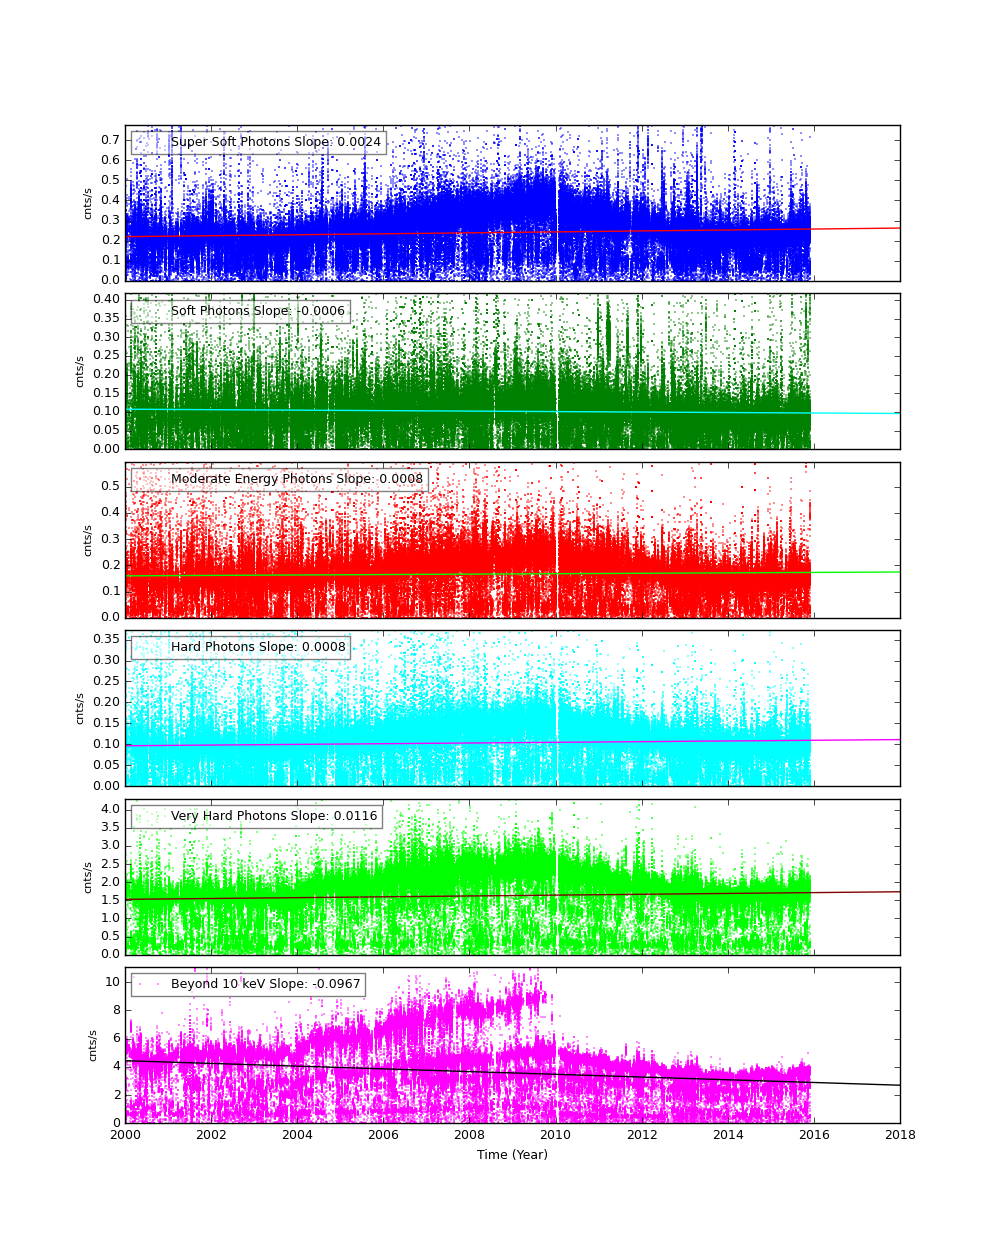
Science Instrument Background Rates
| Name | Low (keV) | High(KeV) | Description |
|---|---|---|---|
| SSoft | 0.00 | 0.50 | Super soft photons |
| Soft | 0.50 | 1.00 | Soft photons |
| Med | 1.00 | 3.00 | Moderate energy photons |
| Hard | 3.00 | 5.00 | Hard Photons |
| Harder | 5.00 | 10.00 | Very Hard photons |
| Hardest | 10.00 | Beyond 10 keV |
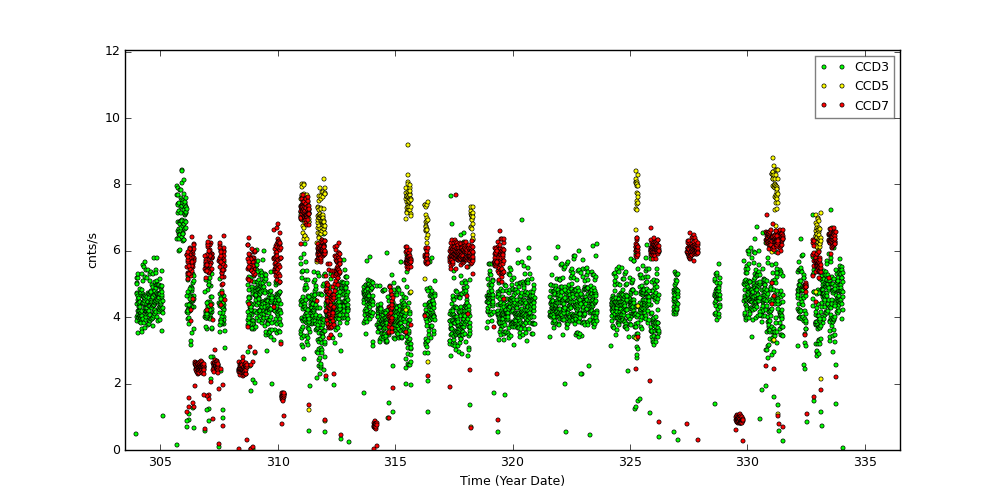
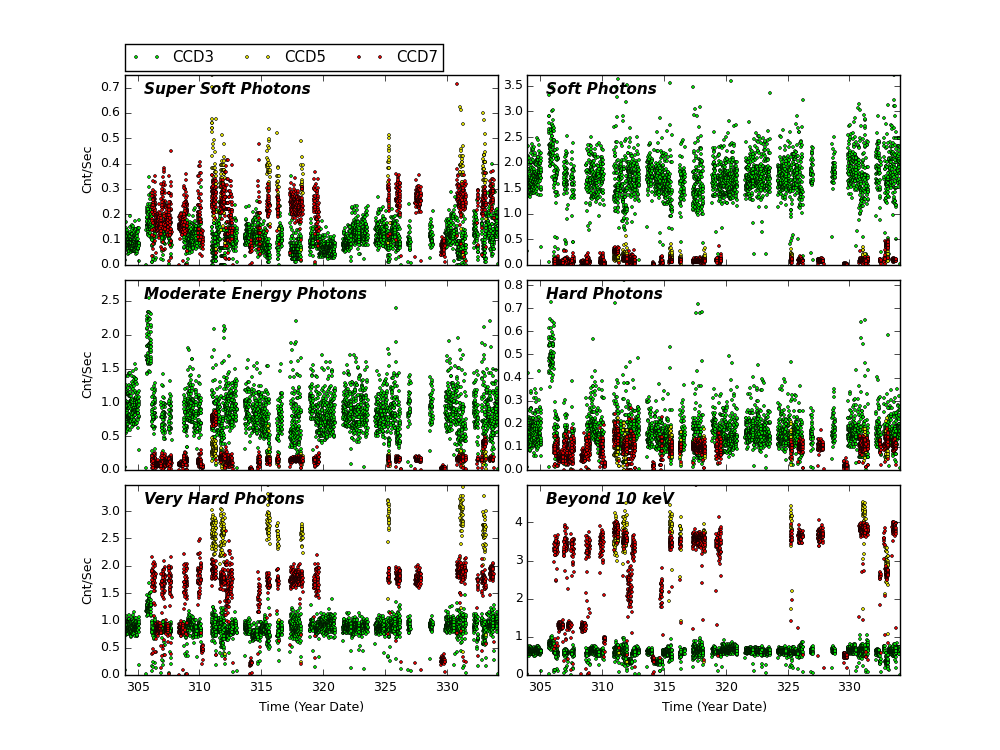
The following three plots show trends of SIB from year 2000. CCDs shown here are CCD3, CCD5, and CCD7. Fitted lines are linear fit after eliminating extreme outliers. For >10 keV plots, 2 lines are fit. One is with a 13 keV filter, and another without.
CCD 3
CCD 5

CCD 7
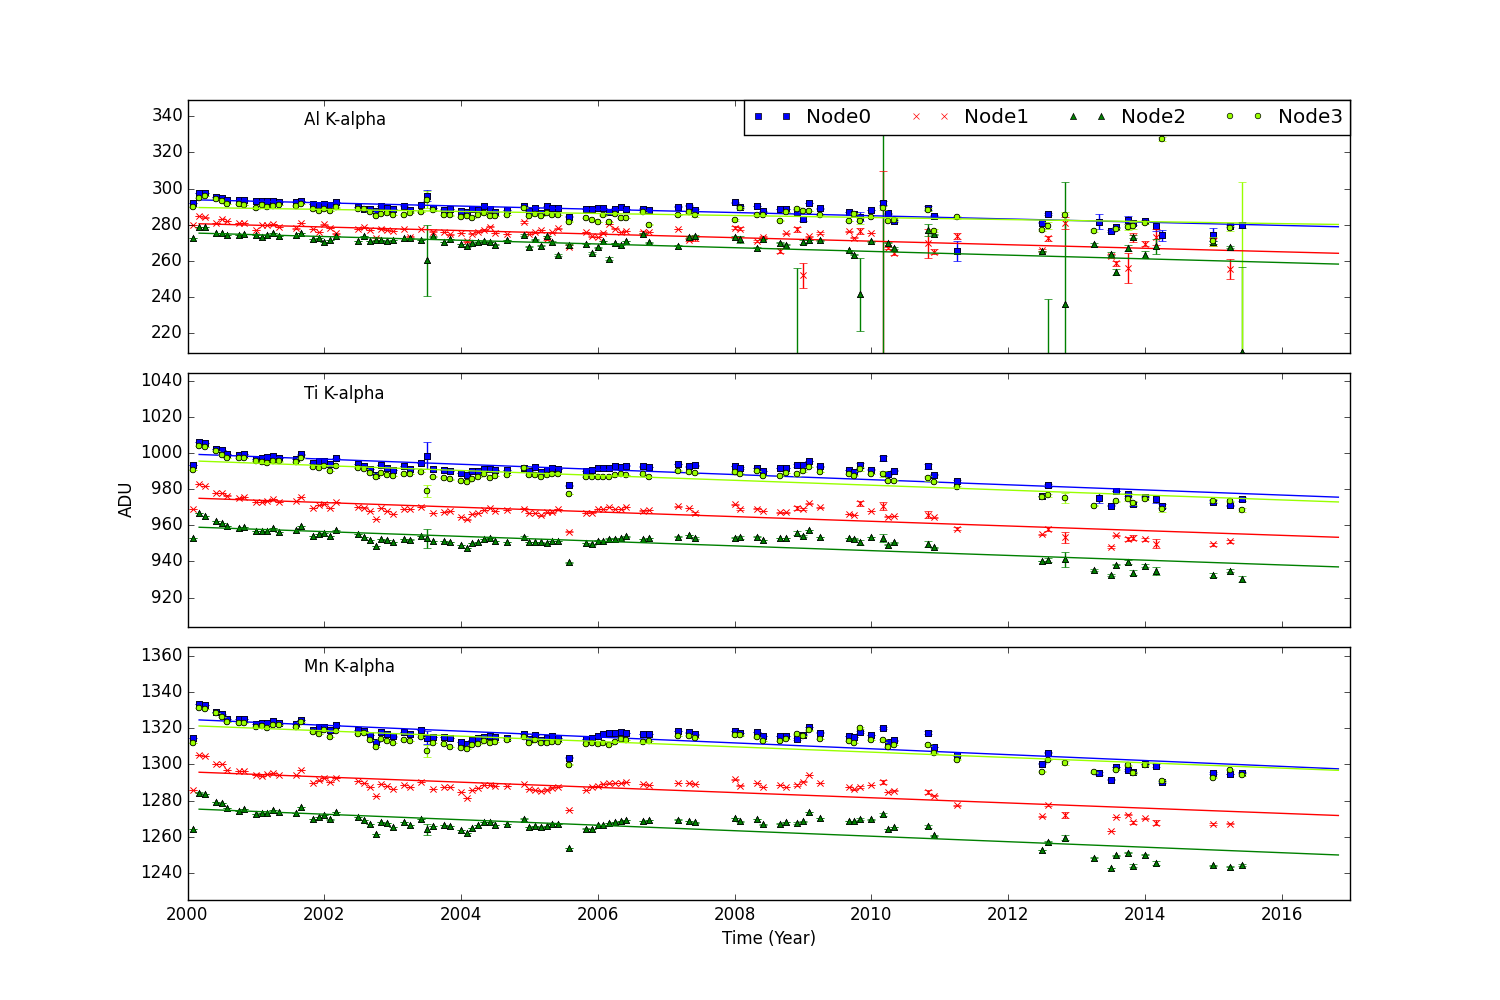
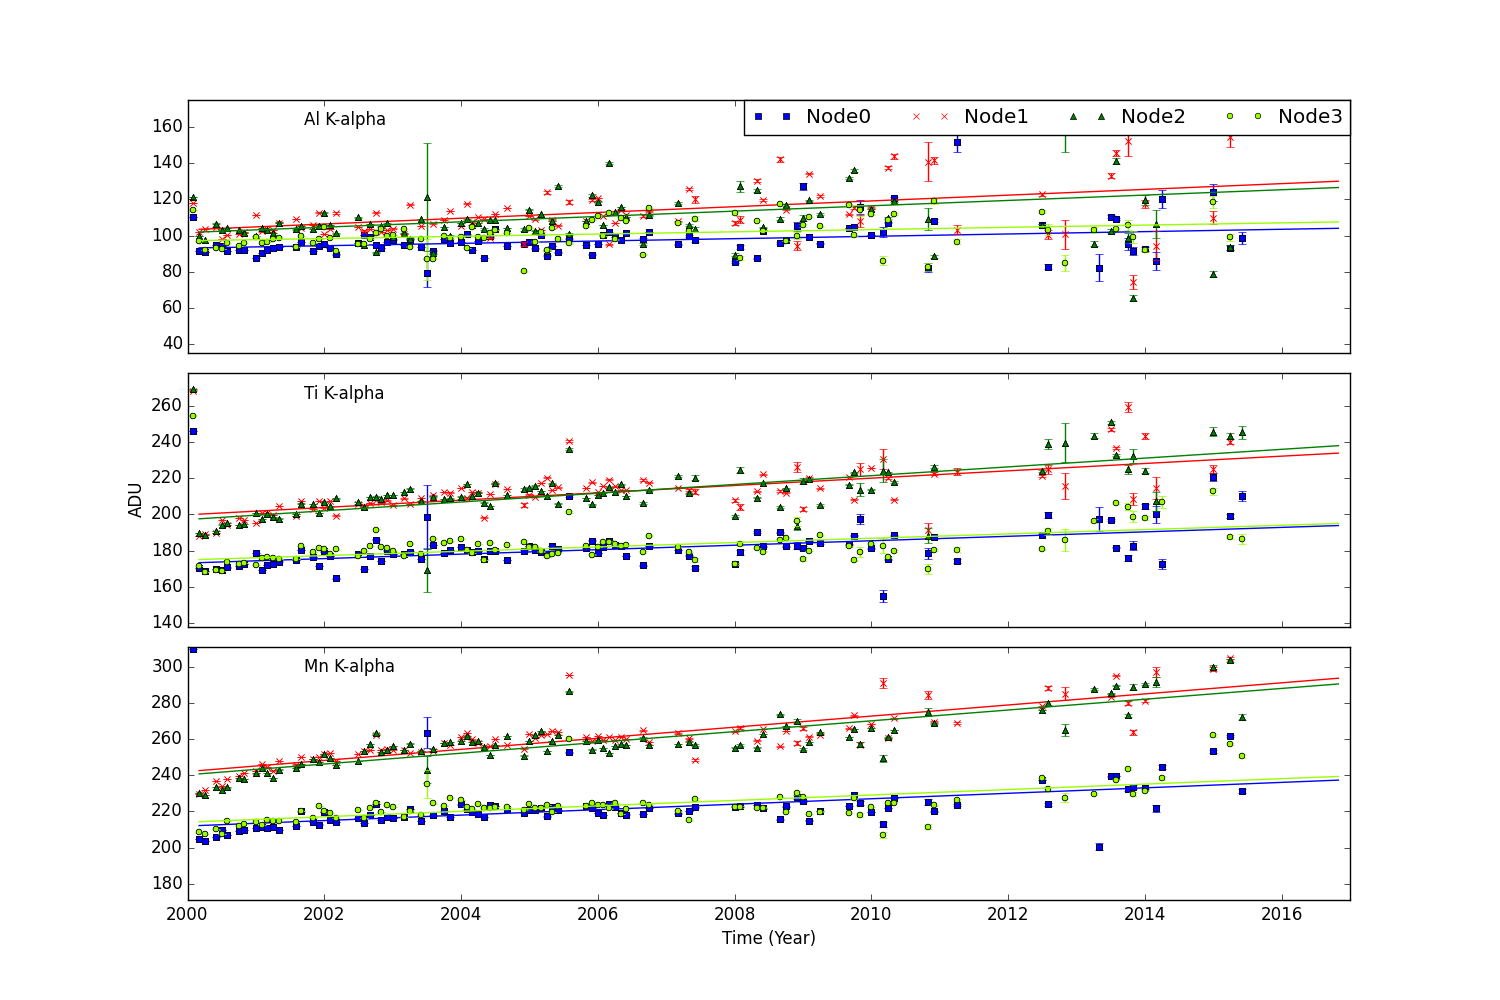
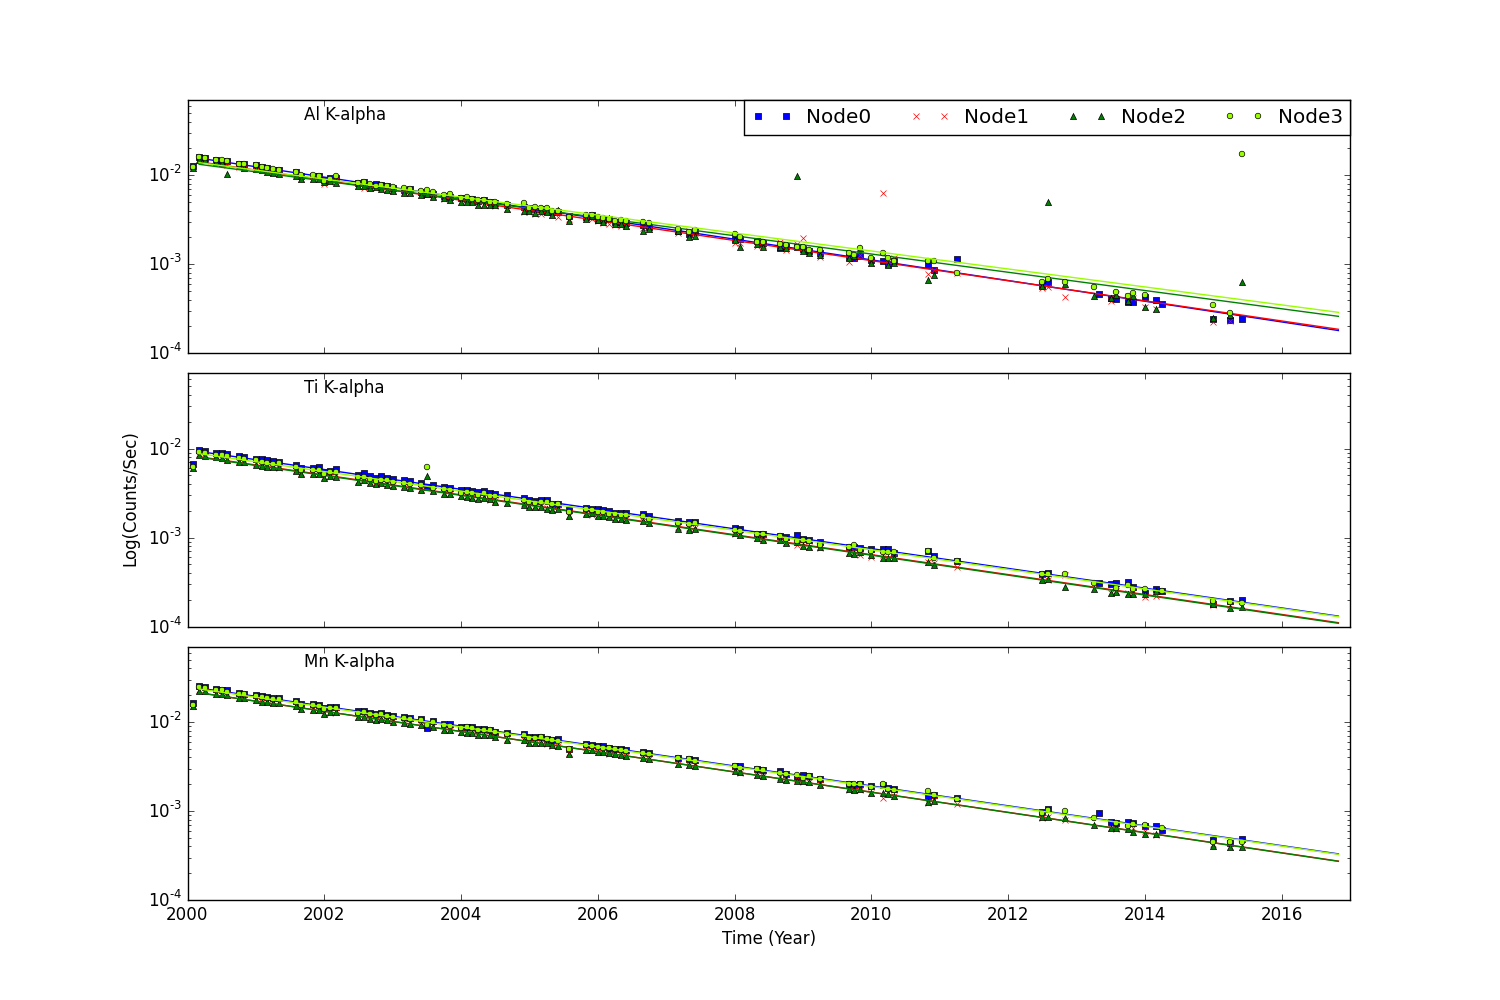
ACIS Histogram Mode Trends
We collected data from acis histogram mode data, and created trend plots of peak portions and peak widths against time (DOM). The peaks were estimated by fitting a simple Gaussian on three peaks (Al, Ti, and Mn), and the widths were estimated by a width at the half max from the peak.
All histogram data are taken under TIMED and GRADED_HIST mode, SIM position is at an external calibration source position, the focal temperature is around -119.7 C, and parameter settings in aciselec, acistemp are set to about same for all.
CCD 3, Peak Position
CCD 3, Peak Widths
CCD 3, Count Rates
HRC
DOSE of Central 4K Pore-Pairs
Please refer to Maximum Dose Trends for more details.
No Data
)
        IMAGE                NPIX      MEAN    STDDEV      MIN       MAX
HRCI_08_1999_11_2015.fits  16777216   4.350    4.933       0.0       292.0
)
     IMAGE                NPIX      MEAN    STDDEV      MIN       MAX
HRCS_11_2015.fits          16777216     0.063    0.3312     0.0        20.0
)
        IMAGE                NPIX     MEAN      STDDEV      MIN      MAX
HRCS_08_1999_11_2015.fits  16777216  15.882     28.278      0.0      1693.0
|
|
Max dose trend plots corrected for events that "pile-up"
in the center of the taps due to bad position information.
|
)
|
)
|
)
|
)
|
| Aug 2015 | May 2015 | Feb 2015 | Nov 2014 |
|---|
)
|
)
|
)
|
)
|
| Aug 2015 | May 2015 | Feb 2015 | Nov 2014 |
|---|
Gratings
Focus
We plot the width of the zero order streak of ACIS/HETG observations and the width of the zero order image for HRC/LETG observations of point sources. No significant defocusing trend is seen at this time. See Gratings Focus pages.
PCAD
ACA Trending
Gyro Bias Drift
Radiation History
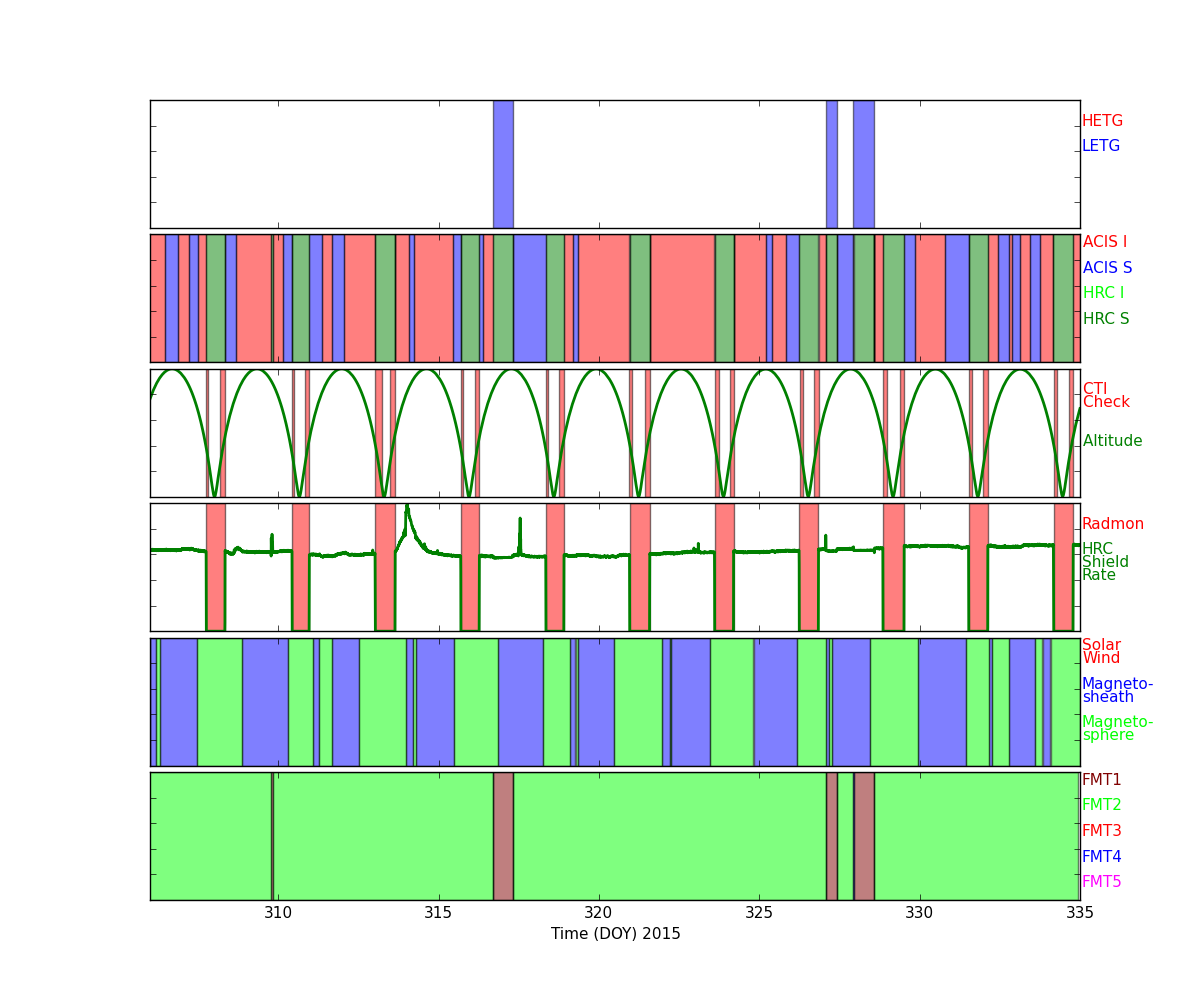
Radiation Zone Timing
Plotted below are radiation zone timing plots based on the following definitions of radiation zone:
- RADZONE - Ephin levels (in any of the E1300,P4GM,P41GM channels) are more than 1/3 of RADMON safing thresholds.
- RADMON - Radmon is disabled for radiation zone (as commanded based on OFLS model, for comparison with actual radiation levels).
- PERIGEE - Time of closest earth approach (for comparison)
Radiation Count Rates of Nov 2015
Sun Spot History
Trending
Quarterly Trends
- ACIS Temperature
| Previous Quarter | ||||||
| MSID | MEAN | RMS | DELTA/YR | DELTA/YR/YR | UNITS | DESCRIPTION |
| 1CBAT | 212.16 | 1.10 | 2.929e-01 | 2.100e+01 | K | CAMERA BODY TEMP. A |
| 1DACTBT | 258.48 | 2.84 | 4.902e+00 | 1.942e+02 | K | DA COLLIMATOR TEMP. B |
| 1DEAMZT | 291.86 | 8.20 | -1.361e+01 | -1.814e+02 | K | DEA -Z PANEL TEMP |
| 1DPAMYT | 292.77 | 8.63 | -1.592e+01 | -1.211e+02 | K | DPA -Y PANEL TEMP |
| 1OAHAT | 246.64 | 1.80 | 1.317e+00 | 8.497e+01 | K | OPEN ACTUATOR HOUSING TEMP. A |
| 1PDEAAT | 307.33 | 8.51 | 2.155e+01 | 1.098e+03 | K | PSMC DEA PS A TEMP |
| 1PIN1AT | 294.58 | 7.66 | 2.031e+01 | 9.675e+02 | K | PSMC TEMP 1A |
| 1WRAT | 193.23 | 1.53 | -2.858e+00 | -7.055e+01 | K | WARM RADIATOR TEMP. A |
)
)
)
)
)
)
)
)
- ACIS Electronics Side B
| Previous Quarter | ||||||
| MSID | MEAN | RMS | DELTA/YR | DELTA/YR/YR | UNITS | DESCRIPTION |
| 1DAHBCU | 0.29 | 0.17 | 2.359e-01 | 5.067e+00 | AMP | DA HEATER CURRENT B |
| 1DAHBVO | 3.90 | 2.36 | 3.133e+00 | 6.523e+01 | V | DA HEATER VOLTAGE B |
| 1DAHHBVO | 27.97 | 0.20 | -1.971e+00 | 7.397e-01 | V | DA HOUSING HEATER INPUT VOLTAGE B |
| 1DE28BVO | 27.98 | 0.20 | -2.071e+00 | -4.464e-01 | V | DEA +28V INPUT B |
| 1DP28BVO | 27.99 | 0.19 | -2.075e+00 | 4.336e-02 | V | DPA +28V INPUT B |
)
)
)
)
)
- DEA HK Temperature
| Previous Quarter | ||||||
| MSID | MEAN | RMS | DELTA/YR | DELTA/YR/YR | UNITS | DESCRIPTION |
| DEAHK1 | 23.63 | 8.22 | -1.588e+01 | -4.431e+02 | C | DPA Thermistor 1 - BEP PC Board |
| DEAHK2 | 21.91 | 8.38 | -1.618e+01 | -4.524e+02 | C | DPA Thermistor 2 - BEP Oscillator |
| DEAHK7 | 20.43 | 9.24 | -1.691e+01 | -4.379e+02 | C | DPA Thermistor 7 - FEP 0 Frame Buf. |
| DEAHK8 | 28.51 | 9.01 | -1.618e+01 | -4.249e+02 | C | DPA Thermistor 8 - FEP 1 Mongoose |
)
)
)
)
Envelope Trending
EPS Battery
HRMA Heaters
Spacecraft Motions
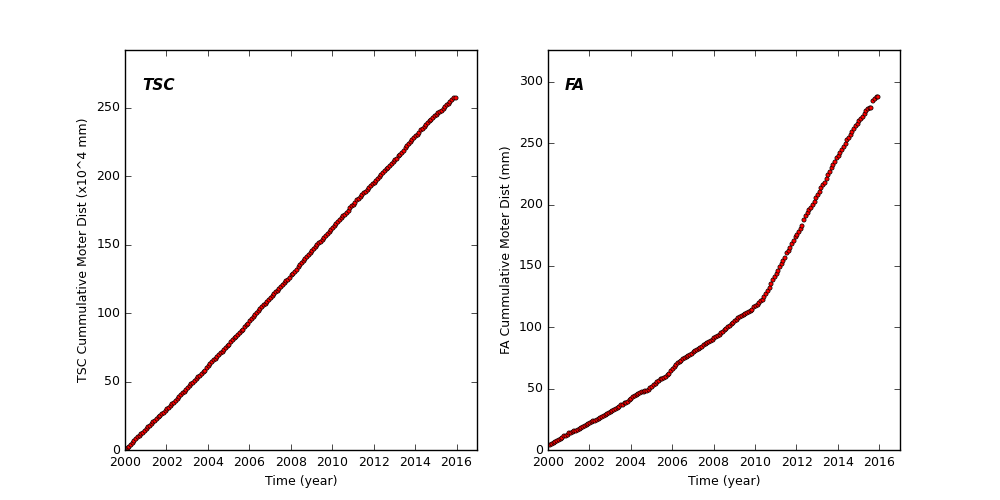
TSC and FA Cummulative Moter Distance
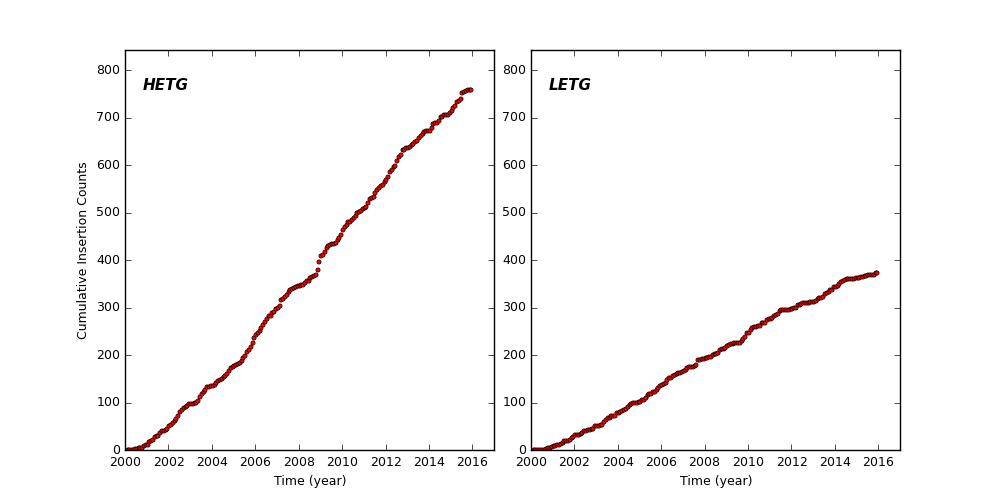
HETG and LETG Cummulative Insertion Counts
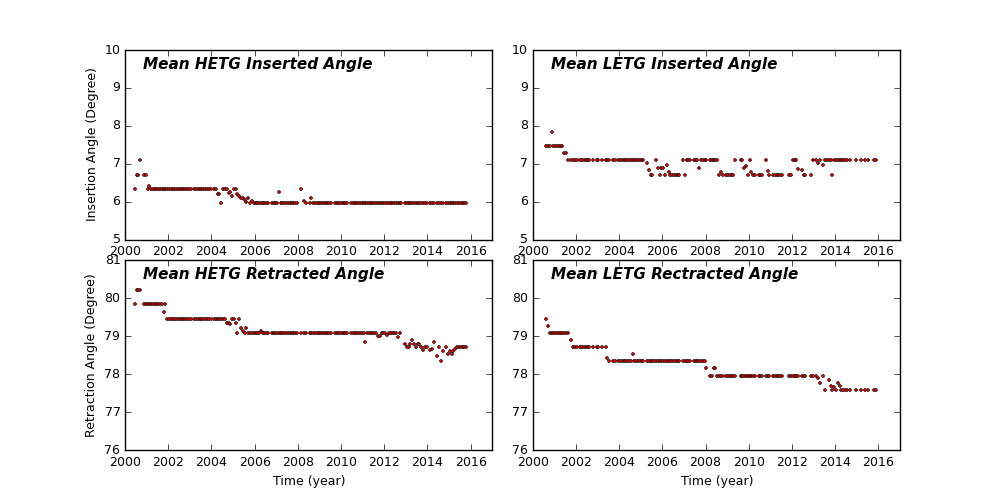
HETG/LETG Insertion/Retraction Angle
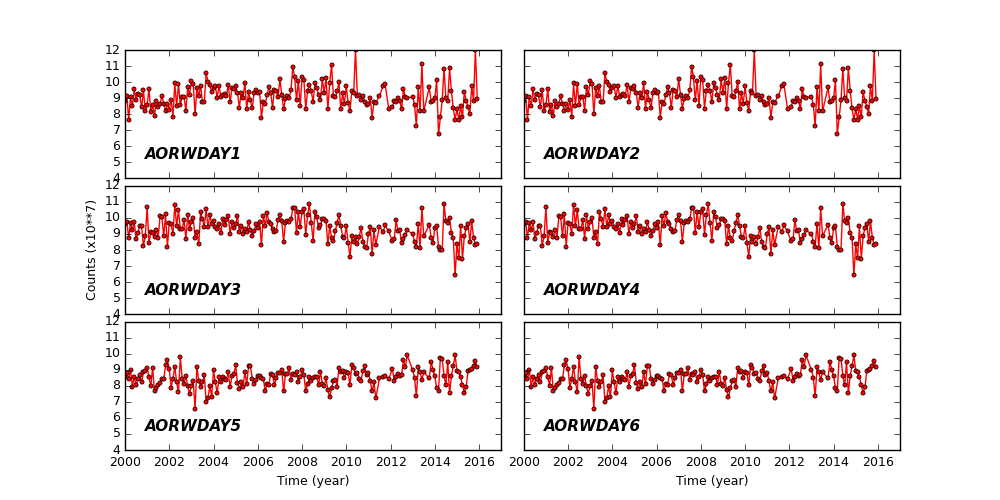
Reaction Wheel Rotations
Links to Past Monthly Reports
| Year | Month | |||||||||||
|---|---|---|---|---|---|---|---|---|---|---|---|---|
| 2015 | Jan | Feb | Mar | Apr | May | Jun | Jul | Aug | Sep | Oct | ||
| 2014 | Jan | Feb | Mar | Apr | May | Jun | Jul | Aug | Sep | Oct | Nov | Dec |
| 2013 | Jan | Feb | Mar | Apr | May | Jun | Jul | Aug | Sep | Oct | Nov | Dec |
| 2012 | Jan | Feb | Mar | Apr | May | Jun | Jul | Aug | Sep | Oct | Nov | Dec |
| 2011 | Jan | Feb | Mar | Apr | May | Jun | Jul | Aug | Sep | Oct | Nov | Dec |
| 2010 | Jan | Feb | Mar | Apr | May | Jun | Jul | Aug | Sep | Oct | Nov | Dec |
| 2009 | Jan | Feb | Mar | Apr | May | Jun | Jul | Aug | Sep | Oct | Nov | Dec |
| 2008 | Jan | Feb | Mar | Apr | May | Jun | Jul | Aug | Sep | Oct | Nov | Dec |
| 2007 | Jan | Feb | Mar | Apr | May | Jun | Jul | Aug | Sep | Oct | Nov | Dec |
| 2006 | Jan | Feb | Mar | Apr | May | Jun | Jul | Aug | Sep | Oct | Nov | Dec |
| 2005 | Jan | Feb | Mar | Apr | May | Jun | Jul | Aug | Sep | Oct | Nov | Dec |
| 2004 | Jan | Feb | Mar | Apr | May | Jun | Jul | Aug | Sep | Oct | Nov | Dec |
| 2003 | Jan | Feb | Mar | Apr | May | Jun | Jul | Aug | Sep | Oct | Nov | Dec |
| 2002 | Jan | Feb | Mar | Apr | May | Jun | Jul | Aug | Sep | Oct | Nov | Dec |
| 2001 | Jan | Feb | Mar | Apr | May | Jun | Jul | Aug | Sep | Oct | Nov | Dec |
| 2000 | Jan | Feb | Mar | Apr | May | Jun | Jul | Aug | Sep | Oct | Nov | Dec |
| 1999 | Jul | Aug | Sep | Oct | Nov | Dec | ||||||