ACIS
ACIS DOSE Registered-Photon-Map
The steps we took to compute the dose map are;
- Level 1 Event files for a specified month are obtained from archive.
- Image data including I2, I3, S2, S3 CCDs are extracted from all event files.
- All the extracted image data were merged to create a month long exposure map for the month.
- The exposure map is opened with ds9, and check a distribution of count rates against energy. From this, estimate the upper threshold value. Any events beyond this upper threshold are assumed erroneous events such as bad pixels.
- Using this upper threshold, the data is filtered, and create a cleaned exposure map for the month.
- The exposure map from each month from the Sep 1999 is added up to create a cumulative exposure map for each month.
- Using fimgstatistic, we compute count rate statistics for each CCDs.
- For observations with high data drop rates (e.g., Crab nebula, Cas A), we corrected the observations by adding events.
Please check more detail plots at Telemetered Photon Dose Trend page.
)
)
)
Statistics:
# IMAGE     NPIX     MEAN        RMS        MIN     MAX


ACIS_feb16 6004901   6.266       9.246      0.0     1524

I2 node 0  262654   6.114971    2.911421    0.0    56.0
I2 node 1  262654   6.440065    3.799200    0.0  1003.0
I2 node 2  262654   6.303885    2.947435    0.0    56.0
I2 node 3  262654   6.360905    3.092194    0.0    67.0

I3 node 0  262654   6.805602    3.146064    0.0    64.0
I3 node 1  262654   7.063983    6.399694    0.0   146.0
I3 node 2  262654   6.623959    3.213572    0.0    67.0
I3 node 3  262654   6.542113    3.262520    0.0   558.0

S2 node 0  262654   8.281101    4.518328    0.0  1506.0
S2 node 1  262654   8.511932    4.977077    0.0  1524.0
S2 node 2  262654   8.679010    4.630241    0.0  1306.0
S2 node 3  262654   8.429791    3.753327    0.0   563.0

S3 node 0  262654   12.443700  16.648700    0.0   267.0
S3 node 1  262654   10.969215   5.594883    0.0    92.0
S3 node 2  262654   10.281074   4.288367    0.0    41.0
S3 node 3  262654   9.392001    4.115334    0.0    38.0
)
)
)
Statistics:
 IMAGE     NPIX      MEAN        RMS          MIN    MAX


ACIS_total 6004901   1990.193    2598.075     0.0   114141

I2 node 0  262654   1689.472630  324.734559  339.0   9252.0
I2 node 1  262654   1779.865456  448.062199  363.0  45704.0
I2 node 2  262654      6.303885   2.947435     0.0     56.0
I2 node 3  262654   1810.710034  457.207124  347.0  28202.0

I3 node 0  262654   1906.436520  456.586505  339.0   7440.0
I3 node 1  262654   1996.725439 1507.432373  343.0  37646.0
I3 node 2  262654   1746.079019  315.259998  332.0   9297.0
I3 node 3  262654      6.542113    3.262520    0.0    558.0

S2 node 0  262654   2324.632215  338.936070 1240.0  21393.0
S2 node 1  262654      8.511932    4.977077   0.0    1524.0
S2 node 2  262654   2725.325984  520.028544 1661.0  27346.0
S2 node 3  262654   2662.575611  376.022866 1559.0  46321.0

S3 node 0  262654   4131.860126 1841.258627 1710.0  13847.0
S3 node 1  262654   5330.641616 2137.187106    0.0  14314.0
S3 node 2  262654   4108.620565 1044.270248 1704.0   9918.0
S3 node 3  262654   3174.156124  480.607516 1815.0  10729.0
)
|
)
|
)
|
)
|
| Nov 2015 | Aug 2015 | May 2015 | Feb 2015 |
|---|
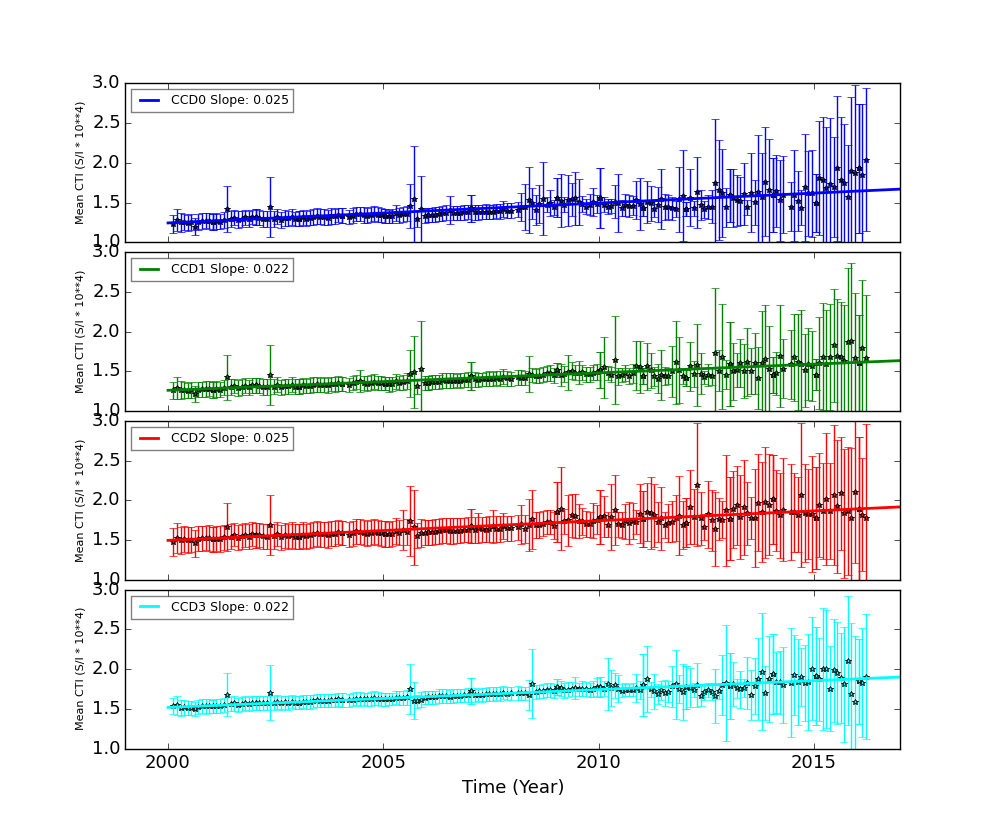
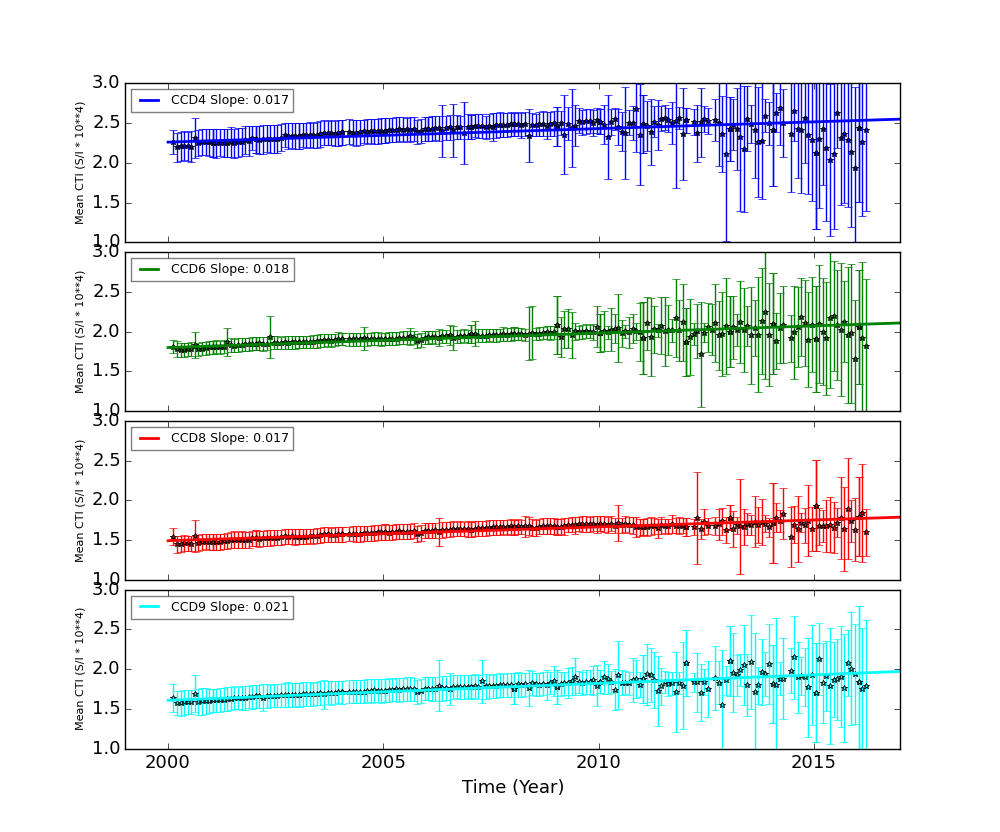
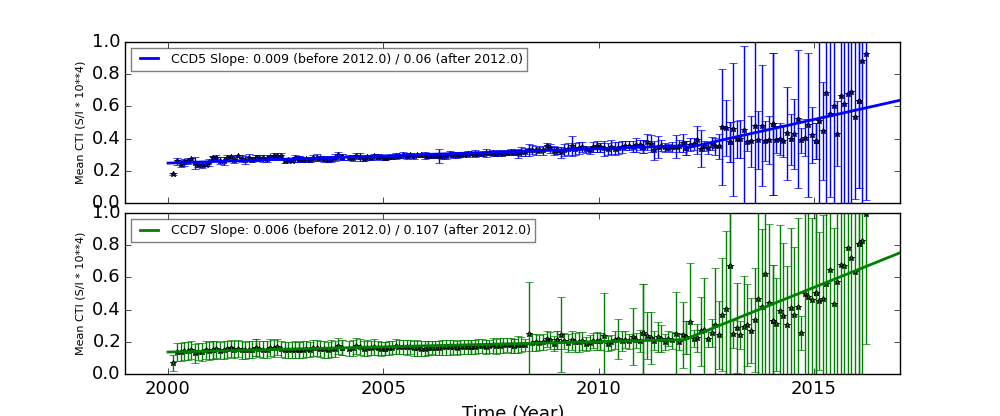
The Mean Detrended CTI
We report CTIs with a refined data definition. CTIs were computed for the temperature dependency corrected data. Please see CTI page for detailed explanation. CTI's are computed for Mn K alpha, and defined as slope/intercept x10^4 of row # vs ADU. Data file: here
Imaging CCDs
Spectral CCDs
Backside CCDs
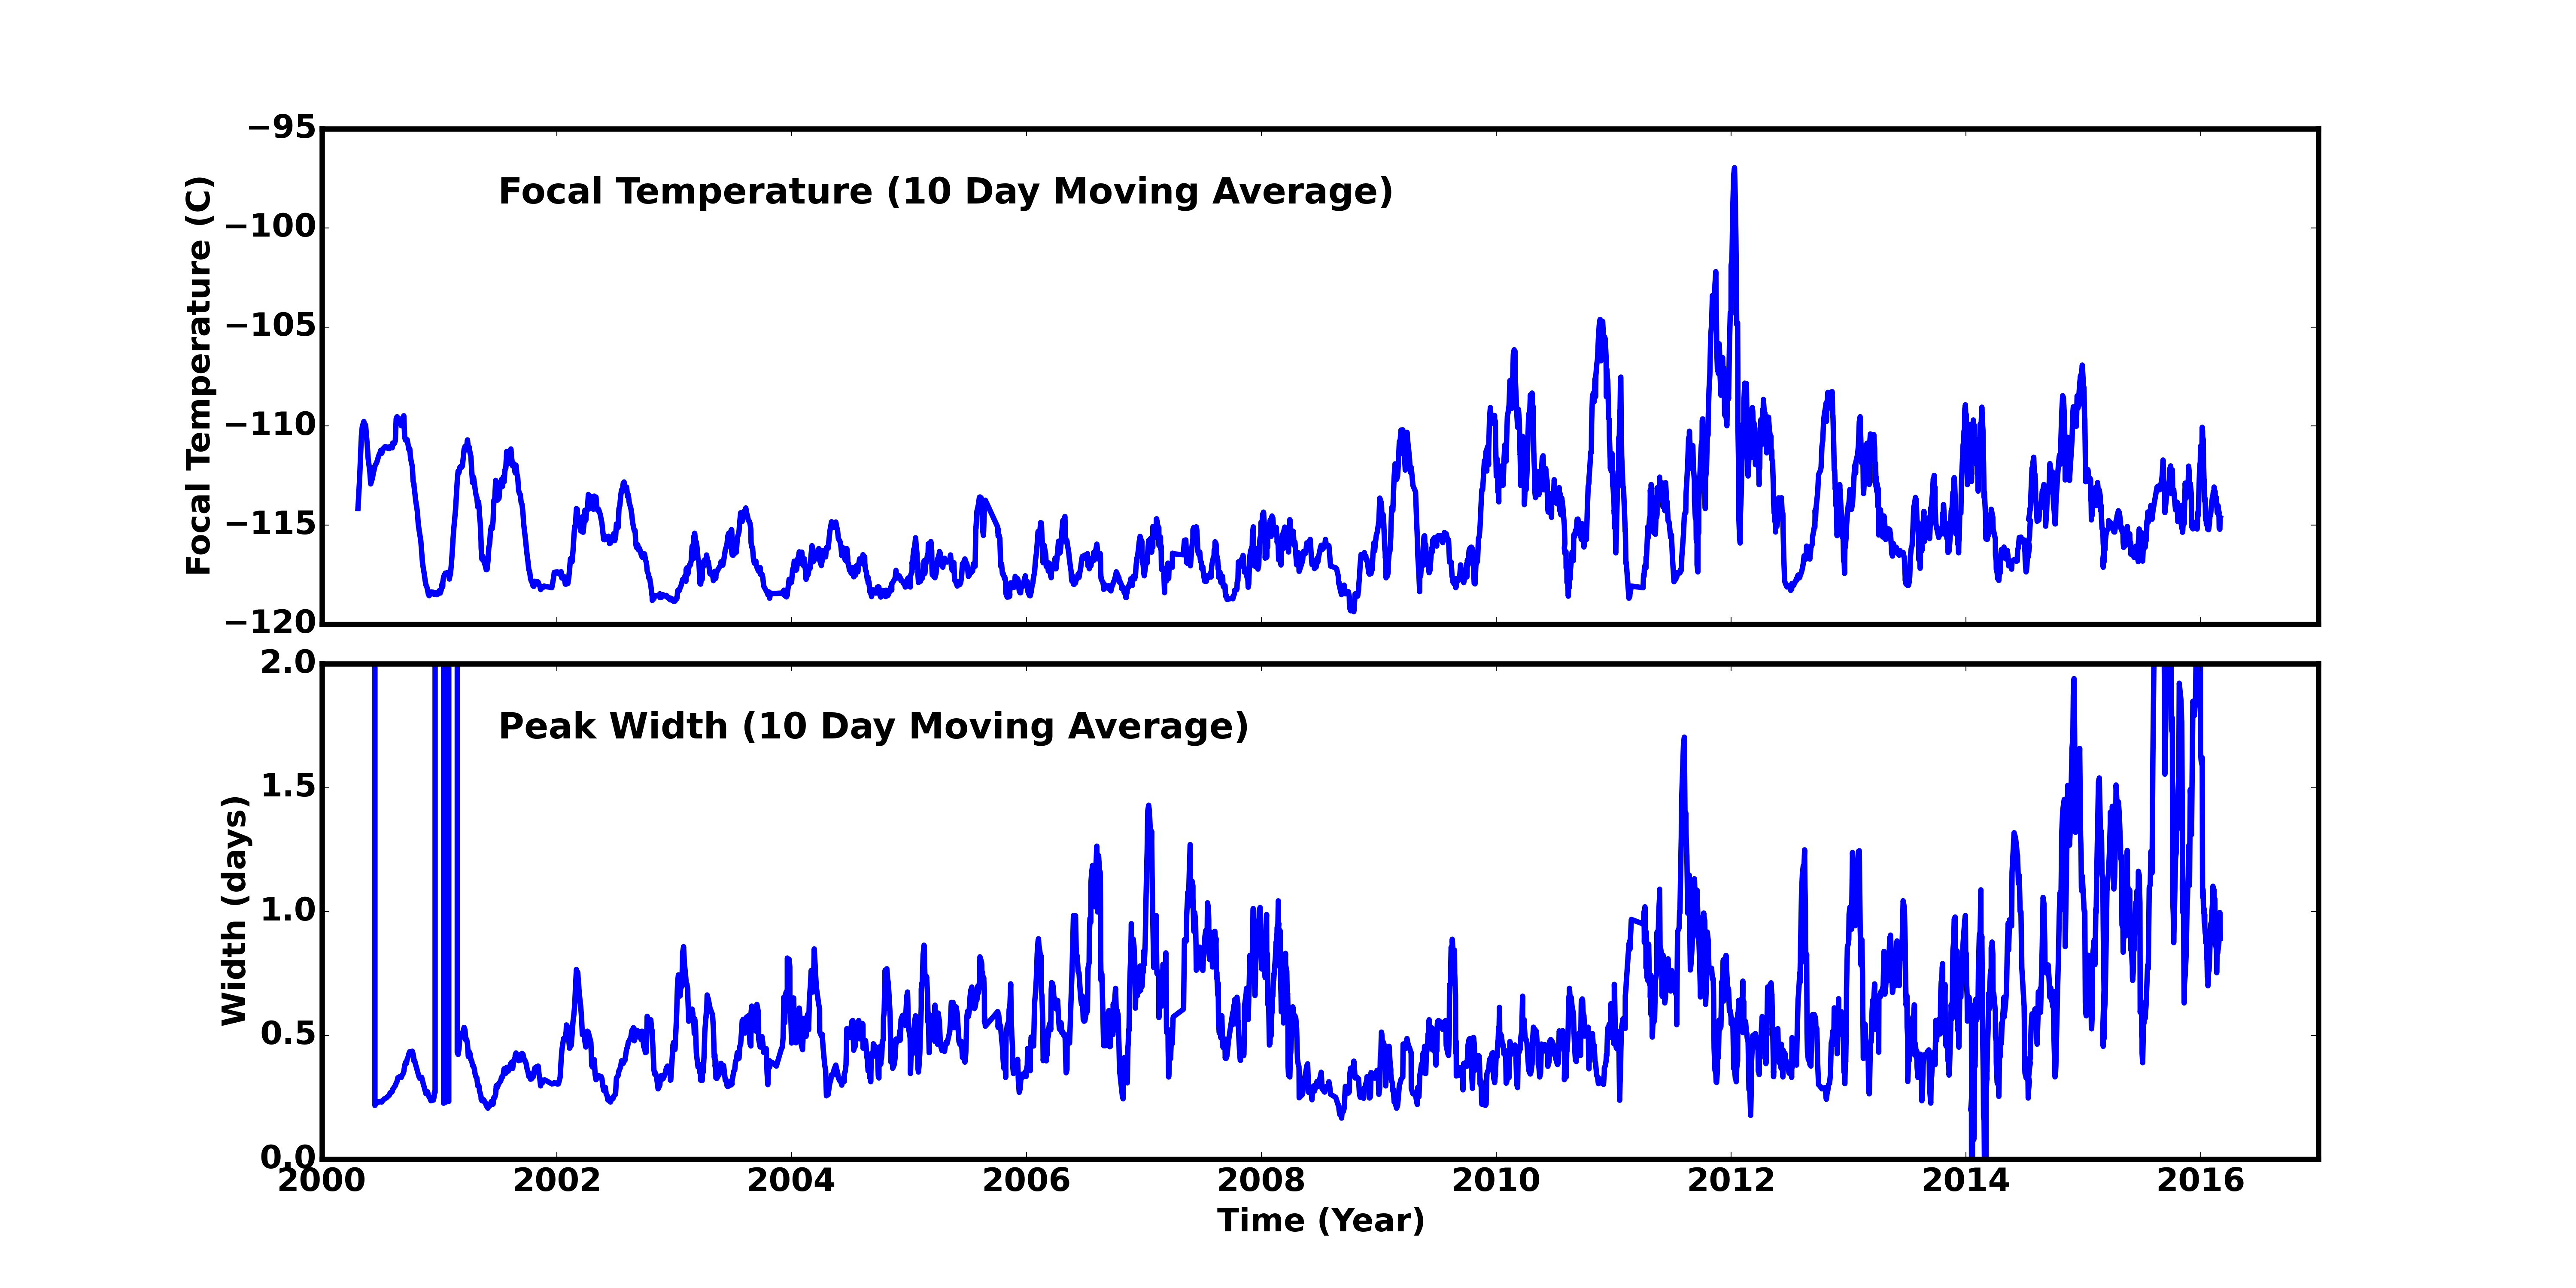
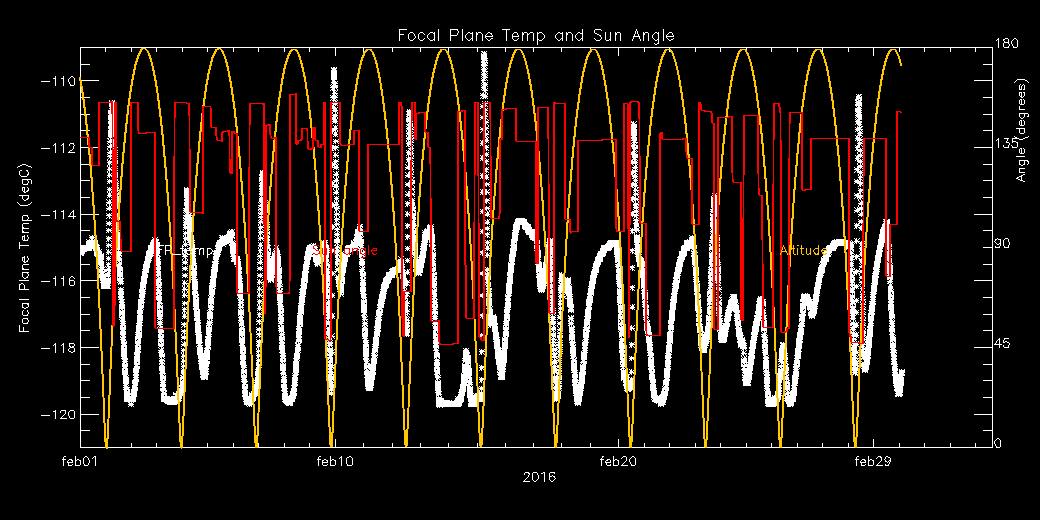
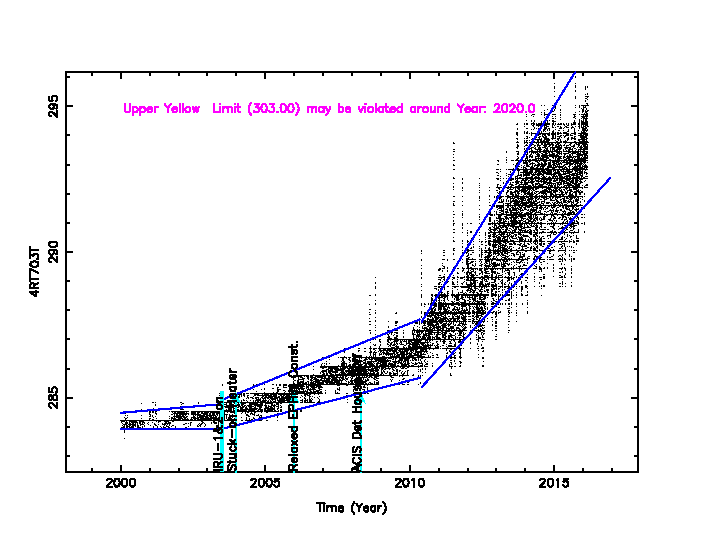
Focal Plane Temperature
Feb 2016 Focal Temperature
| The Mean (max) FPT: | |
|---|---|
| -114.13 | +/- 2.18 C |
| Mean Width: | |
| 0.93 | +/- 0.44 days |
Averaged Focal Plane Temperature
We are using 10 period moving averages to show trends of peak temperatures and peak widths. Note, the gaps in the width plot are due to missing/corrupted data.
Focal Plane Temperature, Sun Angle and Altitude
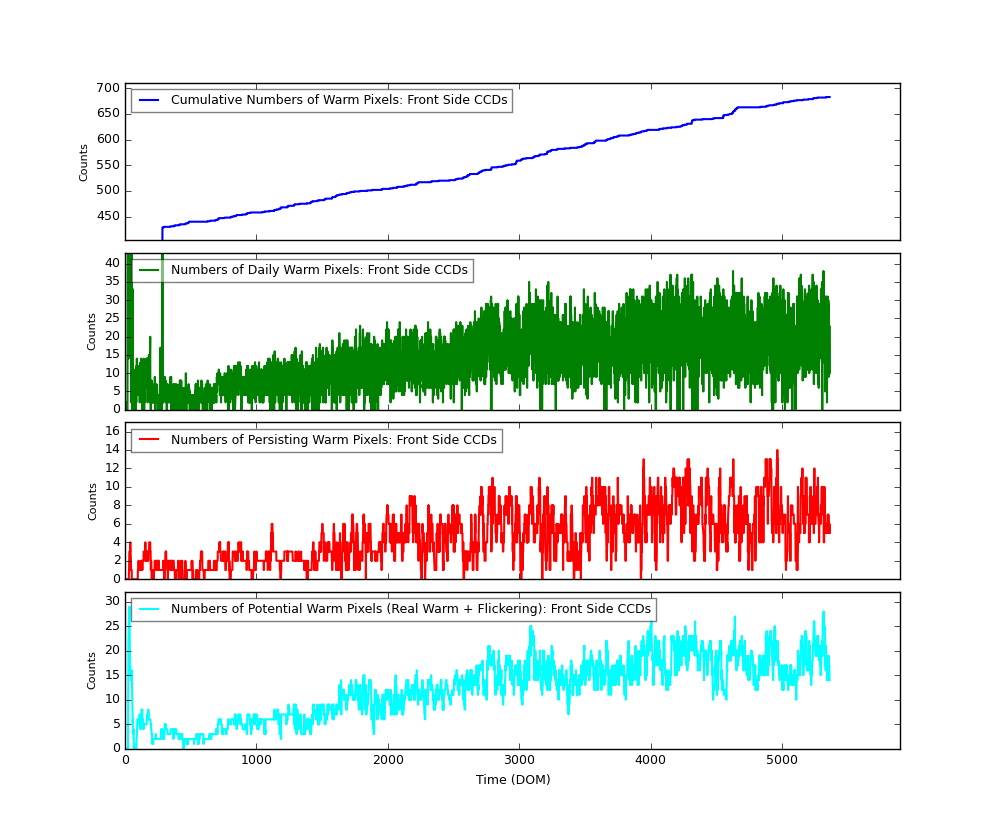
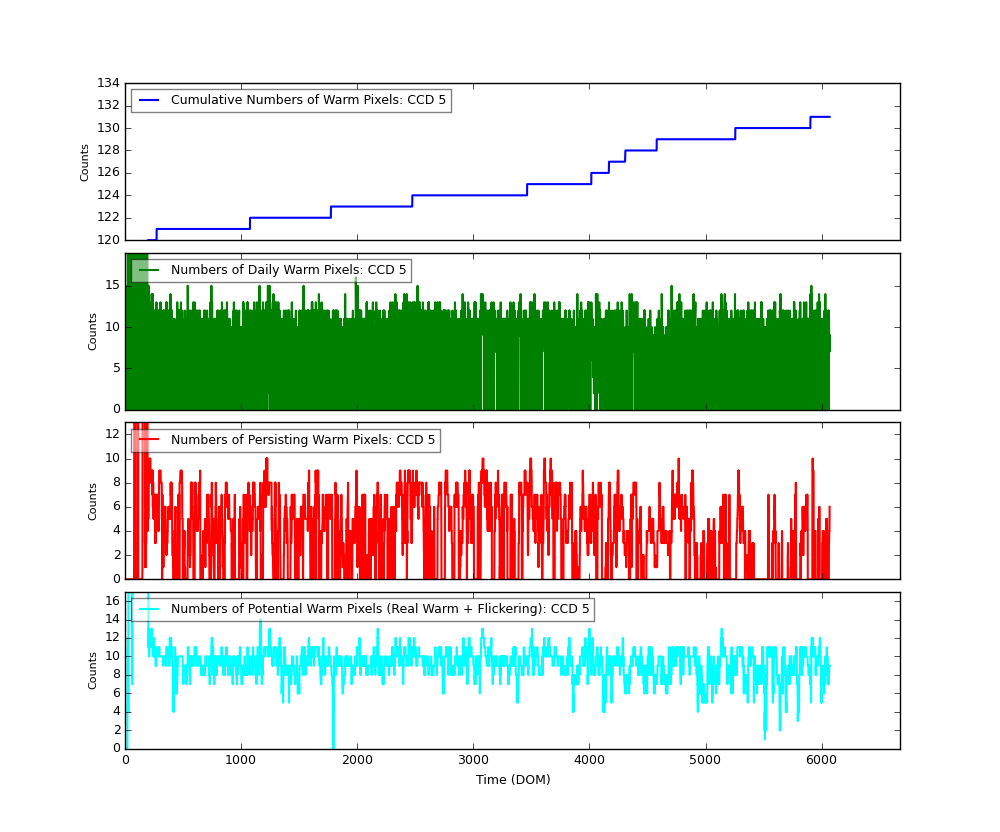
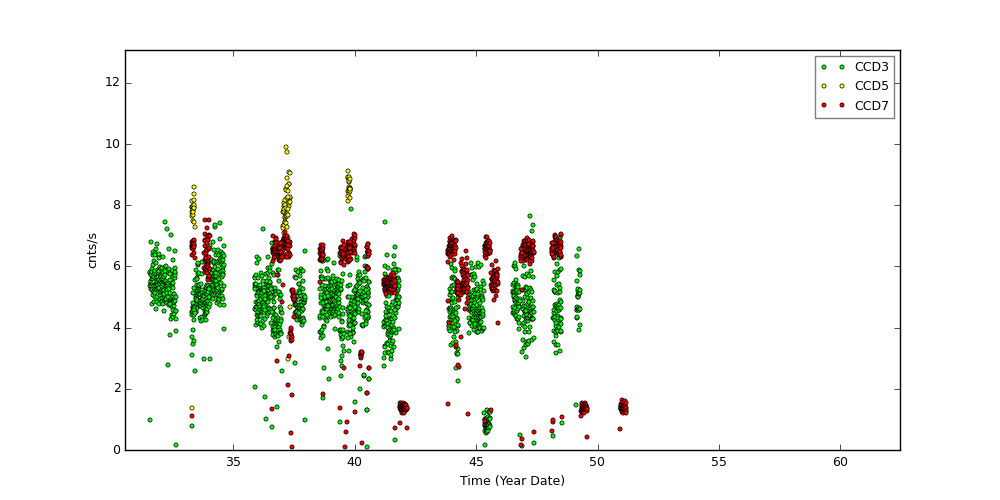
Bad Pixels
The plots below were generated with a new warm pixel finding script. Please see Acis Bad Pixel Page for details.
Front Side CCDs
Back Side CCD (CCD5)
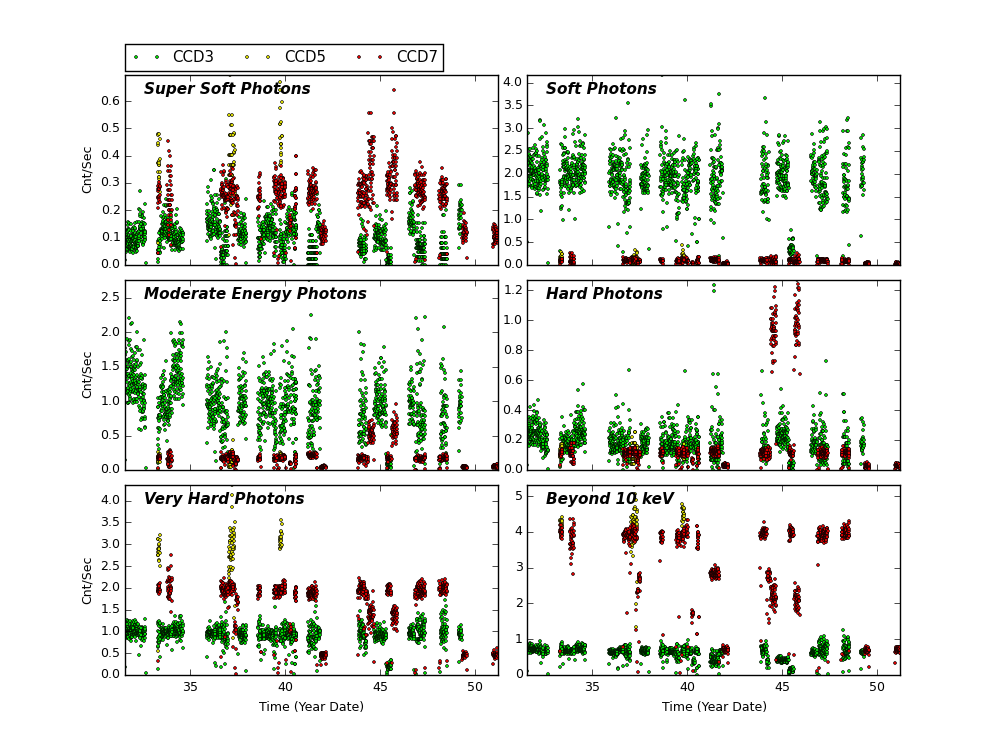
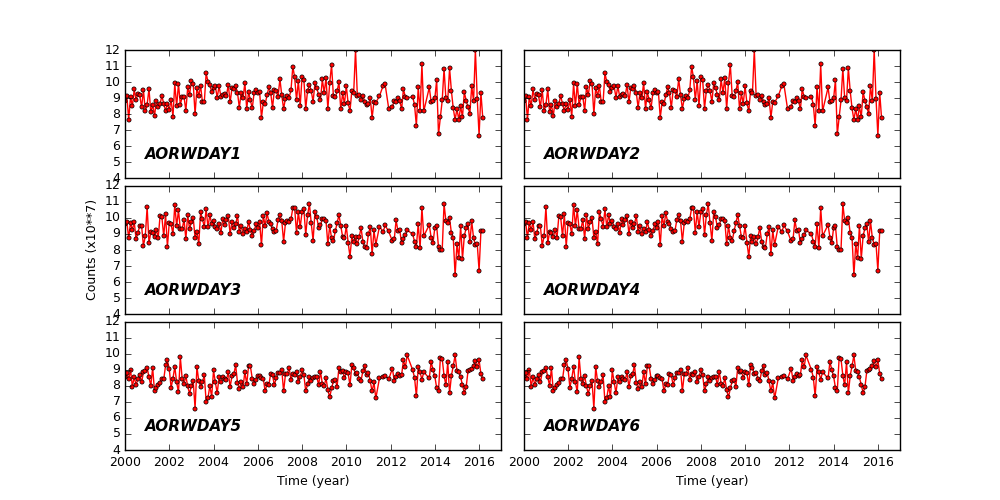
Science Instrument Background Rates
| Name | Low (keV) | High(KeV) | Description |
|---|---|---|---|
| SSoft | 0.00 | 0.50 | Super soft photons |
| Soft | 0.50 | 1.00 | Soft photons |
| Med | 1.00 | 3.00 | Moderate energy photons |
| Hard | 3.00 | 5.00 | Hard Photons |
| Harder | 5.00 | 10.00 | Very Hard photons |
| Hardest | 10.00 | Beyond 10 keV |
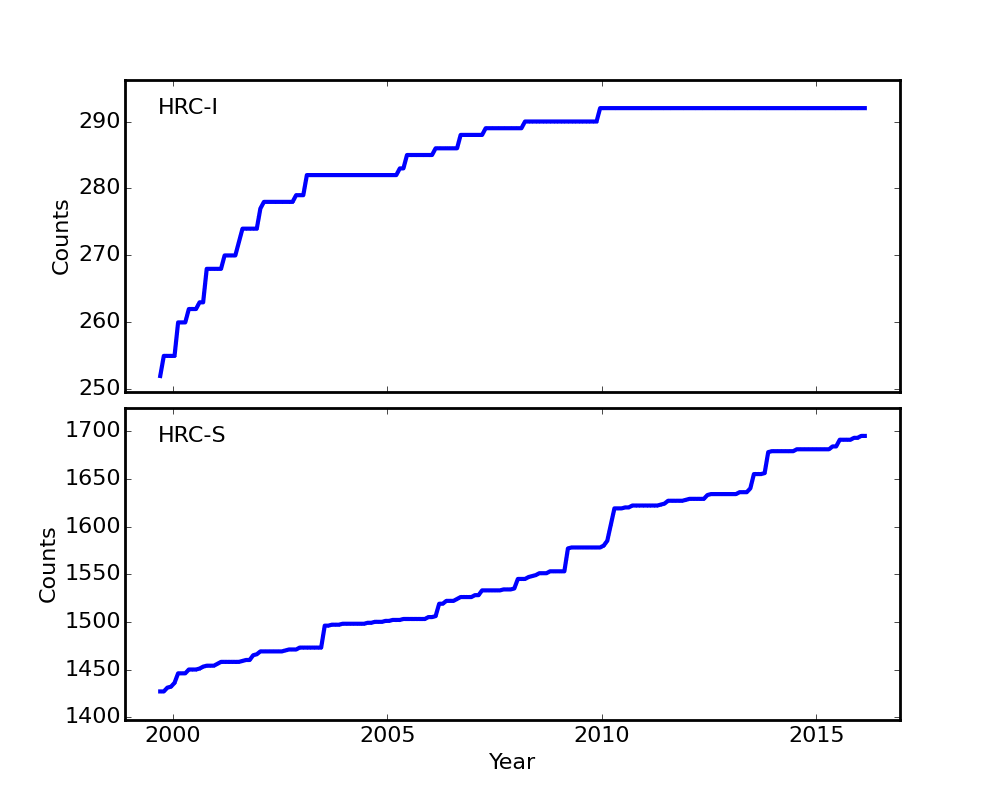
HRC
DOSE of Central 4K Pore-Pairs
Please refer to Maximum Dose Trends for more details.
No Data
)
        IMAGE                NPIX      MEAN    STDDEV      MIN       MAX
HRCI_08_1999_02_2016.fits  16777216   4.380    4.960       0.0       292.0
No Data
)
        IMAGE                NPIX     MEAN      STDDEV      MIN      MAX
HRCS_08_1999_02_2016.fits  16777216  15.900     28.368      0.0      1695.0
|
|
Max dose trend plots corrected for events that "pile-up"
in the center of the taps due to bad position information.
|
)
|
)
|
)
|
)
|
| Nov 2015 | Aug 2015 | May 2015 | Feb 2015 |
|---|
)
|
)
|
)
|
)
|
| Nov 2015 | Aug 2015 | May 2015 | Feb 2015 |
|---|
HRMA Focus
Plots below show various characteristics of detected imaging sources. Standard level 2 data products (*src2.fits) are used. Only observations with focus (sim_x) within 0.01 mm of nominal value for given SI configuration are used. Sources are also filtered for strength (SNR > 15).
For individual detectors, please go to MTA SRC2 Monitoring page.
Source Sky Position
PSF vs Time
Source Ellipse Roundness
80% Encircled Energy Radius
Signal-to-Noise Ratio
Rotation
)
)
)
|
)
|
)
|
)
|
)
|
)
|
)
|
)
|
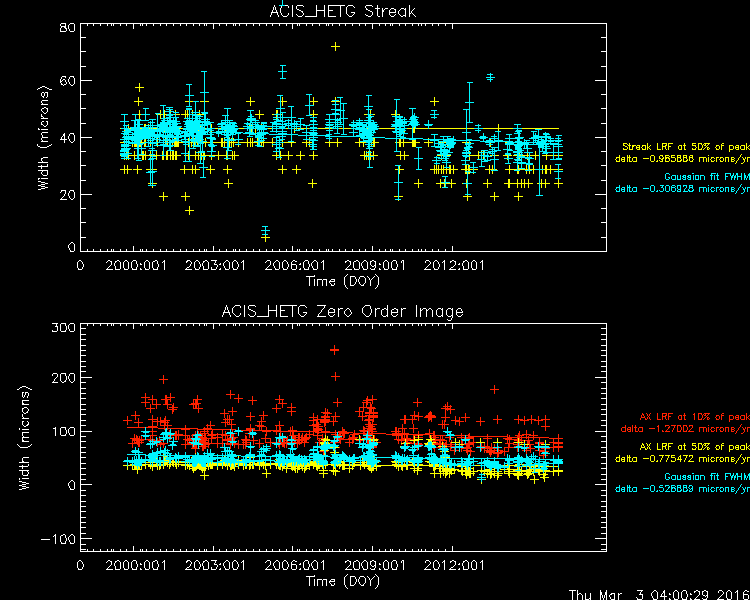
Gratings
Focus
We plot the width of the zero order streak of ACIS/HETG observations and the width of the zero order image for HRC/LETG observations of point sources. No significant defocusing trend is seen at this time. See Gratings Focus pages.
PCAD
ACA Trending
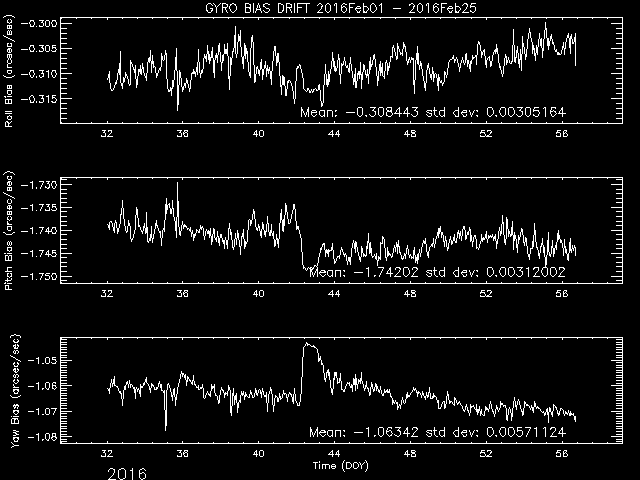
Gyro Bias Drift
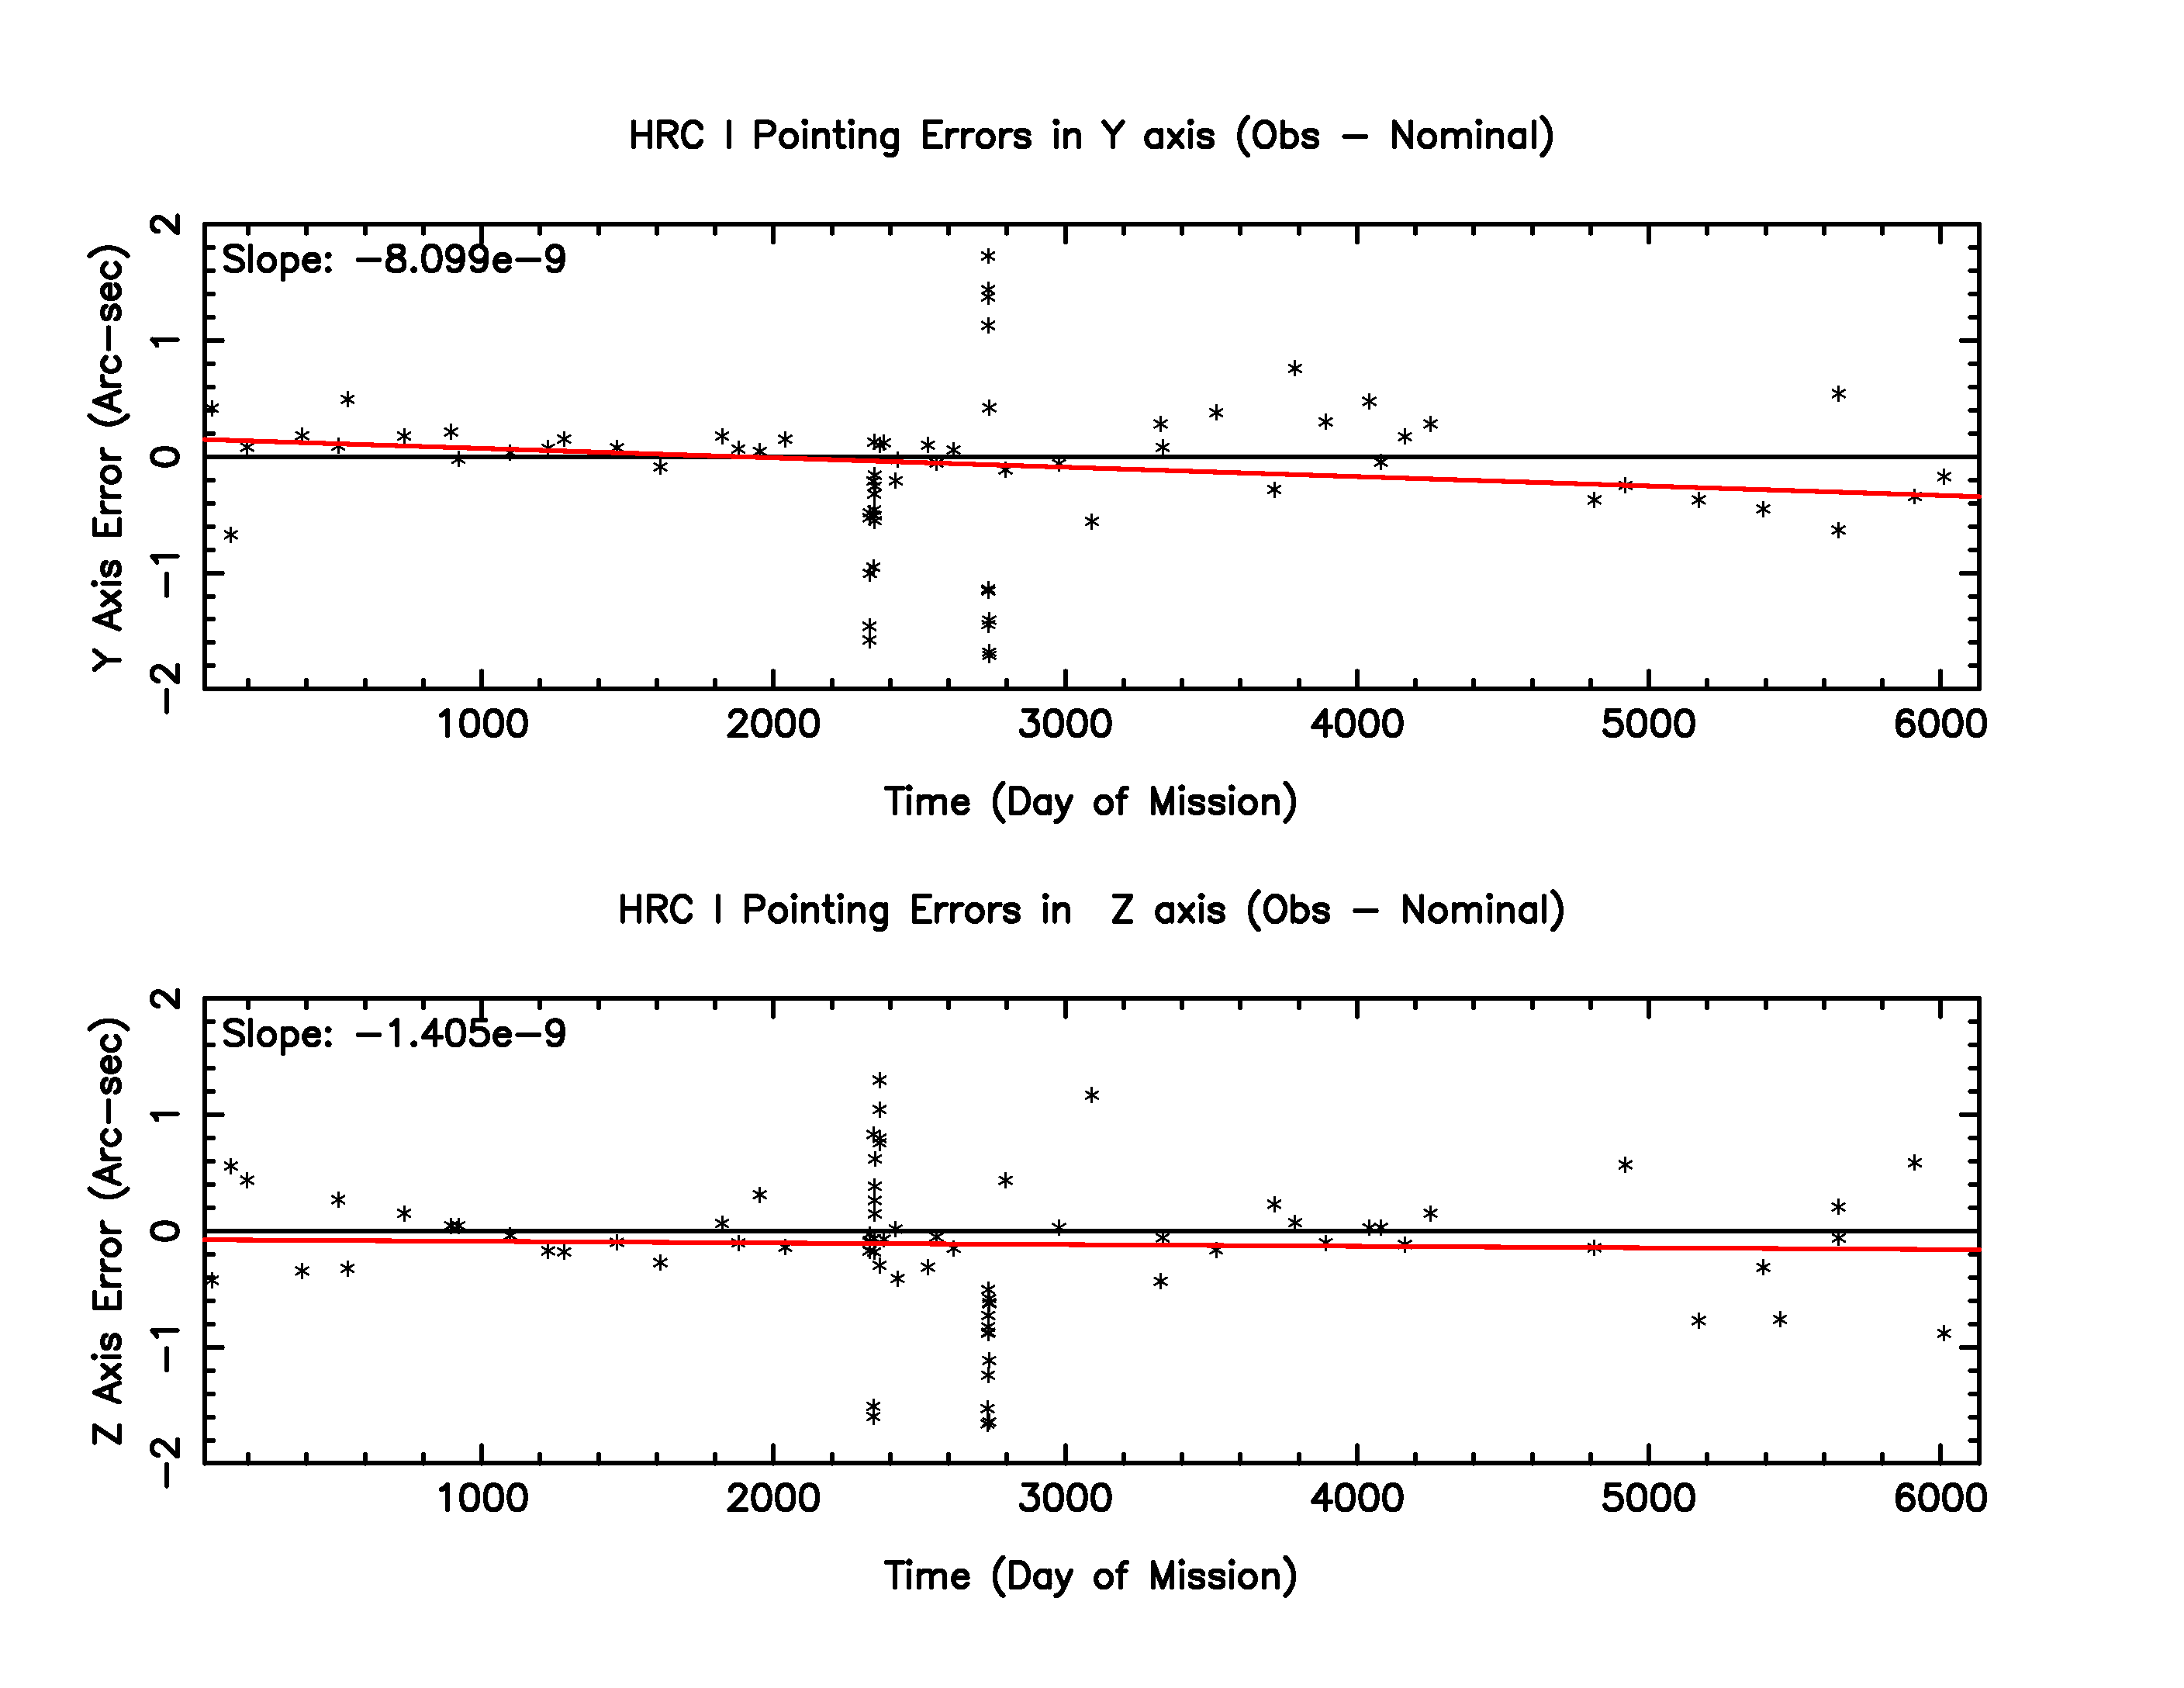
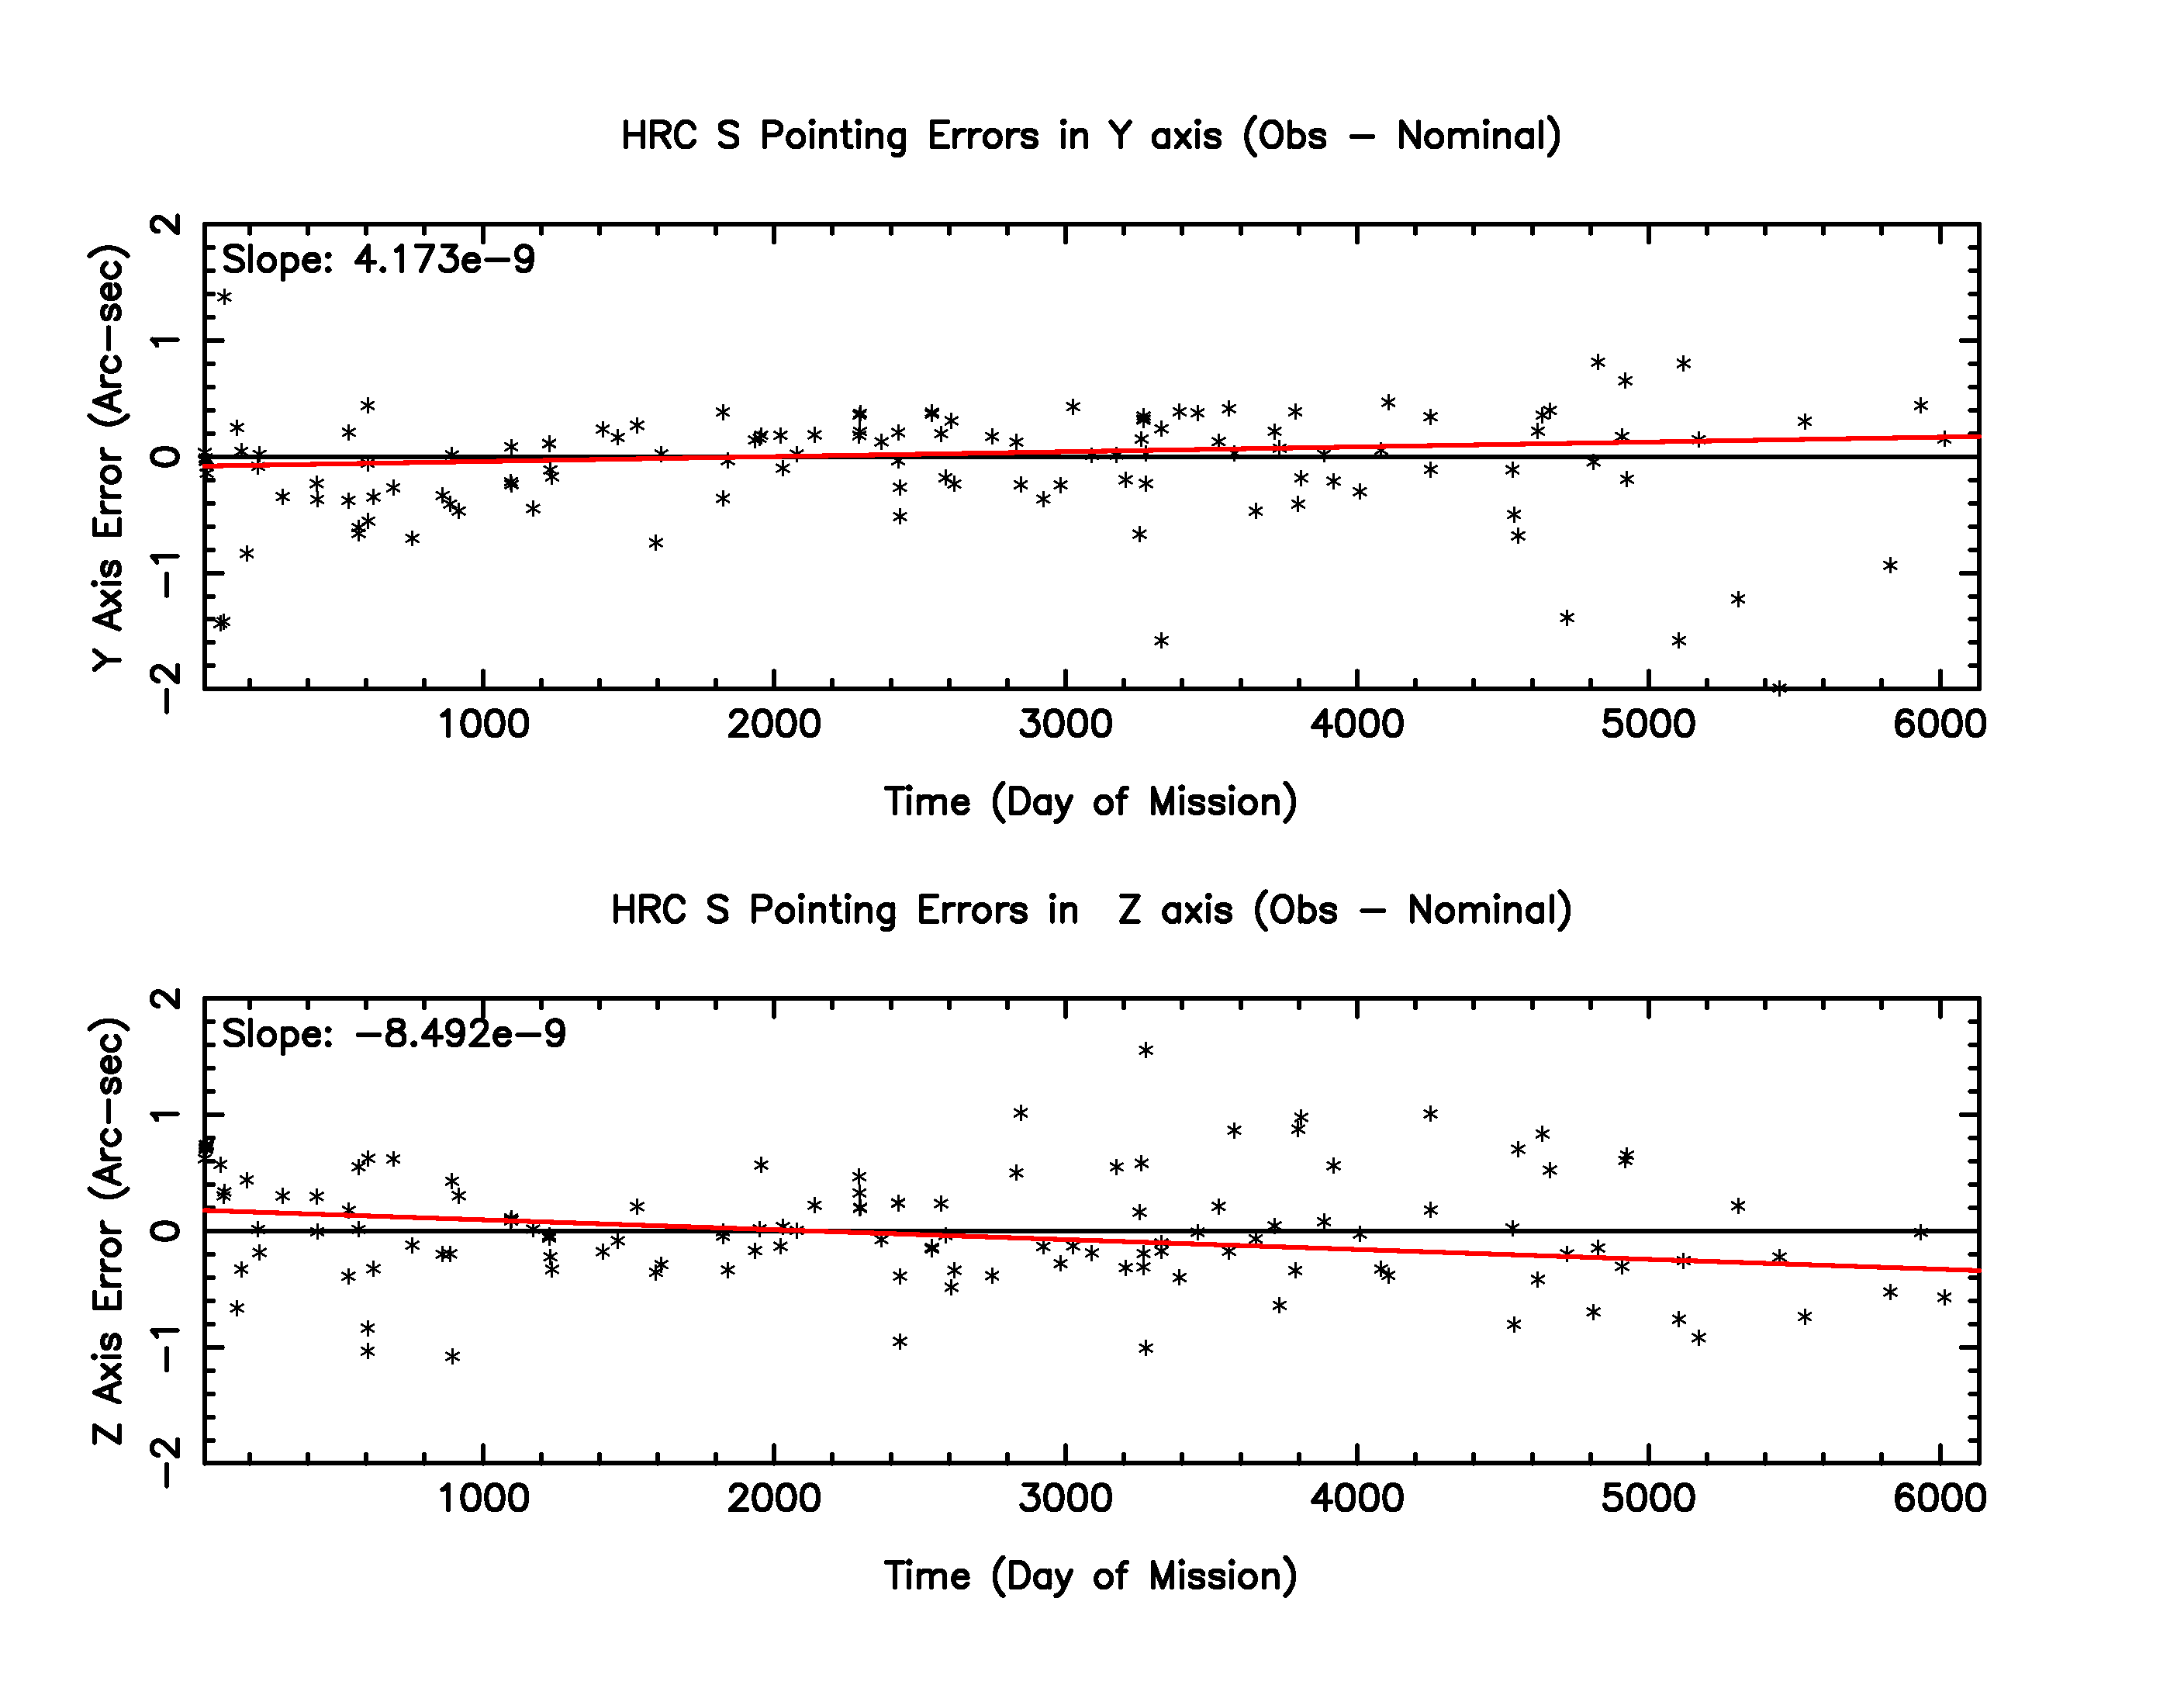
ACIS-S and HRC Celestial Location Monitoring
Science Instrument Positional Change Monitoring
The following plots are the difference between coordinates obtained from Chandra observations and those obtained from existing catalogs vs time in day of mission.
The following steps are taken to generate these plots.
- all observations with grating are selected
- even if the observation is not grating one, if it is a known point source, it is added to the list.
- observed ra, jan, target ra, jan, nominal ra, jan and a ratio of a target elliptical to psf (psfratio are extracted from src fits files.
- the observations with psfratio smaller than 4 are selected
- the differences between observed coordinates and targeted coordinates (if not available nominal coordinates) are computed
- if the differences are larger than 6 arcsec, the points are dropped
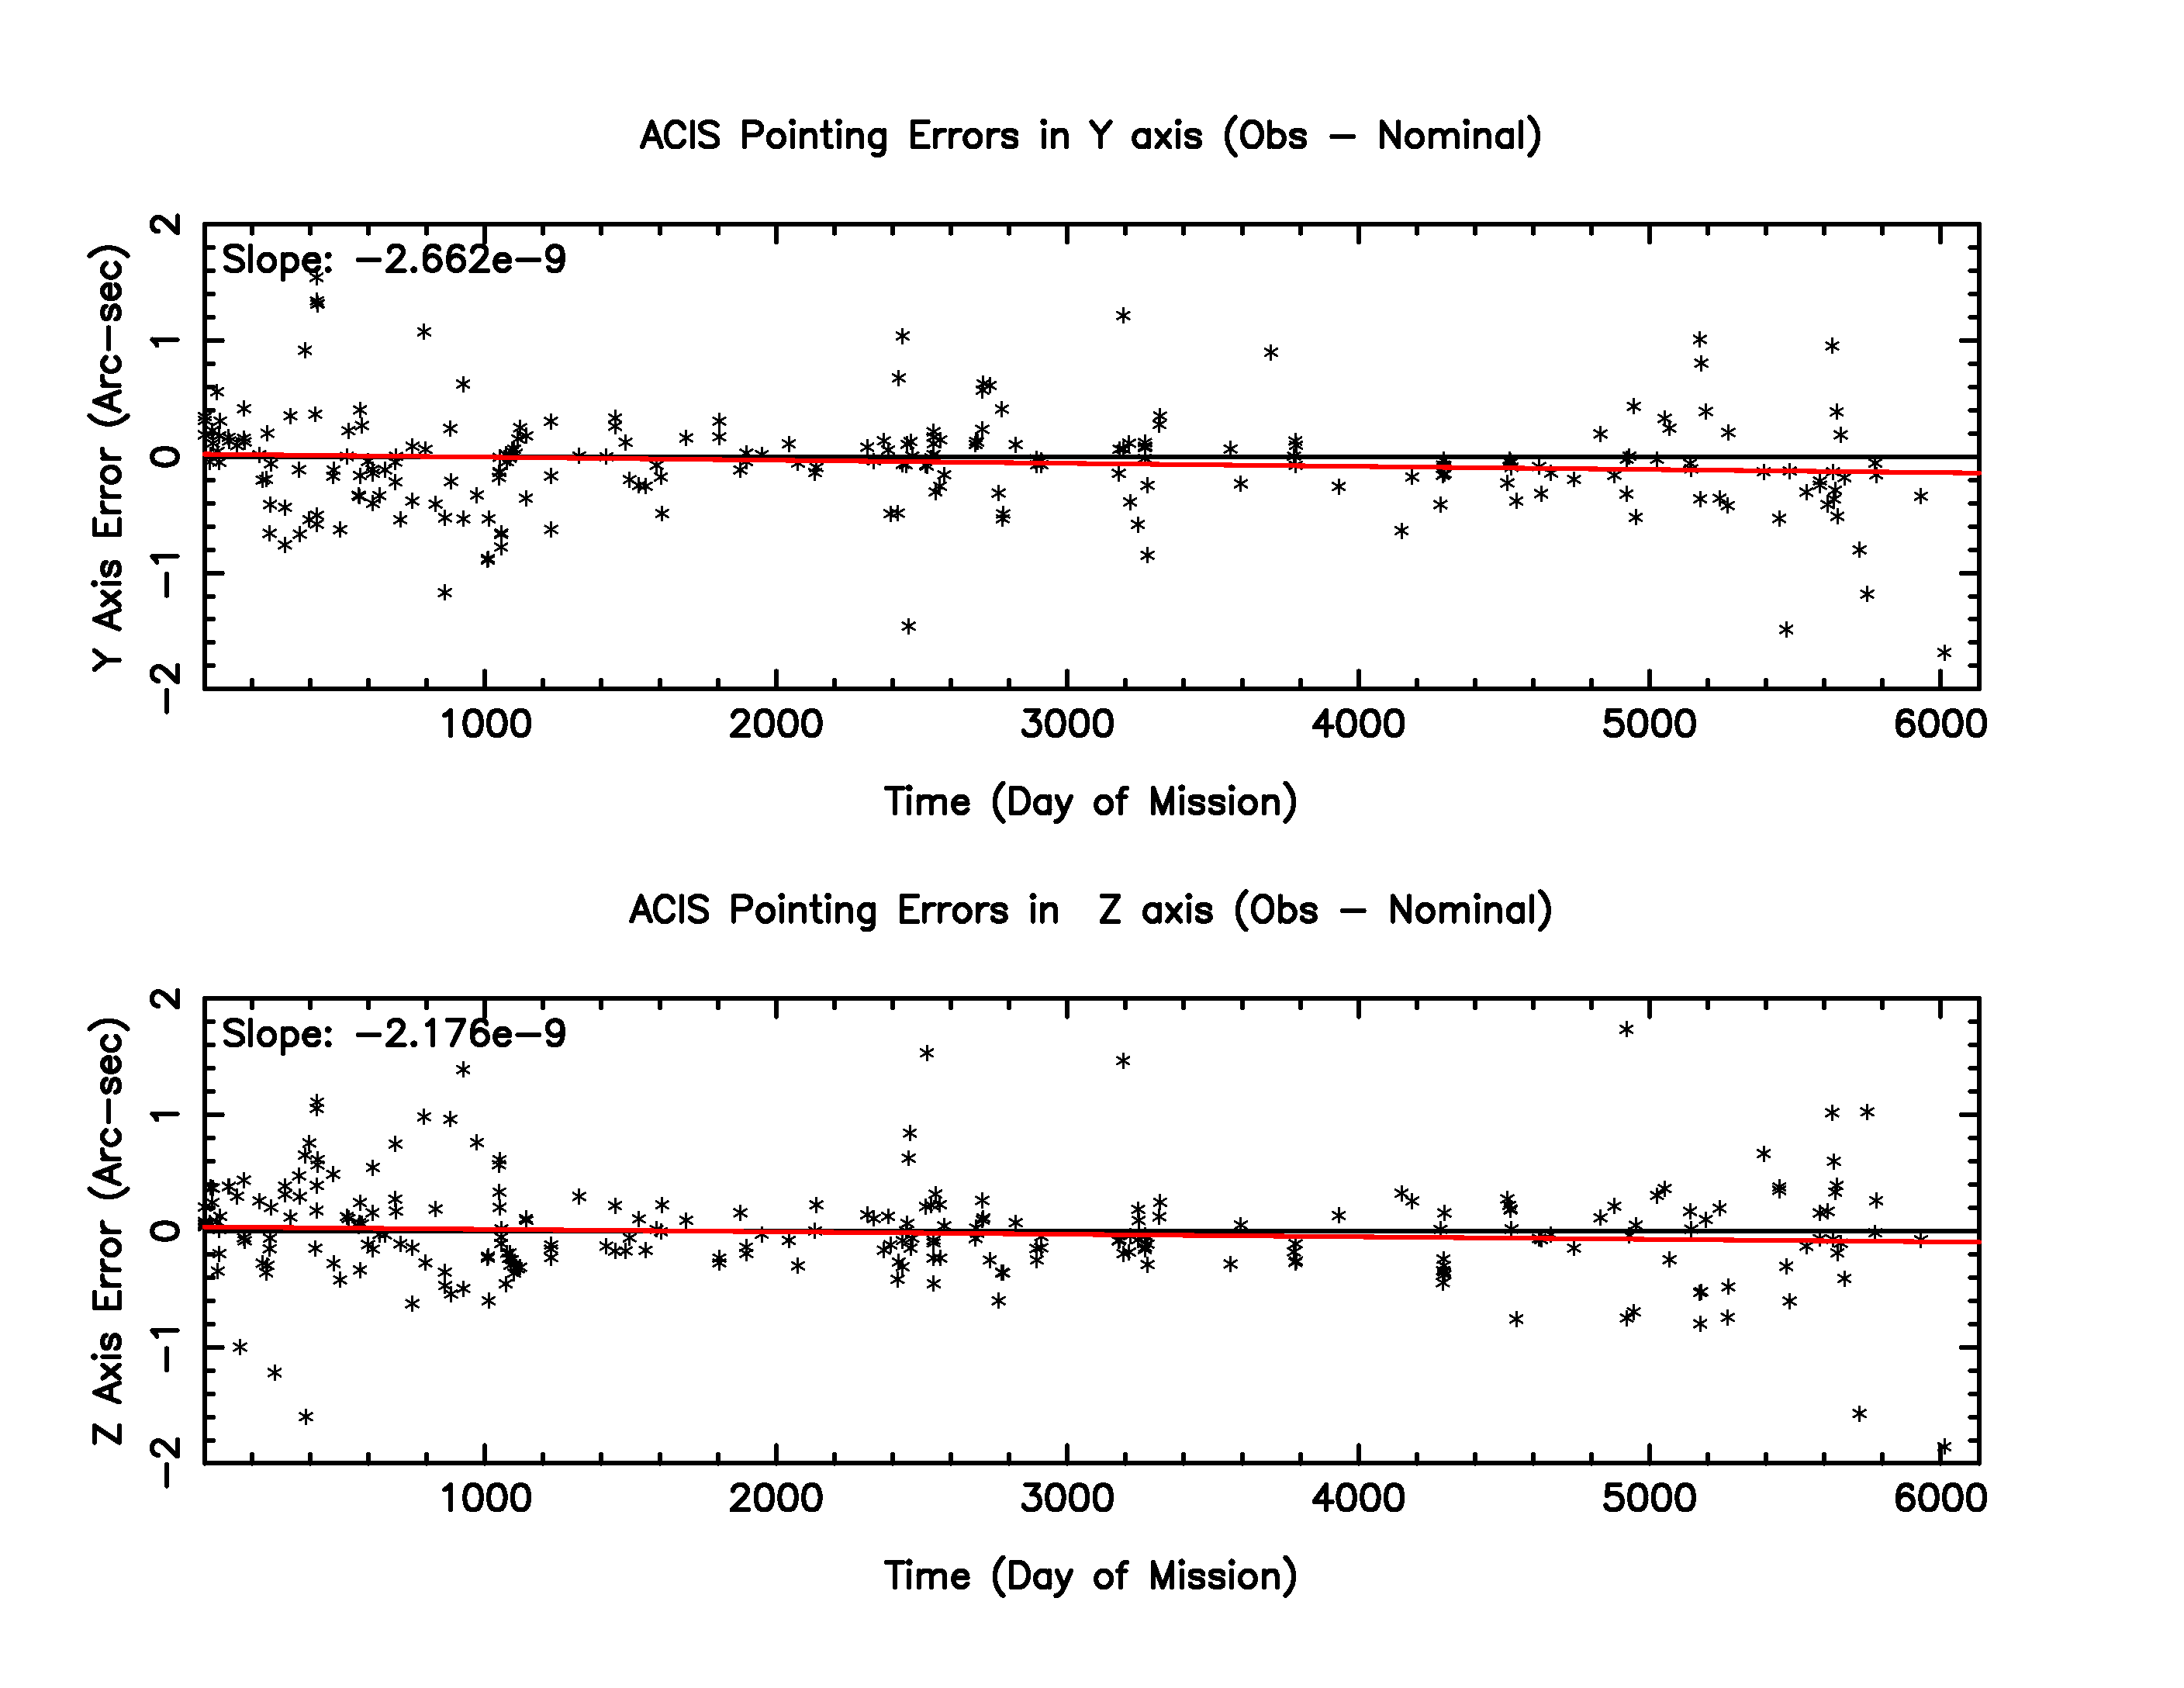
The large dispersion around DOM ~ 2400 (Jan 2005) are all due to none grating Capella observations. Many observations are off-axis observations (e.g., obsid 6558).
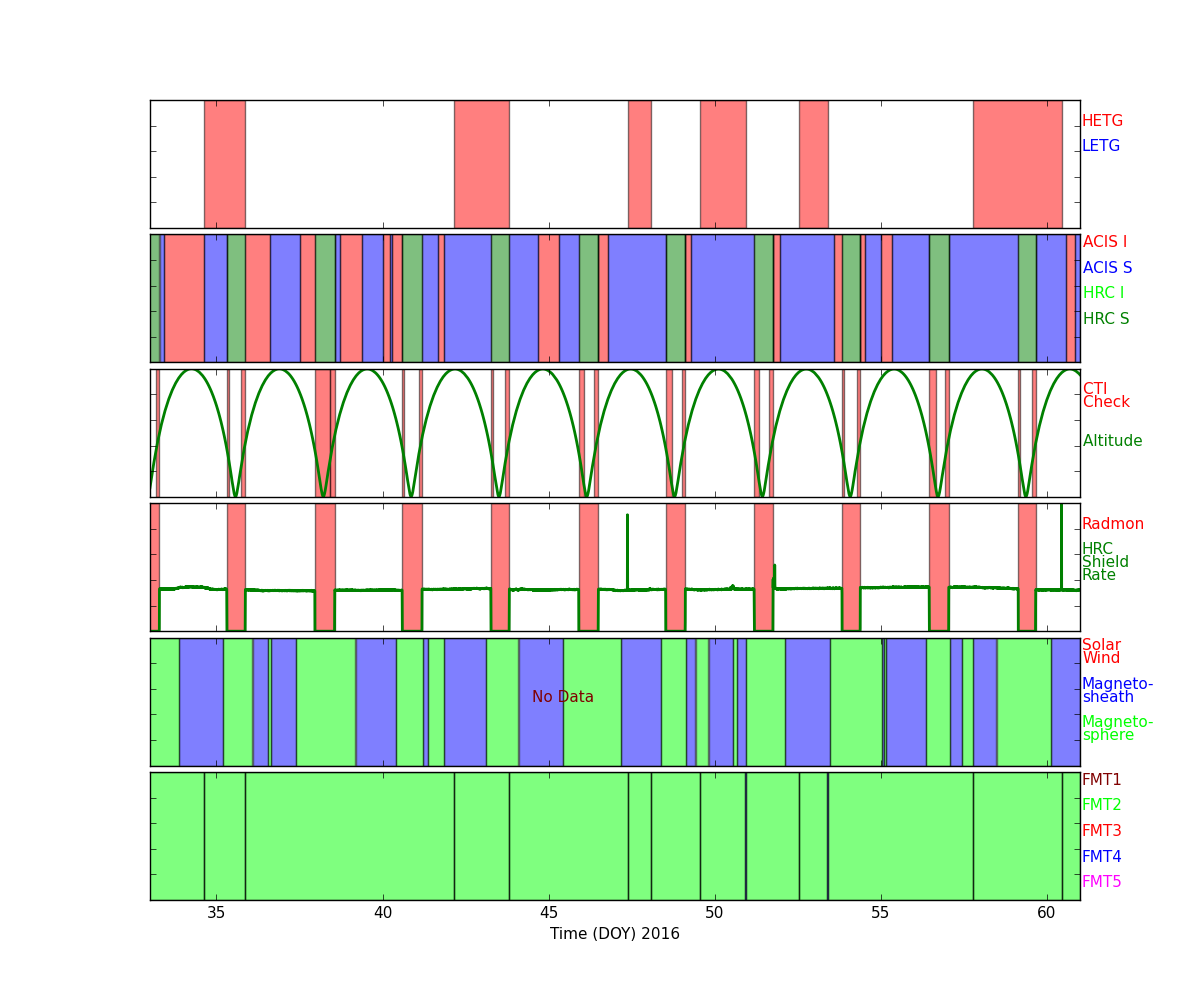
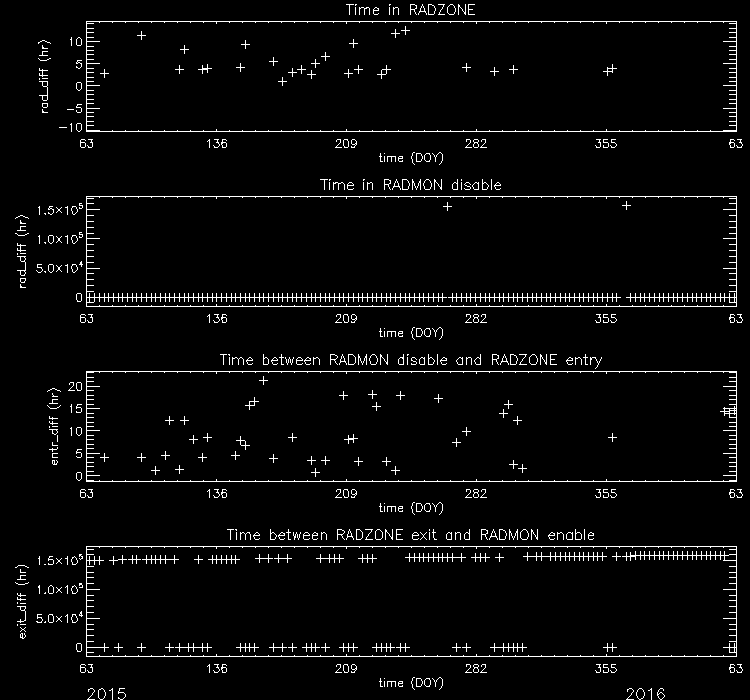
Radiation History
Radiation Zone Timing
Plotted below are radiation zone timing plots based on the following definitions of radiation zone:
- RADZONE - Ephin levels (in any of the E1300,P4GM,P41GM channels) are more than 1/3 of RADMON safing thresholds.
- RADMON - Radmon is disabled for radiation zone (as commanded based on OFLS model, for comparison with actual radiation levels).
- PERIGEE - Time of closest earth approach (for comparison)
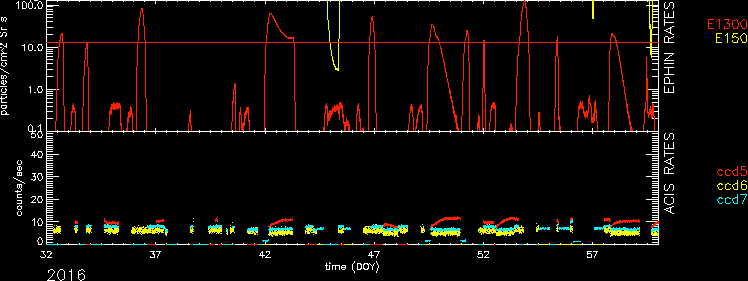
Radiation Count Rates of Feb 2016
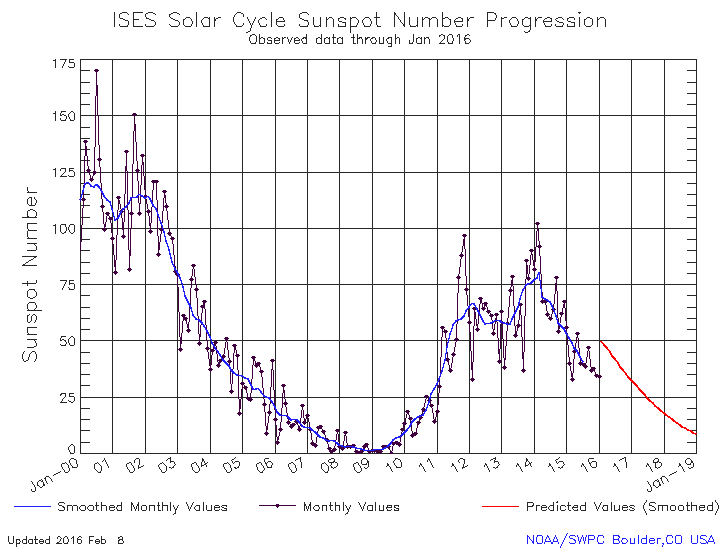
Sun Spot History
Trending
Quarterly Trends
- Spacecraft Electronics
| Previous Quarter | ||||||
| MSID | MEAN | RMS | DELTA/YR | DELTA/YR/YR | UNITS | DESCRIPTION |
| ELBI | 56.31 | 1.26 | -2.287e+00 | -2.549e+01 | AMP | LOAD BUS CURRENT |
| ELBV | 28.25 | 0.12 | 3.832e-01 | 1.614e+01 | V | LOAD BUS VOLTAGE |
| OHRMAPWR | 50.93 | 1.47 | -5.846e+00 | 2.320e+01 | W | HRMA COMPUTED TOTAL POWER |
| OOBAPWR | 46.98 | 1.83 | -3.146e+00 | -1.220e+01 | W | OBA COMPUTED TOTAL POWER |
)
)
)
)
- OBA Heater
| Previous Quarter | ||||||
| MSID | MEAN | RMS | DELTA/YR | DELTA/YR/YR | UNITS | DESCRIPTION |
| OOBTHR04 | 294.45 | 1.05 | 5.298e+00 | -2.273e+01 | K | RT 27: HRMA STRUT |
| OOBTHR12 | 291.93 | 1.59 | 7.143e+00 | -6.610e+01 | K | RT 35: OBA CONE |
| OOBTHR26 | 294.85 | 2.73 | 9.472e+00 | -1.336e+02 | K | RT 48: OBA CONE |
| OOBTHR38 | 283.17 | 1.337e-02 | 3.475e-02 | 7.015e-01 | K | RT 60: TFTE CONE |
| OOBTHR44 | 293.99 | 1.61 | 6.914e+00 | -4.602e+01 | K | RT 66: TFTE COVER |
| OOBTHR50 | 288.82 | 1.65 | 7.587e+00 | -6.063e+01 | K | RT 76: S/C STRUT |
)
)
)
)
)
)
- HRMA Heater
| Previous Quarter | ||||||
| MSID | MEAN | RMS | DELTA/YR | DELTA/YR/YR | UNITS | DESCRIPTION |
| OHRTHR03 | 295.24 | 1.000e-03 | -5.252e-04 | 1.348e-02 | K | RT 5: HRMA FORWARD APERTURE PLATE |
| OHRTHR09 | 294.53 | 2.785e-02 | 1.182e-01 | -2.302e+00 | K | RT 105: HRMA CAP |
| OHRTHR17 | 294.39 | 3.654e-02 | 1.497e-01 | -2.884e+00 | K | RT 125: HSA OUTER CYNLINDER |
| OHRTHR24 | 294.73 | 1.088e-02 | -2.328e-02 | 5.245e-01 | K | RT 12: HRMA AFT HEATER PLATE |
| OHRTHR38 | 294.69 | 0.68 | 1.757e+00 | -3.030e+01 | K | RT 120: HRMA AFT COLLIMATOR OUTER CYLINDER |
| OHRTHR52 | 294.38 | 3.294e-02 | 1.326e-01 | -2.601e+00 | K | RT 100: HRMA CAP |
)
)
)
)
)
)
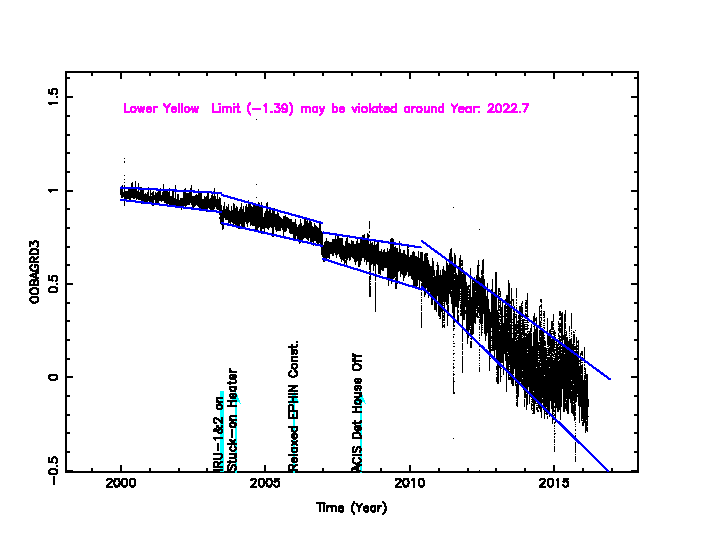
Envelope Trending
OBA Fw Bulkhead
PCAD FTS Grad
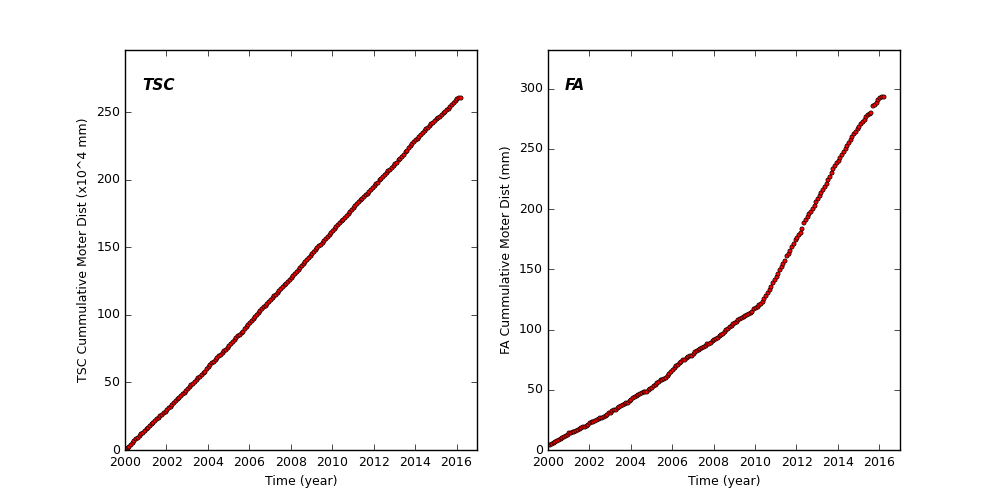
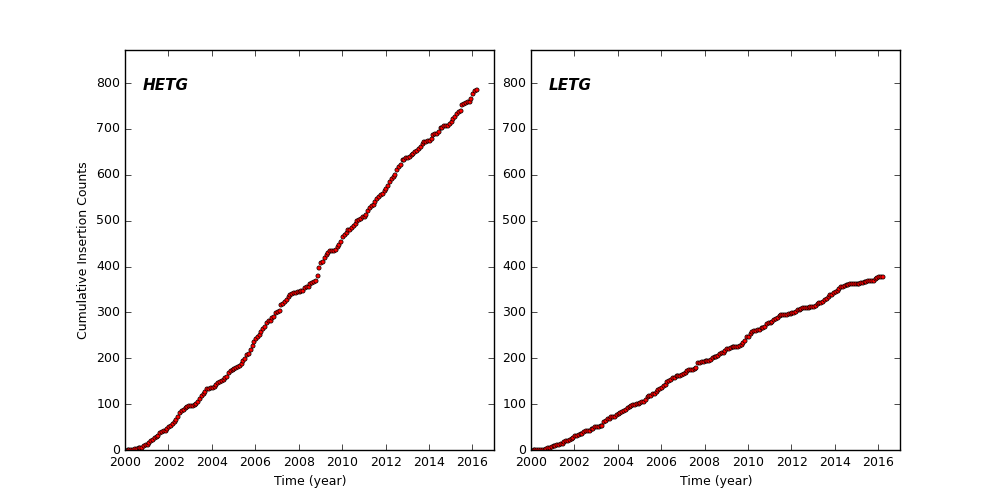
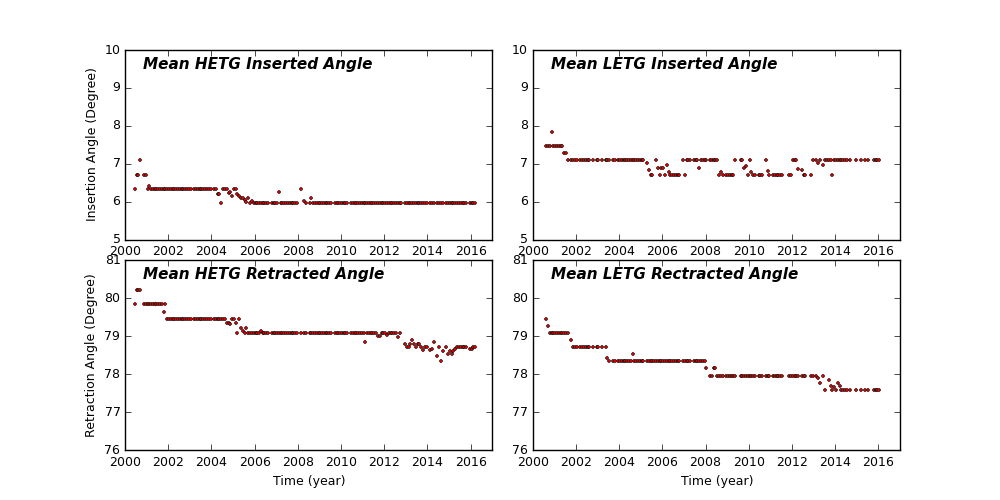
Spacecraft Motions
TSC and FA Cummulative Moter Distance
HETG and LETG Cummulative Insertion Counts
HETG/LETG Insertion/Retraction Angle
Reaction Wheel Rotations
Links to Past Monthly Reports
| Year | Month | |||||||||||
|---|---|---|---|---|---|---|---|---|---|---|---|---|
| 2016 | Jan | |||||||||||
| 2015 | Jan | Feb | Mar | Apr | May | Jun | Jul | Aug | Sep | Oct | Nov | Dec |
| 2014 | Jan | Feb | Mar | Apr | May | Jun | Jul | Aug | Sep | Oct | Nov | Dec |
| 2013 | Jan | Feb | Mar | Apr | May | Jun | Jul | Aug | Sep | Oct | Nov | Dec |
| 2012 | Jan | Feb | Mar | Apr | May | Jun | Jul | Aug | Sep | Oct | Nov | Dec |
| 2011 | Jan | Feb | Mar | Apr | May | Jun | Jul | Aug | Sep | Oct | Nov | Dec |
| 2010 | Jan | Feb | Mar | Apr | May | Jun | Jul | Aug | Sep | Oct | Nov | Dec |
| 2009 | Jan | Feb | Mar | Apr | May | Jun | Jul | Aug | Sep | Oct | Nov | Dec |
| 2008 | Jan | Feb | Mar | Apr | May | Jun | Jul | Aug | Sep | Oct | Nov | Dec |
| 2007 | Jan | Feb | Mar | Apr | May | Jun | Jul | Aug | Sep | Oct | Nov | Dec |
| 2006 | Jan | Feb | Mar | Apr | May | Jun | Jul | Aug | Sep | Oct | Nov | Dec |
| 2005 | Jan | Feb | Mar | Apr | May | Jun | Jul | Aug | Sep | Oct | Nov | Dec |
| 2004 | Jan | Feb | Mar | Apr | May | Jun | Jul | Aug | Sep | Oct | Nov | Dec |
| 2003 | Jan | Feb | Mar | Apr | May | Jun | Jul | Aug | Sep | Oct | Nov | Dec |
| 2002 | Jan | Feb | Mar | Apr | May | Jun | Jul | Aug | Sep | Oct | Nov | Dec |
| 2001 | Jan | Feb | Mar | Apr | May | Jun | Jul | Aug | Sep | Oct | Nov | Dec |
| 2000 | Jan | Feb | Mar | Apr | May | Jun | Jul | Aug | Sep | Oct | Nov | Dec |
| 1999 | Jul | Aug | Sep | Oct | Nov | Dec | ||||||