ACIS
ACIS DOSE Registered-Photon-Map
The steps we took to compute the dose map are;
- Level 1 Event files for a specified month are obtained from archive.
- Image data including I2, I3, S2, S3 CCDs are extracted from all event files.
- All the extracted image data were merged to create a month long exposure map for the month.
- The exposure map is opened with ds9, and check a distribution of count rates against energy. From this, estimate the upper threshold value. Any events beyond this upper threshold are assumed erroneous events such as bad pixels.
- Using this upper threshold, the data is filtered, and create a cleaned exposure map for the month.
- The exposure map from each month from the Sep 1999 is added up to create a cumulative exposure map for each month.
- Using fimgstatistic, we compute count rate statistics for each CCDs.
- For observations with high data drop rates (e.g., Crab nebula, Cas A), we corrected the observations by adding events.
Please check more detail plots at Telemetered Photon Dose Trend page.
)
)
)
Statistics:
# IMAGE     NPIX     MEAN        RMS        MIN     MAX


ACIS_apr16 6004901   7.242       14.633     0.0     6867

I2 node 0  262654    7.816001     8.685977  0.0    2835.0
I2 node 1  262654    7.965854     7.363146  0.0    1301.0
I2 node 2  262654    7.806258     6.680761  0.0     967.0
I2 node 3  262654    7.994455    11.376588  0.0    2799.0

I3 node 0  262654    8.558588    11.682343  0.0    4694.0
I3 node 1  262654    8.897341    10.573991  0.0    1639.0
I3 node 2  262654    8.232461     6.124885  0.0     808.0
I3 node 3  262654    8.132469    10.982243  0.0    4486.0

S2 node 0  262654    7.869053    19.669249  0.0    6867.0
S2 node 1  262654    8.190196     4.811631  0.0     618.0
S2 node 2  262654    8.976428    14.343866  0.0    4731.0
S2 node 3  262654    8.497371     5.170685  0.0     662.0

S3 node 0  262654   21.769083    34.942518  0.0     295.0
S3 node 1  262654   13.222895    15.651049  0.0     240.0
S3 node 2  262654    9.797626     5.153807  0.0     135.0
S3 node 3  262654    9.064340     5.287753  0.0     146.0
)
)
)
Statistics:
 IMAGE     NPIX      MEAN        RMS           MIN      MAX


ACIS_total 6004901   2002.971    2613.326        0.0   114718

I2 node 0  262654   1704.042055   327.885233   347.0    9276.0
I2 node 1  262654   1794.999709   452.684839   364.0   48369.0
I2 node 2  262654      7.806258     6.680761     0.0     967.0
I2 node 3  262654   1825.772994   460.952359   350.0   28214.0

I3 node 0  262654   1922.719974   460.613224   341.0    7498.0
I3 node 1  262654   2013.506410  1520.239571   344.0   37930.0
I3 node 2  262654   1761.545693   318.360599   333.0    9435.0
I3 node 3  262654      8.132469    10.982243     0.0    4486.0

S2 node 0  262654   2337.787515   341.362061  1251.0   21412.0
S2 node 1  262654      8.190196     4.811631     0.0     618.0
S2 node 2  262654   2740.690261   524.170348  1672.0   27371.0
S2 node 3  262654   2677.088782   379.974188  1564.0   46736.0

S3 node 0  262654   4161.812948  1849.709158  1721.0   13864.0
S3 node 1  262654   5351.971358  2139.668438     0.0   14328.0
S3 node 2  262654   4127.270975  1046.432976  1711.0    9952.0
S3 node 3  262654   3191.318071   484.993082  1826.0   10761.0
)
|
)
|
)
|
)
|
| Jan 2016 | Oct 2015 | Jul 2015 | Apr 2015 |
|---|
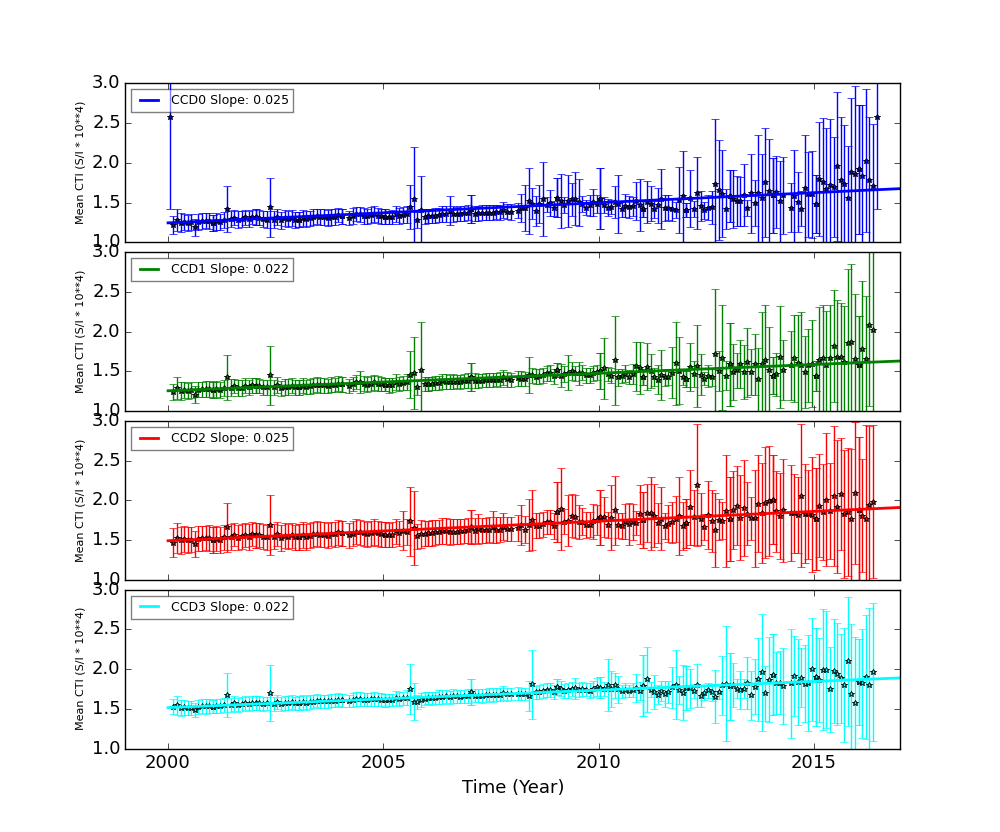
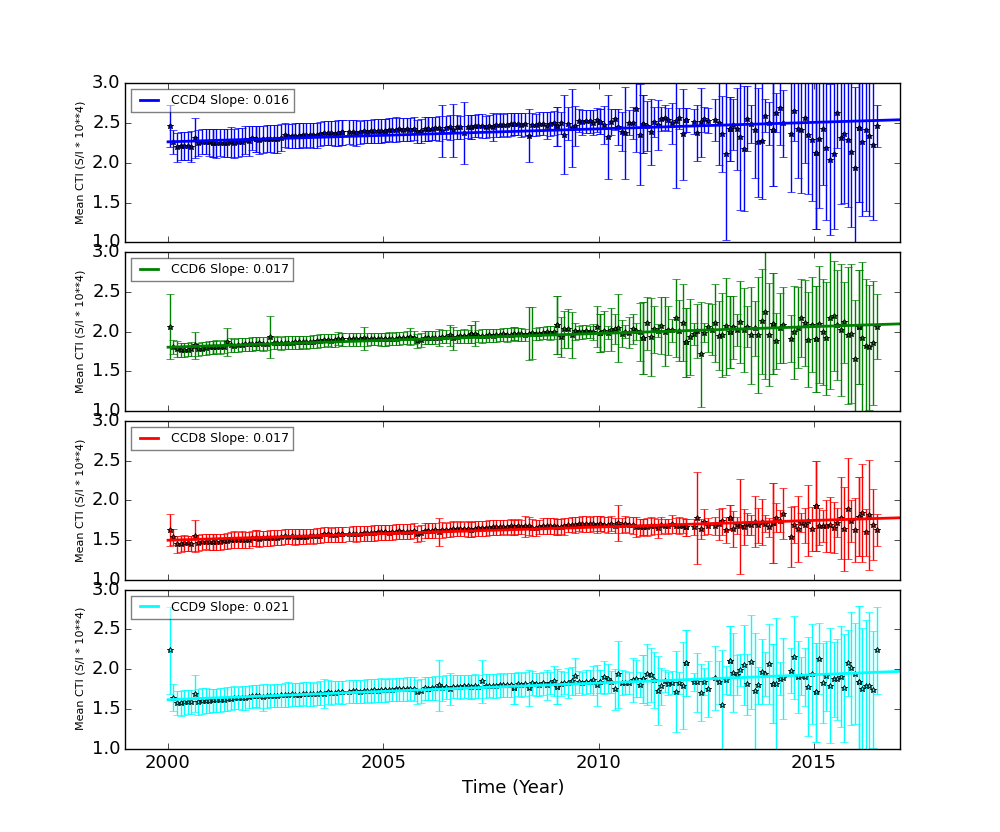
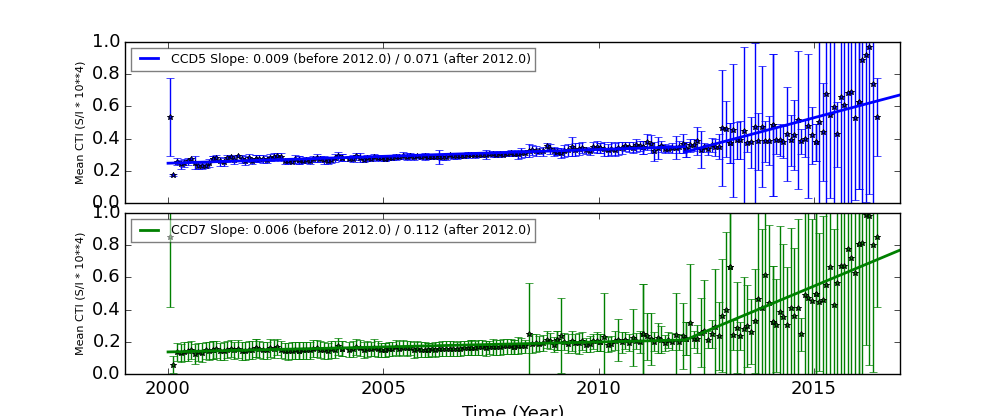
The Mean Detrended CTI
We report CTIs with a refined data definition. CTIs were computed for the temperature dependency corrected data. Please see CTI page for detailed explanation. CTI's are computed for Mn K alpha, and defined as slope/intercept x10^4 of row # vs ADU. Data file: here
Imaging CCDs
Spectral CCDs
Backside CCDs
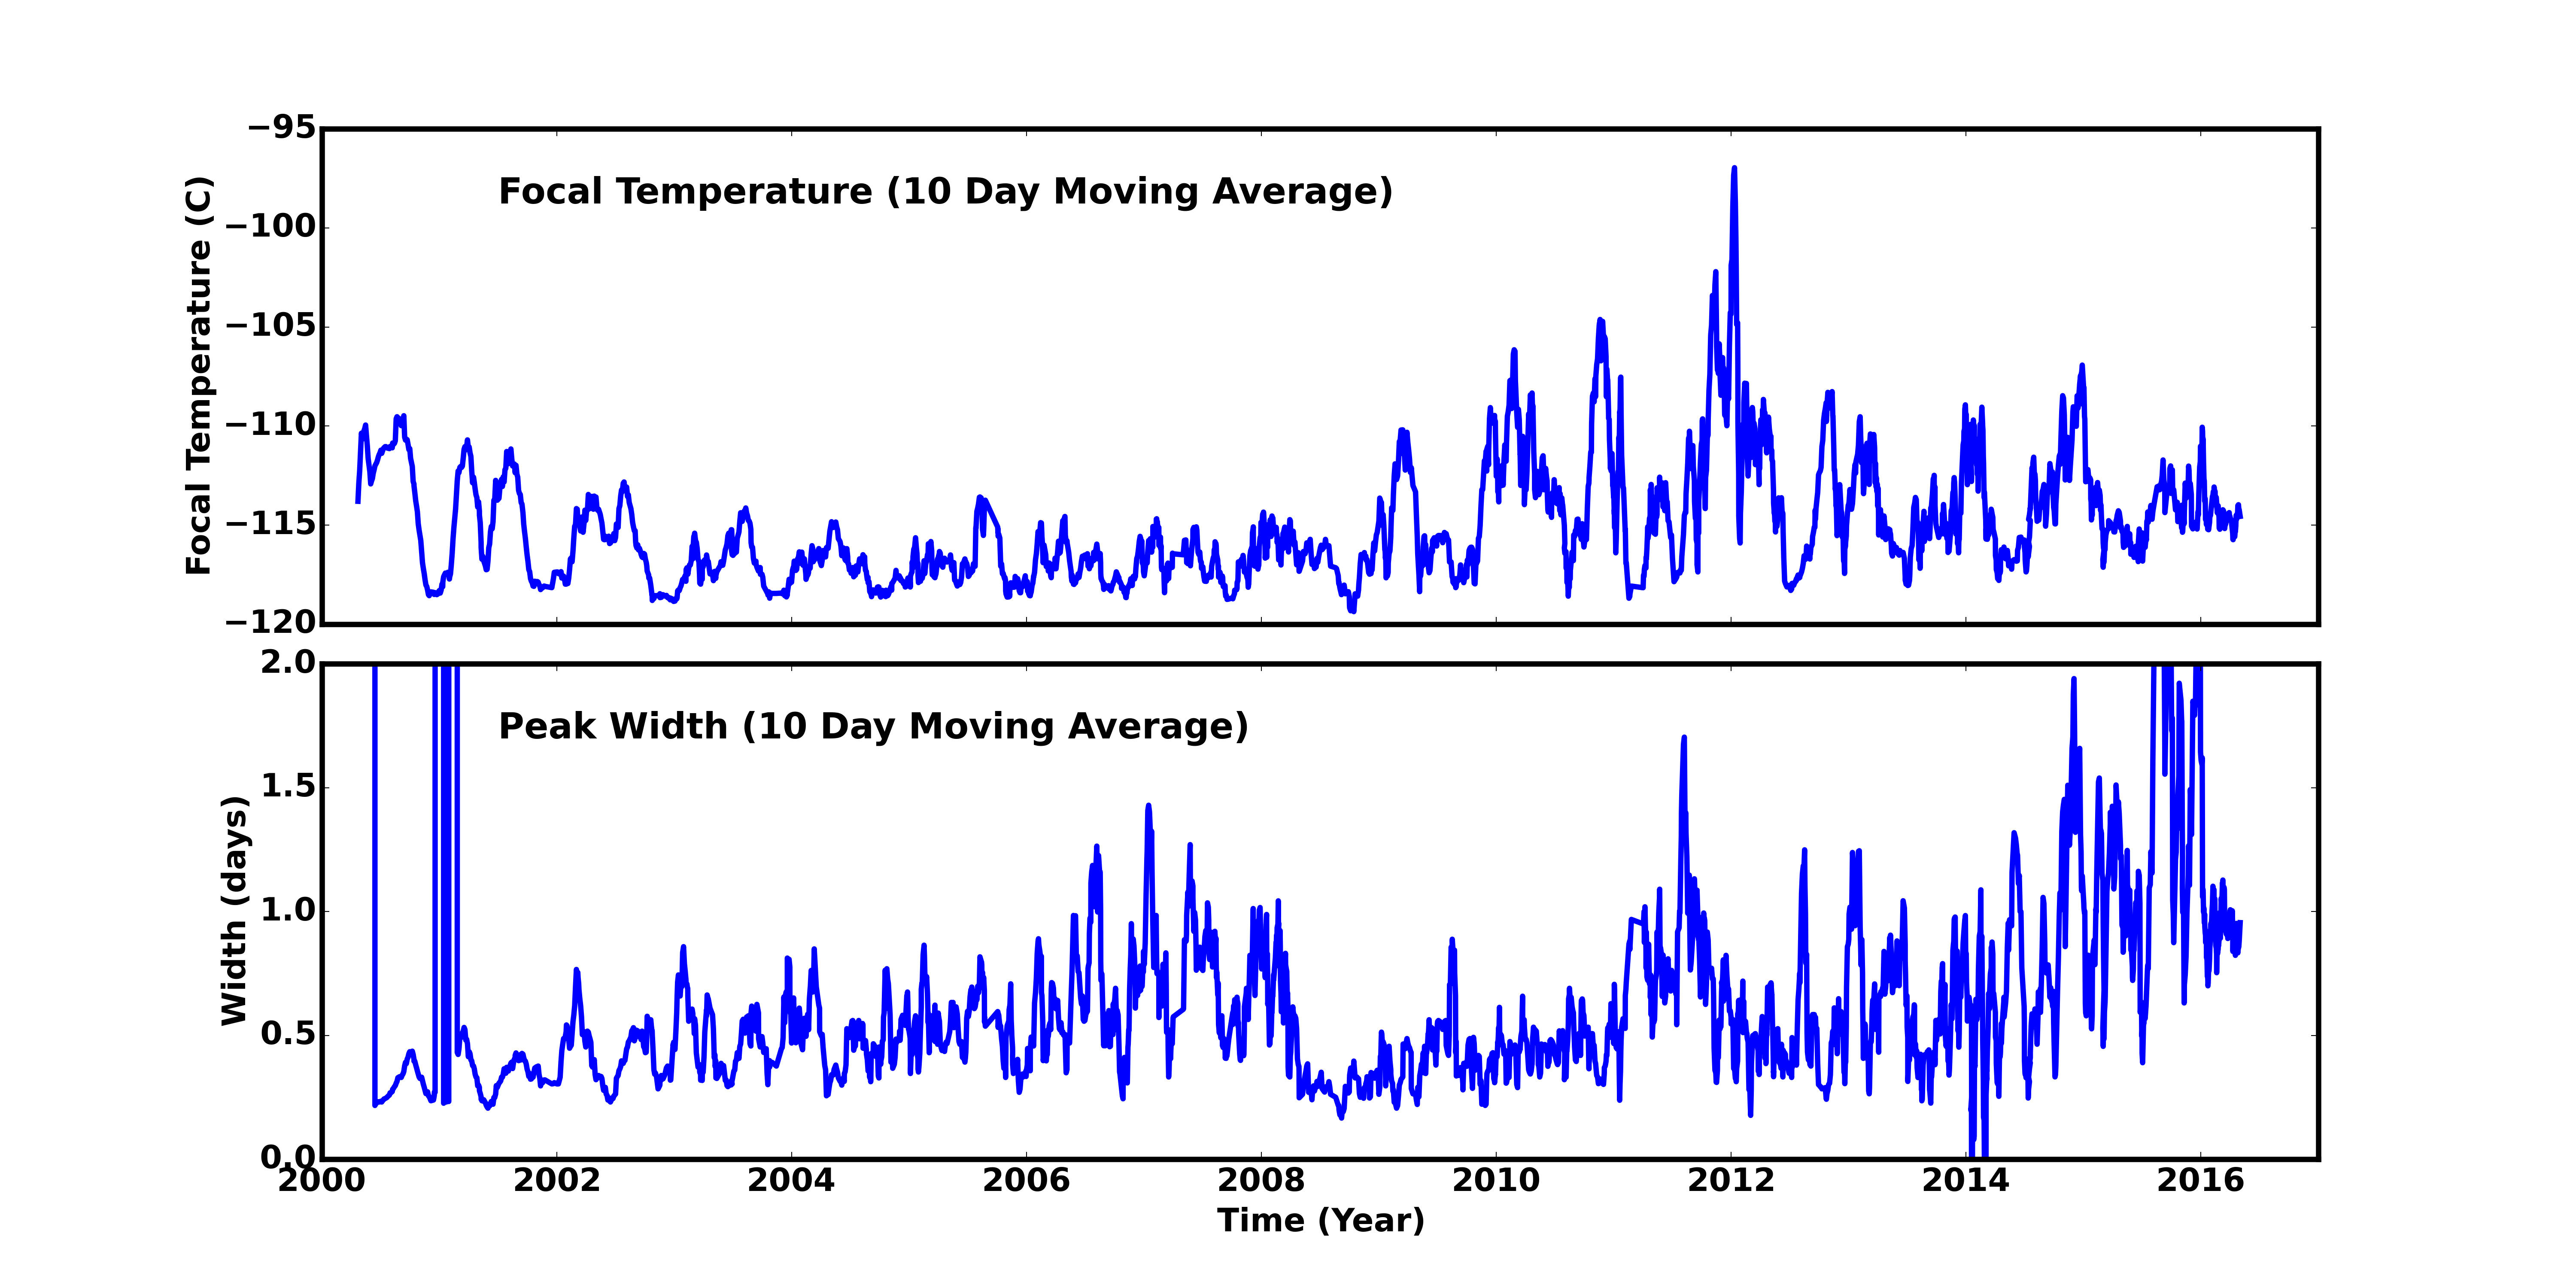
Focal Plane Temperature
Apr 2016 Focal Temperature
| The Mean (max) FPT: | |
|---|---|
| -114.88 | +/- 1.58 C |
| Mean Width: | |
| 0.91 | +/- 0.36 days |
Averaged Focal Plane Temperature
We are using 10 period moving averages to show trends of peak temperatures and peak widths. Note, the gaps in the width plot are due to missing/corrupted data.
Focal Plane Temperature, Sun Angle and Altitude
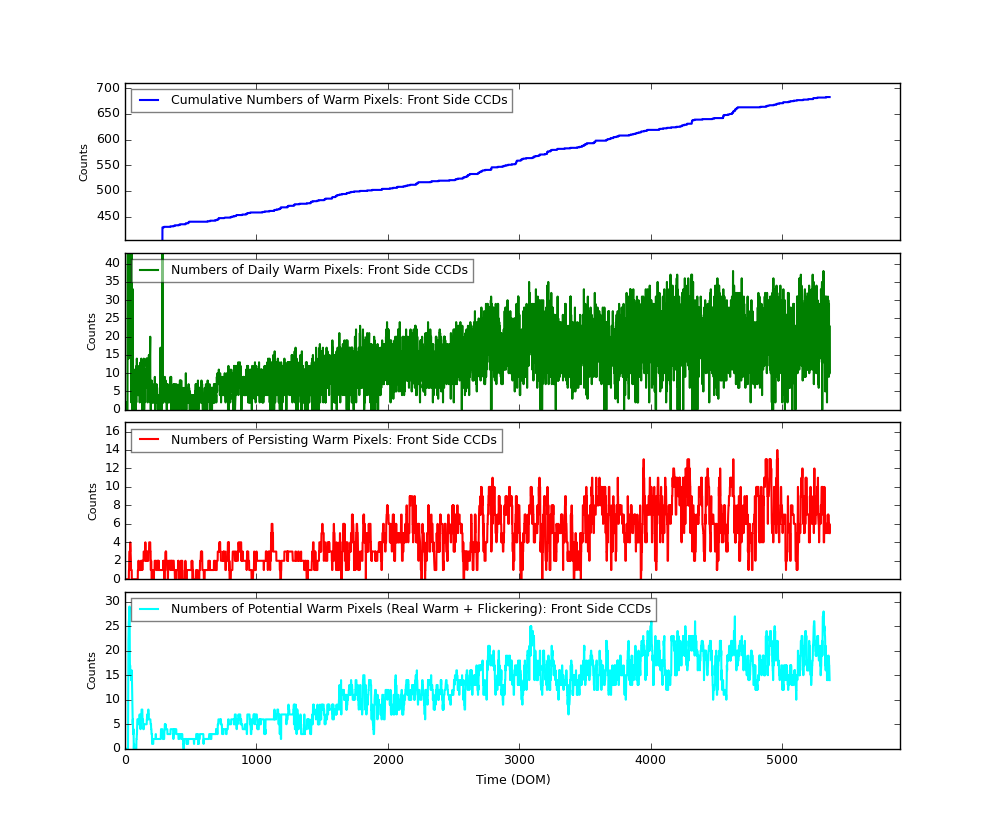
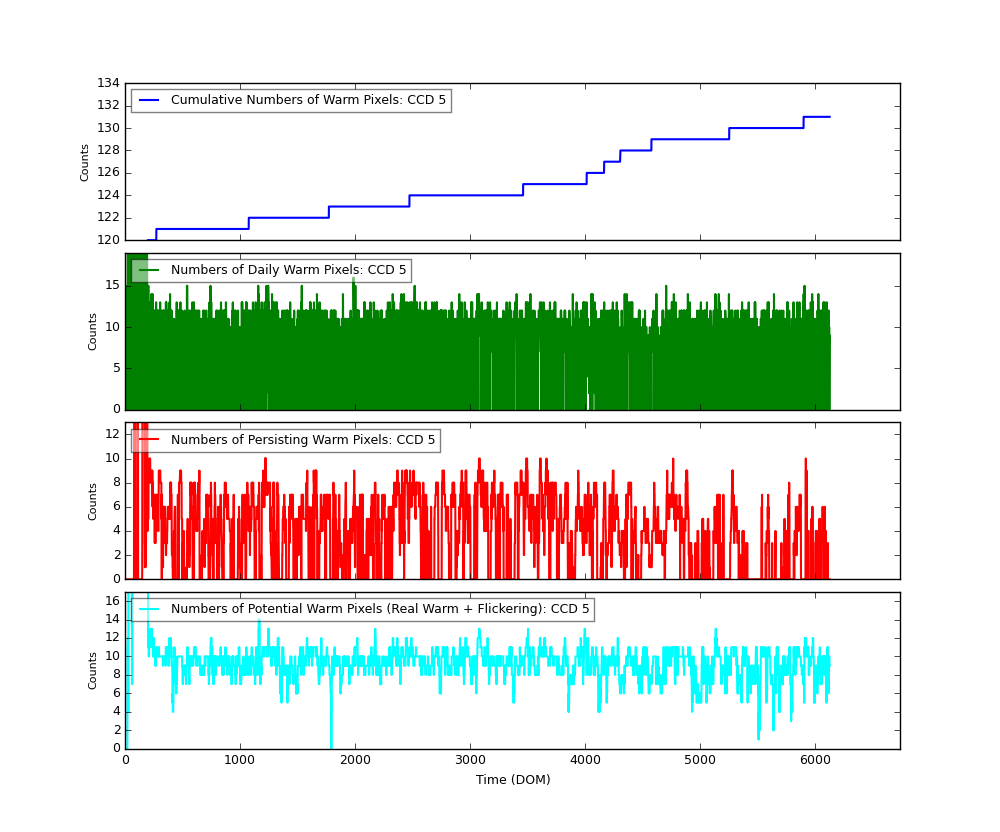
Bad Pixels
The plots below were generated with a new warm pixel finding script. Please see Acis Bad Pixel Page for details.
Front Side CCDs
Back Side CCD (CCD5)
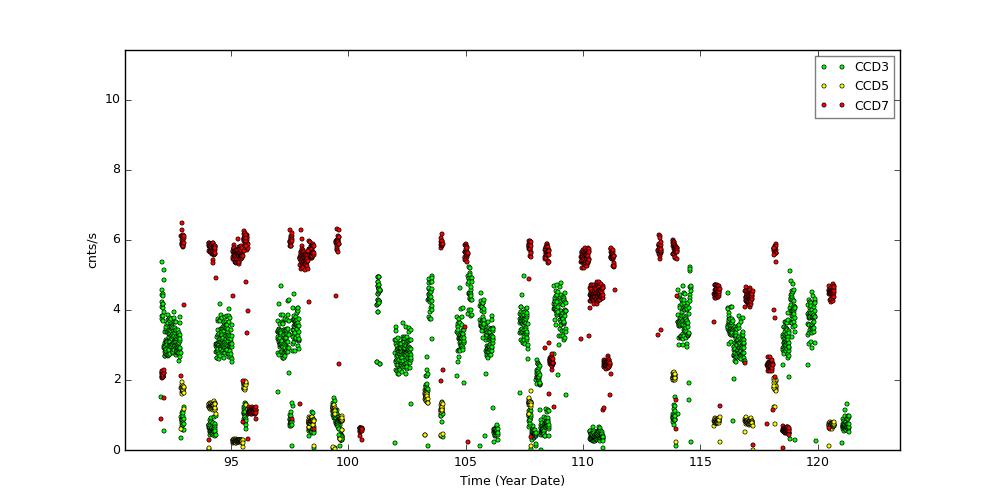
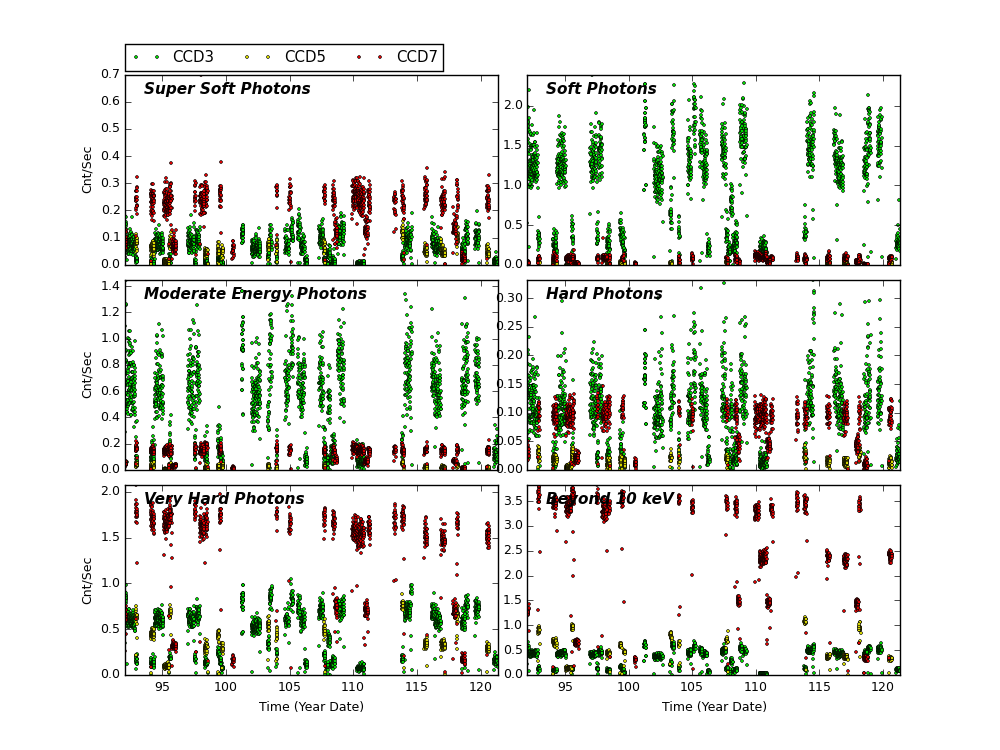
Science Instrument Background Rates
| Name | Low (keV) | High(KeV) | Description |
|---|---|---|---|
| SSoft | 0.00 | 0.50 | Super soft photons |
| Soft | 0.50 | 1.00 | Soft photons |
| Med | 1.00 | 3.00 | Moderate energy photons |
| Hard | 3.00 | 5.00 | Hard Photons |
| Harder | 5.00 | 10.00 | Very Hard photons |
| Hardest | 10.00 | Beyond 10 keV |
HRC
DOSE of Central 4K Pore-Pairs
Please refer to Maximum Dose Trends for more details.
)
|
|---|
        IMAGE                NPIX      MEAN    STDDEV      MIN       MAX
HRCI_04_2016.fits          16777216   0.007    0.0867      0.0        6.0
)
        IMAGE                NPIX      MEAN    STDDEV      MIN       MAX
HRCI_08_1999_04_2016.fits  16777216   4.398    4.984       0.0       292.0
)
|
|---|
     IMAGE                NPIX      MEAN    STDDEV      MIN       MAX
HRCS_04_2016.fits          16777216 0.035   0.2728      0.0       28.0
)
        IMAGE                NPIX     MEAN      STDDEV      MIN      MAX
HRCS_08_1999_04_2016.fits  16777216  15.966     28.515      0.0      1700.0
|
|
Max dose trend plots corrected for events that "pile-up"
in the center of the taps due to bad position information.
|
)
|
)
|
)
|
)
|
| Jan 2016 | Oct 2015 | Jul 2015 | Apr 2015 |
|---|
)
|
)
|
)
|
)
|
| Jan 2016 | Oct 2015 | Jul 2015 | Apr 2015 |
|---|
-->
Gratings
Focus
We plot the width of the zero order streak of ACIS/HETG observations and the width of the zero order image for HRC/LETG observations of point sources. No significant defocusing trend is seen at this time. See Gratings Focus pages.
Gratings Resolving Power
We plot E/dE vs. E for fits to detected lines with fwhm_error/fwhm less than 0.15 for the plus and minus arms of HEG, MEG, and LEG. Also shown are conservative (dotted line) and optimistic (dashed line) pre-launch resolving power expectations.
We have selected only calibration observations of Capella, HR1099, and Sigma Gem. See MIT technotes for a parallel analysis.
| Plot symbol indicates dispersion arm: | Color indicates observation date: |
Minus side = cross (x) |
2002-2004 blue 2005-2006 yellow 2007-2009 orange |
PCAD
ACA Trending
Gyro Bias Drift
Radiation History
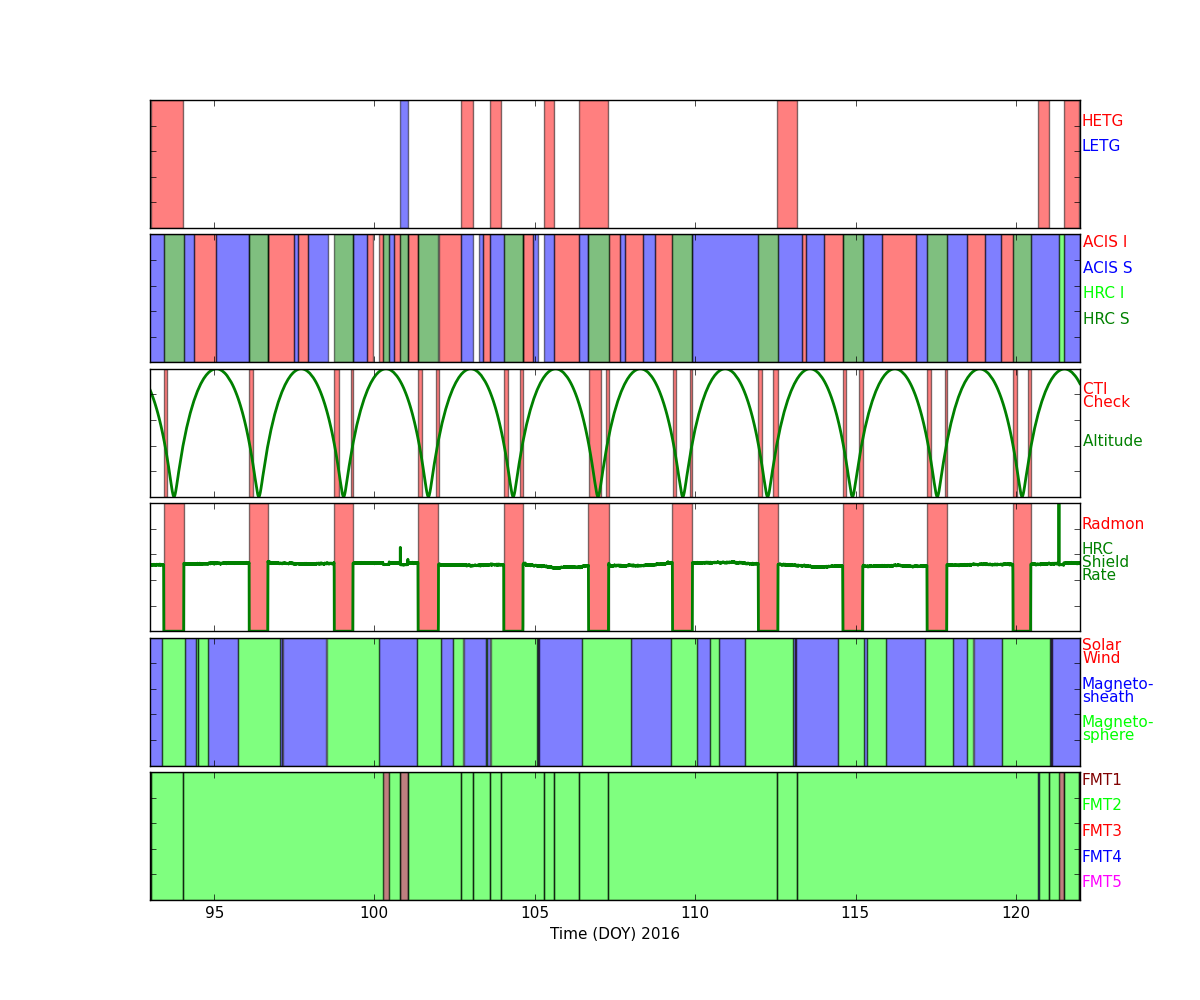
Radiation Zone Timing
Plotted below are radiation zone timing plots based on the following definitions of radiation zone:
- RADZONE - Ephin levels (in any of the E1300,P4GM,P41GM channels) are more than 1/3 of RADMON safing thresholds.
- RADMON - Radmon is disabled for radiation zone (as commanded based on OFLS model, for comparison with actual radiation levels).
- PERIGEE - Time of closest earth approach (for comparison)
Radiation Count Rates of Apr 2016
Sun Spot History
SIM
SIM Shift and Twist
SIM Shift and Twist Trend The following plots show trends of SIM shifts (dy and dz) and twist (dtheta). All quantities are directly taken from pcaf*_asol1.fits files. The units are mm for dy and dz, and degree for dtheta. We fit three lines separated before and after (Days of Mission)= 1400 (May 21, 2003), 2700 (Dec 11, 2006), and 4400 (Aug 07, 2011). The unit of slopes are mm per day or degree per day.
The sudden shift around DOM = 1400, 2700 and 4400 are due to fid light drift (see a memo by Aldcroft fiducial light drift). On the dtheta plot, two tracks are clearly observed. The track around 0.01 is due to HRC-I, and all others are clustered around -0.002. For more detail, please see SIM Shift and Twist Trend page
Trending
Quarterly Trends
- HRMA Thermal
| Previous Quarter | ||||||
| MSID | MEAN | RMS | DELTA/YR | DELTA/YR/YR | UNITS | DESCRIPTION |
| 4RT568T | 293.56 | 0.95 | 2.959e-01 | -1.051e+02 | K | RT 568 - HRMA TEMP |
| 4RT569T | 294.64 | 0.12 | -2.765e-02 | -1.066e+01 | K | RT 569 - HRMA TEMP |
| 4RT570T | 294.48 | 0.13 | 1.322e-01 | -2.672e+01 | K | RT 570 - HRMA TEMP |
| 4RT575T | 297.07 | 1.28 | 5.195e-01 | -1.434e+02 | K | RT 575 - OB CONE TEMP |
| 4RT576T | 289.44 | 0.95 | 3.039e-01 | -8.758e+01 | K | RT 576 - OB CONE TEMP |
| 4RT578T | 295.07 | 2.04 | 7.215e-01 | -1.265e+02 | K | RT 578 - OB CONE TEMP |
)
)
)
)
)
)
- ACIS Temperature
| Previous Quarter | ||||||
| MSID | MEAN | RMS | DELTA/YR | DELTA/YR/YR | UNITS | DESCRIPTION |
| 1CBAT | 212.41 | 1.08 | 3.701e-01 | 5.335e+00 | K | CAMERA BODY TEMP. A |
| 1CRAT | 148.77 | 1.93 | -9.409e-01 | -7.015e+00 | K | COLD RADIATOR TEMP. A |
| 1CRBT | 149.55 | 2.03 | -8.821e-01 | -2.766e+01 | K | COLD RADIATOR TEMP. B |
| 1DACTBT | 258.53 | 2.76 | -3.389e+00 | 6.647e+01 | K | DA COLLIMATOR TEMP. B |
| 1DEAMZT | 293.12 | 7.80 | -4.447e+00 | -1.870e+01 | K | DEA -Z PANEL TEMP |
| 1DPAMYT | 294.14 | 8.28 | -4.902e+00 | -3.245e+01 | K | DPA -Y PANEL TEMP |
| 1DPAMZT | 297.16 | 8.09 | -4.937e+00 | -1.336e+01 | K | DPA -Z PANEL TEMP |
| 1OAHAT | 246.92 | 1.91 | -2.751e+00 | 5.926e+01 | K | OPEN ACTUATOR HOUSING TEMP. A |
| 1OAHBT | 243.25 | 1.61 | -2.429e+00 | 4.263e+01 | K | OPEN ACTUATOR HOUSING TEMP. B |
| 1PDEAAT | 303.65 | 6.95 | 3.308e+00 | 2.303e+02 | K | PSMC DEA PS A TEMP |
| 1PDEABT | 295.36 | 6.92 | 2.542e+00 | 2.441e+02 | K | PSMC DEA PS B TEMP |
| 1PIN1AT | 295.26 | 9.26 | 6.356e+01 | 6.870e+02 | K | PSMC TEMP 1A |
| 1WRAT | 193.86 | 1.54 | -1.975e+00 | -1.224e+01 | K | WARM RADIATOR TEMP. A |
| 1WRBT | 193.46 | 1.37 | -2.067e+00 | 1.136e+01 | K | WARM RADIATOR TEMP. B |
)
)
)
)
)
)
)
)
)
)
)
)
)
)
- ACIS Electronics Side B
| Previous Quarter | ||||||
| MSID | MEAN | RMS | DELTA/YR | DELTA/YR/YR | UNITS | DESCRIPTION |
| 1DAHBCU | 0.25 | 0.18 | 2.347e-01 | -2.182e-01 | AMP | DA HEATER CURRENT B |
| 1DAHBVO | 3.34 | 2.41 | 3.062e+00 | -3.738e+00 | V | DA HEATER VOLTAGE B |
| 1DAHHBVO | 27.89 | 0.21 | 2.086e+00 | 1.675e+00 | V | DA HOUSING HEATER INPUT VOLTAGE B |
| 1DE28BVO | 27.90 | 0.21 | 2.090e+00 | 1.859e+00 | V | DEA +28V INPUT B |
| 1DEICBCU | 16.39 | 2.219e-02 | -1.077e-02 | 5.456e-01 | AMP | DEA INPUT CURRENT B |
| 1DEN0BVO | -0.15 | 1.877e-02 | 8.938e-03 | -1.641e-02 | V | DEA -6V VOLTAGE B |
| 1DEN1BVO | -0.34 | 4.856e-02 | -9.398e-03 | -6.927e-01 | V | DEA -15V VOLTAGE B |
| 1DEP0BVO | 0.06 | 1.832e-02 | 9.460e-03 | 7.147e-02 | V | DEA +6V VOLTAGE B |
| 1DEP1BVO | 0.15 | 4.633e-02 | 3.156e-02 | 1.501e-01 | V | DEA +15V ANALOG B |
| 1DEP2BVO | 0.23 | 7.073e-02 | 4.853e-02 | 3.301e-01 | V | DEA +24V ANALOG B |
| 1DEP3BVO | 0.29 | 9.114e-02 | 6.199e-02 | 4.756e-01 | V | DEA +28V ANALOG B |
| 1DP28BVO | 27.91 | 0.21 | 2.098e+00 | 1.873e+00 | V | DPA +28V INPUT B |
| 1DPICBCU | 0.97 | 0.33 | -1.835e-02 | 1.078e+00 | AMP | DPA INPUT CURRENT B |
| 1DPP0BVO | 5.23 | 4.650e-02 | 1.220e-02 | 2.289e-01 | V | DPA +5V ANALOG B |
)
)
)
)
)
)
)
)
)
)
)
)
)
)
Envelope Trending
Spacecraft Electronics
EPHIN Temperature and Voltage
EPS Battery
Spacecraft Motions
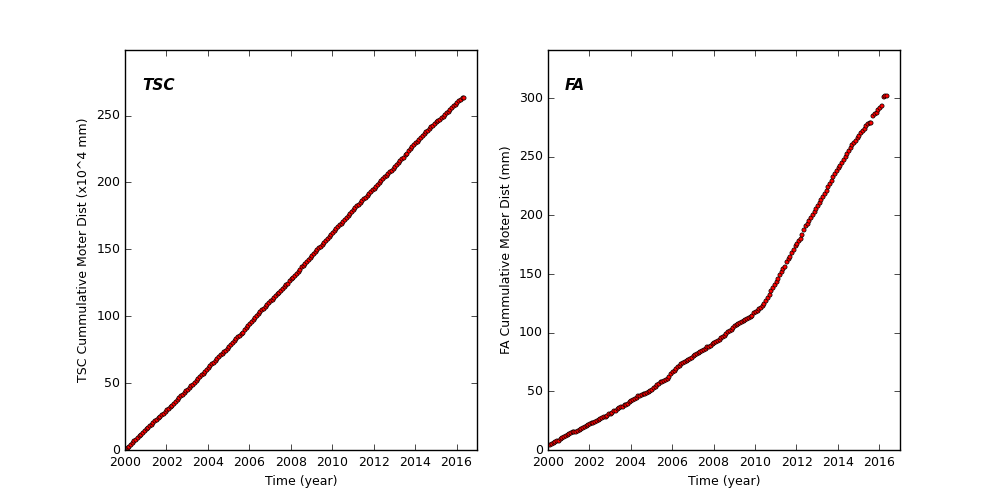
TSC and FA Cummulative Moter Distance
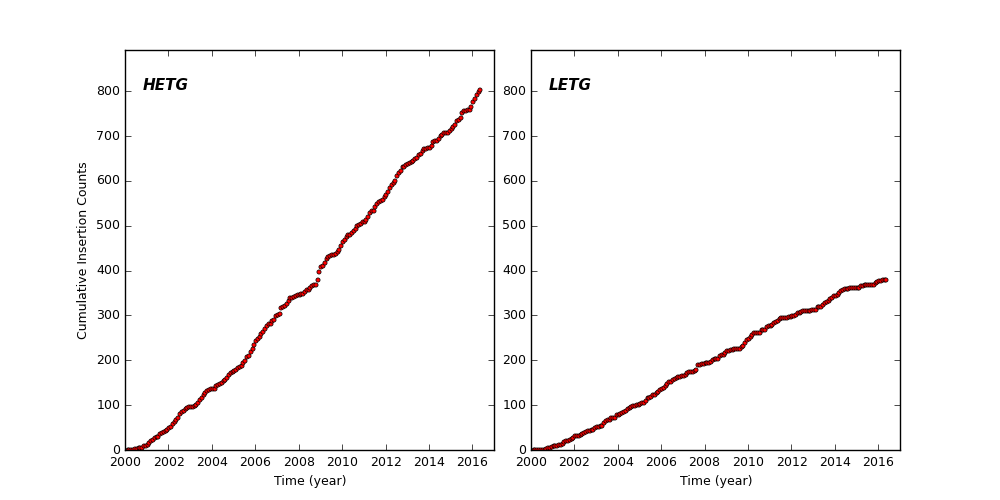
HETG and LETG Cummulative Insertion Counts
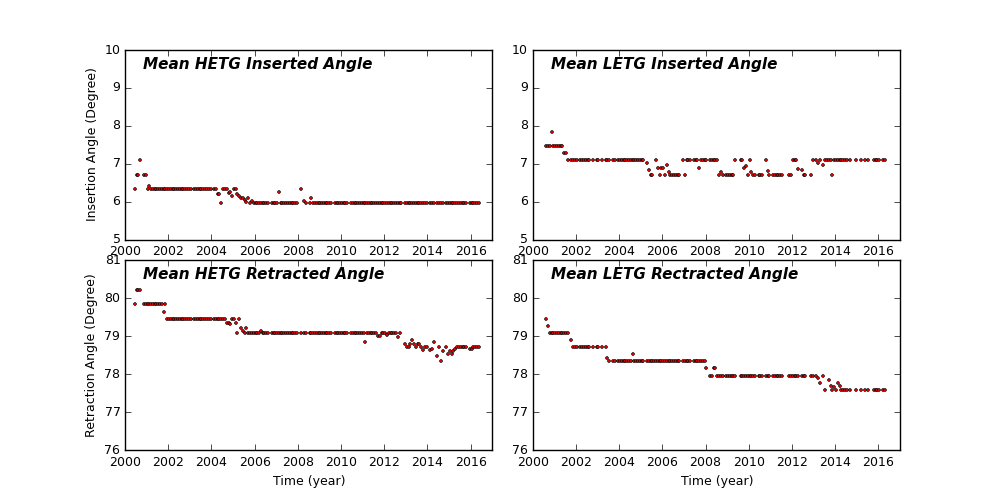
HETG/LETG Insertion/Retraction Angle
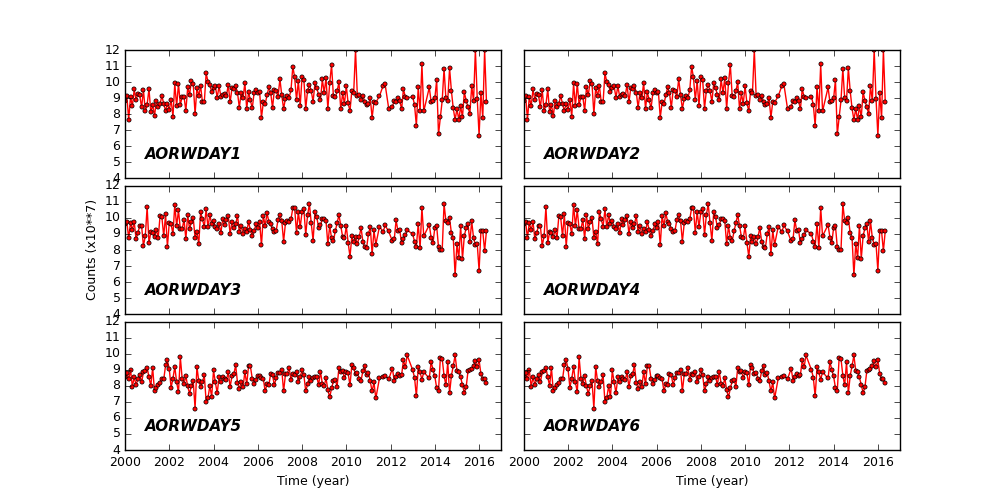
Reaction Wheel Rotations
Links to Past Monthly Reports
| Year | Month | |||||||||||
|---|---|---|---|---|---|---|---|---|---|---|---|---|
| 2016 | Jan | Feb | Mar | |||||||||
| 2015 | Jan | Feb | Mar | Apr | May | Jun | Jul | Aug | Sep | Oct | Nov | Dec |
| 2014 | Jan | Feb | Mar | Apr | May | Jun | Jul | Aug | Sep | Oct | Nov | Dec |
| 2013 | Jan | Feb | Mar | Apr | May | Jun | Jul | Aug | Sep | Oct | Nov | Dec |
| 2012 | Jan | Feb | Mar | Apr | May | Jun | Jul | Aug | Sep | Oct | Nov | Dec |
| 2011 | Jan | Feb | Mar | Apr | May | Jun | Jul | Aug | Sep | Oct | Nov | Dec |
| 2010 | Jan | Feb | Mar | Apr | May | Jun | Jul | Aug | Sep | Oct | Nov | Dec |
| 2009 | Jan | Feb | Mar | Apr | May | Jun | Jul | Aug | Sep | Oct | Nov | Dec |
| 2008 | Jan | Feb | Mar | Apr | May | Jun | Jul | Aug | Sep | Oct | Nov | Dec |
| 2007 | Jan | Feb | Mar | Apr | May | Jun | Jul | Aug | Sep | Oct | Nov | Dec |
| 2006 | Jan | Feb | Mar | Apr | May | Jun | Jul | Aug | Sep | Oct | Nov | Dec |
| 2005 | Jan | Feb | Mar | Apr | May | Jun | Jul | Aug | Sep | Oct | Nov | Dec |
| 2004 | Jan | Feb | Mar | Apr | May | Jun | Jul | Aug | Sep | Oct | Nov | Dec |
| 2003 | Jan | Feb | Mar | Apr | May | Jun | Jul | Aug | Sep | Oct | Nov | Dec |
| 2002 | Jan | Feb | Mar | Apr | May | Jun | Jul | Aug | Sep | Oct | Nov | Dec |
| 2001 | Jan | Feb | Mar | Apr | May | Jun | Jul | Aug | Sep | Oct | Nov | Dec |
| 2000 | Jan | Feb | Mar | Apr | May | Jun | Jul | Aug | Sep | Oct | Nov | Dec |
| 1999 | Jul | Aug | Sep | Oct | Nov | Dec | ||||||