ACIS
ACIS DOSE Registered-Photon-Map
The steps we took to compute the dose map are;
- Level 1 Event files for a specified month are obtained from archive.
- Image data including I2, I3, S2, S3 CCDs are extracted from all event files.
- All the extracted image data were merged to create a month long exposure map for the month.
- The exposure map is opened with ds9, and check a distribution of count rates against energy. From this, estimate the upper threshold value. Any events beyond this upper threshold are assumed erroneous events such as bad pixels.
- Using this upper threshold, the data is filtered, and create a cleaned exposure map for the month.
- The exposure map from each month from the Sep 1999 is added up to create a cumulative exposure map for each month.
- Using fimgstatistic, we compute count rate statistics for each CCDs.
- For observations with high data drop rates (e.g., Crab nebula, Cas A), we corrected the observations by adding events.
Please check more detail plots at Telemetered Photon Dose Trend page.
)
)
)
Statistics:
# IMAGE     NPIX     MEAN        RMS        MIN     MAX

ACIS_may16 6004901   7.214       12.499     0.0     4541

I2 node 0  262654    7.094816    3.175953   0.0    52.0
I2 node 1  262654    7.435549    3.938164   0.0   947.0
I2 node 2  262654    7.437003    3.303973   0.0    74.0
I2 node 3  262654    7.585659   12.776205   0.0  4126.0

I3 node 0  262654    9.025751    3.850523   0.0   105.0
I3 node 1  262654    9.194995    8.890417   0.0   204.0
I3 node 2  262654    8.333582    3.462162   0.0    81.0
I3 node 3  262654    8.669100    8.009322   0.0  2443.0

S2 node 0  262654    8.797292    7.901148   0.0  2162.0
S2 node 1  262654    9.104700    7.254103   0.0   778.0
S2 node 2  262654    9.510225    9.398308   0.0  2244.0
S2 node 3  262654    9.119405   11.655304   0.0  4541.0

S3 node 0  262654   12.612416   25.077644   0.0  1015.0
S3 node 1  262654   12.051097    5.929839   0.0   274.0
S3 node 2  262654   11.910501    5.920318   0.0   227.0
S3 node 3  262654   10.908306    5.913009   0.0   248.0
)
)
)
Statistics:
 IMAGE     NPIX      MEAN        RMS           MIN      MAX

ACIS_total 6004901   2010.185    2622.268      0.0   115117

I2 node 0  262654   1711.136872  329.346853   349.0   9302.0
I2 node 1  262654   1802.435258  454.860572   365.0  49316.0
I2 node 2  262654      7.437003    3.303973     0.0     74.0
I2 node 3  262654   1833.358653  462.969381   355.0  28231.0

I3 node 0  262654   1931.745725  462.752975   342.0   7533.0
I3 node 1  262654   2022.701405 1528.490580   349.0  38093.0
I3 node 2  262654   1769.879275  319.771560   337.0   9501.0
I3 node 3  262654      8.669100    8.009322     0.0   2443.0

S2 node 0  262654   2346.584808  343.113646  1257.0  21427.0
S2 node 1  262654      9.104700    7.254103     0.0    778.0
S2 node 2  262654   2750.200486  525.547767  1673.0  27378.0
S2 node 3  262654   2686.208187  380.632171  1564.0  47051.0

S3 node 0  262654   4174.425364 1853.560751  1726.0  13877.0
S3 node 1  262654   5364.022456 2140.692580     0.0  14336.0
S3 node 2  262654   4139.181476 1047.565798  1720.0   9976.0
S3 node 3  262654   3202.226377  485.303071  1834.0  10788.0
)
|
)
|
)
|
)
|
| Feb 2016 | Nov 2015 | Aug 2015 | May 2015 |
|---|
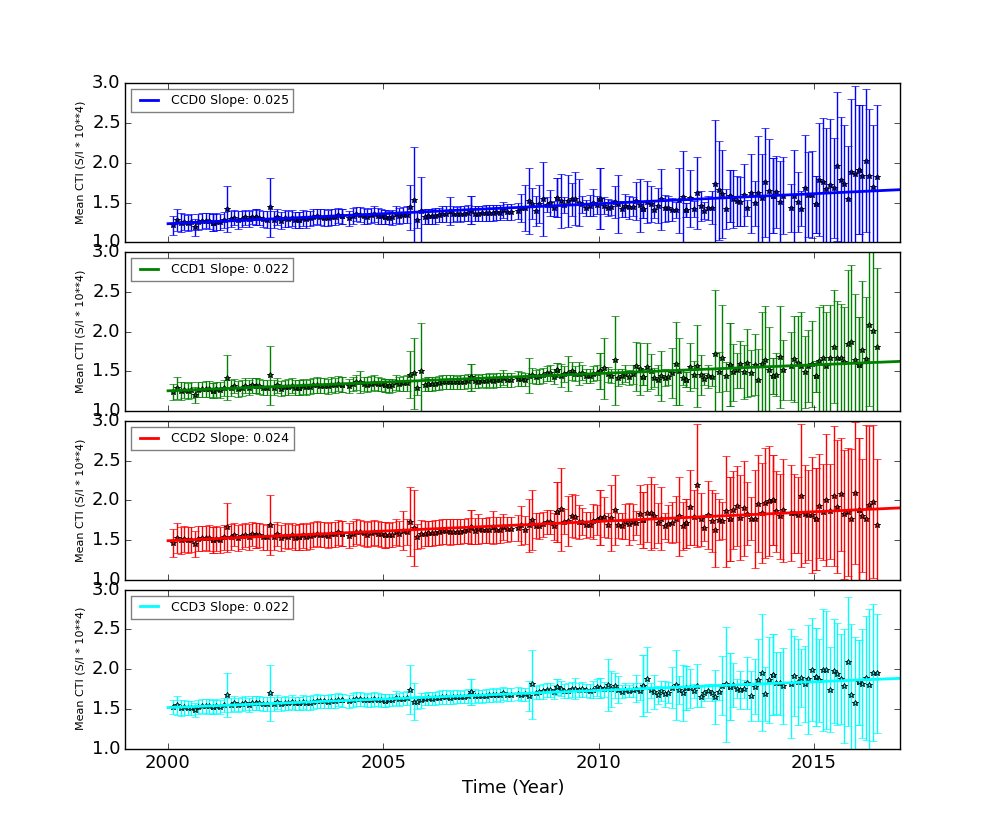
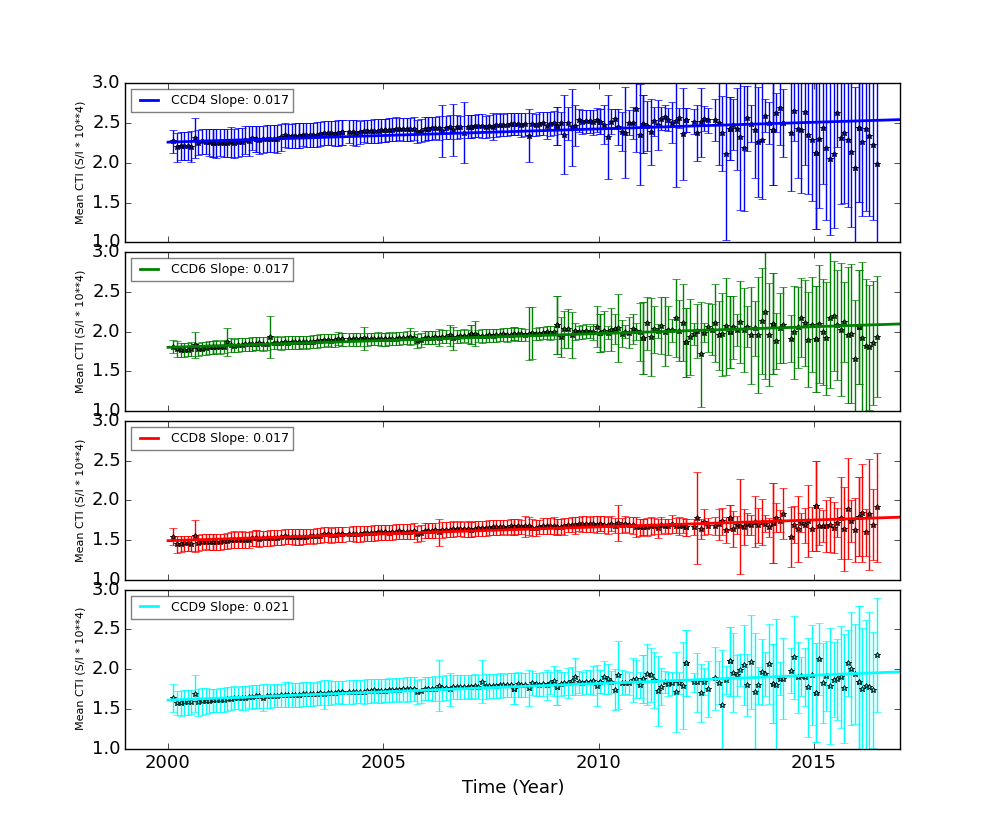
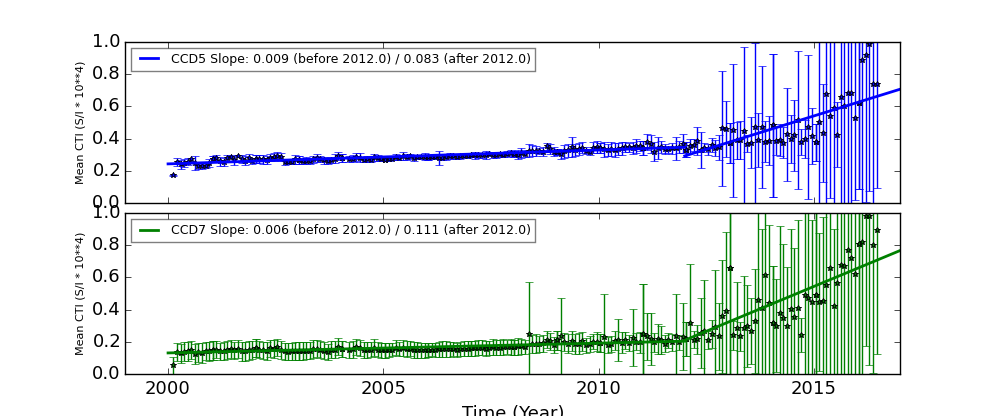
The Mean Detrended CTI
We report CTIs with a refined data definition. CTIs were computed for the temperature dependency corrected data. Please see CTI page for detailed explanation. CTI's are computed for Mn K alpha, and defined as slope/intercept x10^4 of row # vs ADU. Data file: here
Imaging CCDs
Spectral CCDs
Backside CCDs
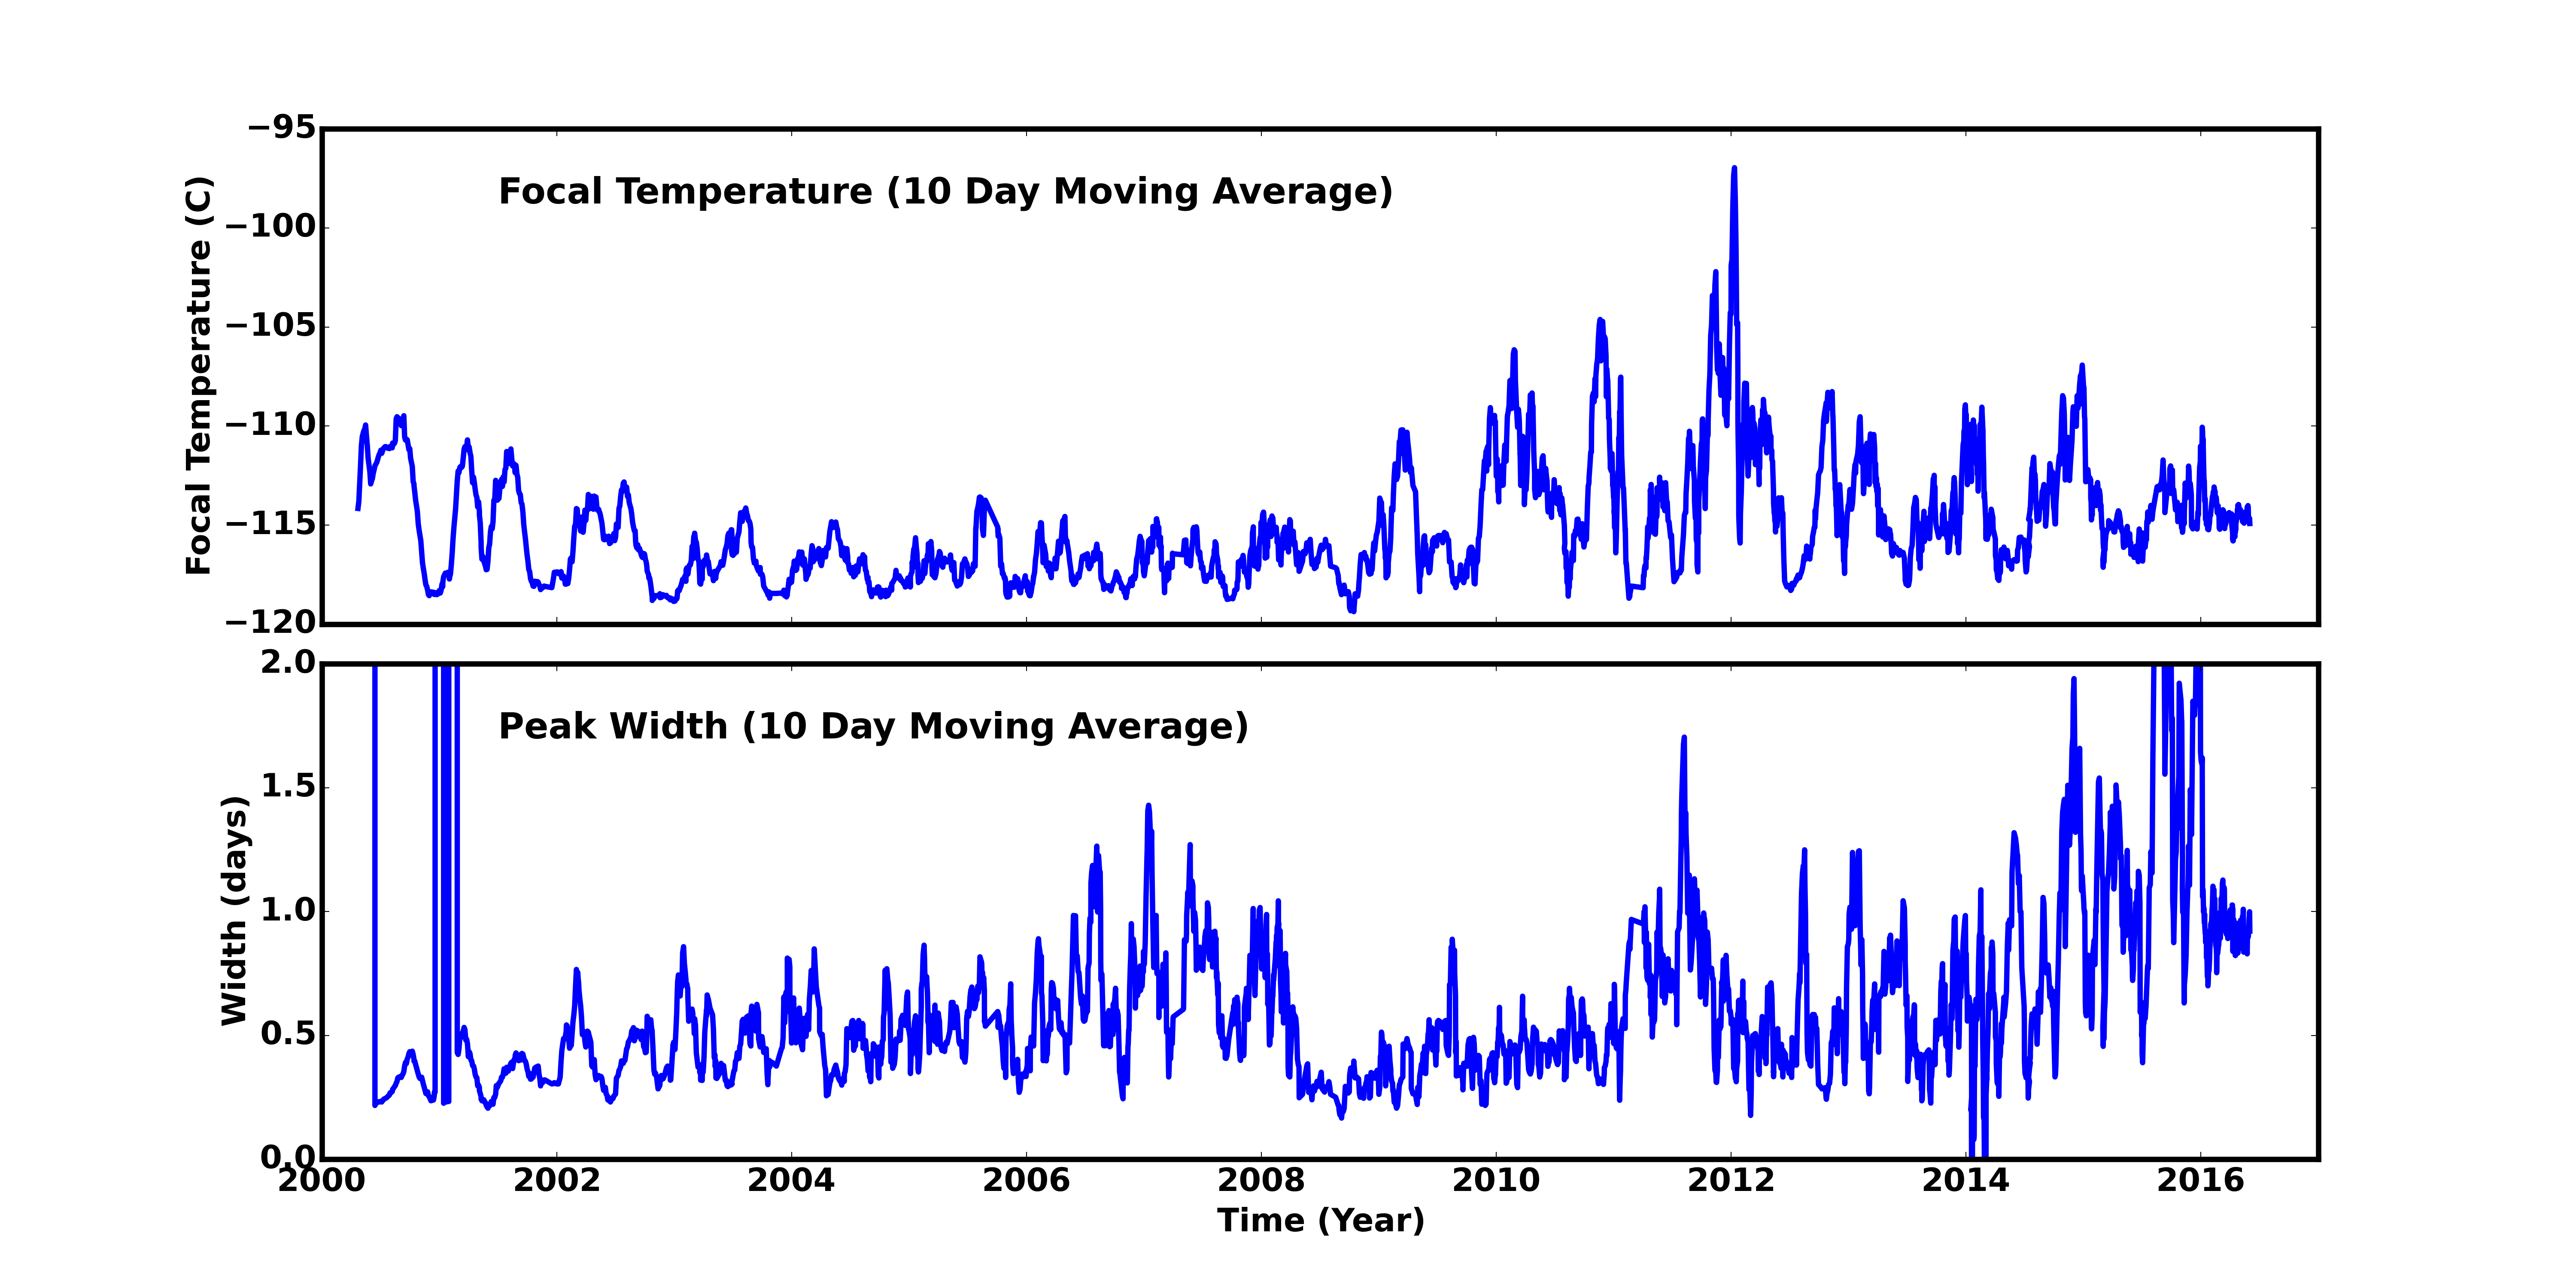
Focal Plane Temperature
Apr 2016 Focal Temperature
| The Mean (max) FPT: | |
|---|---|
| -114.62 | +/- 1.73 C |
| Mean Width: | |
| 0.89 | +/- 0.32 days |
Averaged Focal Plane Temperature
We are using 10 period moving averages to show trends of peak temperatures and peak widths. Note, the gaps in the width plot are due to missing/corrupted data.
Focal Plane Temperature, Sun Angle and Altitude
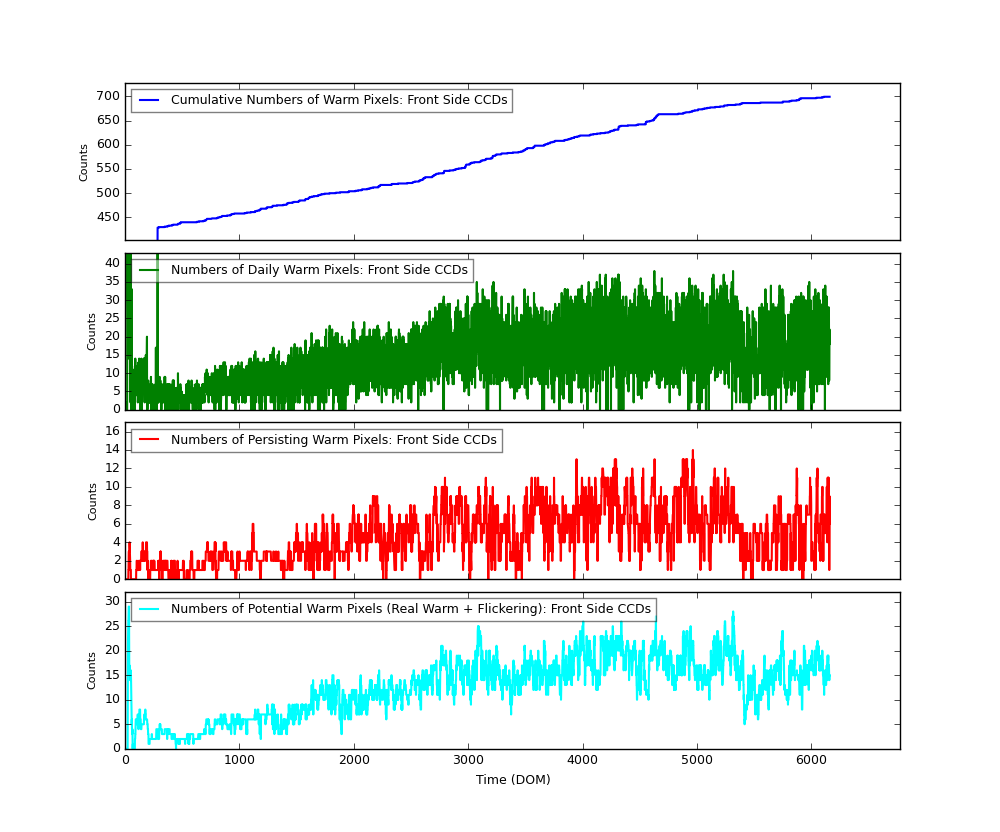
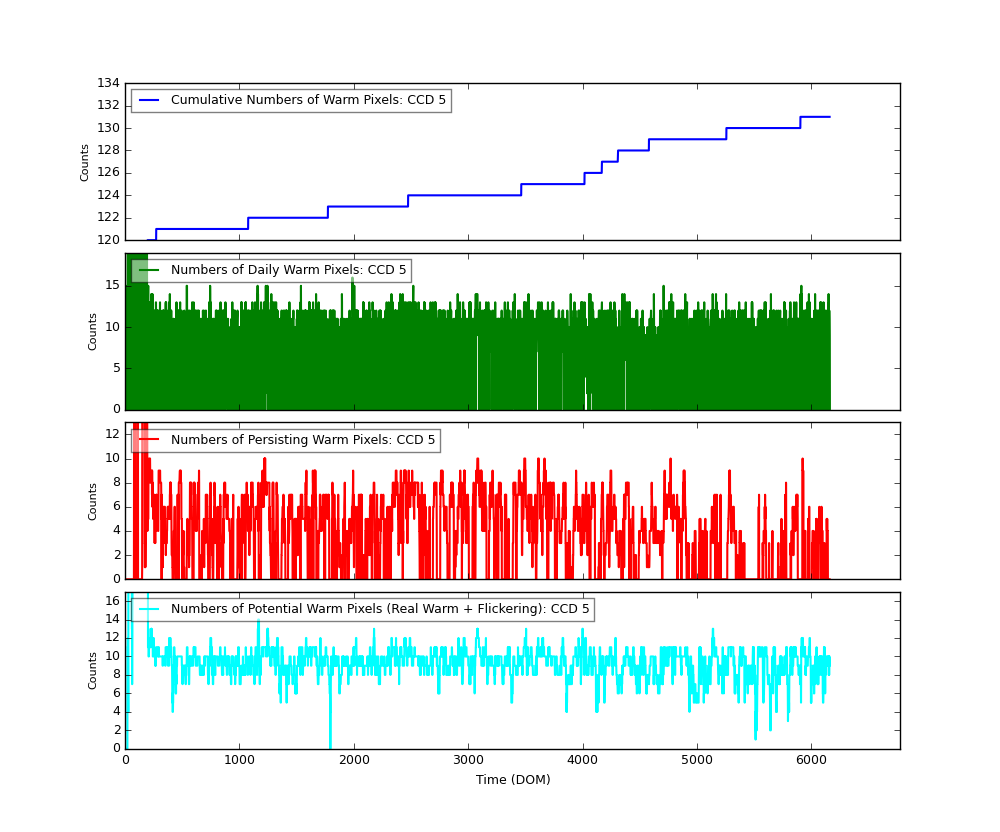
Bad Pixels
The plots below were generated with a new warm pixel finding script. Please see Acis Bad Pixel Page for details.
Front Side CCDs
Back Side CCD (CCD5)
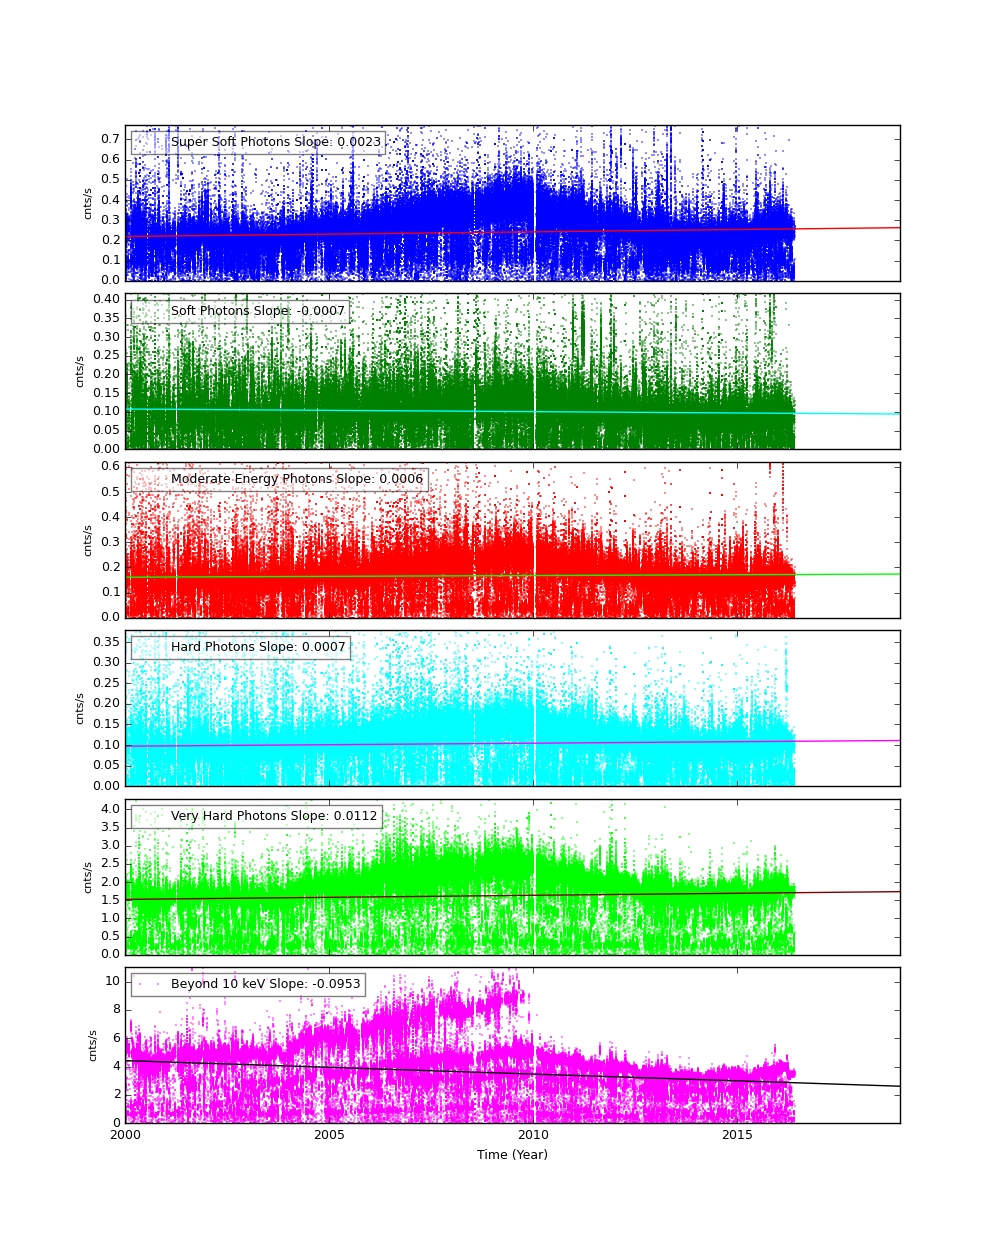
Science Instrument Background Rates
| Name | Low (keV) | High(KeV) | Description |
|---|---|---|---|
| SSoft | 0.00 | 0.50 | Super soft photons |
| Soft | 0.50 | 1.00 | Soft photons |
| Med | 1.00 | 3.00 | Moderate energy photons |
| Hard | 3.00 | 5.00 | Hard Photons |
| Harder | 5.00 | 10.00 | Very Hard photons |
| Hardest | 10.00 | Beyond 10 keV |
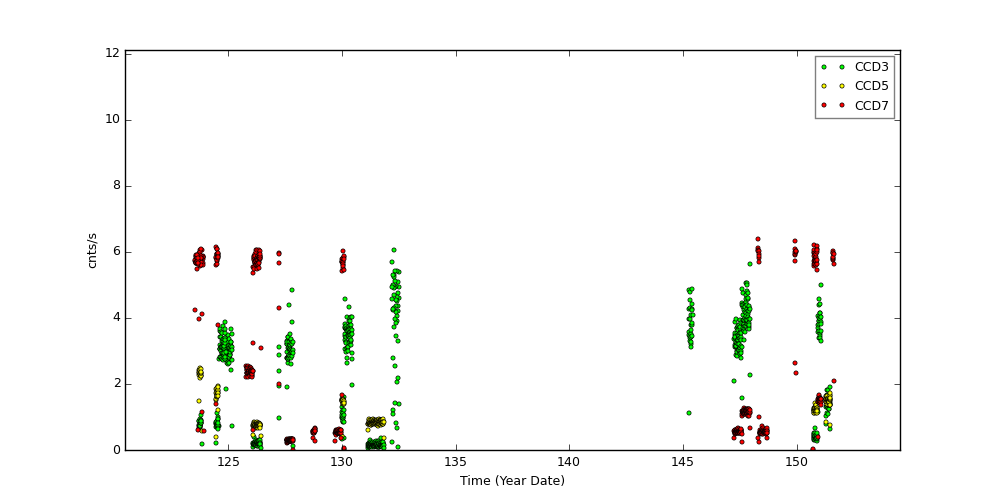
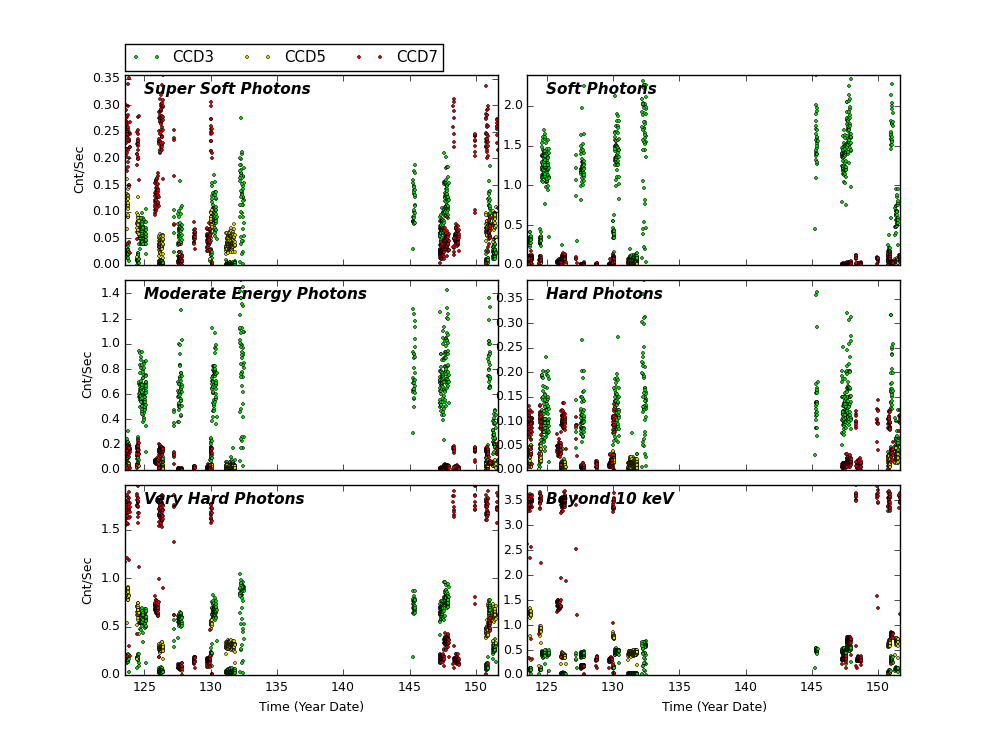
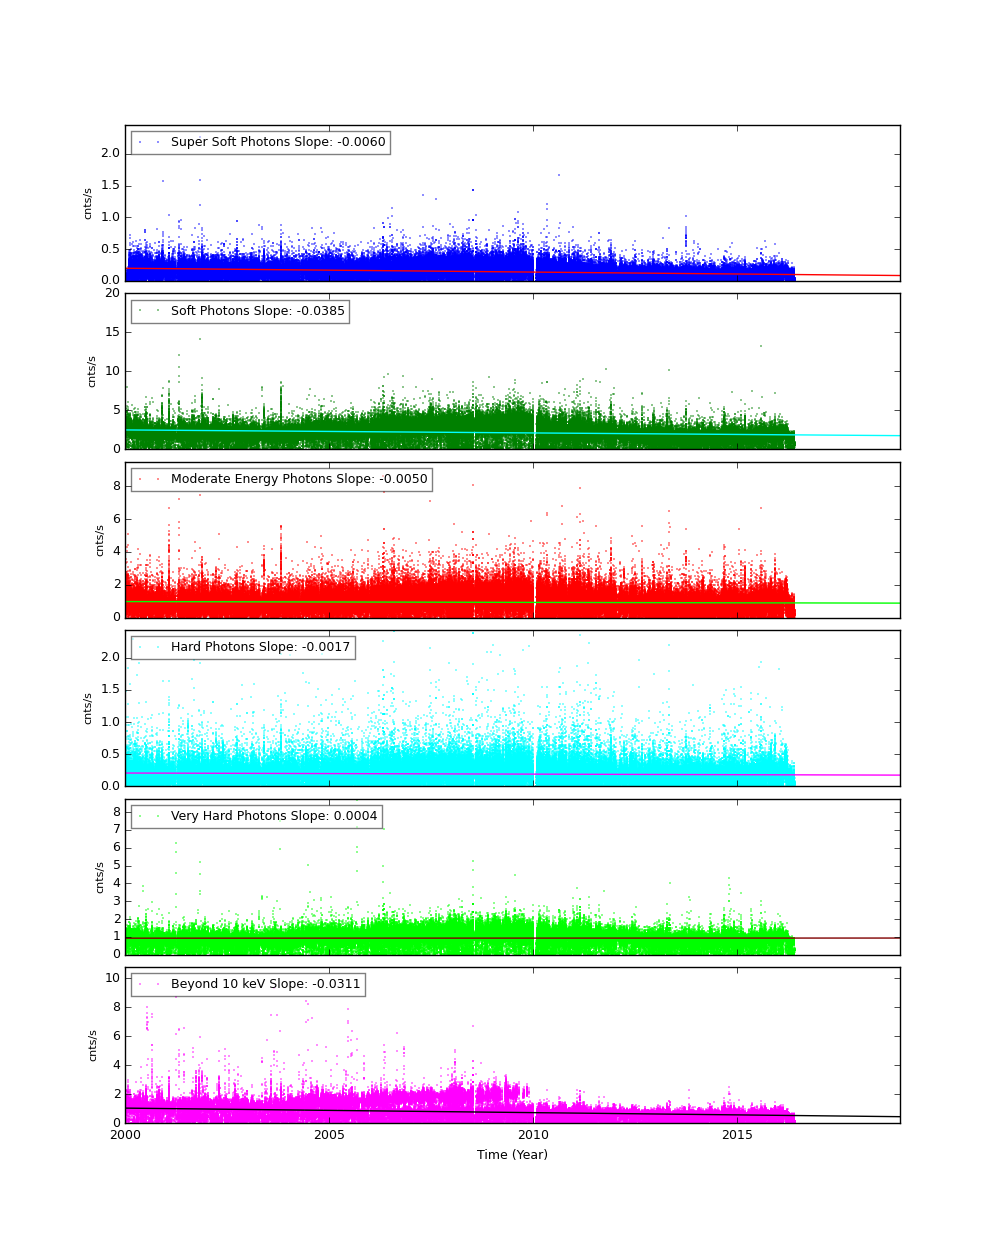
The following three plots show trends of SIB from year 2000. CCDs shown here are CCD3, CCD5, and CCD7. Fitted lines are linear fit after eliminating extreme outliers. For >10 keV plots, 2 lines are fit. One is with a 13 keV filter, and another without.
CCD 3
CCD 5
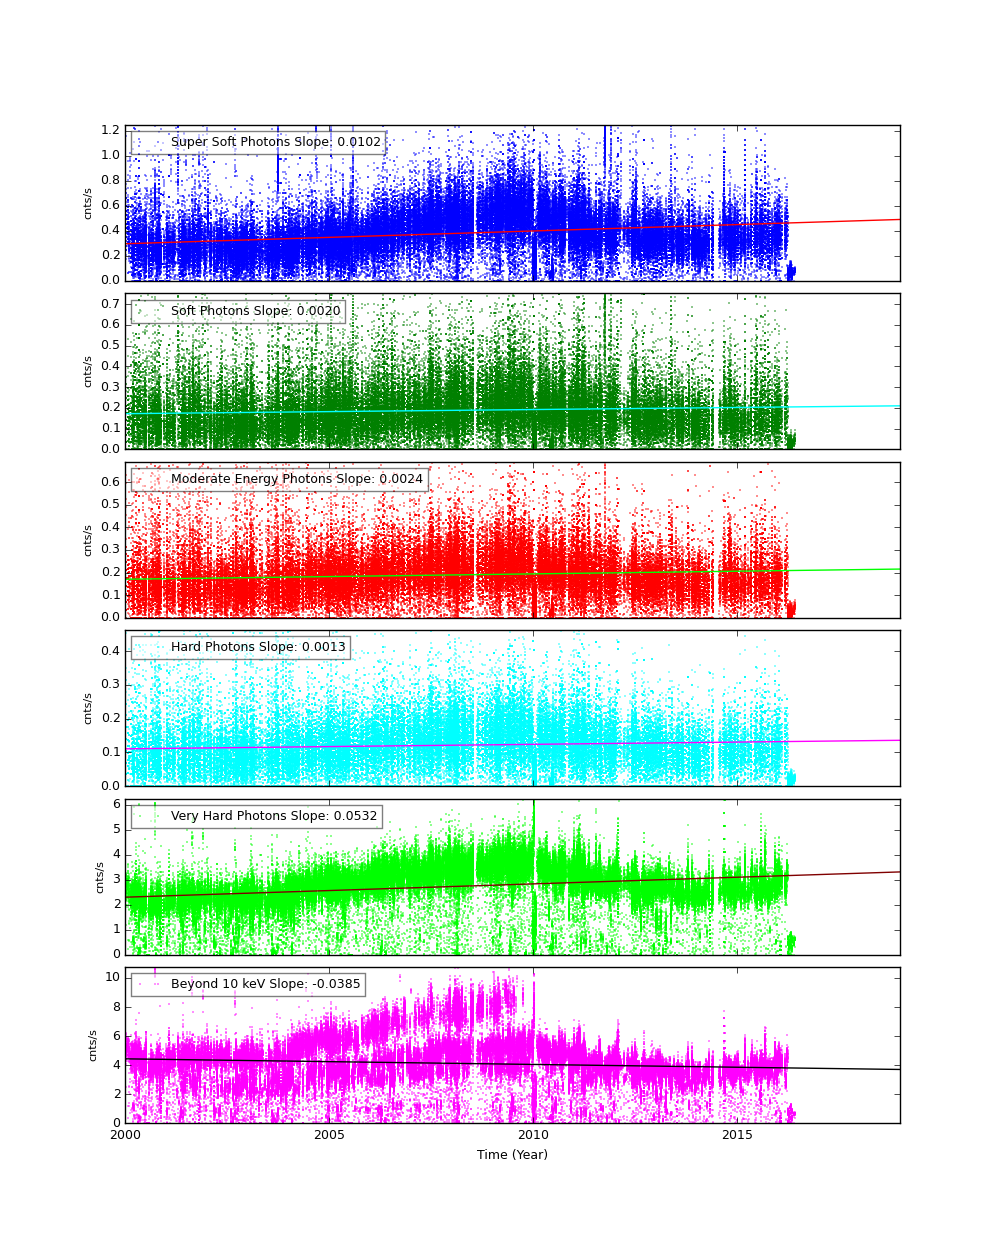
CCD 7
ACIS Histogram Mode Trends
We collected data from acis histogram mode data, and created trend plots of peak portions and peak widths against time (DOM). The peaks were estimated by fitting a simple Gaussian on three peaks (Al, Ti, and Mn), and the widths were estimated by a width at the half max from the peak.
All histogram data are taken under TIMED and GRADED_HIST mode, SIM position is at an external calibration source position, the focal temperature is around -119.7 C, and parameter settings in aciselec, acistemp are set to about same for all.
CCD 3, Peak Position
CCD 3, Peak Widths
CCD 3, Count Rates
[an error occurred while processing this directive]
HRC
DOSE of Central 4K Pore-Pairs
Please refer to Maximum Dose Trends for more details.
)
|
|---|
        IMAGE                NPIX      MEAN    STDDEV      MIN       MAX
HRCI_05_2016.fits          16777216   0.021    0.1479      0.0        4.0
)
        IMAGE                NPIX      MEAN    STDDEV      MIN       MAX
HRCI_08_1999_05_2016.fits  16777216   4.420    4.988       0.0       292.0
No Data
)
        IMAGE                NPIX     MEAN      STDDEV      MIN      MAX
HRCS_08_1999_05_2016.fits  16777216  15.966     28.515      0.0      1700.0
|
|
Max dose trend plots corrected for events that "pile-up"
in the center of the taps due to bad position information.
|
)
|
)
|
)
|
)
|
| Feb 2016 | Nov 2015 | Aug 2015 | May 2015 |
|---|
)
|
)
|
)
|
)
|
| Feb 2016 | Nov 2015 | Aug 2015 | May 2015 |
|---|
Gratings
Focus
We plot the width of the zero order streak of ACIS/HETG observations and the width of the zero order image for HRC/LETG observations of point sources. No significant defocusing trend is seen at this time. See Gratings Focus pages.
-->
PCAD
ACA Trending
Gyro Bias Drift
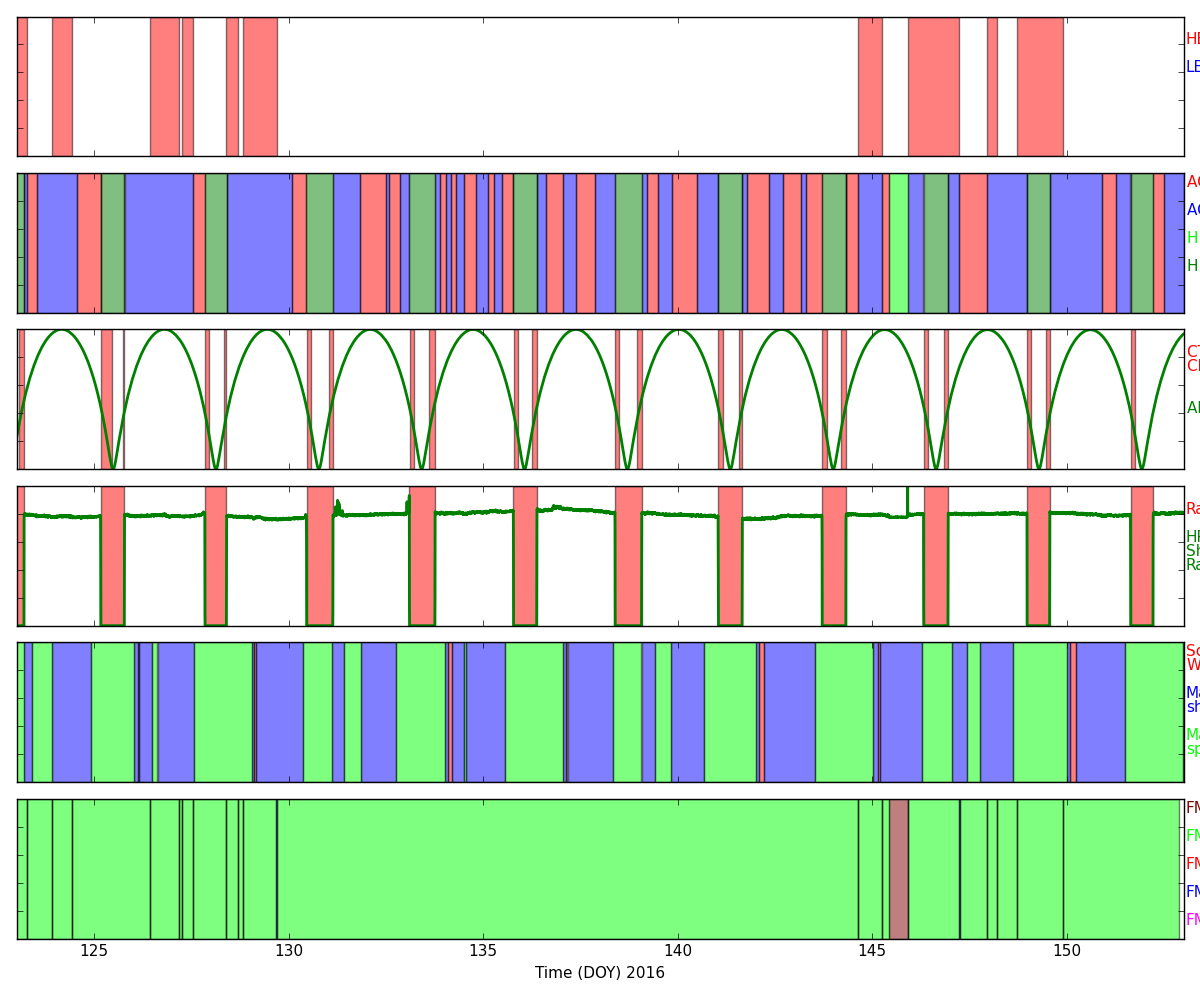
Radiation History
Radiation Zone Timing
Plotted below are radiation zone timing plots based on the following definitions of radiation zone:
- RADZONE - Ephin levels (in any of the E1300,P4GM,P41GM channels) are more than 1/3 of RADMON safing thresholds.
- RADMON - Radmon is disabled for radiation zone (as commanded based on OFLS model, for comparison with actual radiation levels).
- PERIGEE - Time of closest earth approach (for comparison)
Radiation Count Rates of May 2016
Sun Spot History
Trending
Quarterly Trends
- EPHIN Temperature and Voltage
| Previous Quarter | ||||||
| MSID | MEAN | RMS | DELTA/YR | DELTA/YR/YR | UNITS | DESCRIPTION |
| 5EIOT | 352.76 | 18.66 | -9.305e+00 | -9.050e+01 | K | EIO TEMP |
| 5EPHINT | 334.03 | 5.49 | -2.249e+01 | -4.574e+01 | K | EPHIN TEMP |
| HKEBOXTEMP | 339.15 | 5.70 | -2.314e+01 | -7.292e+01 | K | EPHIN HOUSEKEEPING EBOX: TEMPERATURE (5EHSE300) |
| HKN6I | 73.20 | 0.33 | 1.486e+00 | 2.540e+01 | AMP | HK 6 Volts Rail - Current |
| HKN6V | -5.97 | 1.111e-02 | -3.264e-02 | -2.692e-01 | V | HK -6 Volts Rail - Voltage |
| HKP27I | 7.01 | 8.166e-02 | 2.652e-01 | 2.817e+00 | AMP | HK 27 Volts Rail - Current |
| HKP27V | 26.88 | 5.087e-02 | -1.469e-01 | -1.175e+00 | V | HK 27 Volts Rail - Voltage |
| HKP5I | 48.42 | 1.62 | 1.724e+00 | -1.286e+02 | AMP | HK 5 Volts Rail - Current |
| HKP5V | 5.08 | 6.157e-03 | 1.416e-02 | 3.013e-01 | V | HK 5 Volts Rail - Voltage |
| HKP6I | 137.48 | 0.65 | -2.437e+00 | -8.384e+00 | AMP | HK 6 Volts Rail - Current |
| HKP6V | 5.77 | 1.360e-02 | 2.631e-02 | -5.013e-02 | V | HK 6 Volts Rail - Voltage |
| TEIO | 326.46 | 19.93 | -1.205e+01 | -1.995e+02 | K | EPHIN ELECTRONICS HOUSING TEMP |
| TEPHIN | 334.13 | 5.71 | -2.222e+01 | -5.862e+01 | K | EPHIN SENSOR HOUSING TEMP |
)
)
)
)
)
)
)
)
)
)
)
)
)
- HRC Temperature
| Previous Quarter | ||||||
| MSID | MEAN | RMS | DELTA/YR | DELTA/YR/YR | UNITS | DESCRIPTION |
| 2CEAHVPT | 298.39 | 1.89 | -9.455e-01 | -9.797e+01 | K | CEA RADIATOR TEMPERATURE AT CENTER |
| 2CHTRPZT | 294.89 | 1.87 | -5.013e-01 | -9.786e+01 | K | CENTRAL ELECTRONICS BOX TEMP |
| 2CONDMXT | 291.80 | 2.07 | 3.463e-01 | -1.600e+02 | K | CONDUIT -X FACE TEMPERATURE |
| 2DCENTRT | 290.58 | 1.66 | 5.932e-01 | -1.052e+02 | K | DETECTOR HOUSING TEMP 2 |
| 2DTSTATT | 291.62 | 1.73 | 1.326e+00 | -1.368e+02 | K | DETECTOR HOUSING TEMP 1 |
| 2FHTRMZT | 294.03 | 2.00 | 1.989e+00 | -1.684e+02 | K | FRONT END ELECTRONICS BOX TEMPERATURE |
| 2FRADPYT | 289.94 | 2.08 | 2.143e+00 | -1.653e+02 | K | FRONT END ASSEMBLY +Y AT RADIATOR CENTER TEMP |
| 2PMT1T | 292.14 | 2.20 | 2.214e+00 | -1.919e+02 | K | PMT 1 TEMPERATURE |
| 2PMT2T | 294.57 | 2.44 | 2.721e+00 | -2.283e+02 | K | PMT 2 TEMPERATURE |
| 2UVLSPXT | 286.28 | 1.93 | 1.496e-02 | -7.683e+01 | K | UV LIGHT SHIELD NEXT TO SNOUT TEMP |
)
)
)
)
)
)
)
)
)
)
- HRC HK
| Previous Quarter | ||||||
| MSID | MEAN | RMS | DELTA/YR | DELTA/YR/YR | UNITS | DESCRIPTION |
| FE00ATM | 20.93 | 1.57 | 1.694e+00 | -1.302e+02 | C | Front end temperature (2FE00ATM) |
| FEPRATM | 23.42 | 1.81 | 1.917e+00 | -1.480e+02 | C | FE temp card temperature (2FEPRATM) |
| IMHVATM | 30.21 | 1.59 | 8.098e-01 | -8.544e+01 | (2IMHVATM)C | Imaging det HVPS temperature |
| IMINATM | 17.00 | 1.63 | 7.844e-01 | -8.759e+01 | C | Imaging det temperature (2IMINATM) |
| LVPLATM | 26.64 | 1.42 | -9.847e-02 | -7.541e+01 | C | LVPS plate temperature (2LVPLATM) |
| PRBSCR | 1.58 | 2.786e-02 | -5.638e-02 | 1.764e+00 | AMP | Primary bus current (2PRBSCR) |
| PRBSVL | 27.52 | 0.18 | 2.166e+00 | 2.958e+00 | V | Primary bus voltage (2PRBSVL) |
| SMTRATM | 5.66 | 5.412e-02 | -3.894e-02 | 3.700e+00 | C | Selected motor temperature (2SMTRATM) |
| SPHVATM | 30.58 | 1.62 | -2.978e+00 | -5.515e+01 | C | Spect det HVPS temperature (2SPHVATM) |
| SPINATM | 18.33 | 1.60 | 2.689e-01 | -8.984e+01 | C | Spect det temperature (2SPINATM) |
)
)
)
)
)
)
)
)
)
)
Envelope Trending
SIM Electronics
SIM Temperature
Spacecraft Electronics
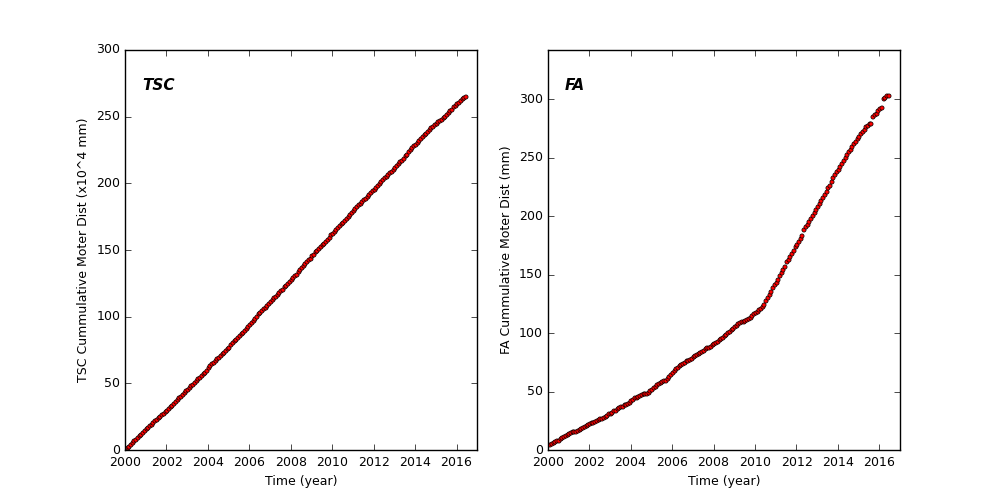
Spacecraft Motions
TSC and FA Cummulative Moter Distance
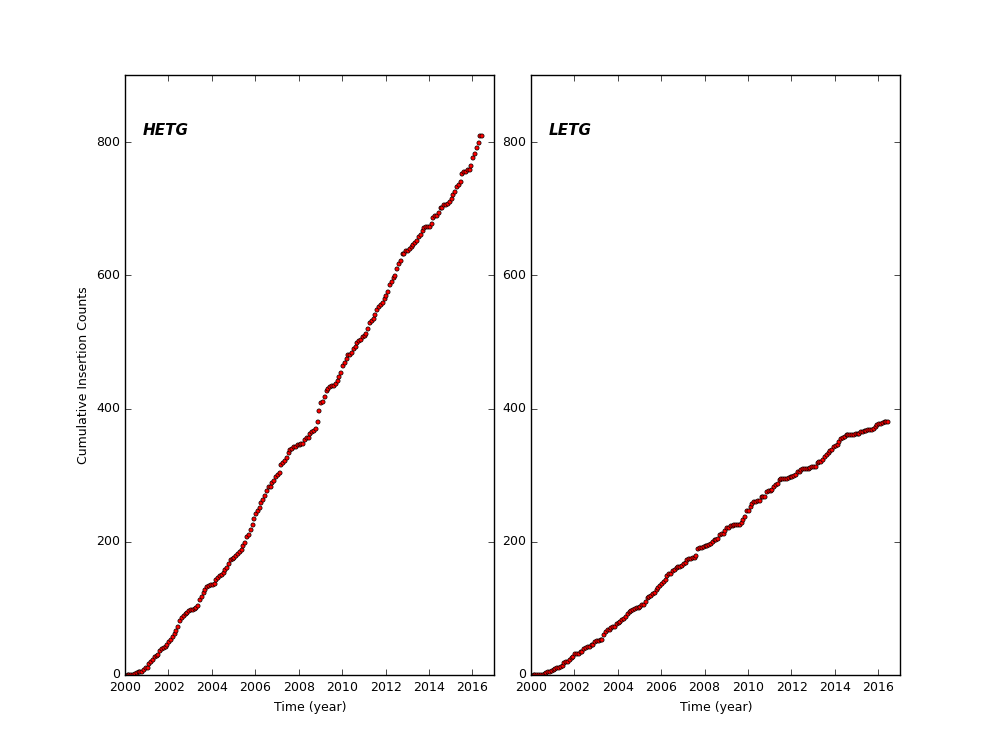
HETG and LETG Cummulative Insertion Counts
HETG/LETG Insertion/Retraction Angle
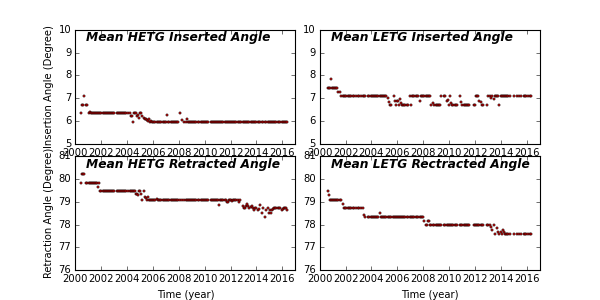
Reaction Wheel Rotations
Links to Past Monthly Reports
| Year | Month | |||||||||||
|---|---|---|---|---|---|---|---|---|---|---|---|---|
| 2016 | Jan | Feb | Mar | Apr | ||||||||
| 2015 | Jan | Feb | Mar | Apr | May | Jun | Jul | Aug | Sep | Oct | Nov | Dec |
| 2014 | Jan | Feb | Mar | Apr | May | Jun | Jul | Aug | Sep | Oct | Nov | Dec |
| 2013 | Jan | Feb | Mar | Apr | May | Jun | Jul | Aug | Sep | Oct | Nov | Dec |
| 2012 | Jan | Feb | Mar | Apr | May | Jun | Jul | Aug | Sep | Oct | Nov | Dec |
| 2011 | Jan | Feb | Mar | Apr | May | Jun | Jul | Aug | Sep | Oct | Nov | Dec |
| 2010 | Jan | Feb | Mar | Apr | May | Jun | Jul | Aug | Sep | Oct | Nov | Dec |
| 2009 | Jan | Feb | Mar | Apr | May | Jun | Jul | Aug | Sep | Oct | Nov | Dec |
| 2008 | Jan | Feb | Mar | Apr | May | Jun | Jul | Aug | Sep | Oct | Nov | Dec |
| 2007 | Jan | Feb | Mar | Apr | May | Jun | Jul | Aug | Sep | Oct | Nov | Dec |
| 2006 | Jan | Feb | Mar | Apr | May | Jun | Jul | Aug | Sep | Oct | Nov | Dec |
| 2005 | Jan | Feb | Mar | Apr | May | Jun | Jul | Aug | Sep | Oct | Nov | Dec |
| 2004 | Jan | Feb | Mar | Apr | May | Jun | Jul | Aug | Sep | Oct | Nov | Dec |
| 2003 | Jan | Feb | Mar | Apr | May | Jun | Jul | Aug | Sep | Oct | Nov | Dec |
| 2002 | Jan | Feb | Mar | Apr | May | Jun | Jul | Aug | Sep | Oct | Nov | Dec |
| 2001 | Jan | Feb | Mar | Apr | May | Jun | Jul | Aug | Sep | Oct | Nov | Dec |
| 2000 | Jan | Feb | Mar | Apr | May | Jun | Jul | Aug | Sep | Oct | Nov | Dec |
| 1999 | Jul | Aug | Sep | Oct | Nov | Dec | ||||||