ACIS
ACIS DOSE Registered-Photon-Map
The steps we took to compute the dose map are;
- Level 1 Event files for a specified month are obtained from archive.
- Image data including I2, I3, S2, S3 CCDs are extracted from all event files.
- All the extracted image data were merged to create a month long exposure map for the month.
- The exposure map is opened with ds9, and check a distribution of count rates against energy. From this, estimate the upper threshold value. Any events beyond this upper threshold are assumed erroneous events such as bad pixels.
- Using this upper threshold, the data is filtered, and create a cleaned exposure map for the month.
- The exposure map from each month from the Sep 1999 is added up to create a cumulative exposure map for each month.
- Using fimgstatistic, we compute count rate statistics for each CCDs.
- For observations with high data drop rates (e.g., Crab nebula, Cas A), we corrected the observations by adding events.
Please check more detail plots at Telemetered Photon Dose Trend page.
)
)
)
Statistics:
# IMAGE     NPIX     MEAN        RMS        MIN     MAX

ACIS_jun16 6004901   8.208       14.466     0.0     6259

I2 node 0  262654    8.629445     4.135522    0.0   77.0
I2 node 1  262654    8.909755     4.492908    0.0 1113.0
I2 node 2  262654    8.714056     5.715779    0.0 2266.0
I2 node 3  262654    8.937385    23.475047    0.0 6259.0

I3 node 0  262654   10.950113    12.769017    0.0 4644.0
I3 node 1  262654   10.764234    13.583905    0.0  327.0
I3 node 2  262654    9.604724     3.800211    0.0   92.0
I3 node 3  262654    9.750592     4.410724    0.0  226.0

S2 node 0  262654    9.341942     6.108432    0.0  573.0
S2 node 1  262654    9.928112     7.433786    0.0  715.0
S2 node 2  262654   11.201731     7.952369    0.0  489.0
S2 node 3  262654   11.091344     7.781498    0.0  651.0

S3 node 0  262654   15.683360    24.505795    0.0  847.0
S3 node 1  262654   14.787068    12.978526    0.0  435.0
S3 node 2  262654   12.779871     8.843950    0.0  231.0
S3 node 3  262654   10.792250     6.063442    0.0  219.0
)
)
)
Statistics:
 IMAGE     NPIX      MEAN        RMS           MIN      MAX

ACIS_total 6004901   2018.393    2632.677      0.0   115533

I2 node 0  262654   1719.766317  331.385871   352.0    9379.0
I2 node 1  262654   1811.345013  457.514820   368.0   50429.0
I2 node 2  262654      8.714056   5.715779      0.0    2266.0
I2 node 3  262654   1842.296039  466.190704   355.0   28240.0

I3 node 0  262654   1942.695838  466.407429   345.0    7586.0
I3 node 1  262654   2033.465639 1541.249122   352.0   38420.0
I3 node 2  262654   1779.483999  321.718884   339.0    9586.0
I3 node 3  262654      9.750592    4.410724     0.0     226.0

S2 node 0  262654   2355.926750  344.778182  1265.0   21441.0
S2 node 1  262654      9.928112    7.433786     0.0     715.0
S2 node 2  262654   2761.402217  527.360180  1678.0   27381.0
S2 node 3  262654   2697.299531  381.659112  1569.0   47361.0

S3 node 0  262654   4190.108724 1859.931333  1736.0   13888.0
S3 node 1  262654   5378.809524 2143.373166     0.0   14345.0
S3 node 2  262654   4151.961347 1049.729137  1726.0   10002.0
S3 node 3  262654   3213.018628  486.560760  1840.0   10834.0
)
|
)
|
)
|
)
|
| Mar 2016 | Dec 2015 | Sep 2015 | Jun 2015 |
|---|
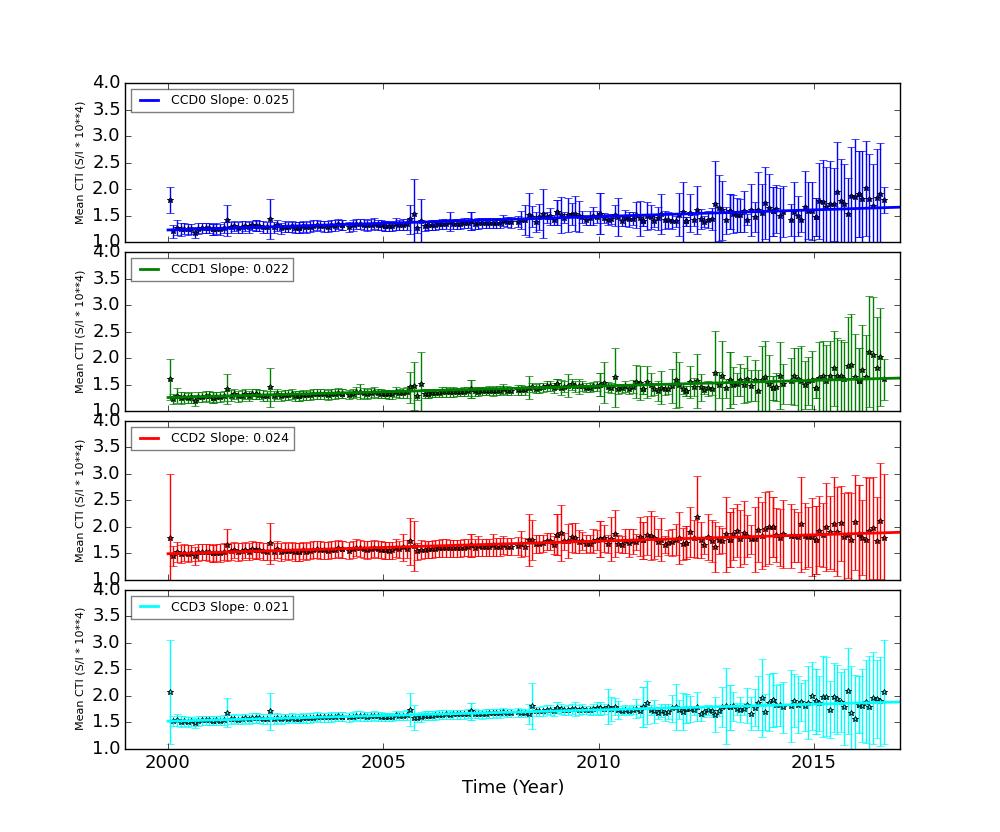
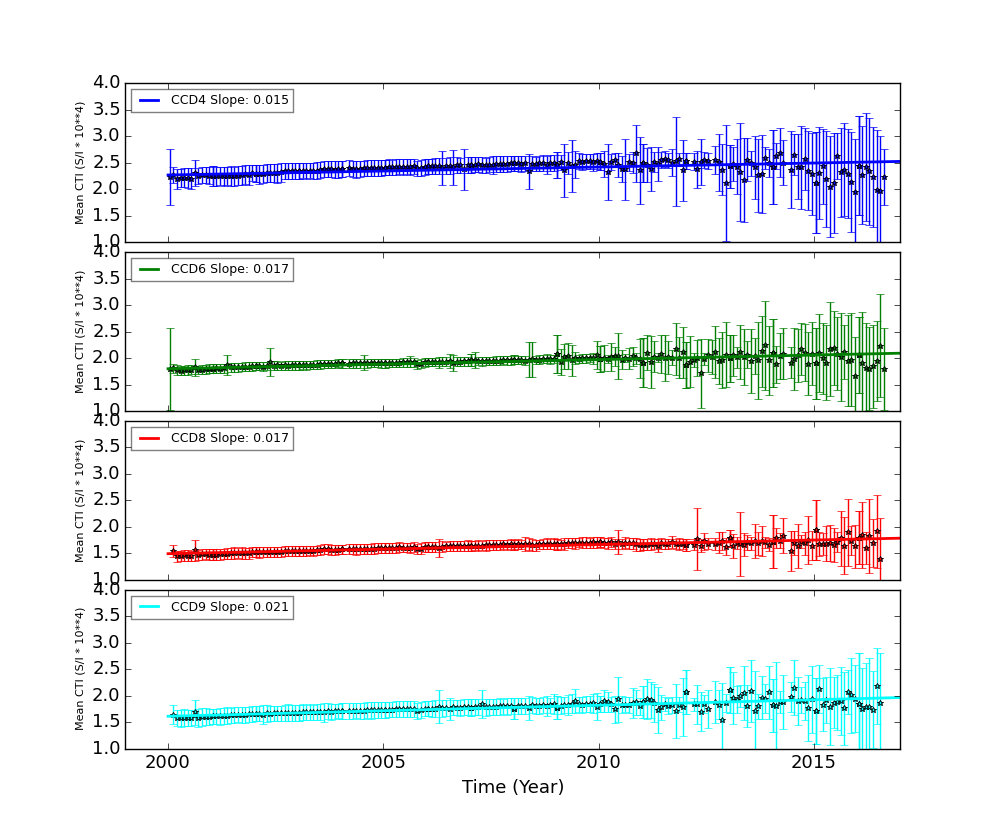
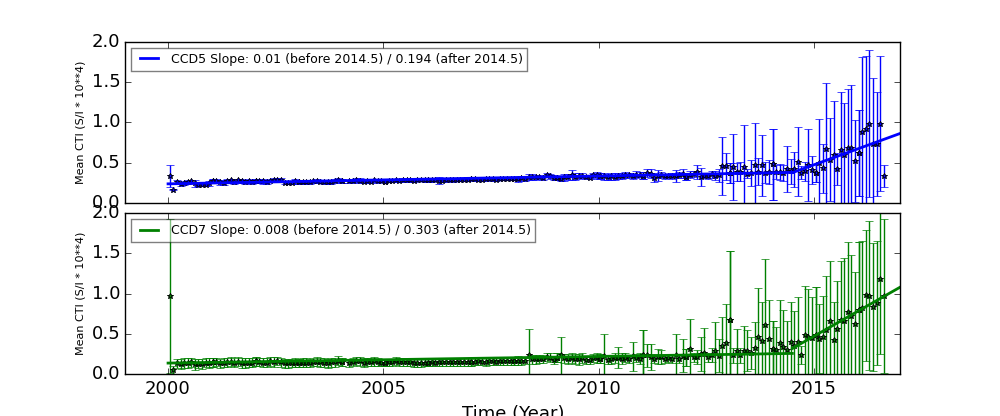
The Mean Detrended CTI
We report CTIs with a refined data definition. CTIs were computed for the temperature dependency corrected data. Please see CTI page for detailed explanation. CTI's are computed for Mn K alpha, and defined as slope/intercept x10^4 of row # vs ADU. Data file: here
Imaging CCDs
Spectral CCDs
Backside CCDs
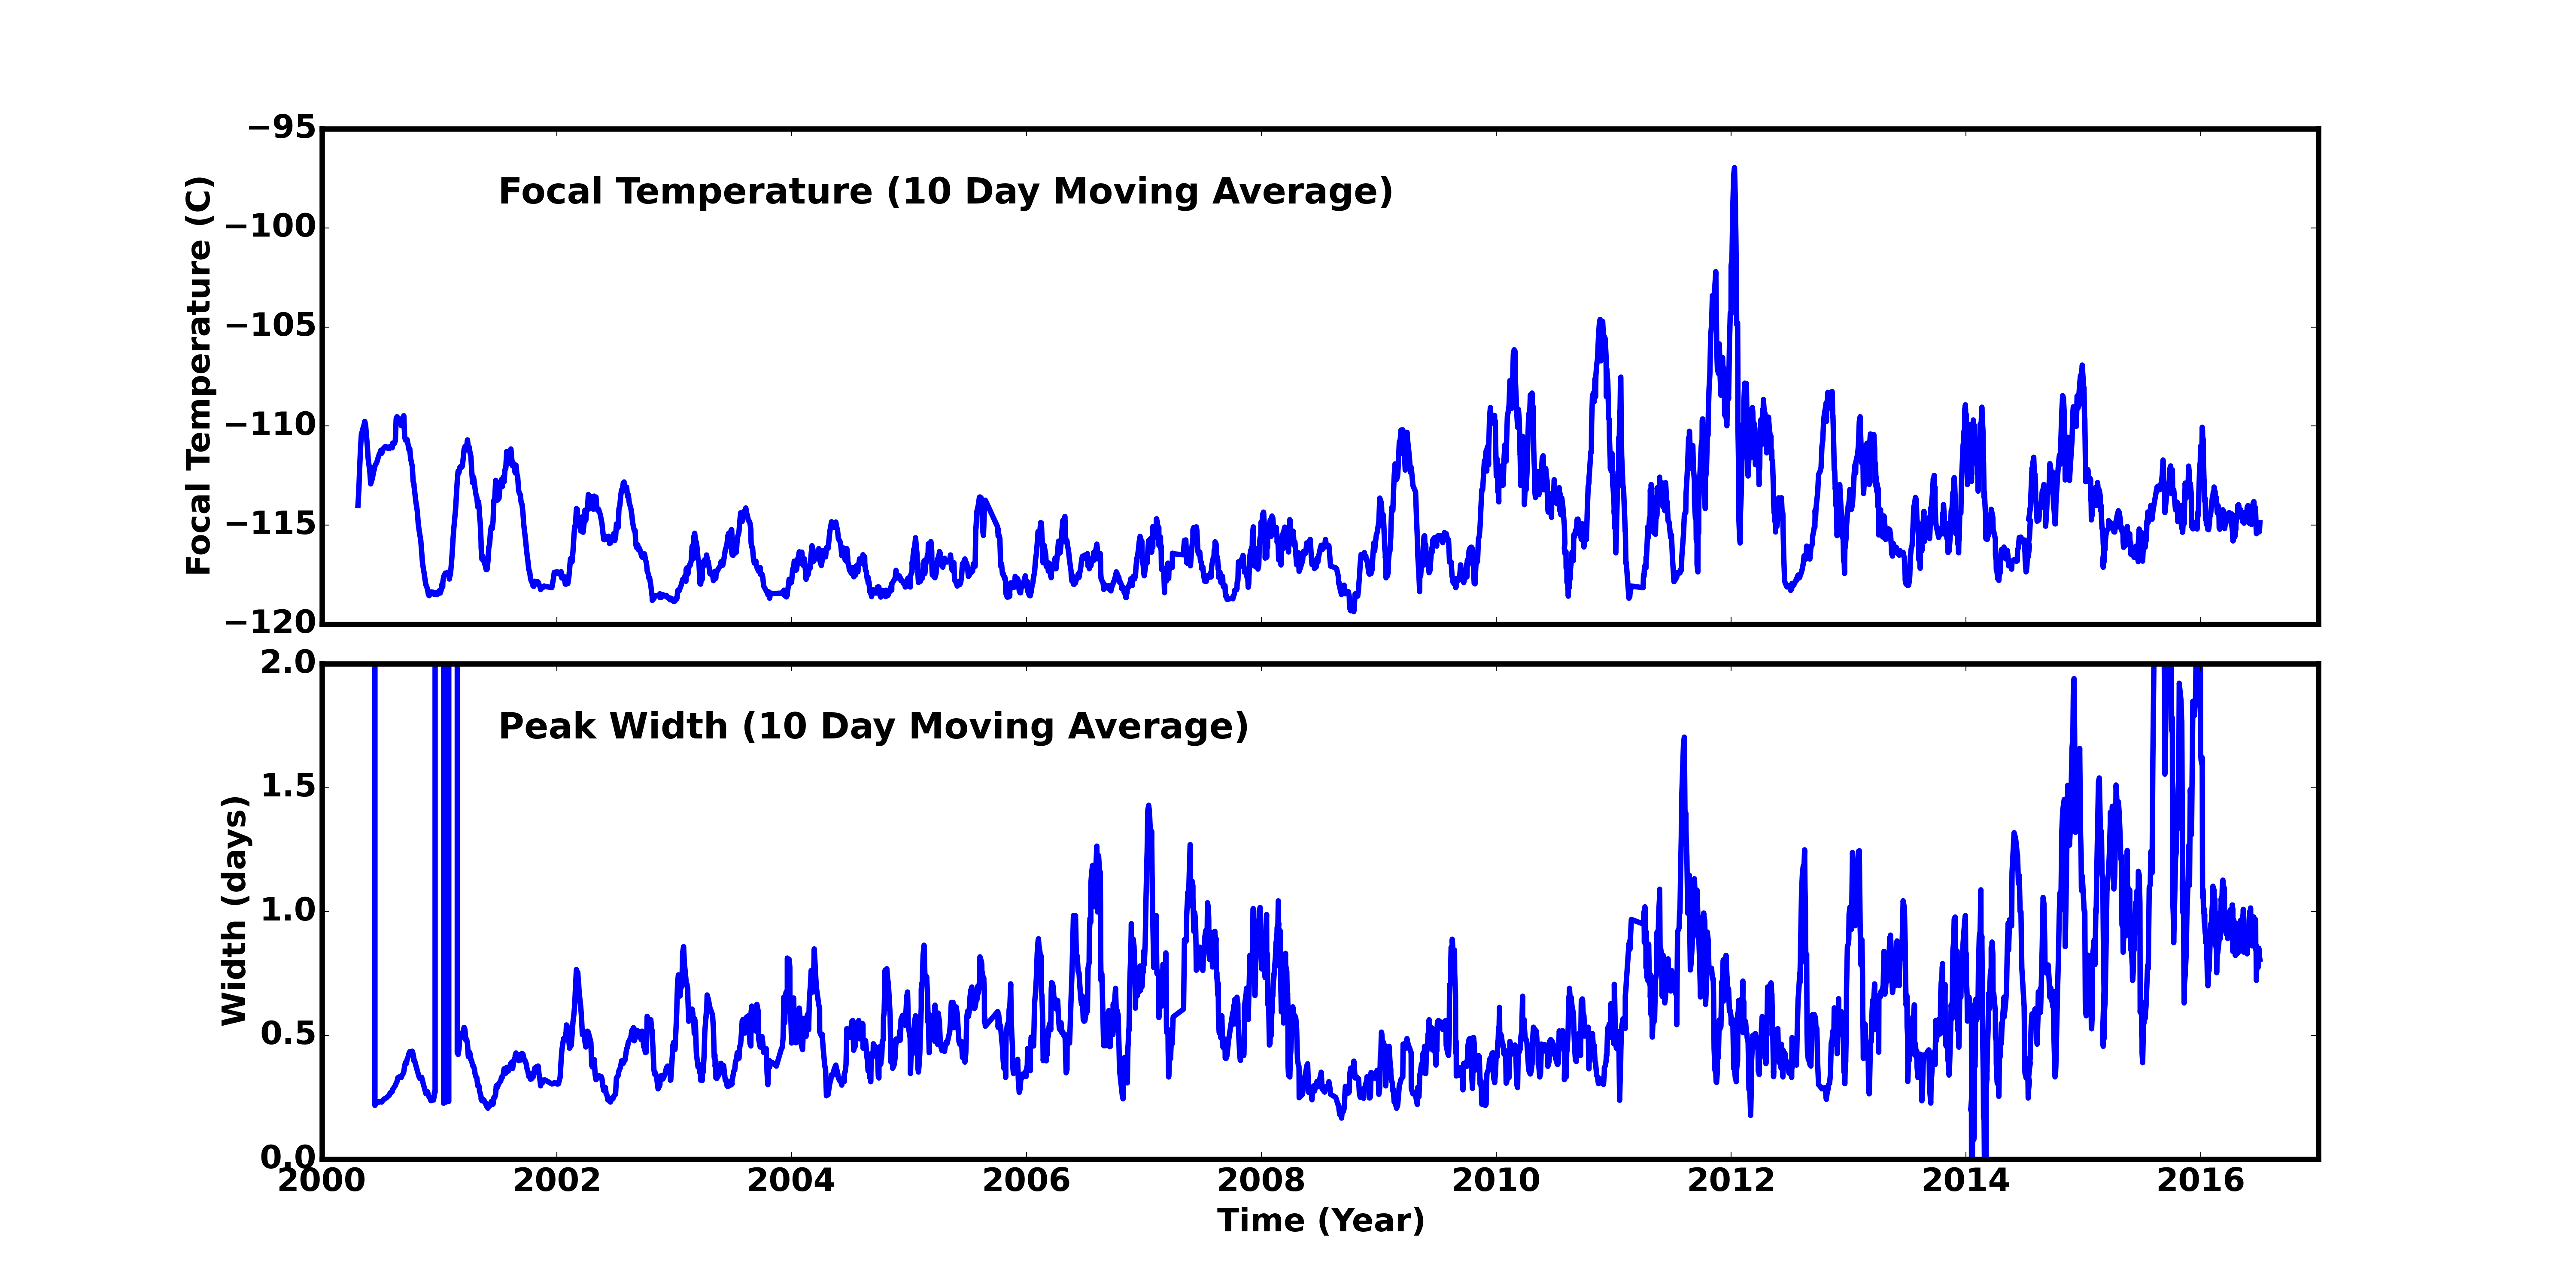
Focal Plane Temperature
Apr 2016 Focal Temperature
| The Mean (max) FPT: | |
|---|---|
| -114.52 | +/- 1.98 C |
| Mean Width: | |
| 0.86 | +/- 0.47 days |
Averaged Focal Plane Temperature
We are using 10 period moving averages to show trends of peak temperatures and peak widths. Note, the gaps in the width plot are due to missing/corrupted data.
Focal Plane Temperature, Sun Angle and Altitude
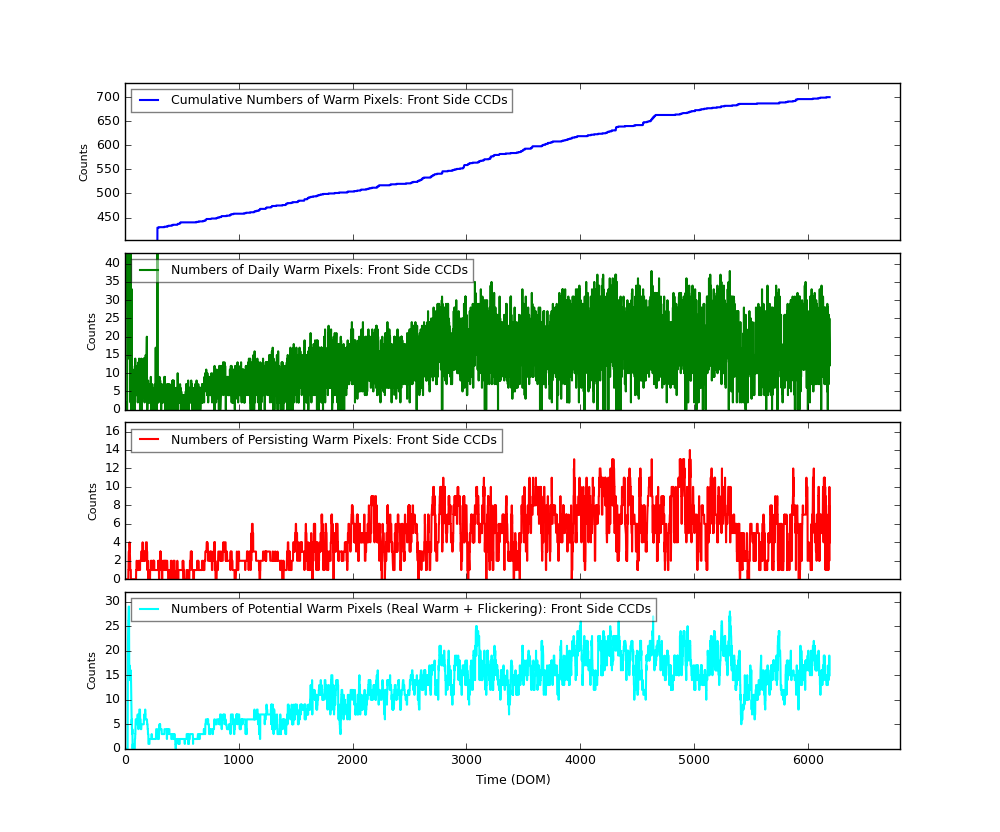
Bad Pixels
The plots below were generated with a new warm pixel finding script. Please see Acis Bad Pixel Page for details.
Front Side CCDs
Back Side CCD (CCD5)

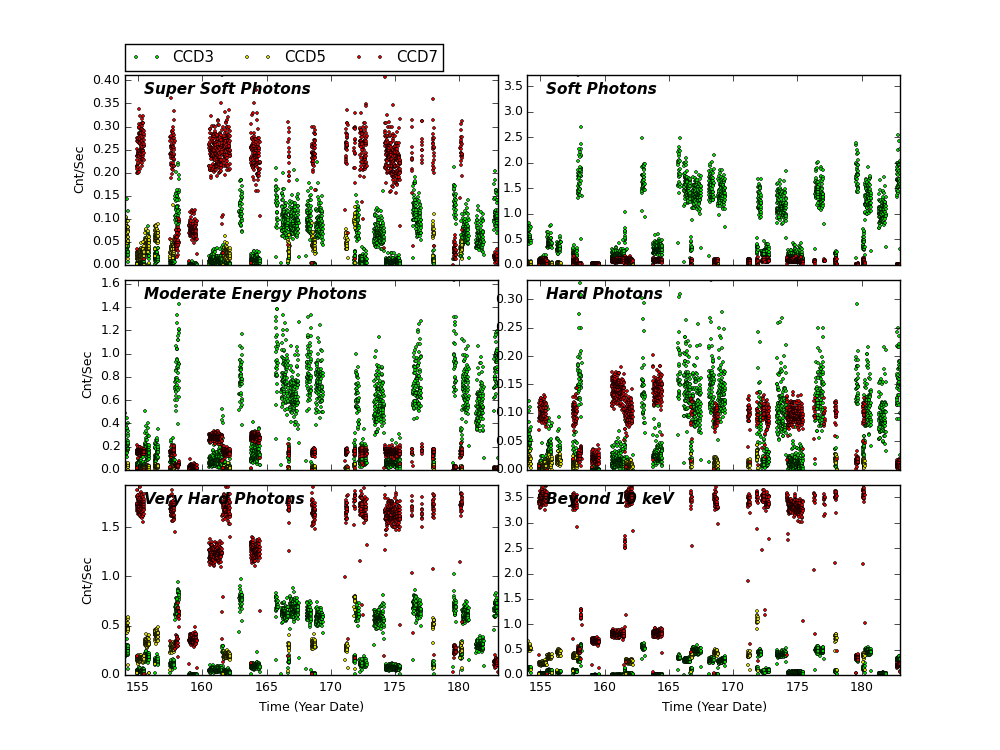
Science Instrument Background Rates
| Name | Low (keV) | High(KeV) | Description |
|---|---|---|---|
| SSoft | 0.00 | 0.50 | Super soft photons |
| Soft | 0.50 | 1.00 | Soft photons |
| Med | 1.00 | 3.00 | Moderate energy photons |
| Hard | 3.00 | 5.00 | Hard Photons |
| Harder | 5.00 | 10.00 | Very Hard photons |
| Hardest | 10.00 | Beyond 10 keV |
[an error occurred while processing this directive]
HRC
DOSE of Central 4K Pore-Pairs
Please refer to Maximum Dose Trends for more details.
)
|
|---|
        IMAGE                NPIX      MEAN    STDDEV      MIN       MAX
HRCI_06_2016.fits          16777216   0.040    0.1998      0.0        4.0
)
        IMAGE                NPIX      MEAN    STDDEV      MIN       MAX
HRCI_08_1999_05_2016.fits  16777216   4.460    4.997       0.0       292.0
No Data
)
        IMAGE                NPIX     MEAN      STDDEV      MIN      MAX
HRCS_08_1999_06_2016.fits  16777216  15.966     28.515      0.0      1700.0
|
|
Max dose trend plots corrected for events that "pile-up"
in the center of the taps due to bad position information.
|
)
|
)
|
)
|
)
|
| Mar 2016 | Dec 2015 | Sep 2015 | Jun 2015 |
|---|
)
|
)
|
)
|
)
|
| Mar 2016 | Dec 2015 | Sep 2015 | Jun 2015 |
|---|
Gratings
Focus
We plot the width of the zero order streak of ACIS/HETG observations and the width of the zero order image for HRC/LETG observations of point sources. No significant defocusing trend is seen at this time. See Gratings Focus pages.
-->
PCAD
ACA Trending
Fid Light Drift
Fid light positions on ACA drift with time. The drift trends of Fid light 2 with ACIS-I and ACIS-S configurations are shown below.
The top panel shows Fid light 2 drift in ACENT I (app. along with -Y axis), and the
bottom panel shows that in ACENT J (app. along with Z axis). The unit is a pixel, and
one pixel is approximately 0.5 arcsec. The slope listed at the top right corner is
the change in a position per year (arcsec/yr). The vertical line on DOM = 1411 (Jun 1, 2003)
indicates a transition date of use of IRU-1 to IRU-2.
See also Tom Aldcroft's updated page:
https://cxc.cfa.harvard.edu/mta/ASPECT/fid_drift
Fid 2 (ACIS-I)
Fid 2 (ACIS-S)
Fid 8 (HRC-I)
Fid 12 (HRC-S)
Gyro Bias Drift
Radiation History
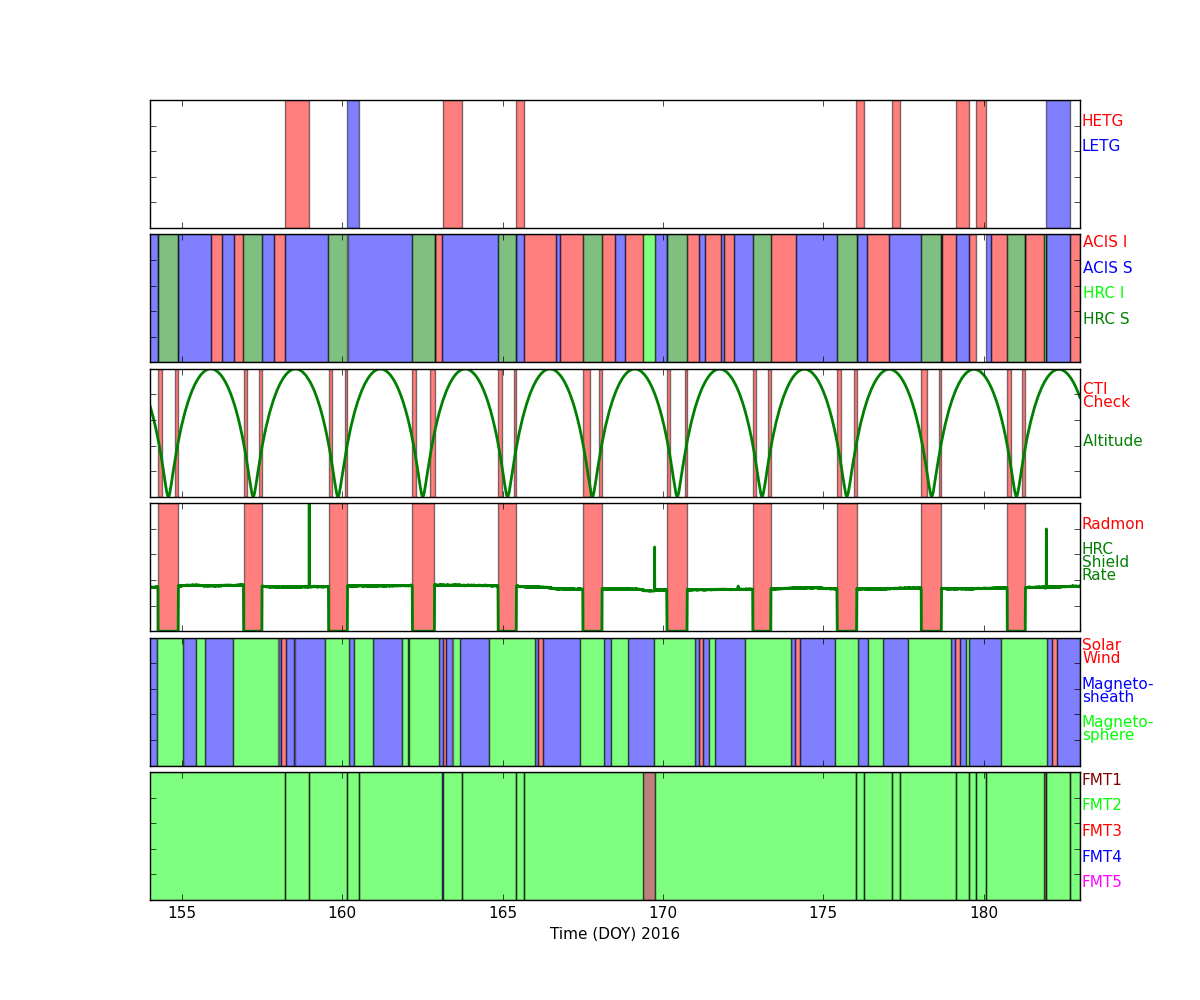
Radiation Zone Timing
Plotted below are radiation zone timing plots based on the following definitions of radiation zone:
- RADZONE - Ephin levels (in any of the E1300,P4GM,P41GM channels) are more than 1/3 of RADMON safing thresholds.
- RADMON - Radmon is disabled for radiation zone (as commanded based on OFLS model, for comparison with actual radiation levels).
- PERIGEE - Time of closest earth approach (for comparison)
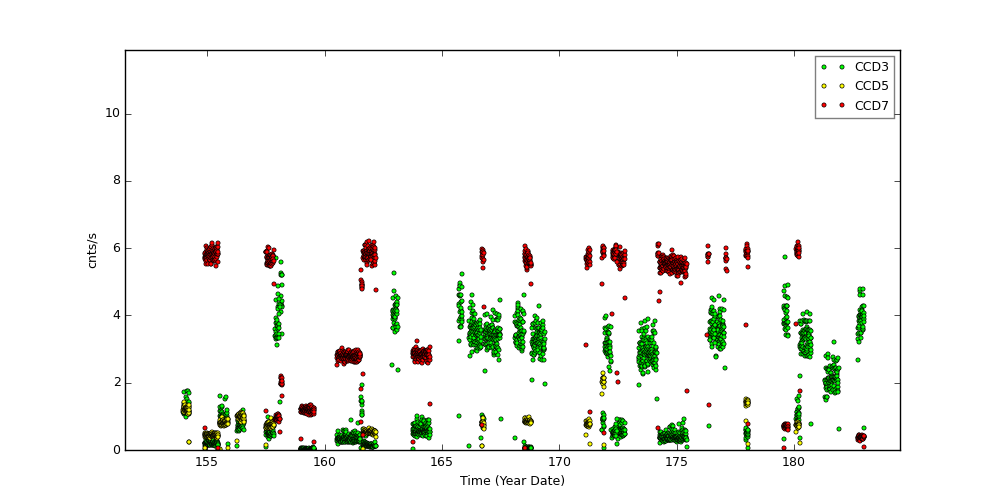
Radiation Count Rates of Jun 2016
Sun Spot History
Trending
Critical Trends
| ACIS Temperatures - Daily Maximums | ||||||
|---|---|---|---|---|---|---|
| MSID | MEAN | RMS | DELTA/YR | DELTA/YR/YR | UNITS | DESCRIPTION |
| 1PDEAAT | 305.27 | 8.74 | 7.247e-02 | -1.099e-01 | K | PSMC DEA PS A TEMP |
| 1PIN1AT | 292.65 | 8.54 | 5.572e-01 | 2.477e+00 | K | PSMC TEMP 1A |
)
)
| HRMA Computed Averages - Daily Maximums | ||||||
|---|---|---|---|---|---|---|
| MSID | MEAN | RMS | DELTA/YR | DELTA/YR/YR | UNITS | DESCRIPTION |
| OBAAVG | 293.21 | 0.60 | 7.245e+01 | 3.141e+01 | TEMP | OBA/TFTE |
)
| EPHIN Temperatures - Daily Maximums | ||||||
|---|---|---|---|---|---|---|
| TEIO | 330.27 | 20.26 | 3.214e+00 | -6.001e+00 | K | EPHIN ELECTRONICS HOUSING TEMP |
| TEPHIN | 334.05 | 6.33 | 9.142e-01 | -6.204e+00 | K | EPHIN SENSOR HOUSING TEMP |
)
)
| S/C Main Temperatures - Daily Maximums | ||||||
|---|---|---|---|---|---|---|
| MSID | MEAN | RMS | DELTA/YR | DELTA/YR/YR | UNITS | DESCRIPTION |
| TCYLFMZM | 306.92 | 25.35 | 8.239e-01 | 6.285e+00 | K | CNT CYL TEMP:-Z SIDE UNDER LAE-1 |
| TCYLFMZP | 308.87 | 24.08 | 7.780e-01 | 6.297e+00 | K | CNT CYL TEMP:-Z SIDE UNDER LAE-2 |
)
)
| S/C Ancillary Temperatures - Daily Maximums | ||||||
|---|---|---|---|---|---|---|
| MSID | MEAN | RMS | DELTA/YR | DELTA/YR/YR | UNITS | DESCRIPTION |
| TFSSBKT1 | 341.61 | 20.18 | -4.115e-01 | 2.838e+00 | K | FSS BRACKET-1 TEMP (+Y) |
| TFSSBKT2 | 336.96 | 26.55 | -6.752e-01 | 4.340e-02 | K | FSS BRACKET-2 TEMP (+Y) |
| TSCTSF1 | 303.61 | 3.45 | 1.673e+00 | -3.415e+00 | K | SC-TS FITTING -1 TEMP |
| TSCTSF6 | 305.63 | 3.91 | 1.756e+00 | -2.077e+00 | K | SC-TS FITTING -6 TEMP |
)
)
)
)
| MUPS - Daily Maximums | ||||||
|---|---|---|---|---|---|---|
| MSID | MEAN | RMS | DELTA/YR | DELTA/YR/YR | UNITS | DESCRIPTION |
| PM1THV1T | 333.47 | 8.23 | -2.762e-01 | -1.892e+02 | K | MUPS 1 THRUSTER VALVE 01 TEMP |
| PLINE02T | 317.64 | 11.13 | 3.347e+00 | 5.826e+00 | K | PROP LINE TEMP 02 |
| PLINE03T | 316.64 | 13.64 | 3.278e+00 | 7.846e+00 | K | PROP LINE TEMP 03 |
| PLINE04T | 302.24 | 12.73 | 3.233e+00 | 7.055e+00 | K | PROP LINE TEMP 04 |
)
)
)
)
Quarterly Trends
- PCAD Temperature
| Previous Quarter | ||||||
| MSID | MEAN | RMS | DELTA/YR | DELTA/YR/YR | UNITS | DESCRIPTION |
| AACCCDPT | 258.51 | 0.79 | -1.907e+00 | -1.026e+00 | K | AC CCD TEMP (PRI) |
| AACCCDRT | 302.22 | 0.90 | -2.191e+00 | -1.238e-01 | K | AC CCD TEMP (RDNT) |
| AACH1T | 299.36 | 0.89 | -2.091e+00 | 2.867e+00 | K | AC HOUSING TEMP (ACH1) |
| AACH2T | 299.42 | 0.90 | -2.080e+00 | 4.627e-01 | K | AC HOUSING TEMP (ACH2) |
)
)
)
)
- PCAD FTS Temp & Gradient
| Previous Quarter | ||||||
| MSID | MEAN | RMS | DELTA/YR | DELTA/YR/YR | UNITS | DESCRIPTION |
| OHRTHR27 | 297.15 | 4.494e-03 | 1.790e-02 | 1.237e-01 | K | RT 20 : PERISCOPE |
| OHRTHR42 | 294.64 | 5.660e-02 | -1.599e-01 | -7.143e-01 | K | RT 133: PERISCOPE |
| OHRTHR43 | 294.65 | 0.15 | -3.879e-01 | -2.637e-01 | K | RT 134: PERISCOPE |
| OOBAGRD3 | -0.08 | 9.590e-02 | 2.275e-01 | -2.651e-01 | K | RT 505 TO RT 504: PERISCOPE GRADIENT |
| OOBAGRD6 | 0.08 | 2.761e-03 | -6.176e-03 | 1.246e-02 | K | RT 507 TO RT 506: PERISCOPE GRADIENT |
)
)
)
)
)
- SIM Temperature
| Previous Quarter | ||||||
| MSID | MEAN | RMS | DELTA/YR | DELTA/YR/YR | UNITS | DESCRIPTION |
| 3TSMXCET | 243.66 | 3.534e+01 | -5.257e+01 | 1.341e-11 | K | -X TURTLE SHELL NR HRC CEA |
| 3TSMXSPT | 284.23 | 3.180e+01 | -5.015e+01 | 1.020e-11 | K | -X TURTLE SHELL NR ACIS SS |
| BOXTEMP | 282.21 | 1.28 | 2.643e+00 | 1.591e-12 | K | SEA box temperature (3FASEAAT) |
| PSUTEMP | 311.41 | 1.05 | 3.465e+00 | 2.150e-12 | K | SEA power supply temperature (3FAPSAT) |
)
)
)
)
Envelope Trending
ACIS Electronics Side A
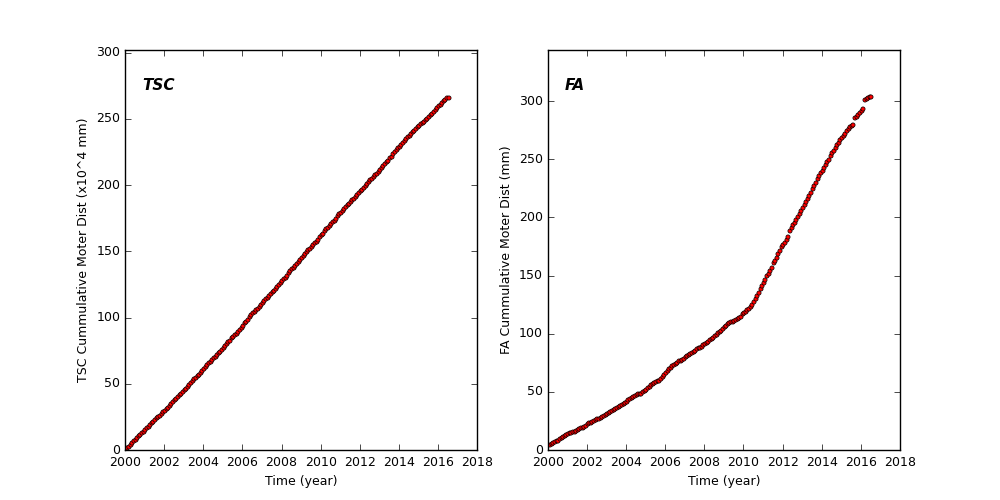
Spacecraft Motions
TSC and FA Cummulative Moter Distance
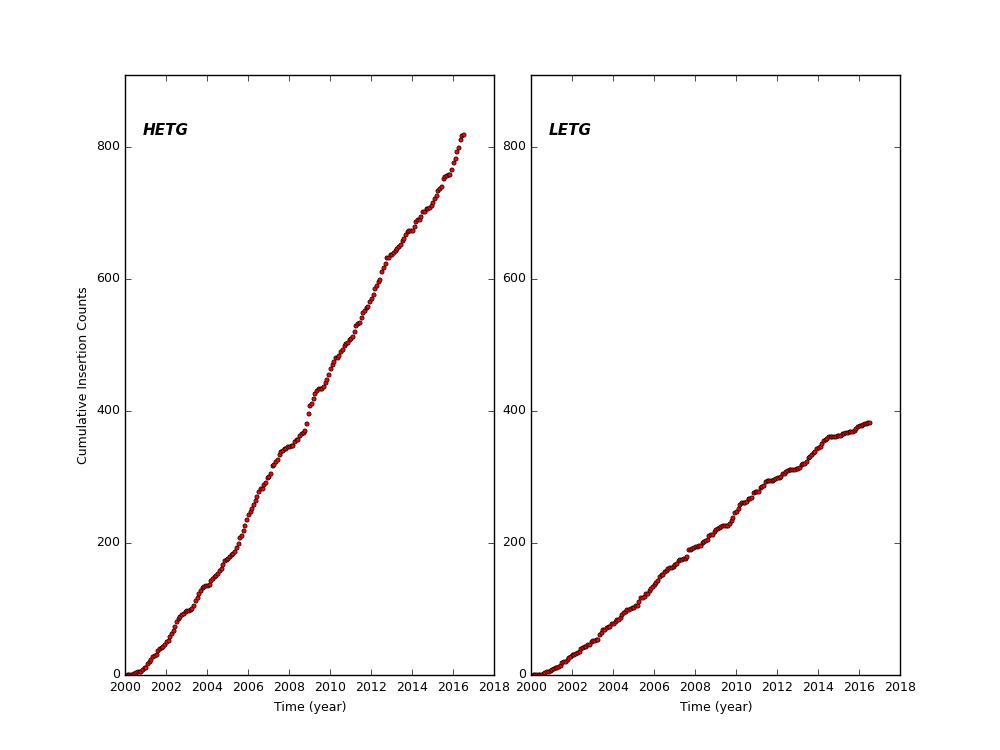
HETG and LETG Cummulative Insertion Counts
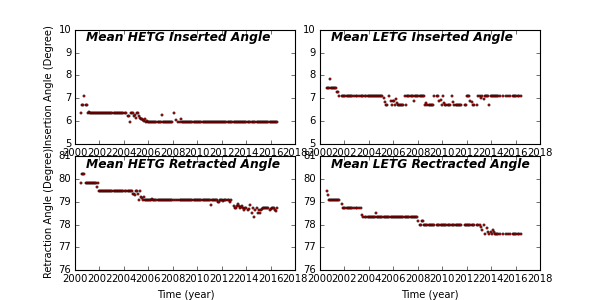
HETG/LETG Insertion/Retraction Angle
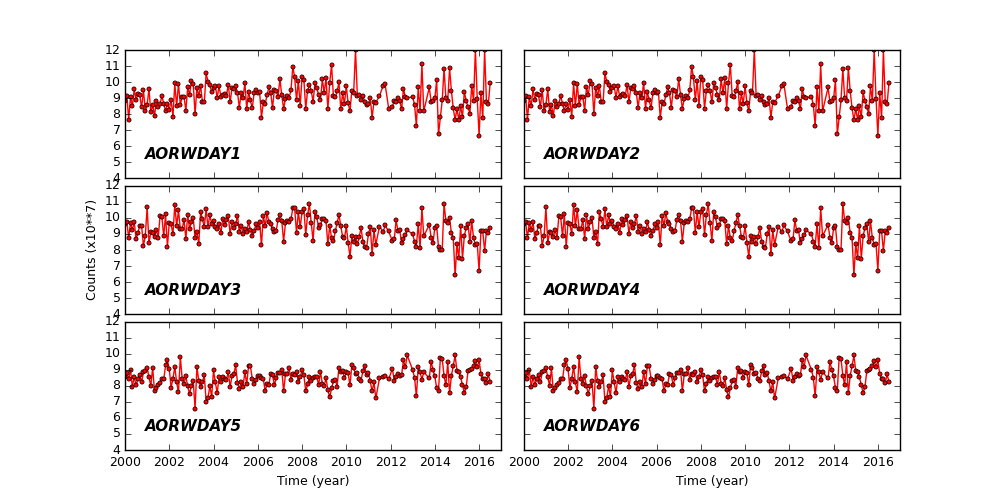
Reaction Wheel Rotations
Links to Past Monthly Reports
| Year | Month | |||||||||||
|---|---|---|---|---|---|---|---|---|---|---|---|---|
| 2016 | Jan | Feb | Mar | Apr | May | |||||||
| 2015 | Jan | Feb | Mar | Apr | May | Jun | Jul | Aug | Sep | Oct | Nov | Dec |
| 2014 | Jan | Feb | Mar | Apr | May | Jun | Jul | Aug | Sep | Oct | Nov | Dec |
| 2013 | Jan | Feb | Mar | Apr | May | Jun | Jul | Aug | Sep | Oct | Nov | Dec |
| 2012 | Jan | Feb | Mar | Apr | May | Jun | Jul | Aug | Sep | Oct | Nov | Dec |
| 2011 | Jan | Feb | Mar | Apr | May | Jun | Jul | Aug | Sep | Oct | Nov | Dec |
| 2010 | Jan | Feb | Mar | Apr | May | Jun | Jul | Aug | Sep | Oct | Nov | Dec |
| 2009 | Jan | Feb | Mar | Apr | May | Jun | Jul | Aug | Sep | Oct | Nov | Dec |
| 2008 | Jan | Feb | Mar | Apr | May | Jun | Jul | Aug | Sep | Oct | Nov | Dec |
| 2007 | Jan | Feb | Mar | Apr | May | Jun | Jul | Aug | Sep | Oct | Nov | Dec |
| 2006 | Jan | Feb | Mar | Apr | May | Jun | Jul | Aug | Sep | Oct | Nov | Dec |
| 2005 | Jan | Feb | Mar | Apr | May | Jun | Jul | Aug | Sep | Oct | Nov | Dec |
| 2004 | Jan | Feb | Mar | Apr | May | Jun | Jul | Aug | Sep | Oct | Nov | Dec |
| 2003 | Jan | Feb | Mar | Apr | May | Jun | Jul | Aug | Sep | Oct | Nov | Dec |
| 2002 | Jan | Feb | Mar | Apr | May | Jun | Jul | Aug | Sep | Oct | Nov | Dec |
| 2001 | Jan | Feb | Mar | Apr | May | Jun | Jul | Aug | Sep | Oct | Nov | Dec |
| 2000 | Jan | Feb | Mar | Apr | May | Jun | Jul | Aug | Sep | Oct | Nov | Dec |
| 1999 | Jul | Aug | Sep | Oct | Nov | Dec | ||||||