ACIS
ACIS DOSE Registered-Photon-Map
The steps we took to compute the dose map are;
- Level 1 Event files for a specified month are obtained from archive.
- Image data including I2, I3, S2, S3 CCDs are extracted from all event files.
- All the extracted image data were merged to create a month long exposure map for the month.
- The exposure map is opened with ds9, and check a distribution of count rates against energy. From this, estimate the upper threshold value. Any events beyond this upper threshold are assumed erroneous events such as bad pixels.
- Using this upper threshold, the data is filtered, and create a cleaned exposure map for the month.
- The exposure map from each month from the Sep 1999 is added up to create a cumulative exposure map for each month.
- Using fimgstatistic, we compute count rate statistics for each CCDs.
- For observations with high data drop rates (e.g., Crab nebula, Cas A), we corrected the observations by adding events.
Please check more detail plots at Telemetered Photon Dose Trend page.
)
)
)
Statistics:
# IMAGE     NPIX     MEAN        RMS        MIN     MAX

ACIS_jul16 6004901   6.397       11.598     0.0     3684

I2 node 0  262654   7.570328    10.775462   0.0    1632.0
I2 node 1  262654   7.878941    11.274074   0.0    1740.0
I2 node 2  262654   8.024580    10.097733   0.0    1148.0
I2 node 3  262654   8.060456    14.365418   0.0    3684.0

I3 node 0  262654   9.856386    10.540319   0.0    1011.0
I3 node 1  262654   8.632518    13.816220   0.0    2341.0
I3 node 2  262654   7.674910     9.443789   0.0    1183.0
I3 node 3  262654   7.652065     9.937743   0.0    1070.0

S2 node 0  262654   6.733433     4.605916   0.0     501.0
S2 node 1  262654   7.034563     5.008057   0.0     545.0
S2 node 2  262654   7.665074     5.742624   0.0     617.0
S2 node 3  262654   7.631537     5.113672   0.0     501.0

S3 node 0  262654   10.687063   11.007259   0.0     306.0
S3 node 1  262654   11.111687    8.704308   0.0     512.0
S3 node 2  262654    9.918957    7.411449   0.0     190.0
S3 node 3  262654    8.833236    6.348774   0.0     211.0
)
)
)
Statistics:
 IMAGE     NPIX      MEAN        RMS           MIN      MAX

ACIS_total 6004901   2024.790   2640.391       0.0     115883

I2 node 0  262654   1727.336645  333.332084   353.0    9427.0
I2 node 1  262654   1819.223954  460.108387   371.0   51338.0
I2 node 2  262654      8.024580   10.097733     0.0    1148.0
I2 node 3  262654   1850.356494  468.838043   356.0   28251.0

I3 node 0  262654   1952.552224  470.361836   350.0    7611.0
I3 node 1  262654   2042.098157 1550.044206   353.0   38618.0
I3 node 2  262654   1787.158909  323.684180   340.0    9648.0
I3 node 3  262654      7.652065    9.937743     0.0    1070.0

S2 node 0  262654   2362.660183  345.560484  1269.0   21448.0
S2 node 1  262654      7.034563    5.008057     0.0     545.0
S2 node 2  262654   2769.067291  528.064802  1679.0   27383.0
S2 node 3  262654   2704.931068  382.117188  1577.0   47549.0

S3 node 0  262654   4200.795787 1862.679650  1741.0   13896.0
S3 node 1  262654   5389.921211 2145.219917     0.0   14355.0
S3 node 2  262654   4161.880304 1050.066081  1732.0   10020.0
S3 node 3  262654   3221.851864  486.907474  1848.0   10853.0
)
|
)
|
)
|
)
|
| Apr 2016 | Jan 2016 | Oct 2015 | Jul 2015 |
|---|
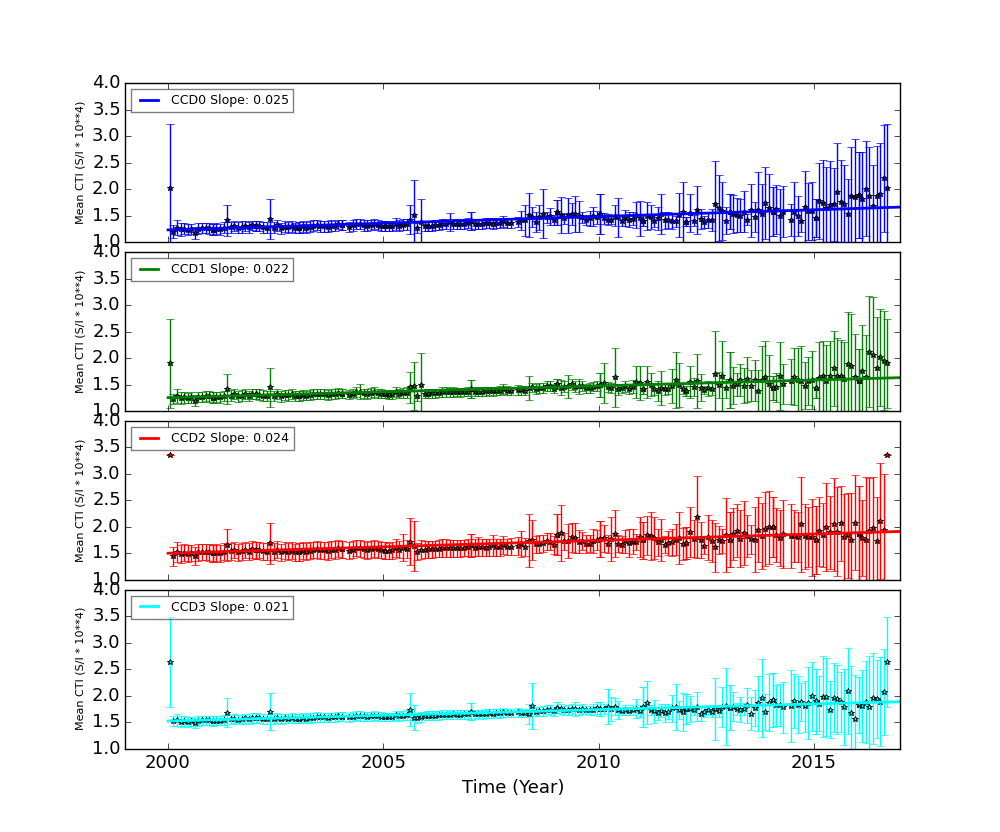
The Mean Detrended CTI
We report CTIs with a refined data definition. CTIs were computed for the temperature dependency corrected data. Please see CTI page for detailed explanation. CTI's are computed for Mn K alpha, and defined as slope/intercept x10^4 of row # vs ADU. Data file: here
Imaging CCDs
Spectral CCDs
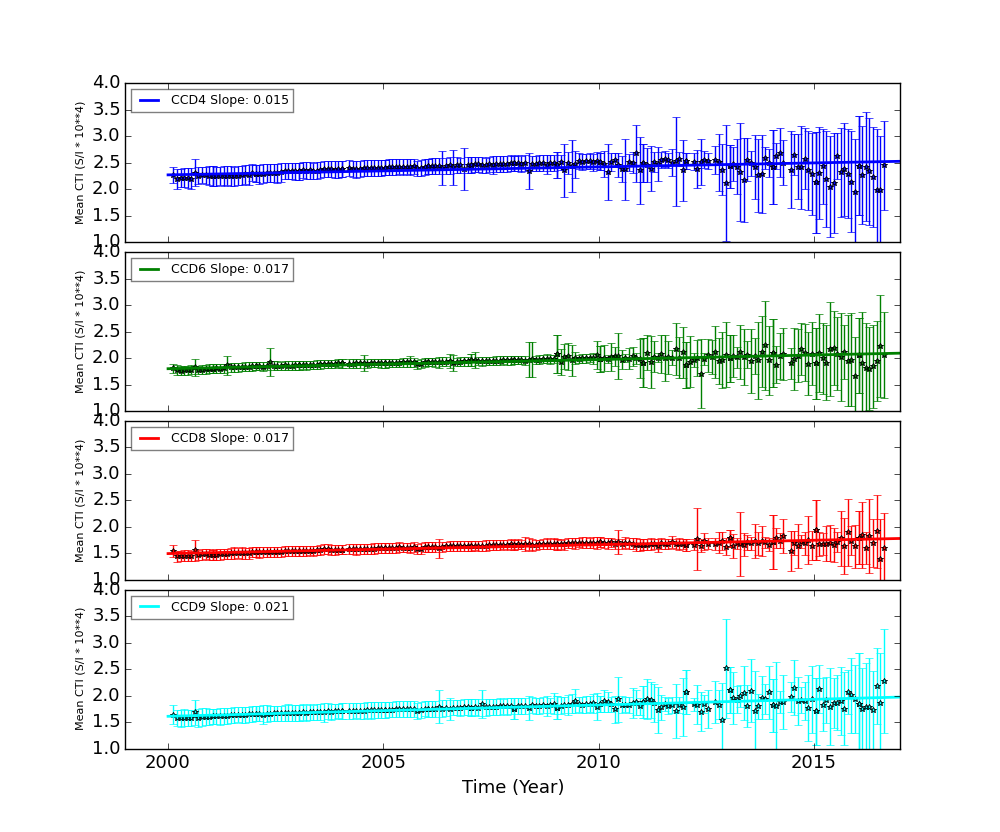
Backside CCDs

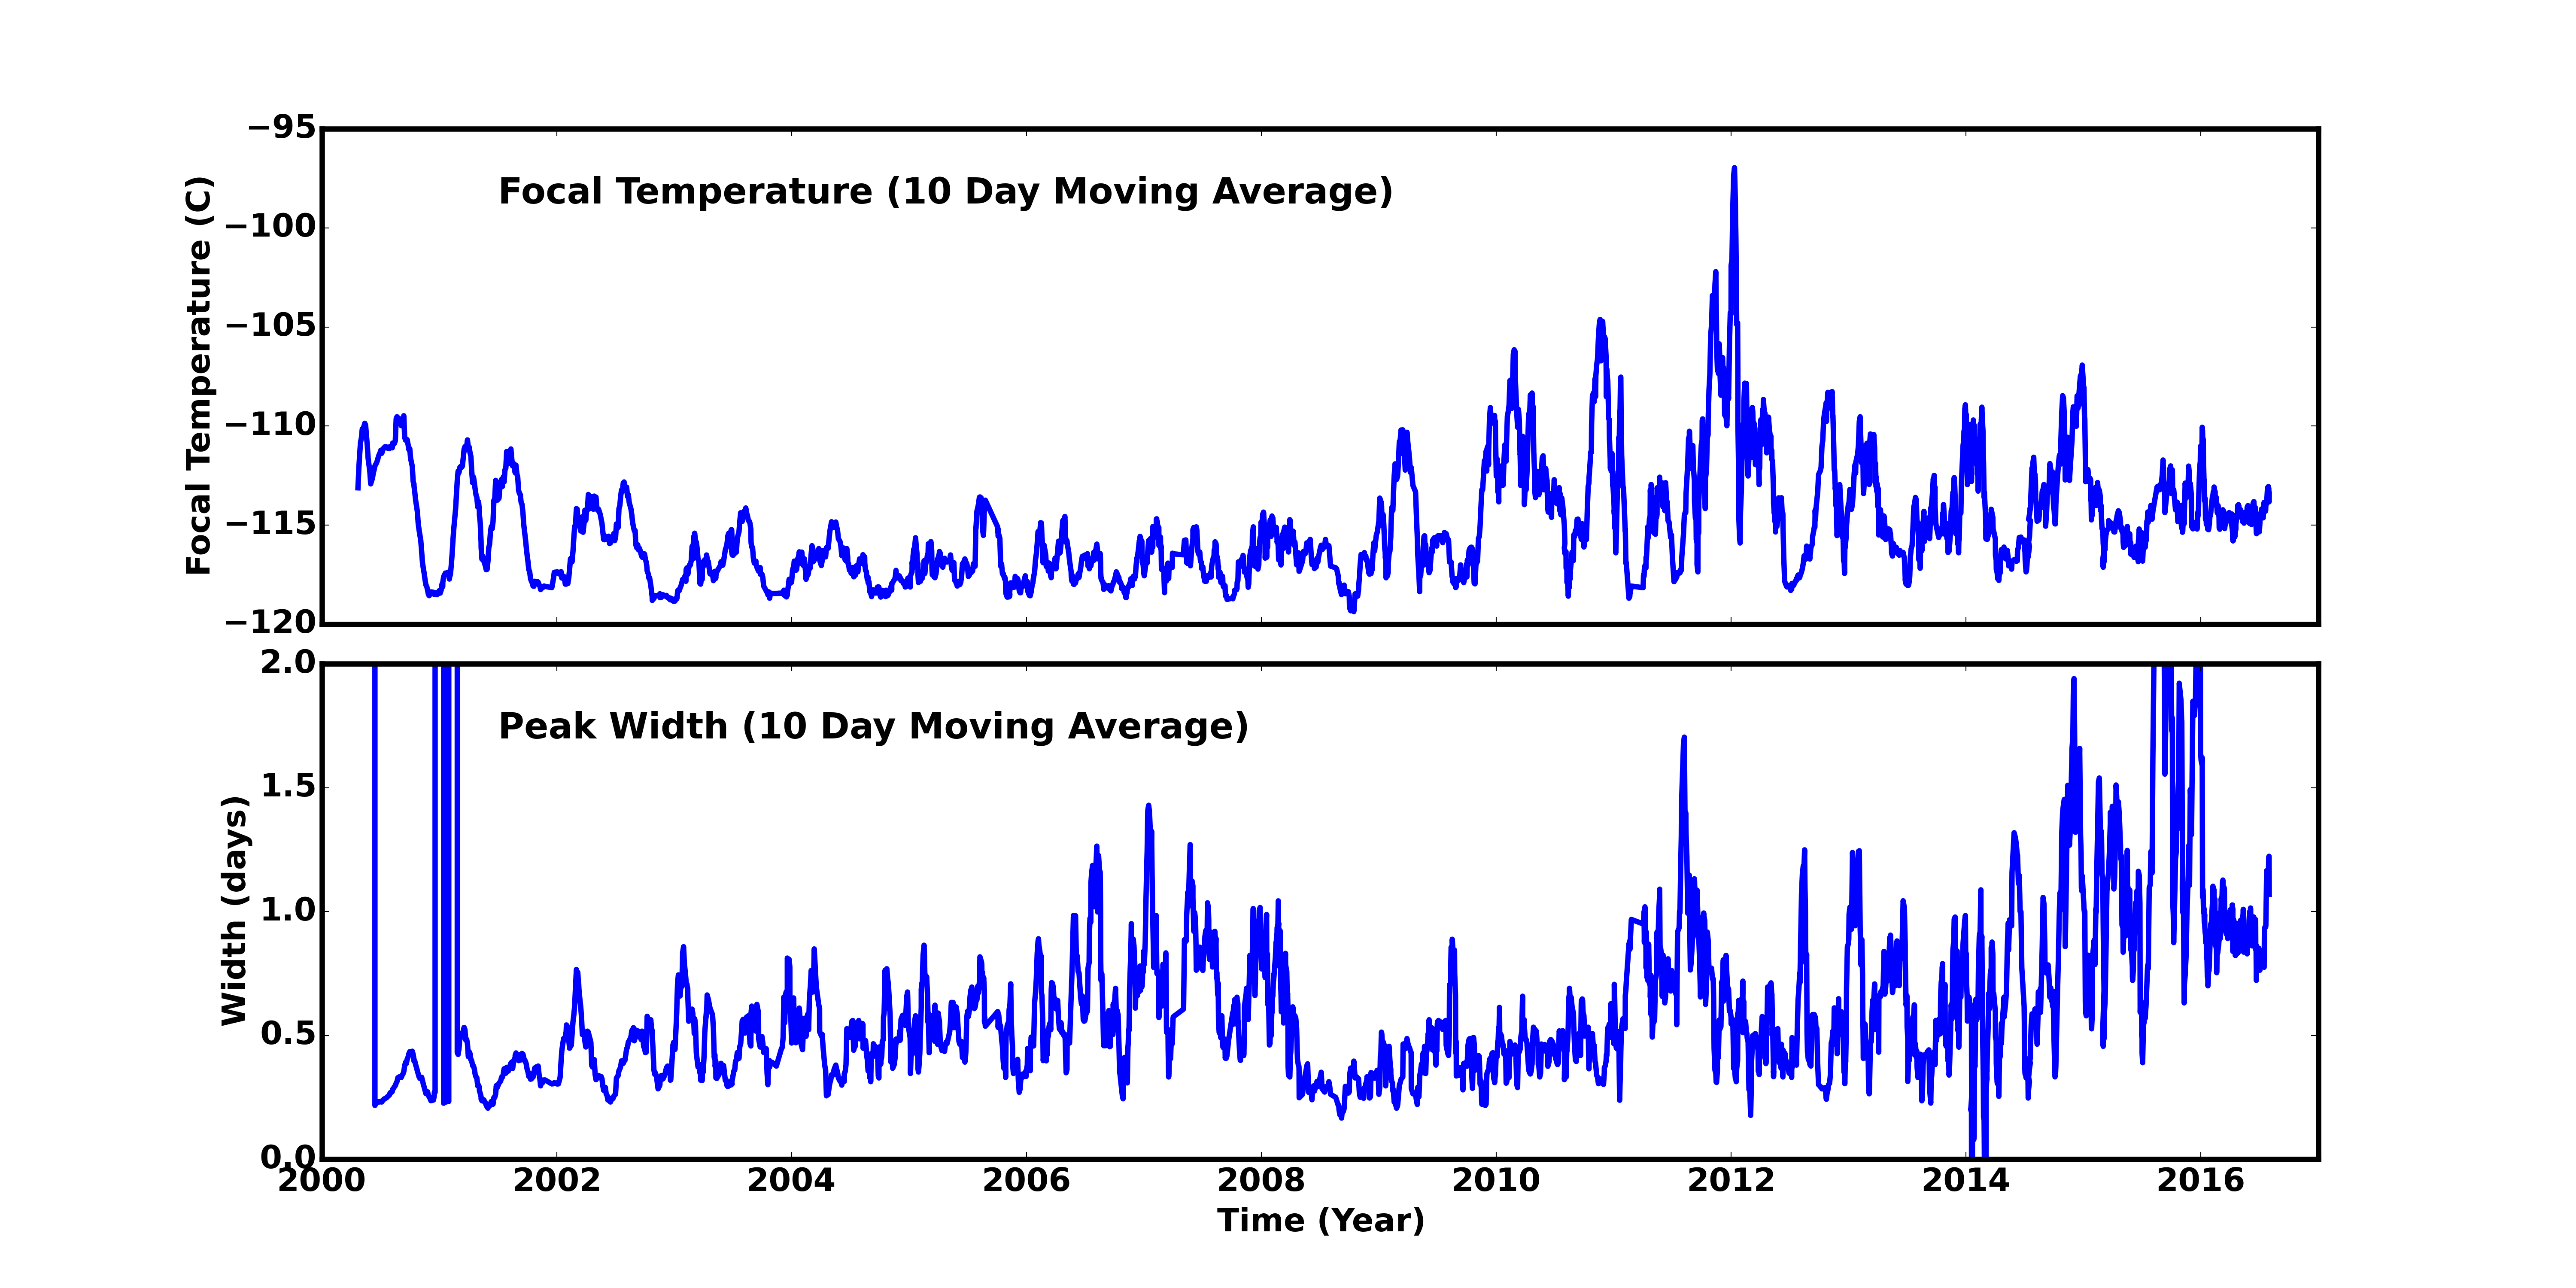
Focal Plane Temperature
Jul 2016 Focal Temperature
| The Mean (max) FPT: | |
|---|---|
| -113.89 | +/- 2.67 C |
| Mean Width: | |
| 1.00 | +/- 0.63 days |
Averaged Focal Plane Temperature
We are using 10 period moving averages to show trends of peak temperatures and peak widths. Note, the gaps in the width plot are due to missing/corrupted data.
Focal Plane Temperature, Sun Angle and Altitude
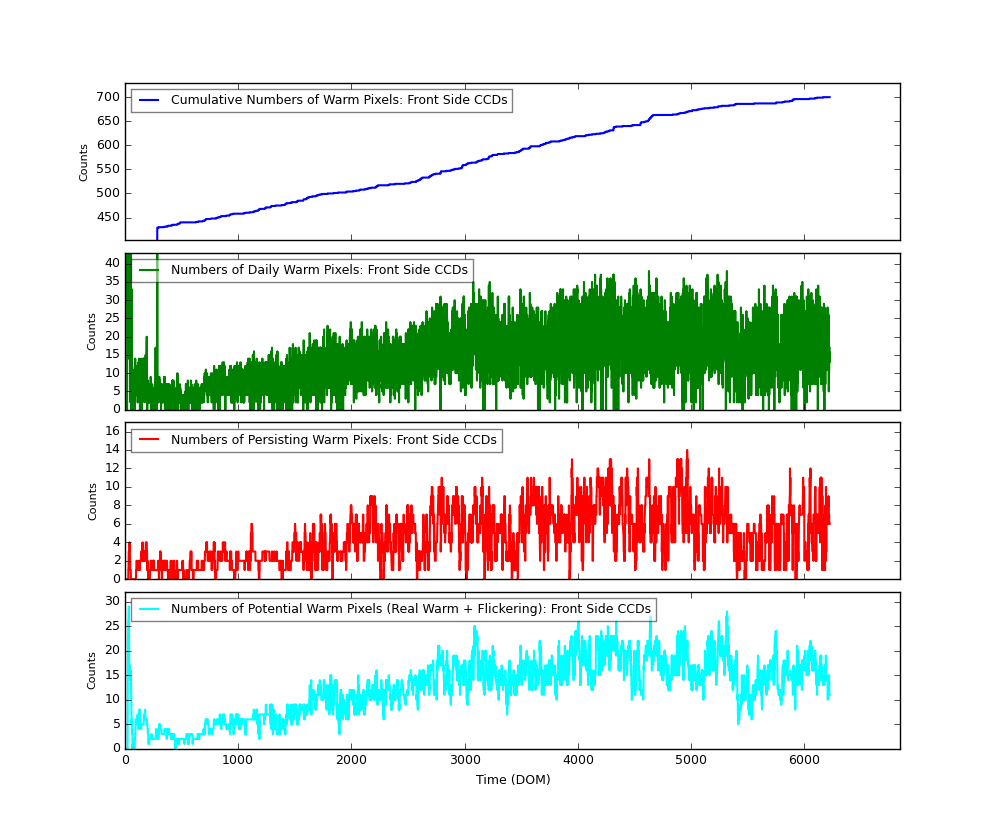
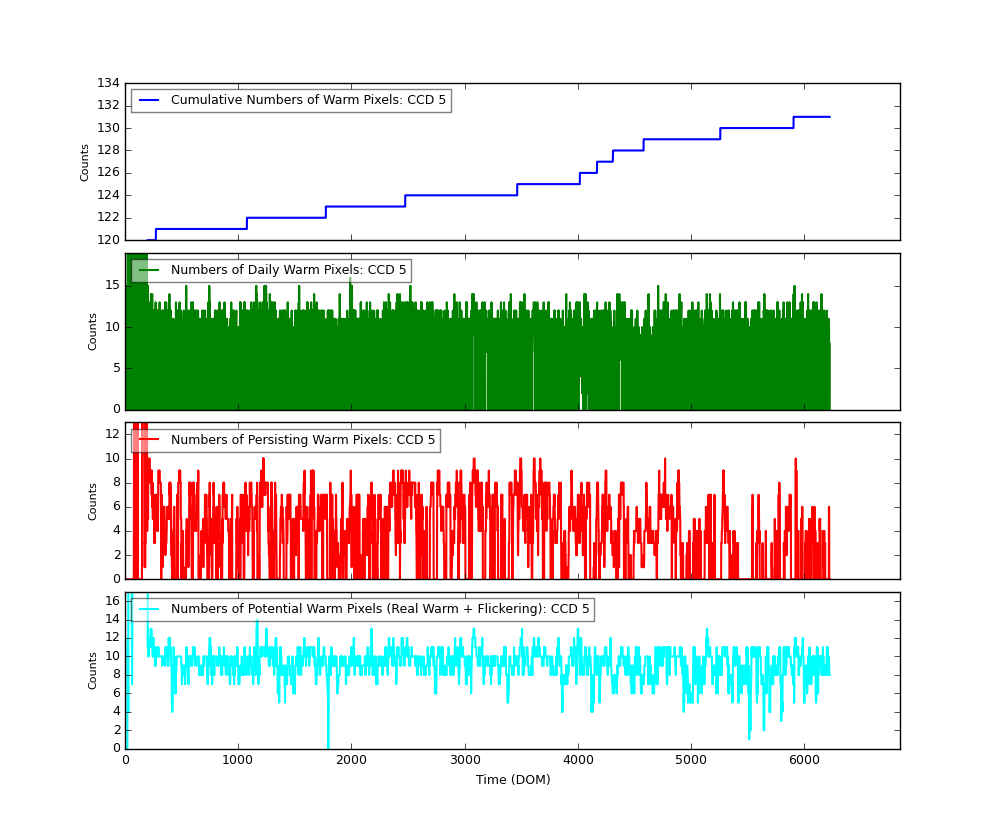
Bad Pixels
The plots below were generated with a new warm pixel finding script. Please see Acis Bad Pixel Page for details.
Front Side CCDs
Back Side CCD (CCD5)
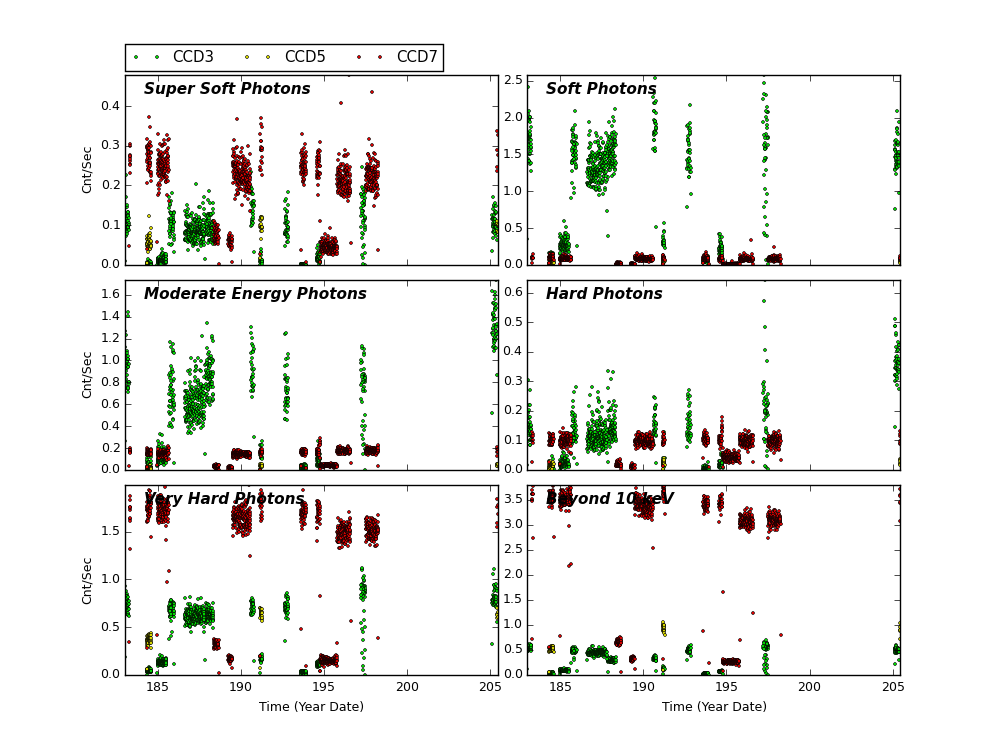
Science Instrument Background Rates
| Name | Low (keV) | High(KeV) | Description |
|---|---|---|---|
| SSoft | 0.00 | 0.50 | Super soft photons |
| Soft | 0.50 | 1.00 | Soft photons |
| Med | 1.00 | 3.00 | Moderate energy photons |
| Hard | 3.00 | 5.00 | Hard Photons |
| Harder | 5.00 | 10.00 | Very Hard photons |
| Hardest | 10.00 | Beyond 10 keV |
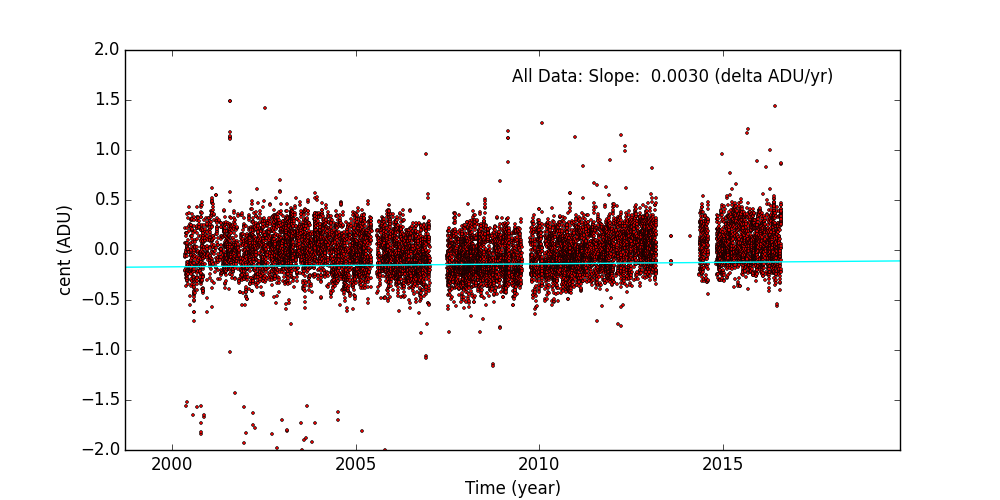
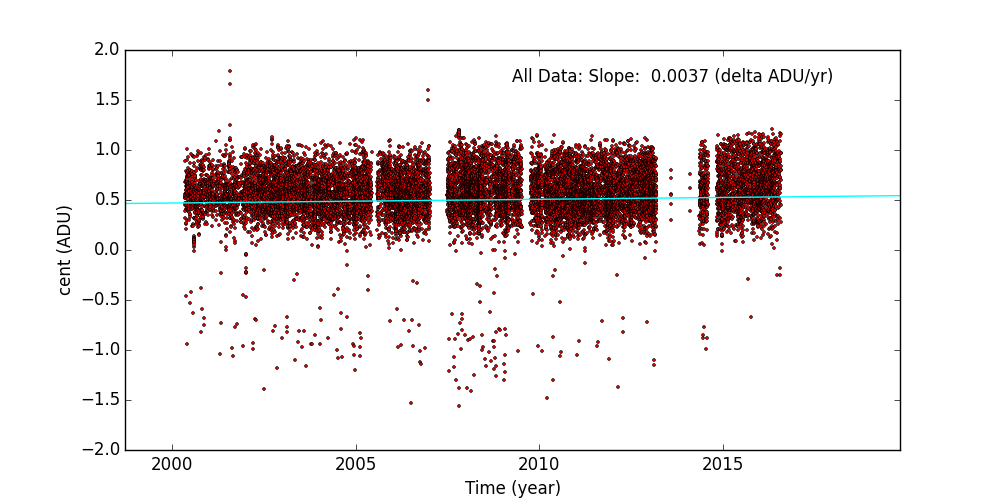
ACIS Corner Pixels
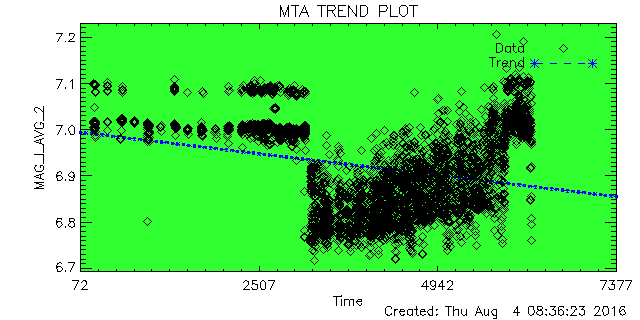
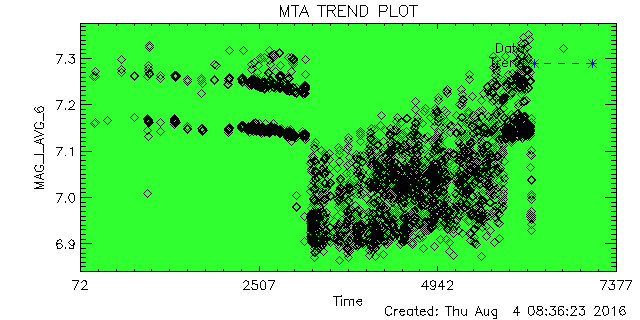
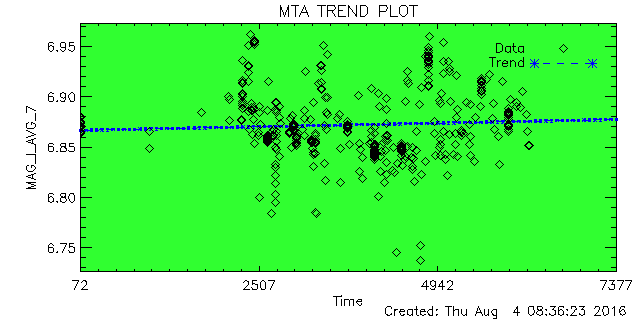
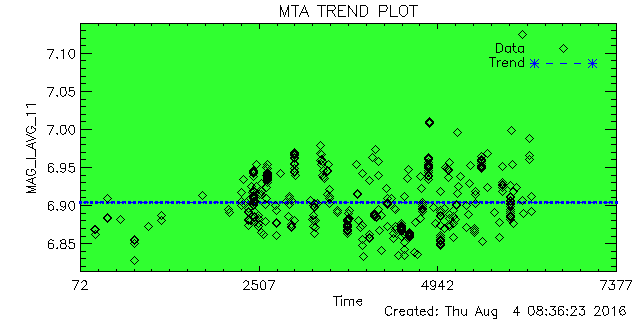
We plot the average corner pixel centroid slope and mean for ACIS observations. Separate plots are shown for FAINT MODE (3X3) and VFAINT MODE (5X5) observations. Metric is the centroid of a Gaussian fit to the histogram of corner pixel PHA values of detected events. Plus signs are FAINT observations, diamonds are VFAINT observations, and boxes are VFAINT observations with centroids computed using only the corner pixels of a 3X3 event island (referred to as AFAINT). We see a very small upward trend.
CCD: I3
CCD: S3
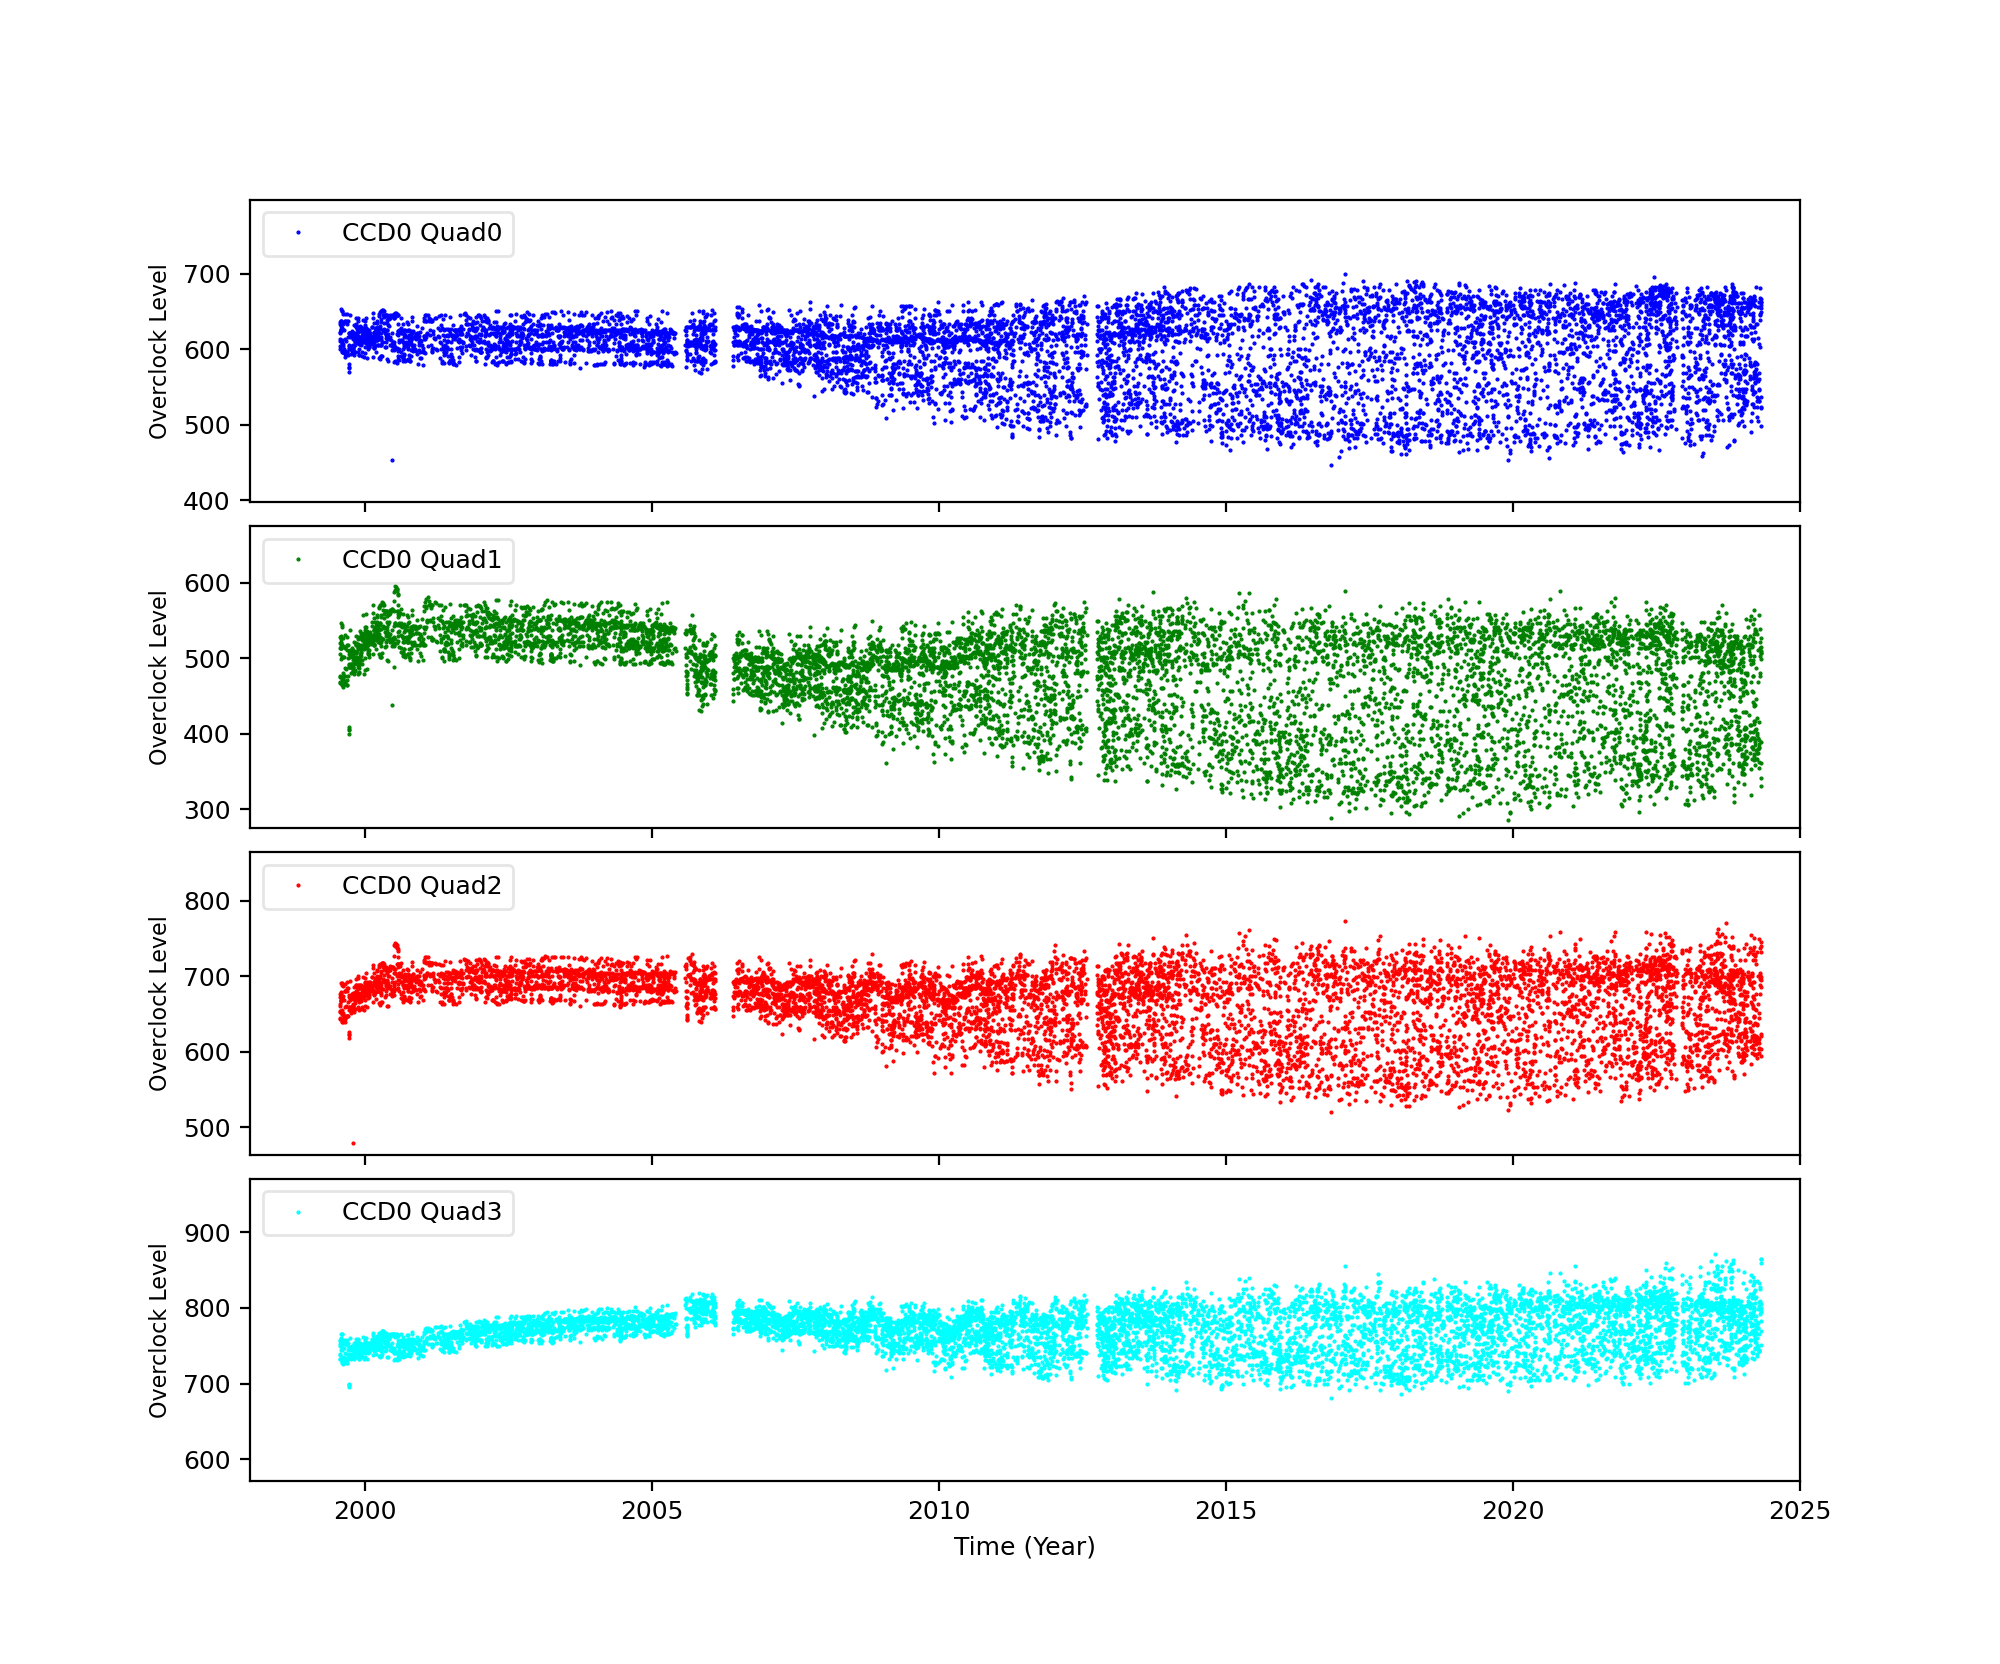
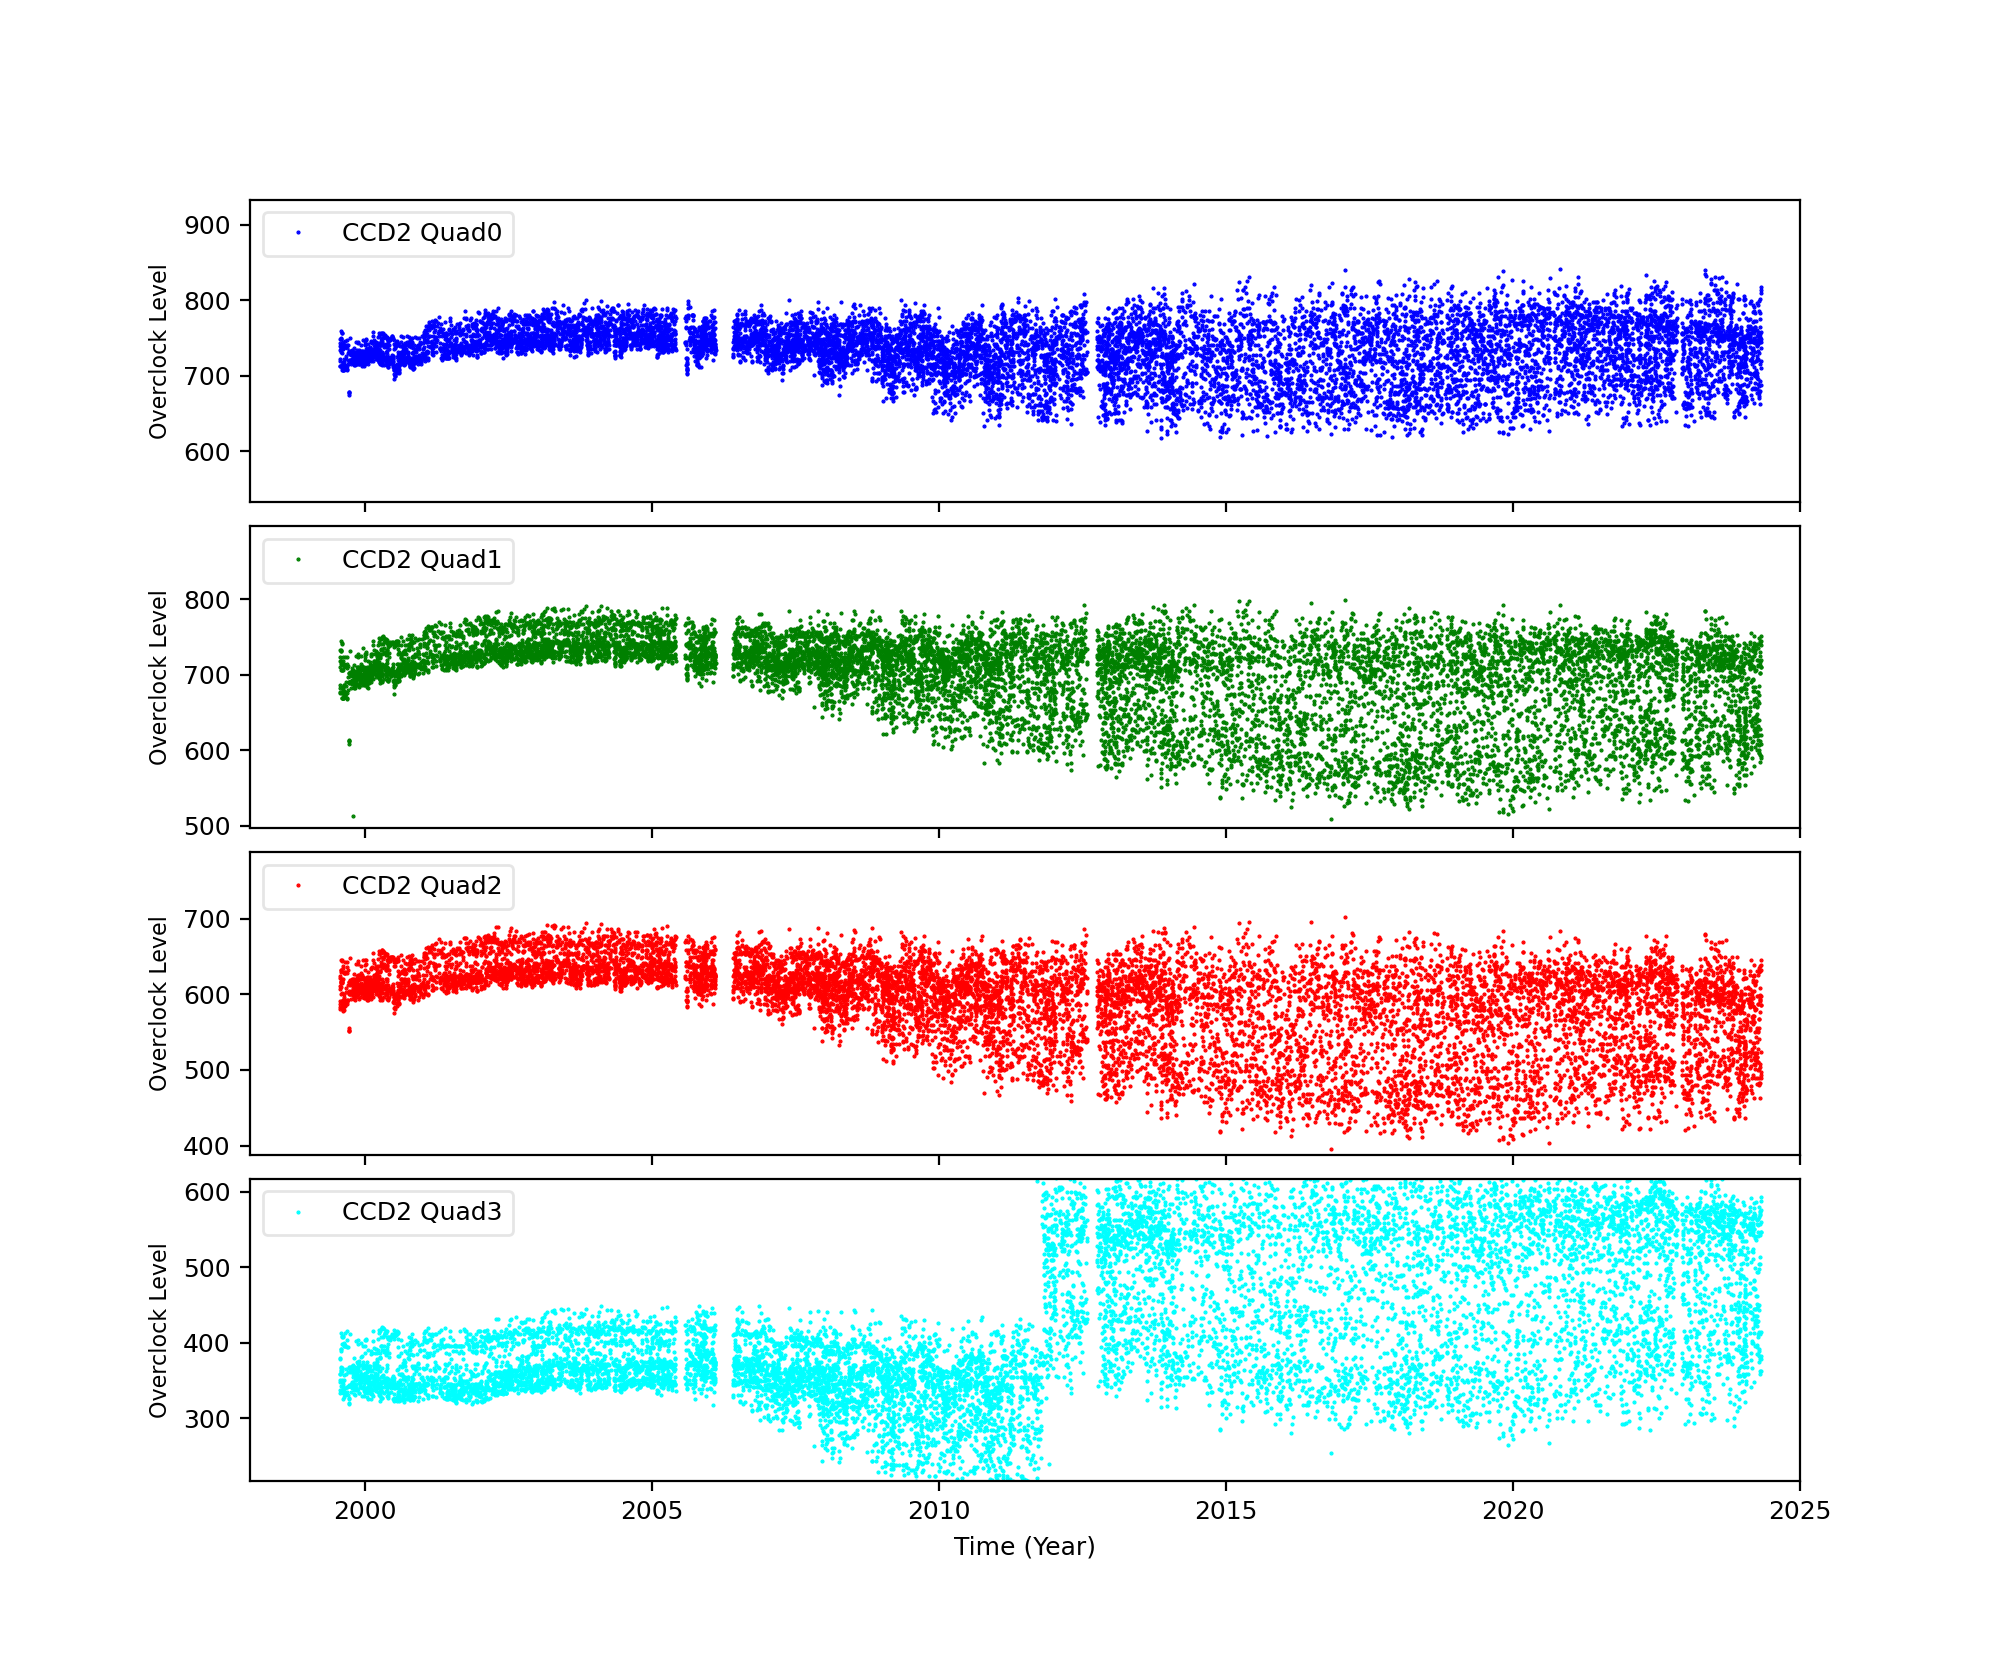
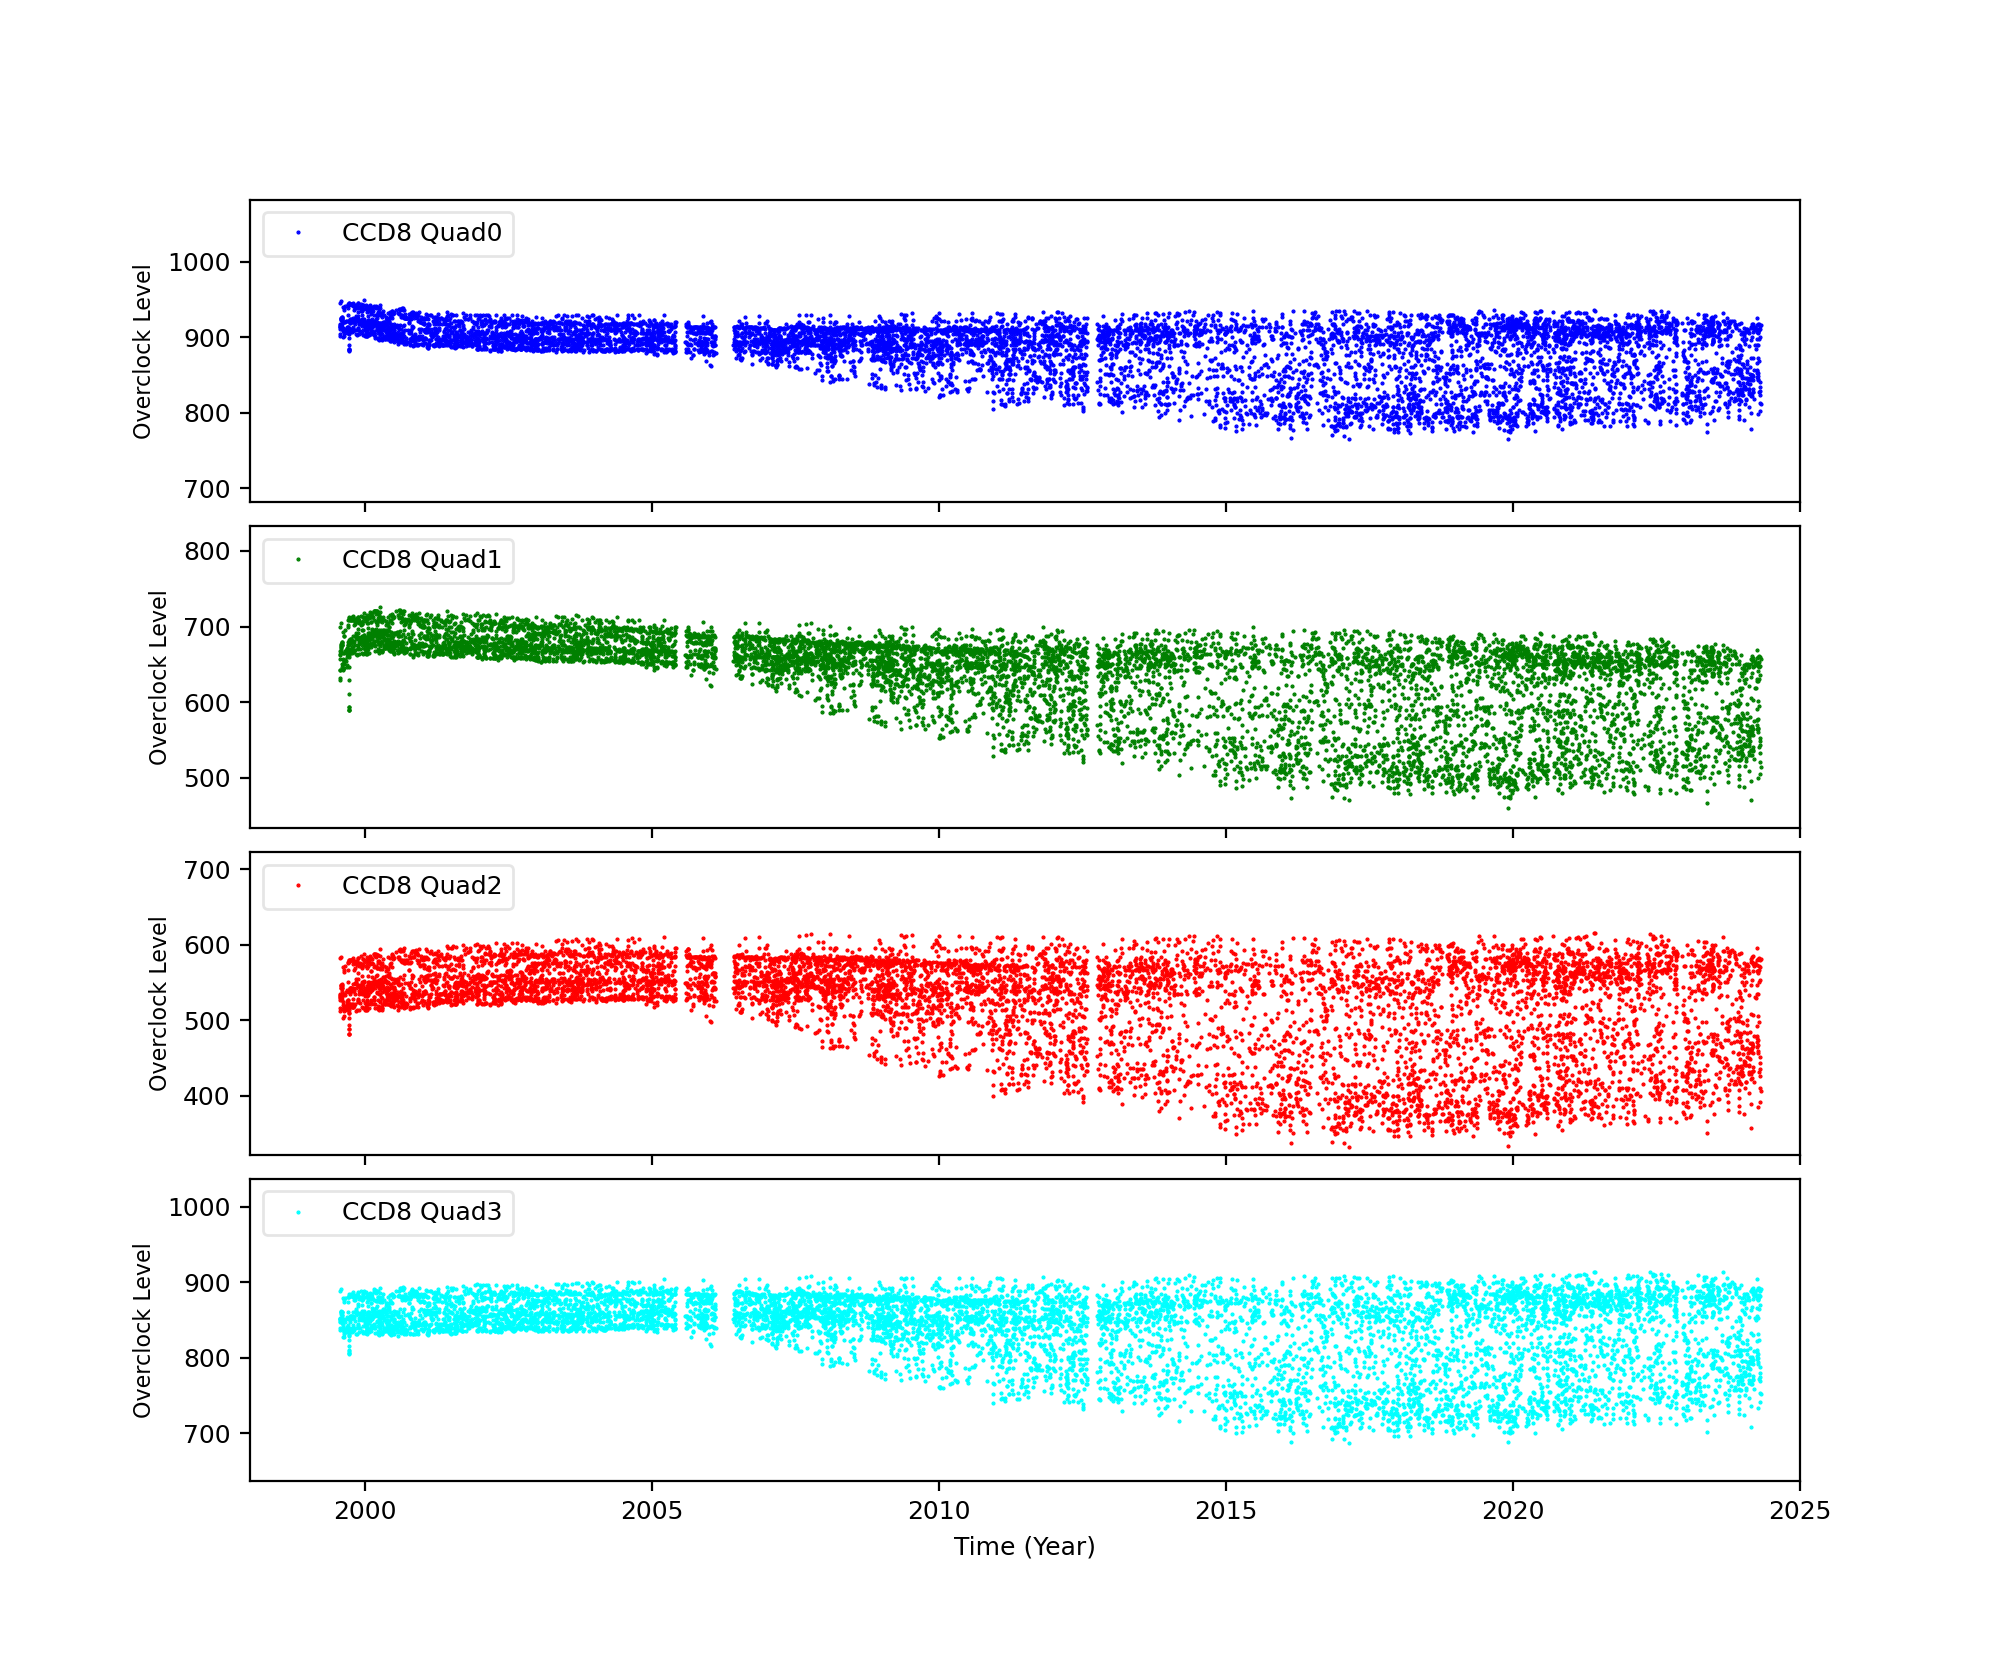
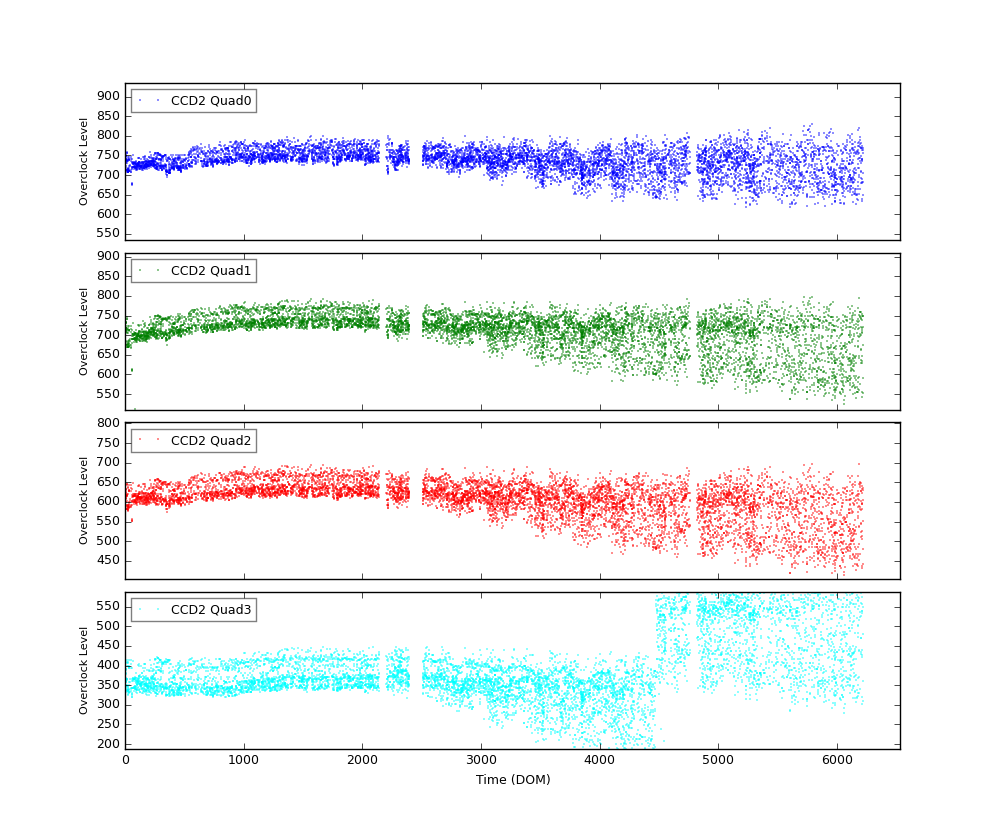
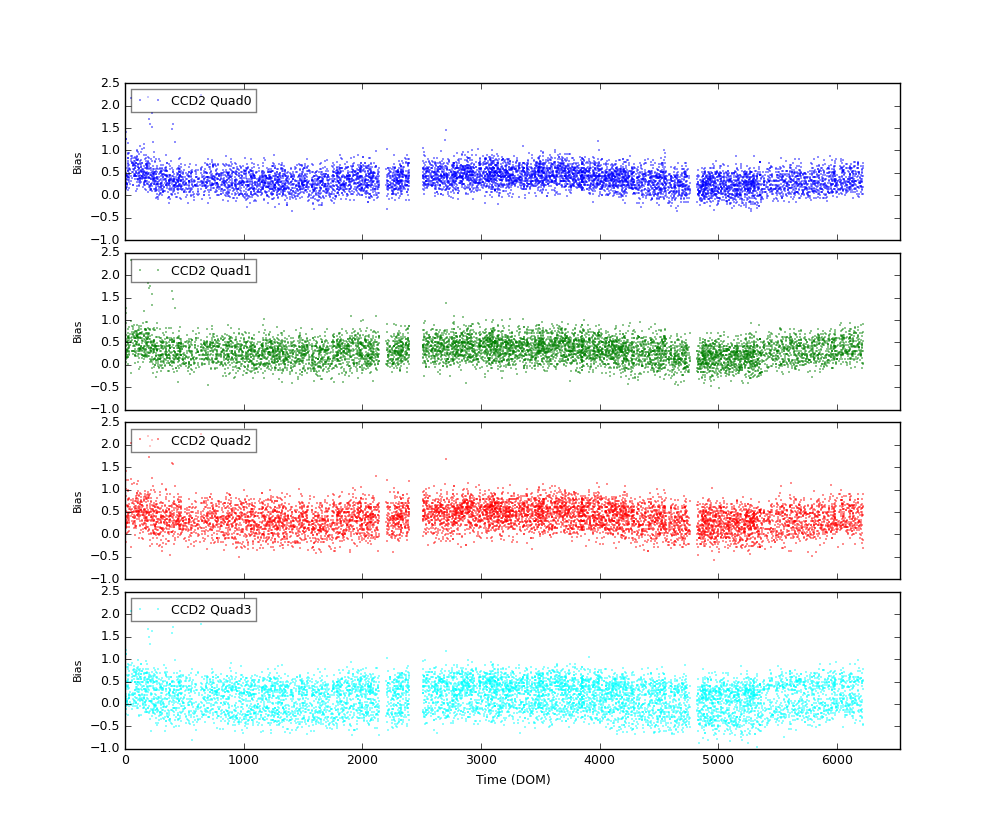
ACIS Bias Trends
The bias plus overclock level was calculated as follows:
- Get acisf*bias0.fits is obtained from a database or /dsops/ap/sdp/cache/*/acis/
- Data with timed mode exposure is selected.
- Fits files were divided into 4 quads, then an average of bias level for each quad is computed. No corrections for dead spots, columns etc were included.
An example of Overclock values as reported in FITS file header:
An example of mean bias minus overclock value:
[an error occurred while processing this directive]
HRC
DOSE of Central 4K Pore-Pairs
Please refer to Maximum Dose Trends for more details.
No Data
)
        IMAGE                NPIX      MEAN    STDDEV      MIN       MAX
HRCI_08_1999_07_2016.fits  16777216   4.460    4.997       0.0       292.0
)
|
|---|
     IMAGE                NPIX      MEAN    STDDEV      MIN       MAX
HRCS_07_2016.fits          16777216 0.017   0.1405      0.0       12.0
)
        IMAGE                NPIX     MEAN      STDDEV      MIN      MAX
HRCS_08_1999_07_2016.fits  16777216  15.982     28.548      0.0      1701.0
|
|
Max dose trend plots corrected for events that "pile-up"
in the center of the taps due to bad position information.
|
)
|
)
|
)
|
)
|
| Apr 2016 | Jan 2016 | Oct 2015 | Jul 2015 |
|---|
)
|
)
|
)
|
)
|
| Apr 2016 | Jan 2016 | Oct 2015 | Jul 2015 |
|---|
Gratings
Focus
We plot the width of the zero order streak of ACIS/HETG observations and the width of the zero order image for HRC/LETG observations of point sources. No significant defocusing trend is seen at this time. See Gratings Focus pages.
-->
PCAD
ACA Trending
ACIS-1
ACIS-6
HRC-I-1
HRC-S-1
Gyro Bias Drift
Radiation History
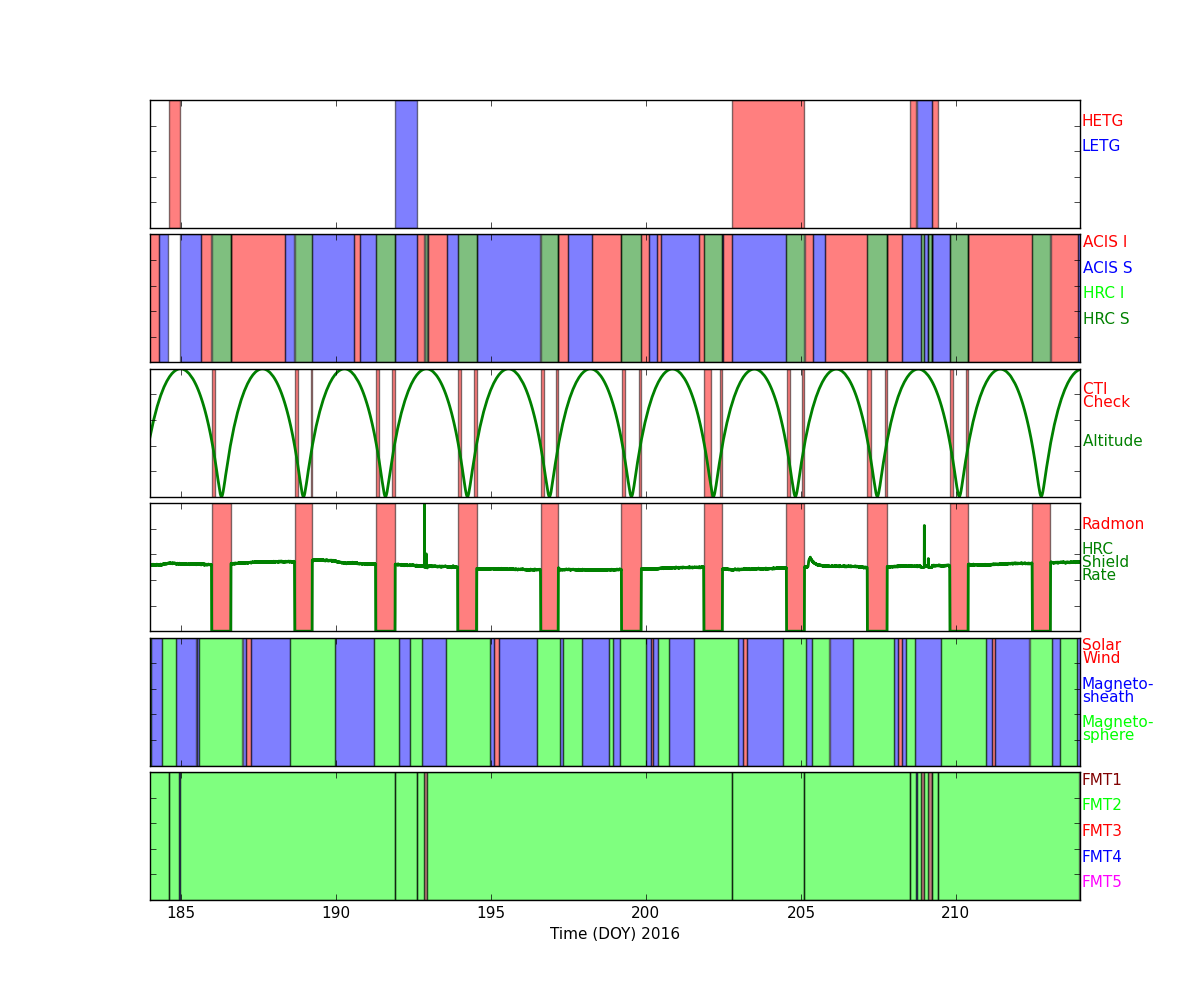
Radiation Zone Timing
Plotted below are radiation zone timing plots based on the following definitions of radiation zone:
- RADZONE - Ephin levels (in any of the E1300,P4GM,P41GM channels) are more than 1/3 of RADMON safing thresholds.
- RADMON - Radmon is disabled for radiation zone (as commanded based on OFLS model, for comparison with actual radiation levels).
- PERIGEE - Time of closest earth approach (for comparison)
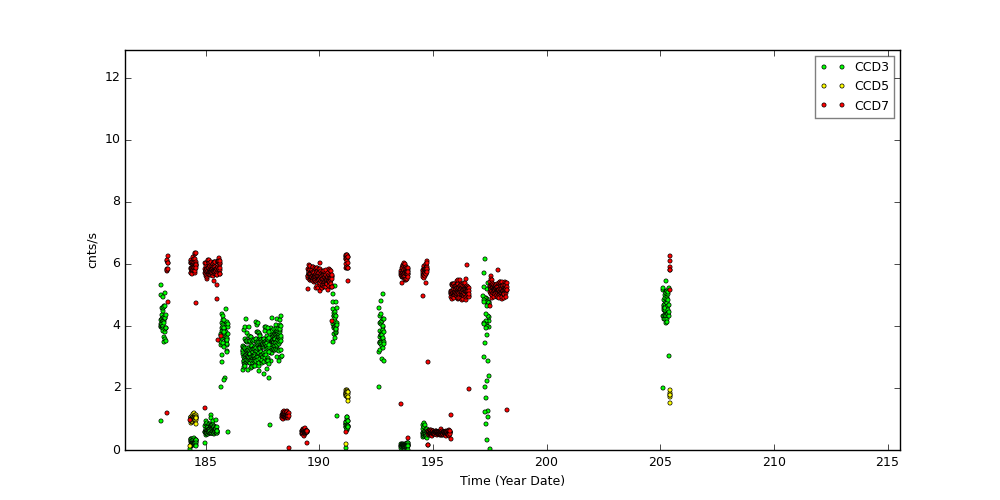
Radiation Count Rates of Jul 2016
Sun Spot History
Trending
Quarterly Trends
- SIM Electronics
| Previous Quarter | ||||||
| MSID | MEAN | RMS | DELTA/YR | DELTA/YR/YR | UNITS | DESCRIPTION |
| AGRNDADC | 1.812e-04 | 1.995e-04 | -1.509e-04 | 4.007e-03 | V | Analog ground A/D convert reading |
| FATABADC | 5.00 | 2.314e-03 | -6.310e-03 | 1.743e-01 | Converter | FA Tab Position Sensor A/D |
| N15VADC | -15.01 | 4.737e-04 | -3.339e-04 | 2.052e-02 | Reading | -15V Power Supply A/D Converter |
| P15VADC | 14.96 | 5.048e-04 | -6.639e-04 | 2.449e-02 | Reading | +15V Power Supply A/D Converter |
| P5VADC | 4.99 | 2.202e-02 | -4.937e-02 | 1.449e+00 | Reading | +5V Power Supply A/D Converter |
| TSCTABADC | 5.00 | 4.107e-03 | -1.020e-02 | 3.261e-01 | converter | TSC Tab Position Sensor A/D |
)
)
)
)
)
)
- SIM Actuator
| Previous Quarter | ||||||
| MSID | MEAN | RMS | DELTA/YR | DELTA/YR/YR | UNITS | DESCRIPTION |
| FAEDGE | 0.000e+00 | 0.000e+00 | 0.000e+00 | 0.000e+00 | - | FA Tab Edge Detection Flags |
| FAPOS | -0.74 | 0.11 | 1.390e-01 | -1.456e+01 | mm | FA position (3FAPOS/7FAPOS) |
| FATABWID | 0.000e+00 | 0.000e+00 | 0.000e+00 | 0.000e+00 | - | Most recently detected FA tab width |
| LDRTNUM | 2.32 | 0.82 | 8.134e-01 | -7.565e+01 | - | Last Detected Reference Tab Number |
| LDRTRELPOS | 0.14 | 8.944e-02 | 1.248e-01 | -4.562e+00 | (3LDRTPOS) | Last detected reference tab relative position mm |
| MRMDEST | 780.54 | 1.709e+04 | -1.025e+04 | 3.200e+05 | step | Most Recent Motor Move Destination |
| PWMLEVEL | 0.30 | 0.24 | 5.983e-01 | -1.267e+01 | (3MRMMXMV) | maximum motor volrtage PWM level most recent move |
| TSCEDGE | 72.92 | 10.55 | 3.719e-01 | 9.040e+00 | - | TSC Tab Edge Detection Flags |
| TSCPOS | 94.63 | 1.937e+02 | 2.848e+01 | -2.898e+03 | mm | TSC position (3TSCPOS) |
| TSCTABWID | 774.77 | 2.194e+02 | -3.139e+02 | 1.432e+04 | - | Most recently detected TSC tab width |
)
)
)
)
)
)
)
)
)
)
- EPS Batteries
| Previous Quarter | ||||||
| MSID | MEAN | RMS | DELTA/YR | DELTA/YR/YR | UNITS | DESCRIPTION |
| EB2CI | 0.28 | 4.821e-02 | 3.486e-02 | 1.402e-01 | AMP | BATT 2 CHARGE CURRENT |
| EB2DI | 0.02 | 6.930e-02 | 3.674e-02 | 5.685e-02 | AMP | BATT 2 DISCHARGE CURRENT |
| EB2V | 32.30 | 8.351e-02 | -5.636e-01 | 2.319e+00 | V | BATT 2 VOLTAGE |
| ECNV1V | 14.89 | 4.105e-03 | 1.262e-02 | -6.035e-02 | V | CONV 1 +15V OUTPUT |
| ECNV2V | 14.84 | 1.258e-02 | 5.490e-02 | -2.477e-01 | V | CONV 2 +15V OUTPUT |
| ECNV3V | 15.29 | 3.528e-03 | 7.331e-04 | -2.642e-02 | V | CONV 3 +15V OUTPUT |
)
)
)
)
)
)
Envelope Trending
ACIS Electronics Side B
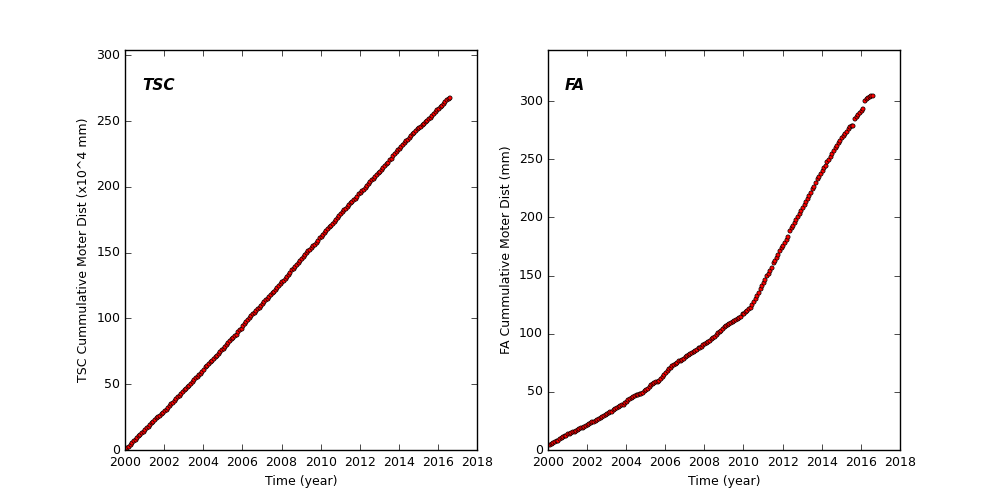
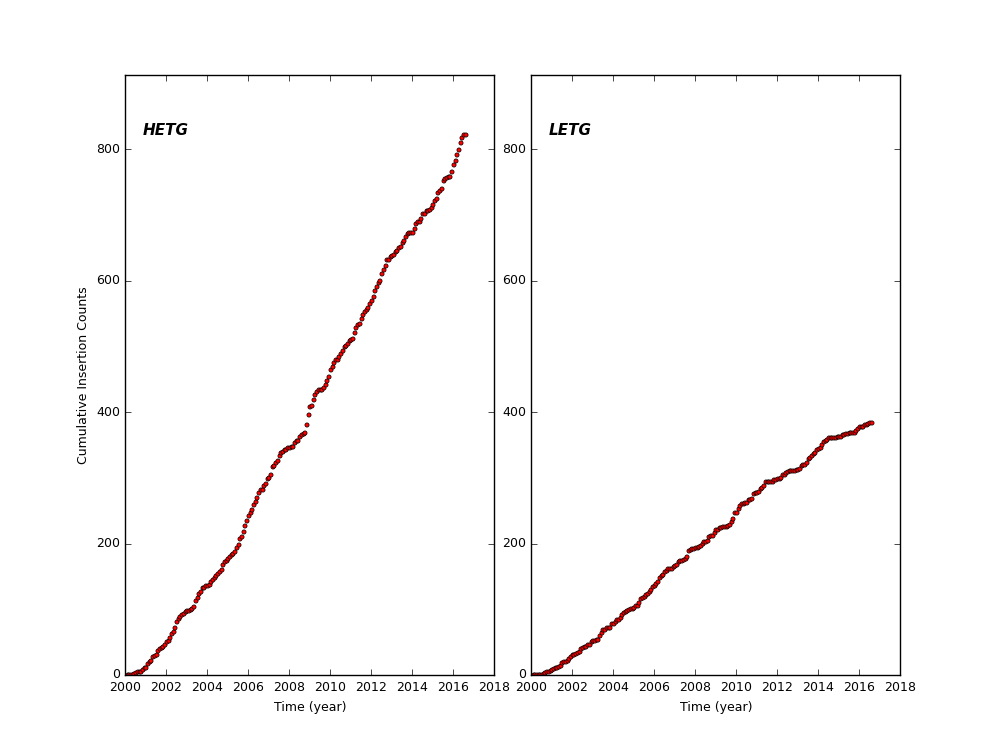
Spacecraft Motions
TSC and FA Cummulative Moter Distance
HETG and LETG Cummulative Insertion Counts
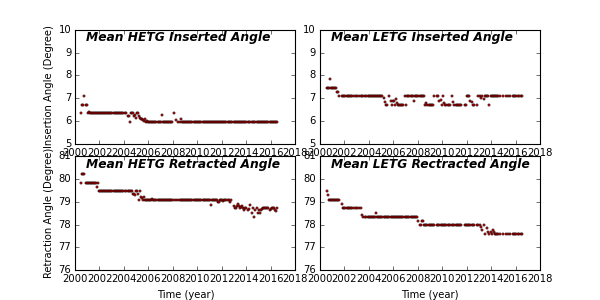
HETG/LETG Insertion/Retraction Angle
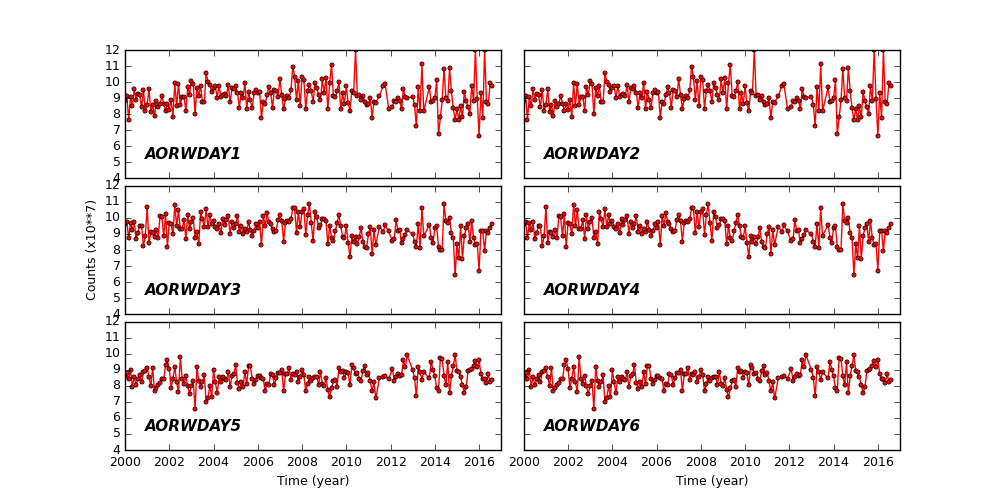
Reaction Wheel Rotations
Links to Past Monthly Reports
| Year | Month | |||||||||||
|---|---|---|---|---|---|---|---|---|---|---|---|---|
| 2016 | Jan | Feb | Mar | Apr | May | Jun | ||||||
| 2015 | Jan | Feb | Mar | Apr | May | Jun | Jul | Aug | Sep | Oct | Nov | Dec |
| 2014 | Jan | Feb | Mar | Apr | May | Jun | Jul | Aug | Sep | Oct | Nov | Dec |
| 2013 | Jan | Feb | Mar | Apr | May | Jun | Jul | Aug | Sep | Oct | Nov | Dec |
| 2012 | Jan | Feb | Mar | Apr | May | Jun | Jul | Aug | Sep | Oct | Nov | Dec |
| 2011 | Jan | Feb | Mar | Apr | May | Jun | Jul | Aug | Sep | Oct | Nov | Dec |
| 2010 | Jan | Feb | Mar | Apr | May | Jun | Jul | Aug | Sep | Oct | Nov | Dec |
| 2009 | Jan | Feb | Mar | Apr | May | Jun | Jul | Aug | Sep | Oct | Nov | Dec |
| 2008 | Jan | Feb | Mar | Apr | May | Jun | Jul | Aug | Sep | Oct | Nov | Dec |
| 2007 | Jan | Feb | Mar | Apr | May | Jun | Jul | Aug | Sep | Oct | Nov | Dec |
| 2006 | Jan | Feb | Mar | Apr | May | Jun | Jul | Aug | Sep | Oct | Nov | Dec |
| 2005 | Jan | Feb | Mar | Apr | May | Jun | Jul | Aug | Sep | Oct | Nov | Dec |
| 2004 | Jan | Feb | Mar | Apr | May | Jun | Jul | Aug | Sep | Oct | Nov | Dec |
| 2003 | Jan | Feb | Mar | Apr | May | Jun | Jul | Aug | Sep | Oct | Nov | Dec |
| 2002 | Jan | Feb | Mar | Apr | May | Jun | Jul | Aug | Sep | Oct | Nov | Dec |
| 2001 | Jan | Feb | Mar | Apr | May | Jun | Jul | Aug | Sep | Oct | Nov | Dec |
| 2000 | Jan | Feb | Mar | Apr | May | Jun | Jul | Aug | Sep | Oct | Nov | Dec |
| 1999 | Jul | Aug | Sep | Oct | Nov | Dec | ||||||