ACIS
ACIS DOSE Registered-Photon-Map
The steps we took to compute the dose map are;
- Level 1 Event files for a specified month are obtained from archive.
- Image data including I2, I3, S2, S3 CCDs are extracted from all event files.
- All the extracted image data were merged to create a month long exposure map for the month.
- The exposure map is opened with ds9, and check a distribution of count rates against energy. From this, estimate the upper threshold value. Any events beyond this upper threshold are assumed erroneous events such as bad pixels.
- Using this upper threshold, the data is filtered, and create a cleaned exposure map for the month.
- The exposure map from each month from the Sep 1999 is added up to create a cumulative exposure map for each month.
- Using fimgstatistic, we compute count rate statistics for each CCDs.
- For observations with high data drop rates (e.g., Crab nebula, Cas A), we corrected the observations by adding events.
Please check more detail plots at Telemetered Photon Dose Trend page.
)
)
)
Statistics:
# IMAGE     NPIX     MEAN        RMS        MIN     MAX

ACIS_aug16 6004901   7.703       13.758     0.0     2947

I2 node 0  262654    9.540400   3.893232    0.0     69.0
I2 node 1  262654   10.070112   7.733365    0.0   2001.0
I2 node 2  262654    9.816230   3.929448    0.0     80.0
I2 node 3  262654    9.925772   4.445665    0.0    312.0

I3 node 0  262654   11.420864   8.118283    0.0   2947.0
I3 node 1  262654   11.290878  11.476563    0.0    279.0
I3 node 2  262654   10.116671   5.163206    0.0    116.0
I3 node 3  262654    9.820936   3.975768    0.0    165.0

S2 node 0  262654    7.926513   3.609642    0.0    474.0
S2 node 1  262654    8.244705   3.920396    0.0     62.0
S2 node 2  262654    8.331269   3.764527    0.0     93.0
S2 node 3  262654    8.141501   3.648526    0.0    459.0

S3 node 0  262654   22.184911  38.689888    0.0    311.0
S3 node 1  262654    9.321868   4.839155    0.0     66.0
S3 node 2  262654    8.581775   3.312644    0.0     73.0
S3 node 3  262654    7.818631   3.136865    0.0     27.0
)
)
)
Statistics:
 IMAGE     NPIX      MEAN        RMS           MIN      MAX

ACIS_total  6004901  2032.494    2649.700      0.0      116229

I2 node 0  262654   1736.877045  335.418070   355.0    9496.0
I2 node 1  262654   1829.294066  463.432888   371.0   53009.0
I2 node 2  262654      9.816230    3.929448     0.0      80.0
I2 node 3  262654   1860.282266  471.545387   357.0   28258.0

I3 node 0  262654   1963.973088  474.412429   355.0    7661.0
I3 node 1  262654   2053.389035 1560.814661   354.0   38885.0
I3 node 2  262654   1797.275580  326.307924   342.0    9737.0
I3 node 3  262654      9.820936    3.975768     0.0     165.0

S2 node 0  262654   2370.586696  346.882184  1272.0   21458.0
S2 node 1  262654      8.244705     3.920396    0.0      62.0
S2 node 2  262654   2777.398560  529.055405  1680.0   27388.0
S2 node 3  262654   2713.072569  382.296167  1578.0   47748.0

S3 node 0  262654   4222.980698 1862.563041  1750.0   13902.0
S3 node 1  262654   5399.243079 2145.682105     0.0   14360.0
S3 node 2  262654   4170.462079 1050.333367  1741.0   10048.0
S3 node 3  262654   3229.670495  486.775706  1856.0   10874.0
)
|
)
|
)
|
)
|
| May 2016 | Feb 2016 | Nov 2015 | Aug 2015 |
|---|
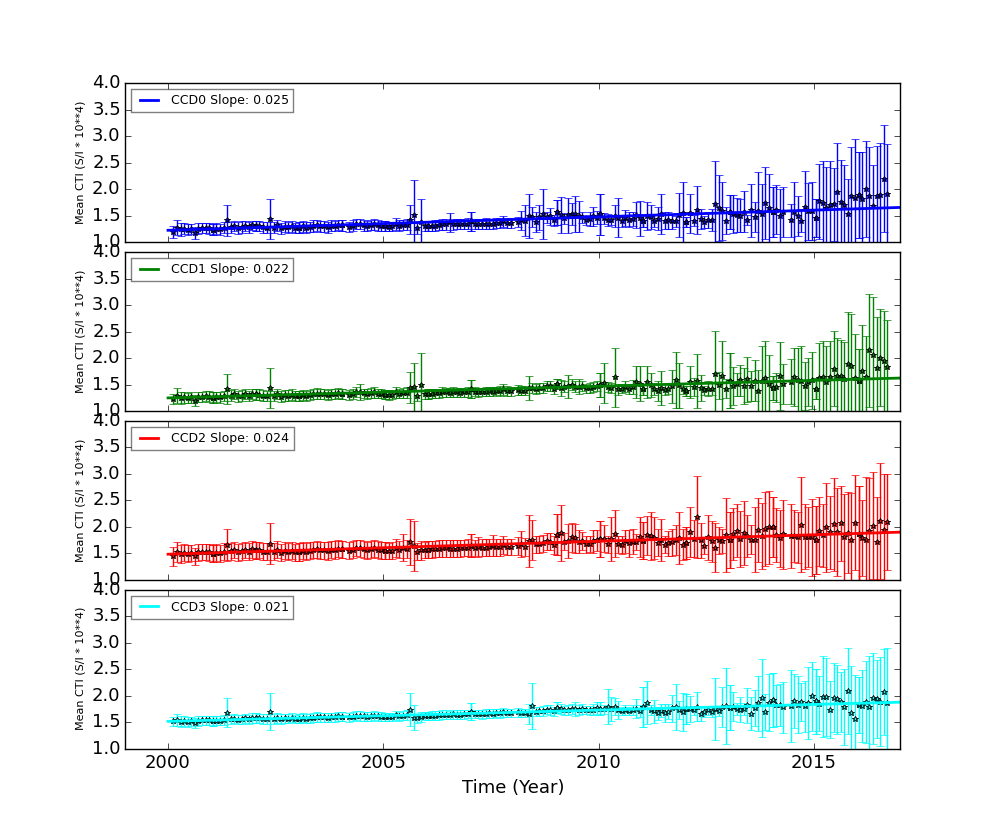
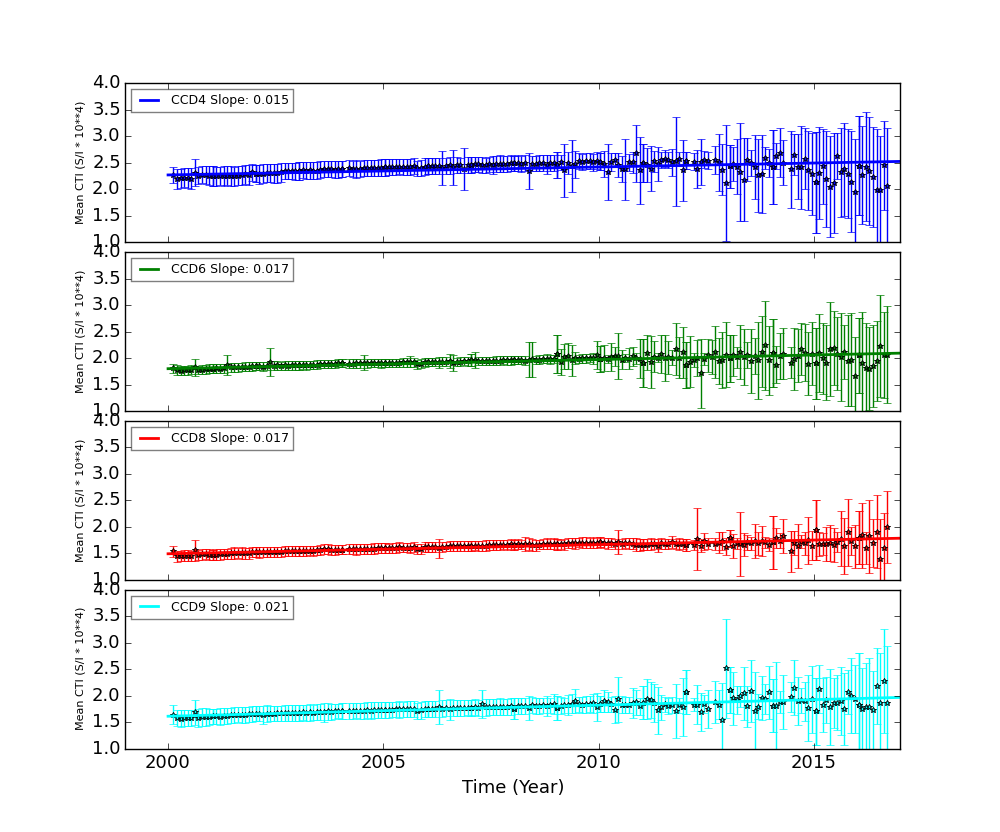
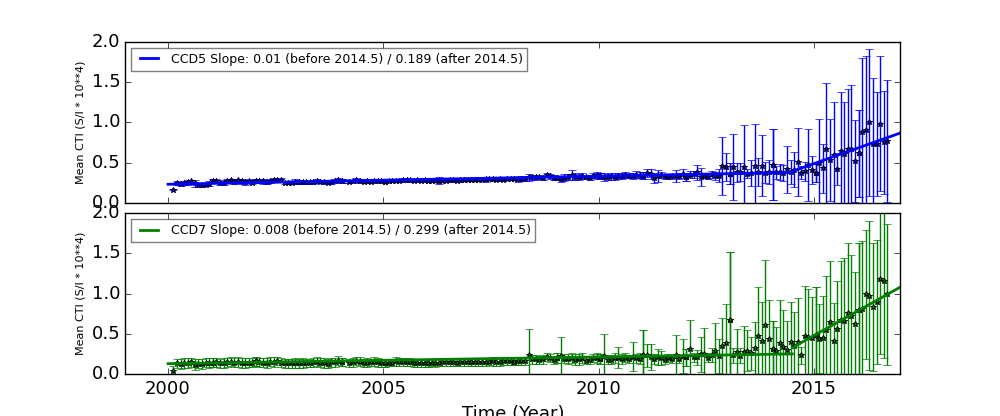
The Mean Detrended CTI
We report CTIs with a refined data definition. CTIs were computed for the temperature dependency corrected data. Please see CTI page for detailed explanation. CTI's are computed for Mn K alpha, and defined as slope/intercept x10^4 of row # vs ADU. Data file: here
Imaging CCDs
Spectral CCDs
Backside CCDs
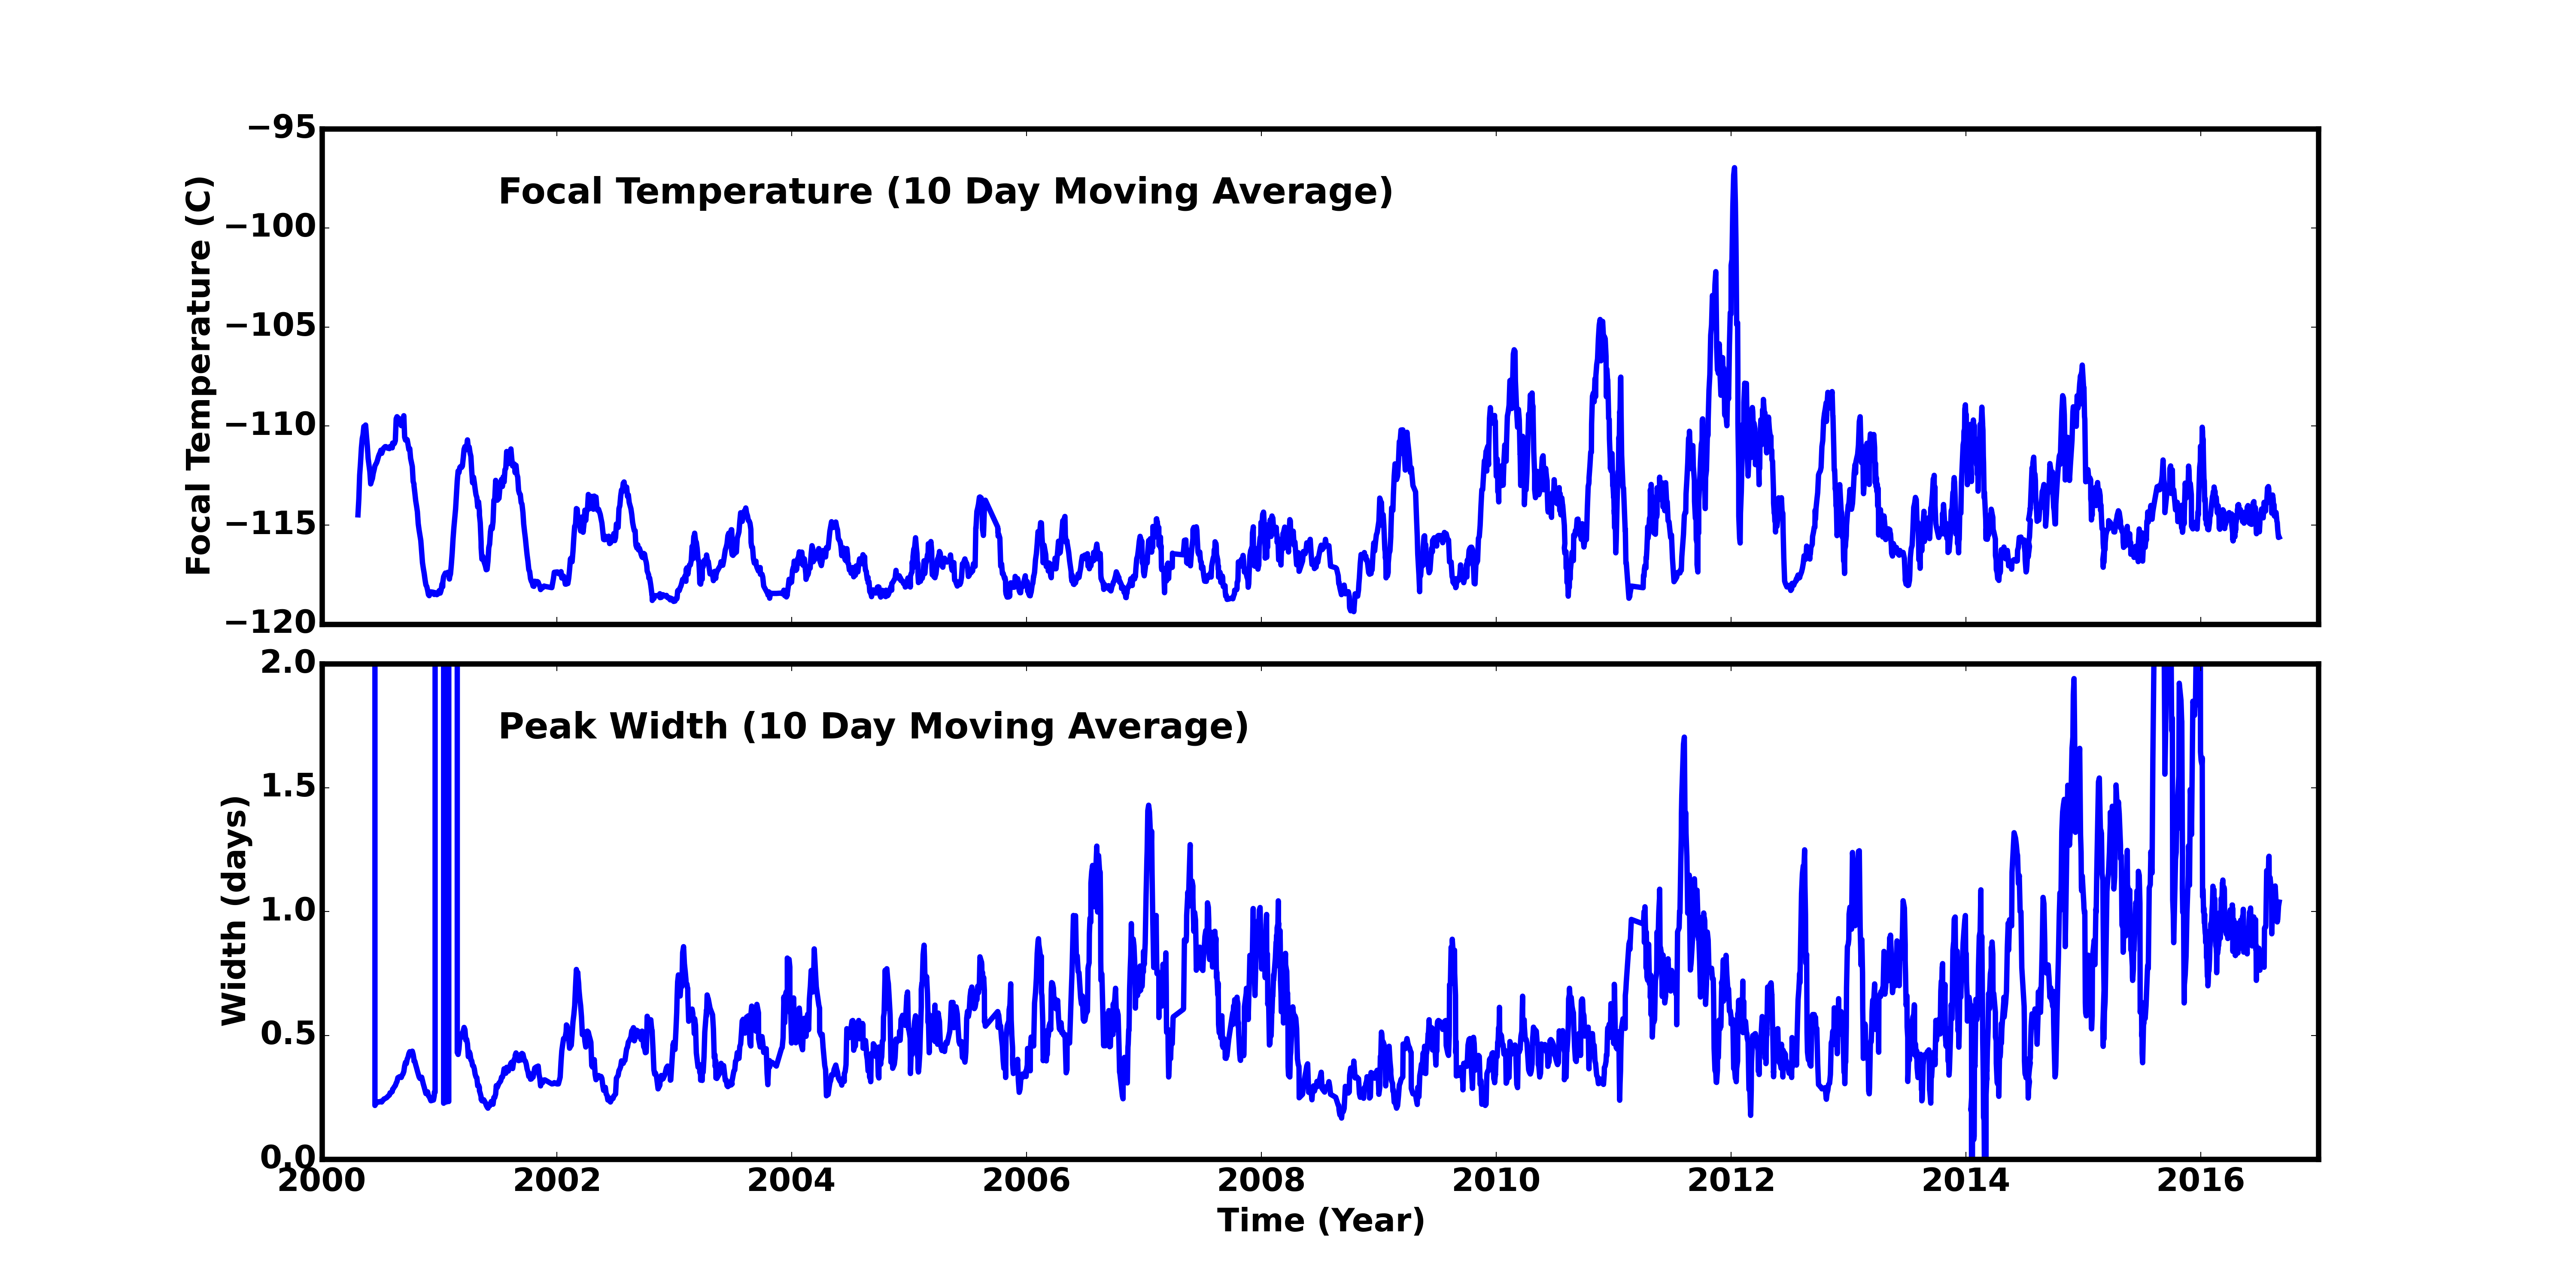
Focal Plane Temperature
Aug 2016 Focal Temperature
| The Mean (max) FPT: | |
|---|---|
| -114.71 | +/- 2.48 C |
| Mean Width: | |
| 1.09 | +/- 0.67 days |
Averaged Focal Plane Temperature
We are using 10 period moving averages to show trends of peak temperatures and peak widths. Note, the gaps in the width plot are due to missing/corrupted data.
Focal Plane Temperature, Sun Angle and Altitude
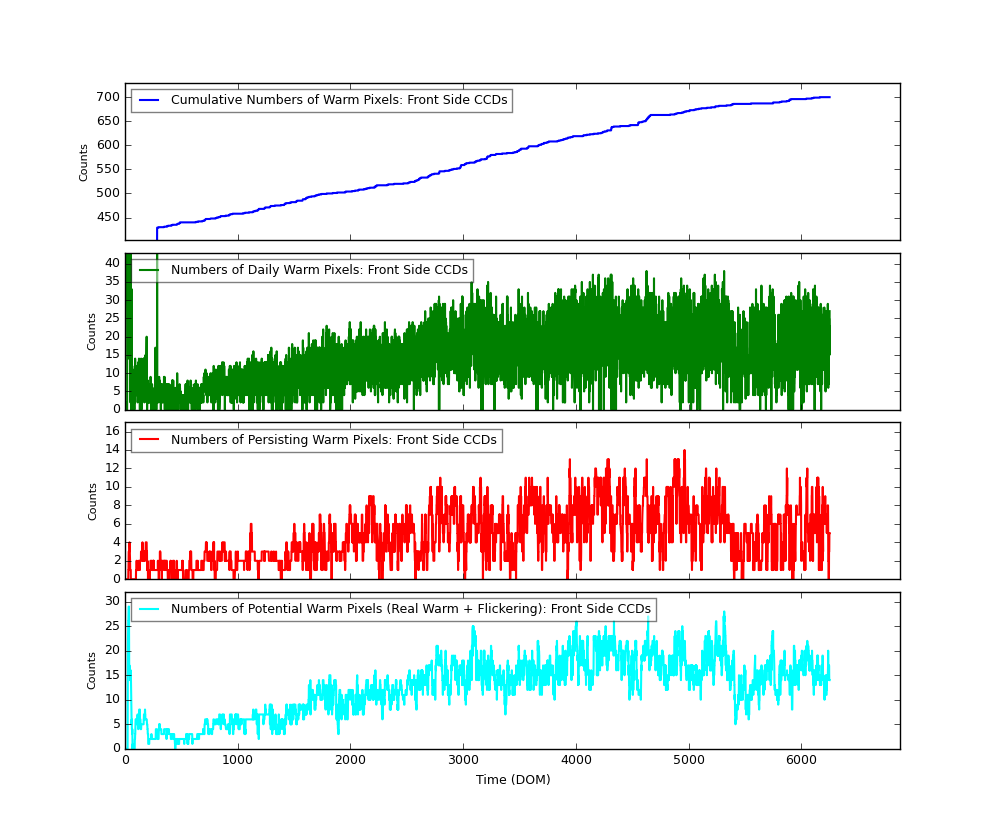
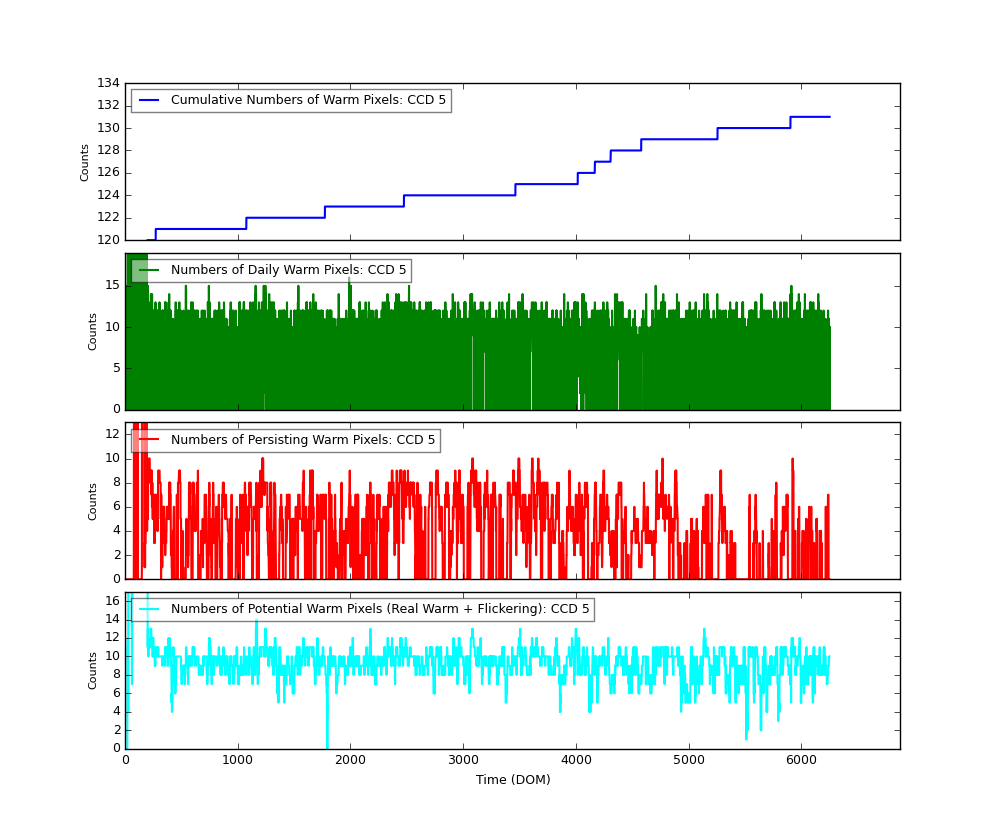
Bad Pixels
The plots below were generated with a new warm pixel finding script. Please see Acis Bad Pixel Page for details.
Front Side CCDs
Back Side CCD (CCD5)
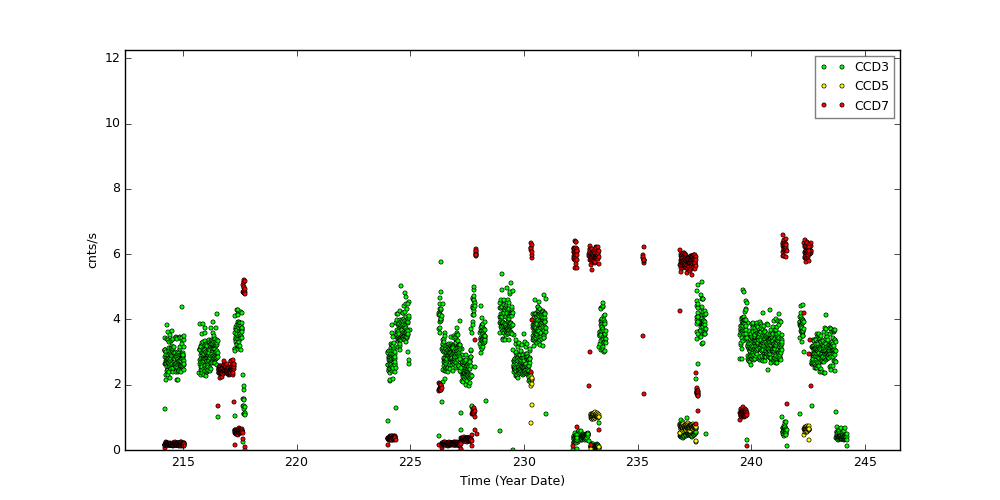
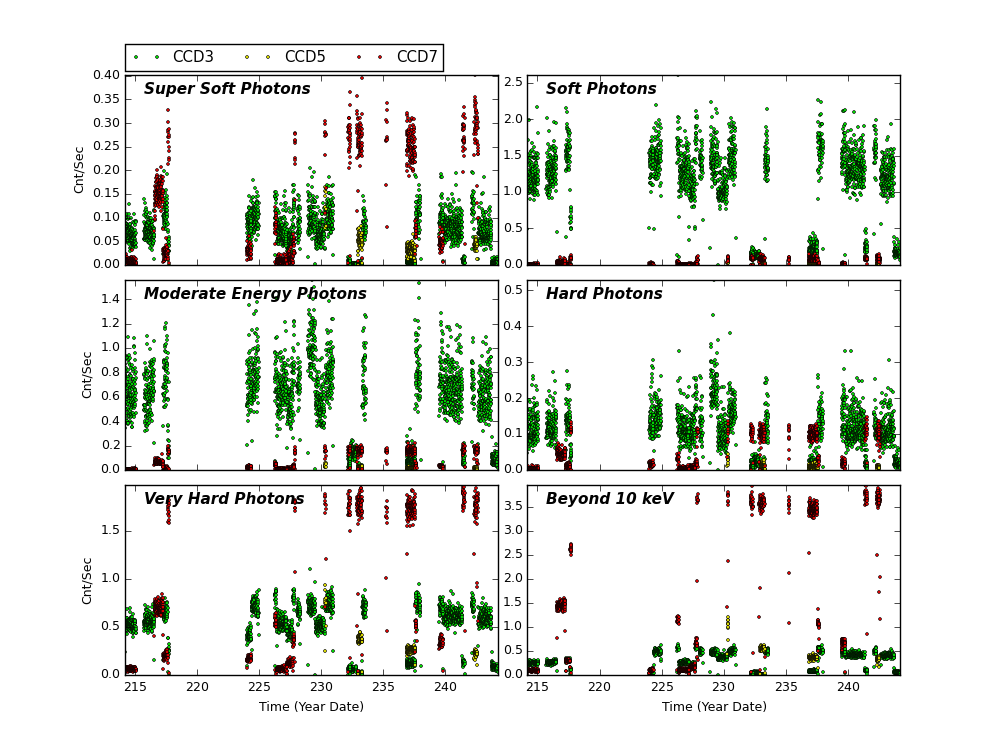
Science Instrument Background Rates
| Name | Low (keV) | High(KeV) | Description |
|---|---|---|---|
| SSoft | 0.00 | 0.50 | Super soft photons |
| Soft | 0.50 | 1.00 | Soft photons |
| Med | 1.00 | 3.00 | Moderate energy photons |
| Hard | 3.00 | 5.00 | Hard Photons |
| Harder | 5.00 | 10.00 | Very Hard photons |
| Hardest | 10.00 | Beyond 10 keV |
[an error occurred while processing this directive]
HRC
DOSE of Central 4K Pore-Pairs
Please refer to Maximum Dose Trends for more details.
)
|
|---|
        IMAGE                NPIX      MEAN    STDDEV      MIN       MAX
HRCI_08_2016.fits          16777216   0.019    0.1391      0.0        3.0
)
        IMAGE                NPIX      MEAN    STDDEV      MIN       MAX
HRCI_08_1999_08_2016.fits  16777216   4.479    5.000       0.0       292.0
No Data
)
        IMAGE                NPIX     MEAN      STDDEV      MIN      MAX
HRCS_08_1999_08_2016.fits  16777216  15.982     28.548      0.0      1701.0
|
|
Max dose trend plots corrected for events that "pile-up"
in the center of the taps due to bad position information.
|
)
|
)
|
)
|
)
|
| May 2016 | Feb 2016 | Nov 2015 | Aug 2015 |
|---|
)
|
)
|
)
|
)
|
| May 2016 | Feb 2016 | Nov 2015 | Aug 2015 |
|---|
HRMA Focus
Plots below show various characteristics of detected imaging sources. Standard level 2 data products (*src2.fits) are used. Only observations with focus (sim_x) within 0.01 mm of nominal value for given SI configuration are used. Sources are also filtered for strength (SNR > 15).
For individual detectors, please go to MTA SRC2 Monitoring page.
Source Sky Position
PSF vs Time
Source Ellipse Roundness
80% Encircled Energy Radius
Signal-to-Noise Ratio
Rotation
)
)
)
|
)
|
)
|
)
|
)
|
)
|
)
|
)
|
Gratings
Focus
We plot the width of the zero order streak of ACIS/HETG observations and the width of the zero order image for HRC/LETG observations of point sources. No significant defocusing trend is seen at this time. See Gratings Focus pages.
-->
PCAD
ACA Trending
Gyro Bias Drift
ACIS-S and HRC Celestial Location Monitoring
Science Instrument Positional Change Monitoring
The following plots are the difference between coordinates obtained from Chandra observations and those obtained from existing catalogs vs time in day of mission.
The following steps are taken to generate these plots.
- all observations with grating are selected
- even if the observation is not grating one, if it is a known point source, it is added to the list.
- observed ra, jan, target ra, jan, nominal ra, jan and a ratio of a target elliptical to psf (psfratio are extracted from src fits files.
- the observations with psfratio smaller than 4 are selected
- the differences between observed coordinates and targeted coordinates (if not available nominal coordinates) are computed
- if the differences are larger than 6 arcsec, the points are dropped
The large dispersion around DOM ~ 2400 (Jan 2005) are all due to none grating Capella observations. Many observations are off-axis observations (e.g., obsid 6558).
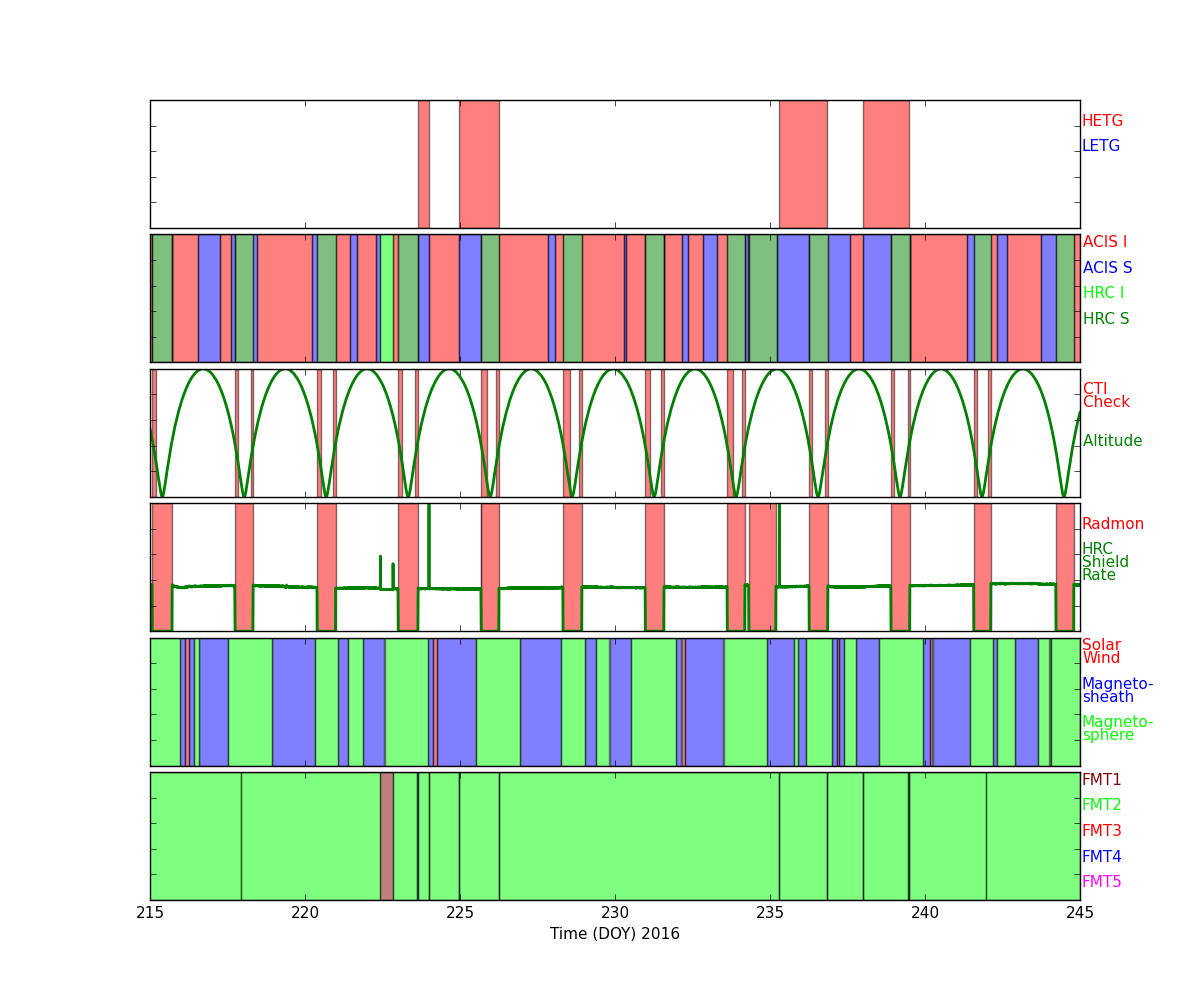
Radiation History
Radiation Zone Timing
Plotted below are radiation zone timing plots based on the following definitions of radiation zone:
- RADZONE - Ephin levels (in any of the E1300,P4GM,P41GM channels) are more than 1/3 of RADMON safing thresholds.
- RADMON - Radmon is disabled for radiation zone (as commanded based on OFLS model, for comparison with actual radiation levels).
- PERIGEE - Time of closest earth approach (for comparison)
Radiation Count Rates of Aug 2016
Sun Spot History
Trending
Quarterly Trends
- Spacecraft Main Temperature
| Previous Quarter | ||||||
| MSID | MEAN | RMS | DELTA/YR | DELTA/YR/YR | UNITS | DESCRIPTION |
| TASPPCM | 294.04 | 3.49 | 1.785e+01 | 2.358e+02 | K | AFT SHEAR PANEL TEMP:-Z PCAD COMP |
| TCM_SSR1 | 288.79 | 3.18 | 2.990e+01 | 1.848e+02 | K | SS RECORDER-1 TEMP |
| TCYLAFT6 | 309.22 | 4.30 | 1.973e+01 | 3.048e+02 | K | CNT CYL TEMP:16-IN FWD OF SC-TS FIT-6 |
| TSAMYT | 317.62 | 0.49 | 2.599e+00 | 5.570e+01 | K | -Y WING SOLAR ARRAY TEMP |
| TSAPYT | 317.53 | 0.50 | 2.554e+00 | 5.146e+01 | K | +Y WING SOLAR ARRAY TEMP |
)
)
)
)
)
- Spacecraft Anc Temperature
| Previous Quarter | ||||||
| MSID | MEAN | RMS | DELTA/YR | DELTA/YR/YR | UNITS | DESCRIPTION |
| TBOLTCUT | 238.39 | 15.78 | 3.633e+01 | -3.785e+02 | K | DOOR BOLT-CUTTER TEMP |
| TCNR_BRM | 274.12 | 1.70 | 6.655e+00 | 4.258e+01 | K | -Y/+Z PANEL CORNER PANEL TEMP (BRM) |
| TFSSBKT1 | 337.25 | 19.62 | 3.194e+01 | 2.352e+02 | K | FSS BRACKET-1 TEMP (+Y) |
| TFSSBKT2 | 331.50 | 25.94 | 3.485e+01 | 1.363e+02 | K | FSS BRACKET-2 TEMP (+Y) |
| TSCIUSF1 | 302.90 | 29.32 | 2.793e+01 | -4.532e+02 | K | SC-IUS FITTING-1 TEMP |
| TSCIUSF2 | 265.04 | 12.56 | 1.434e+01 | -1.889e+02 | K | SC-IUS FITTING-2 TEMP |
)
)
)
)
)
)
- Battery Temperature
| Previous Quarter | ||||||
| MSID | MEAN | RMS | DELTA/YR | DELTA/YR/YR | UNITS | DESCRIPTION |
| TB1T1 | 270.81 | 0.11 | 4.396e-02 | 7.437e-01 | K | BATT 1 TEMP 1 |
| TB2T2 | 273.38 | 7.202e-02 | -8.672e-02 | -2.028e-01 | K | BATT 3 TEMP 1 |
| TB3T2 | 273.46 | 9.001e-02 | -1.040e-01 | 5.336e-01 | K | BATT 3 TEMP 2 |
)
)
)
Envelope Trending
ACIS Temperature
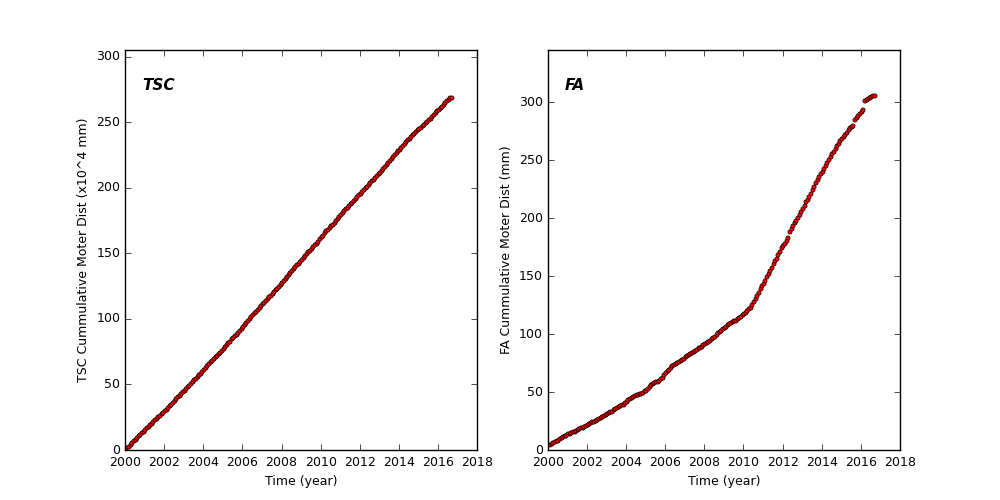
Spacecraft Motions
TSC and FA Cummulative Moter Distance
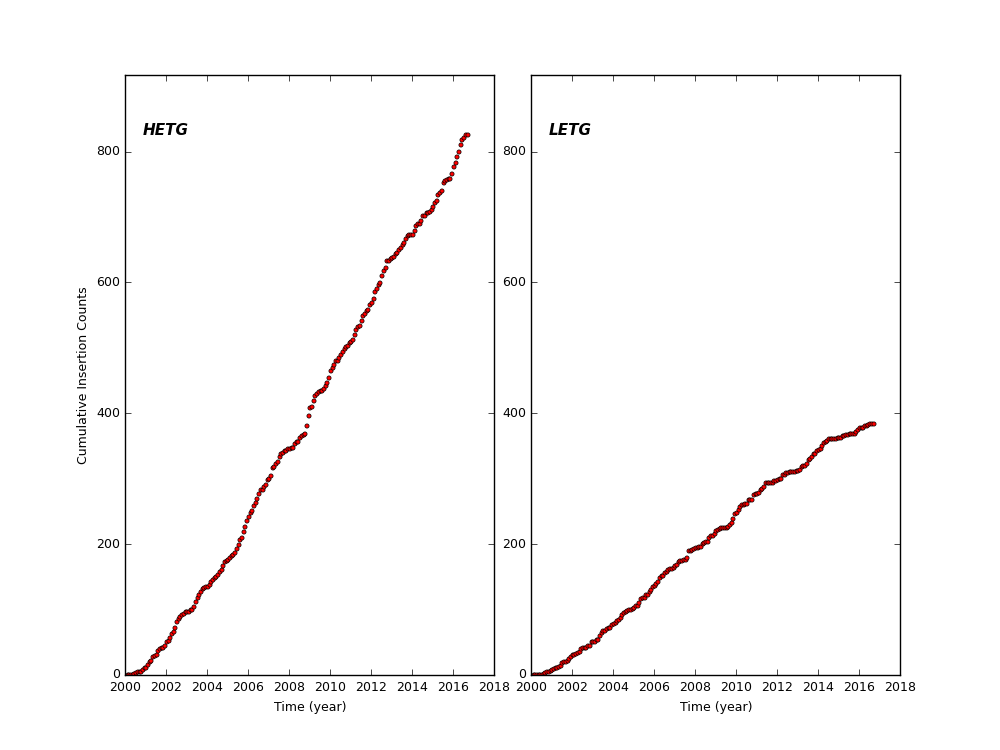
HETG and LETG Cummulative Insertion Counts
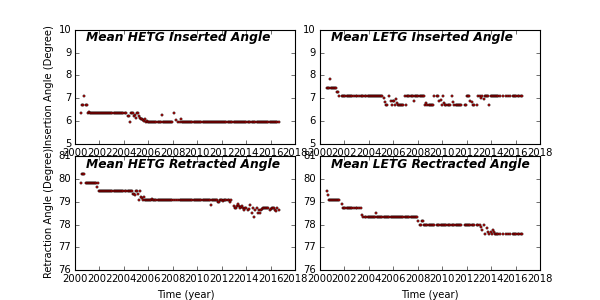
HETG/LETG Insertion/Retraction Angle
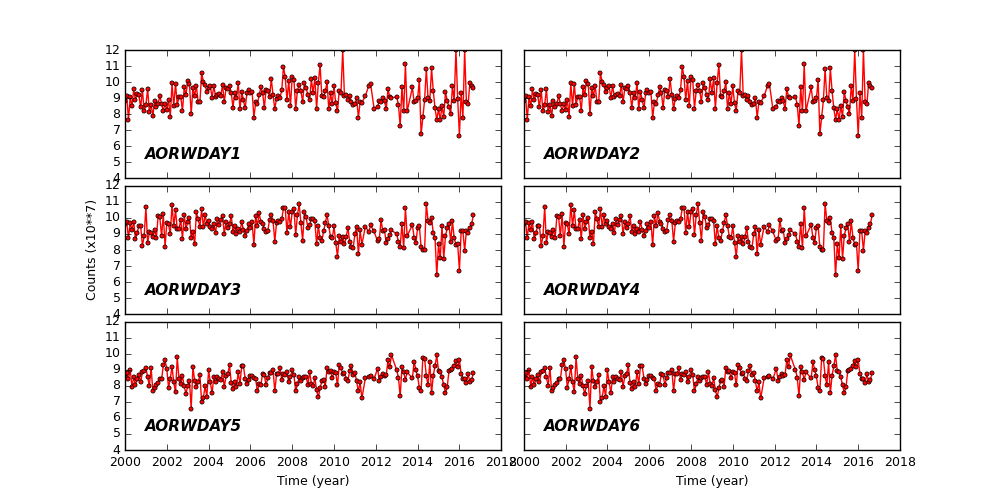
Reaction Wheel Rotations
Links to Past Monthly Reports
| Year | Month | |||||||||||
|---|---|---|---|---|---|---|---|---|---|---|---|---|
| 2016 | Jan | Feb | Mar | Apr | May | Jun | Jul | |||||
| 2015 | Jan | Feb | Mar | Apr | May | Jun | Jul | Aug | Sep | Oct | Nov | Dec |
| 2014 | Jan | Feb | Mar | Apr | May | Jun | Jul | Aug | Sep | Oct | Nov | Dec |
| 2013 | Jan | Feb | Mar | Apr | May | Jun | Jul | Aug | Sep | Oct | Nov | Dec |
| 2012 | Jan | Feb | Mar | Apr | May | Jun | Jul | Aug | Sep | Oct | Nov | Dec |
| 2011 | Jan | Feb | Mar | Apr | May | Jun | Jul | Aug | Sep | Oct | Nov | Dec |
| 2010 | Jan | Feb | Mar | Apr | May | Jun | Jul | Aug | Sep | Oct | Nov | Dec |
| 2009 | Jan | Feb | Mar | Apr | May | Jun | Jul | Aug | Sep | Oct | Nov | Dec |
| 2008 | Jan | Feb | Mar | Apr | May | Jun | Jul | Aug | Sep | Oct | Nov | Dec |
| 2007 | Jan | Feb | Mar | Apr | May | Jun | Jul | Aug | Sep | Oct | Nov | Dec |
| 2006 | Jan | Feb | Mar | Apr | May | Jun | Jul | Aug | Sep | Oct | Nov | Dec |
| 2005 | Jan | Feb | Mar | Apr | May | Jun | Jul | Aug | Sep | Oct | Nov | Dec |
| 2004 | Jan | Feb | Mar | Apr | May | Jun | Jul | Aug | Sep | Oct | Nov | Dec |
| 2003 | Jan | Feb | Mar | Apr | May | Jun | Jul | Aug | Sep | Oct | Nov | Dec |
| 2002 | Jan | Feb | Mar | Apr | May | Jun | Jul | Aug | Sep | Oct | Nov | Dec |
| 2001 | Jan | Feb | Mar | Apr | May | Jun | Jul | Aug | Sep | Oct | Nov | Dec |
| 2000 | Jan | Feb | Mar | Apr | May | Jun | Jul | Aug | Sep | Oct | Nov | Dec |
| 1999 | Jul | Aug | Sep | Oct | Nov | Dec | ||||||