ACIS
ACIS DOSE Registered-Photon-Map
The steps we took to compute the dose map are;
- Level 1 Event files for a specified month are obtained from archive.
- Image data including I2, I3, S2, S3 CCDs are extracted from all event files.
- All the extracted image data were merged to create a month long exposure map for the month.
- The exposure map is opened with ds9, and check a distribution of count rates against energy. From this, estimate the upper threshold value. Any events beyond this upper threshold are assumed erroneous events such as bad pixels.
- Using this upper threshold, the data is filtered, and create a cleaned exposure map for the month.
- The exposure map from each month from the Sep 1999 is added up to create a cumulative exposure map for each month.
- Using fimgstatistic, we compute count rate statistics for each CCDs.
- For observations with high data drop rates (e.g., Crab nebula, Cas A), we corrected the observations by adding events.
Please check more detail plots at Telemetered Photon Dose Trend page.
)
)
)
Statistics:
# IMAGE     NPIX     MEAN        RMS        MIN     MAX
ACIS_mar17 6004901       6.992         20.012           0.0     7935


I2 node 0  262654	9.000539	3.766994	0.0	 49.0
I2 node 1  262654	9.371005	21.083045	0.0	7935.0
I2 node 2  262654	9.168917	3.798017	0.0	247.0
I2 node 3  262654	9.364272	14.221922	0.0	5134.0

I3 node 0  262654	10.355807	5.139590	0.0	1167.0
I3 node 1  262654	9.938073	4.995672	0.0	175.0
I3 node 2  262654	9.467423	3.710300	0.0	 78.0
I3 node 3  262654	9.504602	4.315141	0.0	970.0

S2 node 0  262654	6.389377	7.272474	0.0	2519.0
S2 node 1  262654	6.626506	6.113922	0.0	849.0
S2 node 2  262654	7.186179	13.268574	0.0	4698.0
S2 node 3  262654	7.551269	18.671465	0.0	7593.0

S3 node 0  262654	14.151225	74.553876	0.0	3513.0
S3 node 1  262654	10.046028	8.399971	0.0	297.0
S3 node 2  262654	10.340299	9.190335	0.0	262.0
S3 node 3  262654	8.811325	6.706458	0.0	193.0
)
)
)
Statistics:
 IMAGE     NPIX      MEAN        RMS           MIN      MAX
ACIS_total   6004901       2086.174         2714.386           0.0   118900


I2 node 0  262654	1792.379139	348.586387	367.0	9878.0
I2 node 1  262654	1887.302942	482.378341	385.0	59846.0
I2 node 2  262654	9.168917	3.798017	0.0	247.0
I2 node 3  262654	1924.703022	493.780894	374.0	28342.0

I3 node 0  262654	2033.788110	500.168842	369.0	7944.0
I3 node 1  262654	2118.527080	1615.169728	369.0	45310.0
I3 node 2  262654	1855.621257	339.119315	357.0	10183.0
I3 node 3  262654	9.504602	4.315141	0.0	970.0

S2 node 0  262654	2429.255262	357.675231	1299.0	21535.0
S2 node 1  262654	6.626506	6.113922	0.0	849.0
S2 node 2  262654	2844.355955	536.917540	1704.0	27437.0
S2 node 3  262654	2783.441165	388.406206	1599.0	49349.0

S3 node 0  262654	4317.102340	1906.918950	1776.0	15451.0
S3 node 1  262654	5504.295471	2161.347825	0.0	14432.0
S3 node 2  262654	4276.468390	1076.906242	1789.0	10268.0
S3 node 3  262654	3304.387434	492.302868	1907.0	11016.0
)
|
)
|
)
|
)
|
| Dec 2016 | Sep 2016 | Jun 2016 | Mar 2016 |
|---|
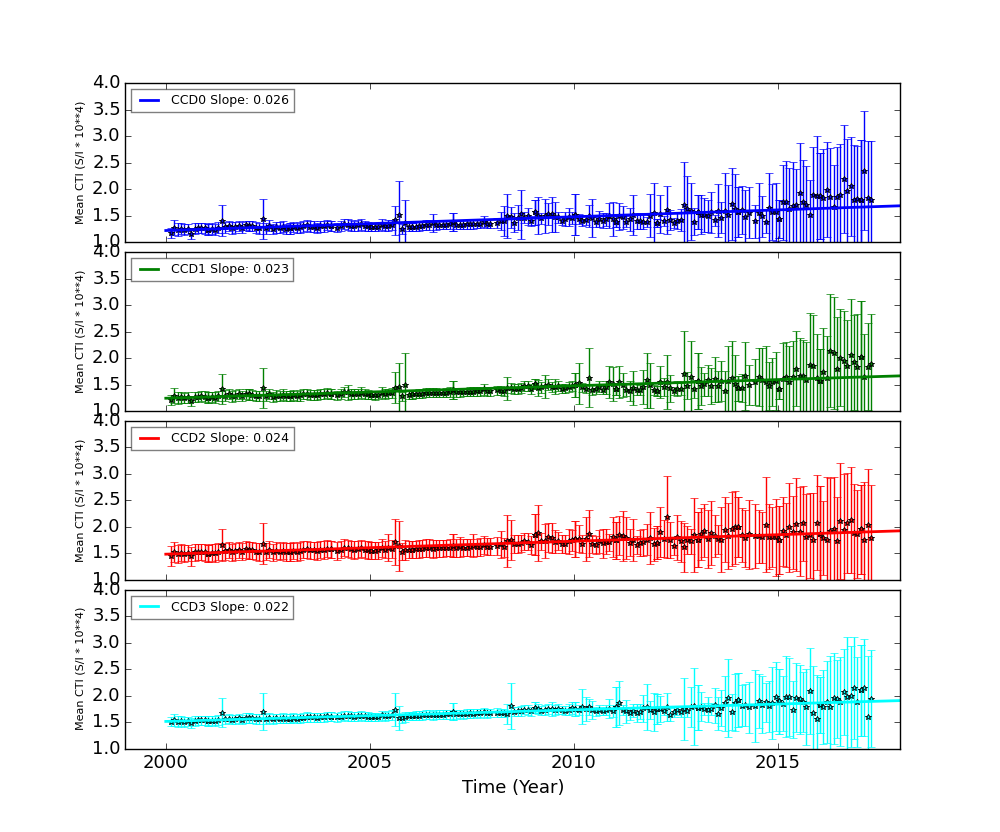
The Mean Detrended CTI
We report CTIs with a refined data definition. CTIs were computed for the temperature dependency corrected data. Please see CTI page for detailed explanation. CTI's are computed for Mn K alpha, and defined as slope/intercept x10^4 of row # vs ADU. Data file: here
Imaging CCDs
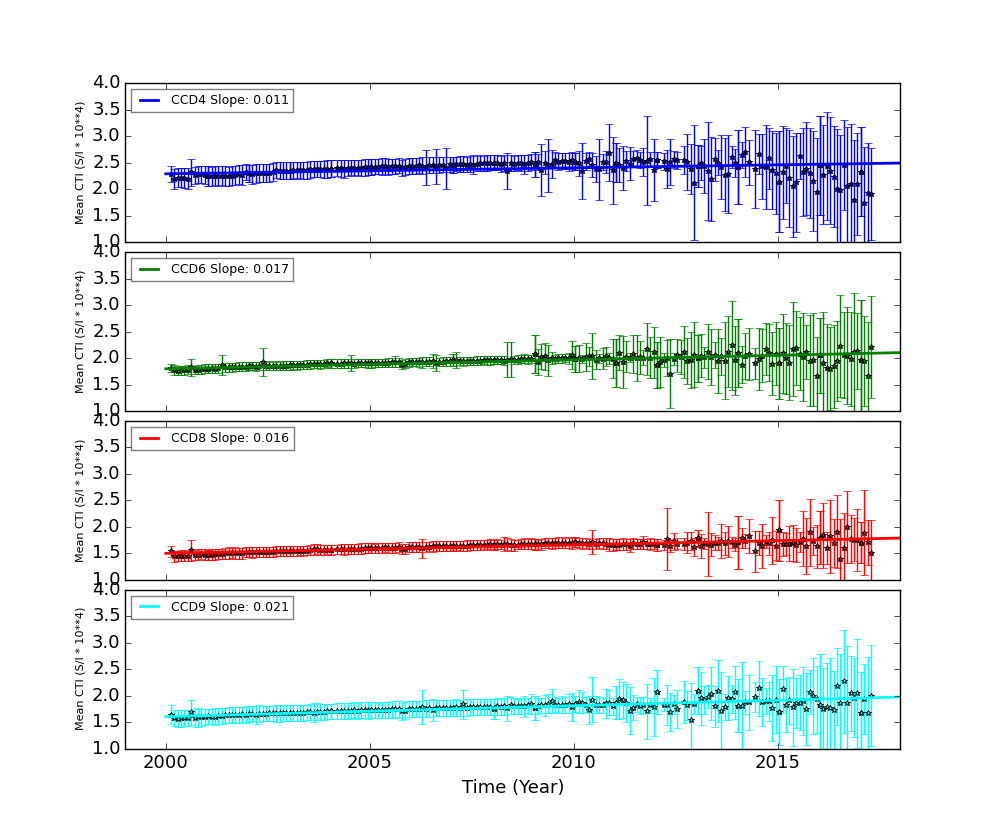
Spectral CCDs
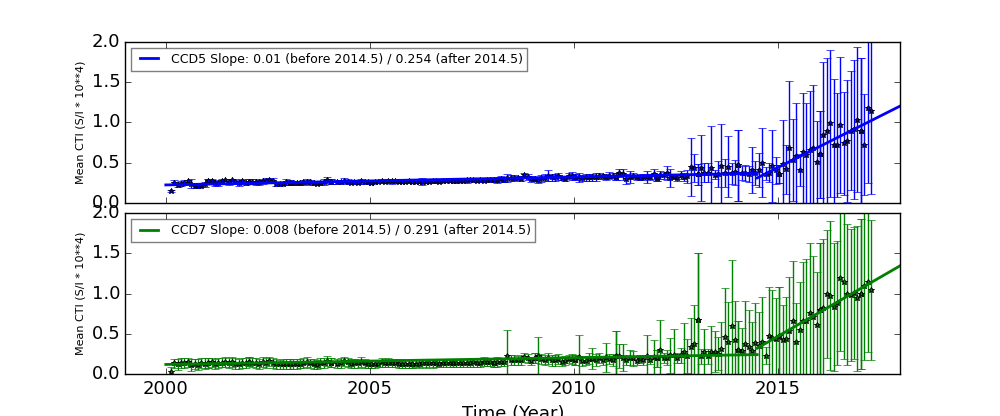
Backside CCDs
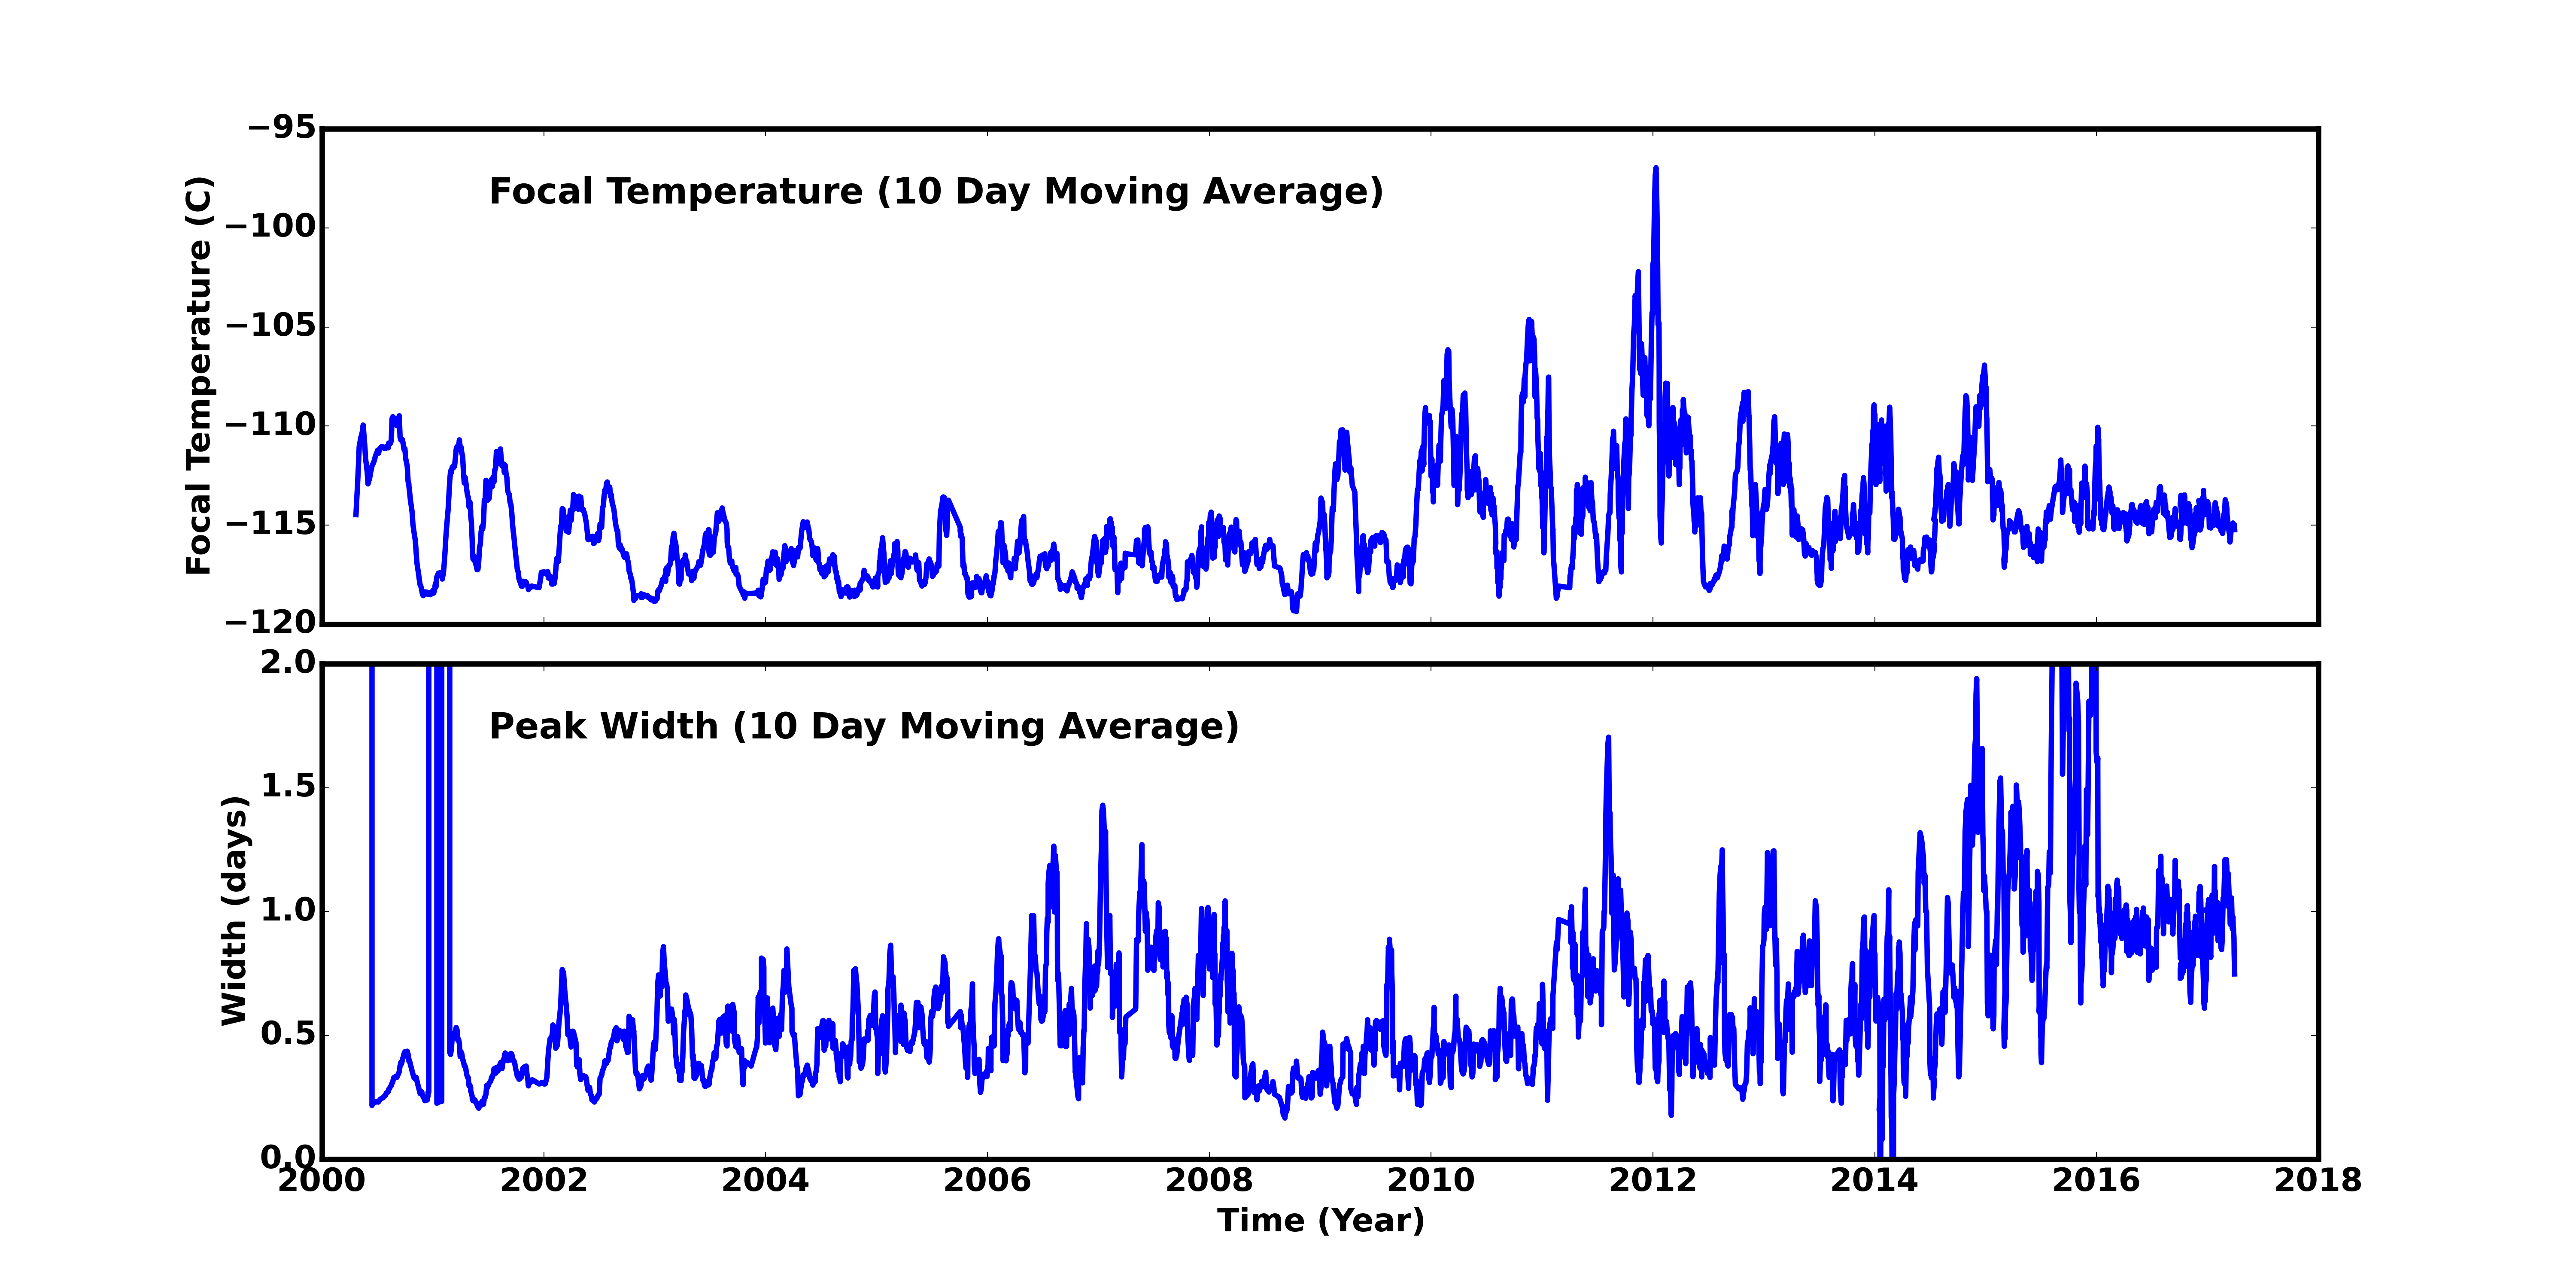
Focal Plane Temperature
Mar 2017 Focal Temperature
| The Mean (max) FPT: | |
|---|---|
| -115.44 | +/- 1.14 C |
| Mean Width: | |
| 0.91 | +/- 0.36 days |
Averaged Focal Plane Temperature
We are using 10 period moving averages to show trends of peak temperatures and peak widths. Note, the gaps in the width plot are due to missing/corrupted data.
Focal Plane Temperature, Sun Angle and Altitude
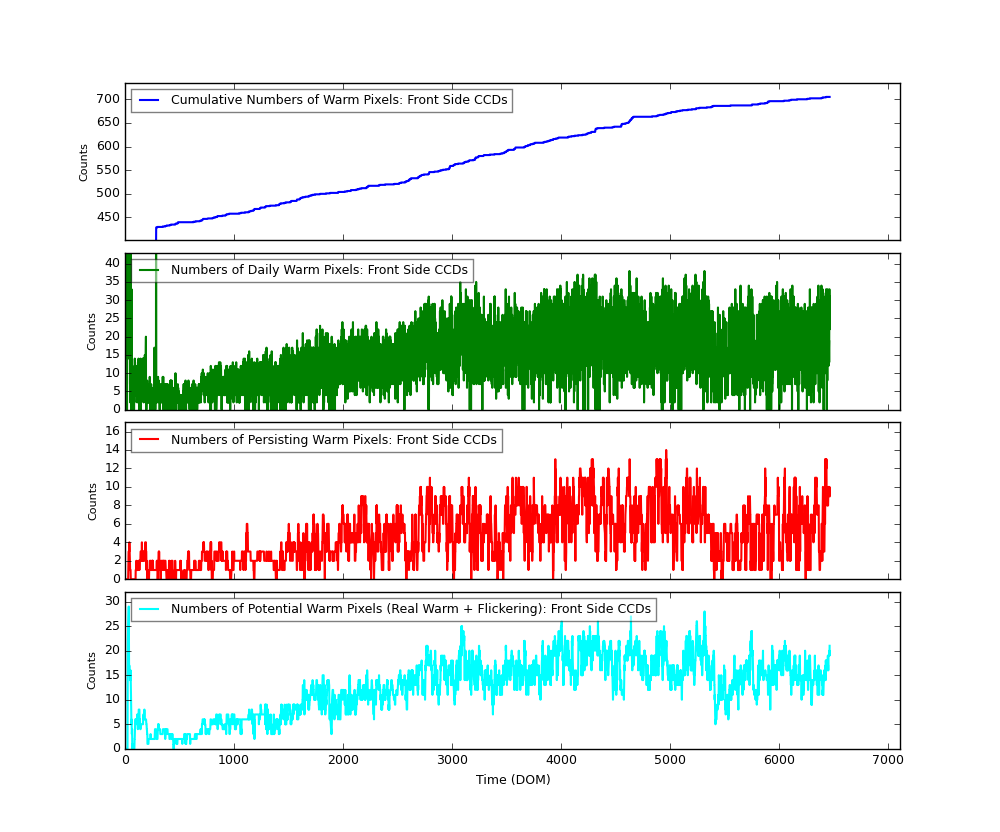
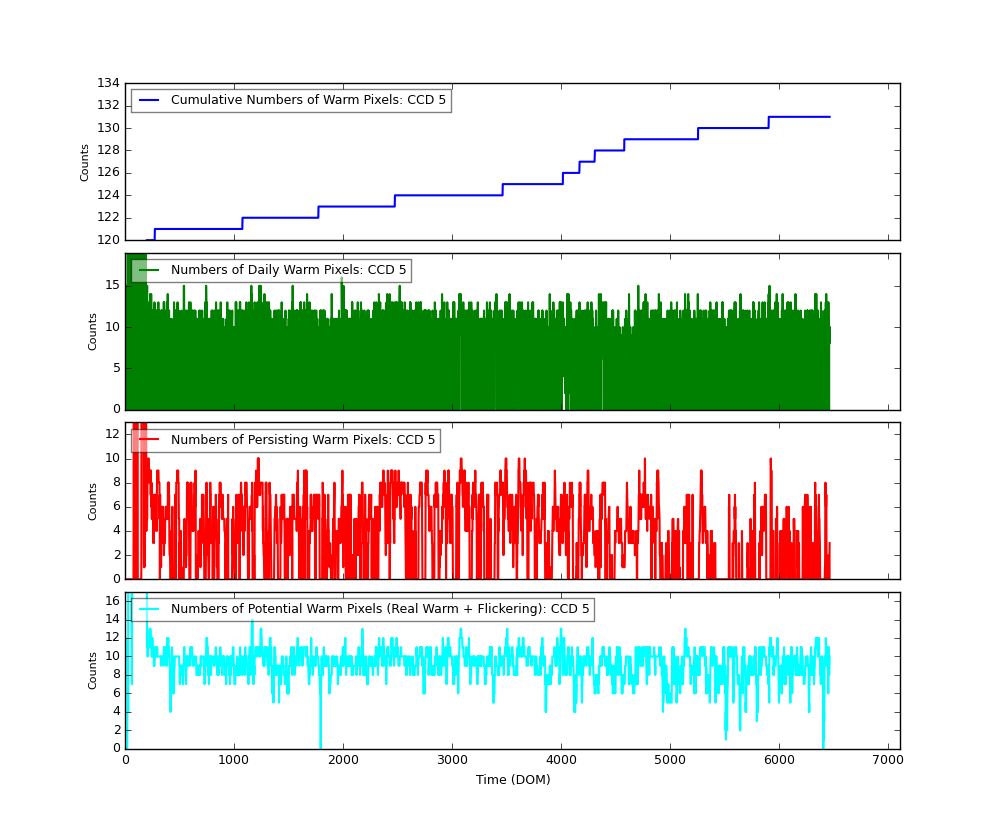
Bad Pixels
The plots below were generated with a new warm pixel finding script. Please see Acis Bad Pixel Page for details.
Front Side CCDs
Back Side CCD (CCD5)
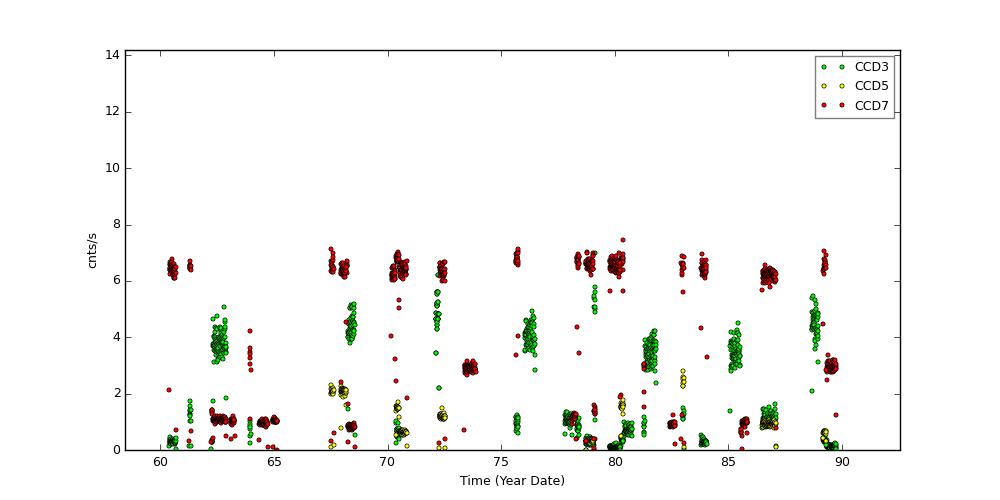
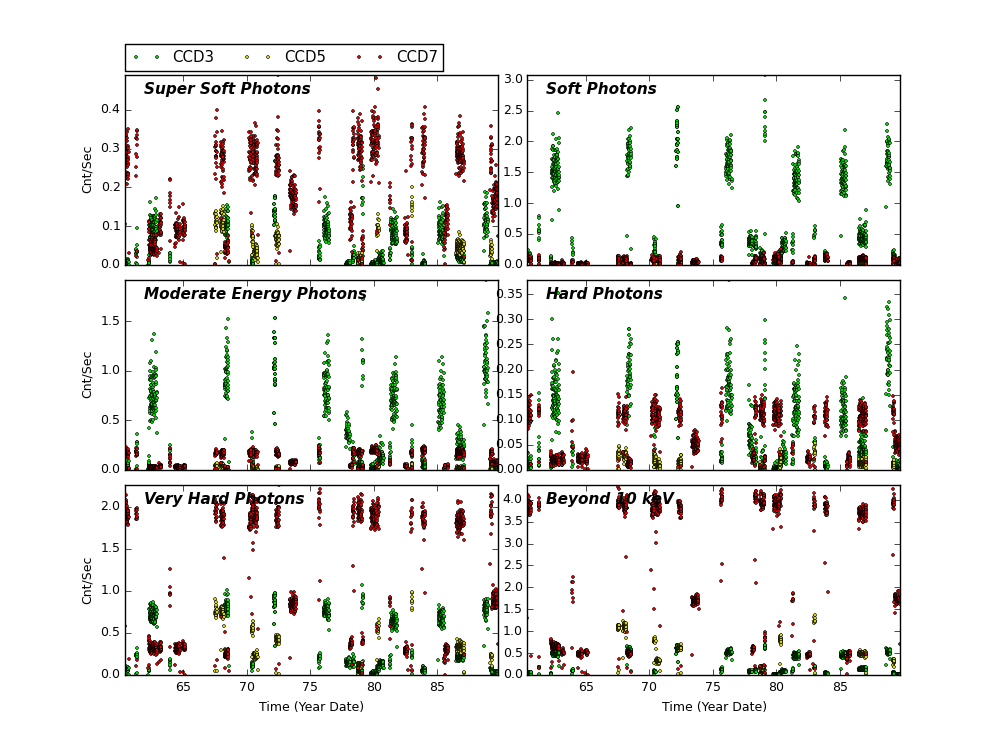
Science Instrument Background Rates
| Name | Low (keV) | High(KeV) | Description |
|---|---|---|---|
| SSoft | 0.00 | 0.50 | Super soft photons |
| Soft | 0.50 | 1.00 | Soft photons |
| Med | 1.00 | 3.00 | Moderate energy photons |
| Hard | 3.00 | 5.00 | Hard Photons |
| Harder | 5.00 | 10.00 | Very Hard photons |
| Hardest | 10.00 | Beyond 10 keV |
ACIS Rejected Events
The links below are plots of stat1 quantities, showing on-board rejected events. The average EVTSENT, DROP_AMP, DROP_POS, DROP_GRD, THR_PIX, and maximum BERR_SUM obtained from L1 acis*stat1.fits files are plotted for each observation. CTI observations are plotted separately from regular science observations.
Column definitions:
- EVTSENT - number of events sent in data record
- DROP_AMP - number of discarded events due to corrected amplitude
- DROP_POS - number of discarded events due to CCD position
- DROP_GRD - number of discarded events due to grade code
- THR_PIX - number of pixels above respective threshold level
- BERR_SUM - number of pixel bias errors so far in science run
Note the half-life decline of the CTI source is clearly evidenced in the steady janline of EVTSENT.
CCD3 CTI Observations
CCD3 Science Observations
CCD7 CTI Observations
CCD7 Science Observations
ACIS Gain Trends
We computed ACIS gain and offset from ACIS event1 files used in CTI computation, following the step described by C. Grant ACIS gain @ -120C page.
Instead computing gains and offsets from individual observations, we combined all data from each month and computed an monthly averaged gain and offset.
The following plots show CCD3 and CCD5 gains and offset trends.
| CCD 3 | |
)
|
)
|
| CCD 5 | |
)
|
)
|
[an error occurred while processing this directive]
HRC
DOSE of Central 4K Pore-Pairs
Please refer to Maximum Dose Trends for more details.
)
|
|---|
IMAGE                NPIX      MEAN    STDDEV      MIN       MAX
HRCI_03_2017.fits  16777216	0.184 	0.444 	0.000 	9.000
)
IMAGE                       NPIX      MEAN    STDDEV      MIN       MAX
HRCI_08_1999_03_2017.fits  16777216	4.806 	5.163 	0.000 	292.000
)
|
|---|
IMAGE                NPIX      MEAN    STDDEV      MIN       MAX
HRCS_03_2017.fits  16777216	0.057 	0.253 	0.000 	6.000
)
IMAGE                       NPIX      MEAN    STDDEV      MIN       MAX
HRCS_08_1999_03_2017.fits  16777216	16.375 	29.297 	0.000 	1705.000
|
|
Max dose trend plots corrected for events that "pile-up"
in the center of the taps due to bad position information.
|
)
|
)
|
)
|
)
|
| Dec 2016 | Sep 2016 | Jun 2016 | Mar 2016 |
|---|
)
|
)
|
)
|
)
|
| Dec 2016 | Sep 2016 | Jun 2016 | Mar 2016 |
|---|
Gratings
Focus
We plot the width of the zero order streak of ACIS/HETG observations and the width of the zero order image for HRC/LETG observations of point sources. No significant defocusing trend is seen at this time. See Gratings Focus pages.
PCAD
ACA Trending
Gyro Bias Drift
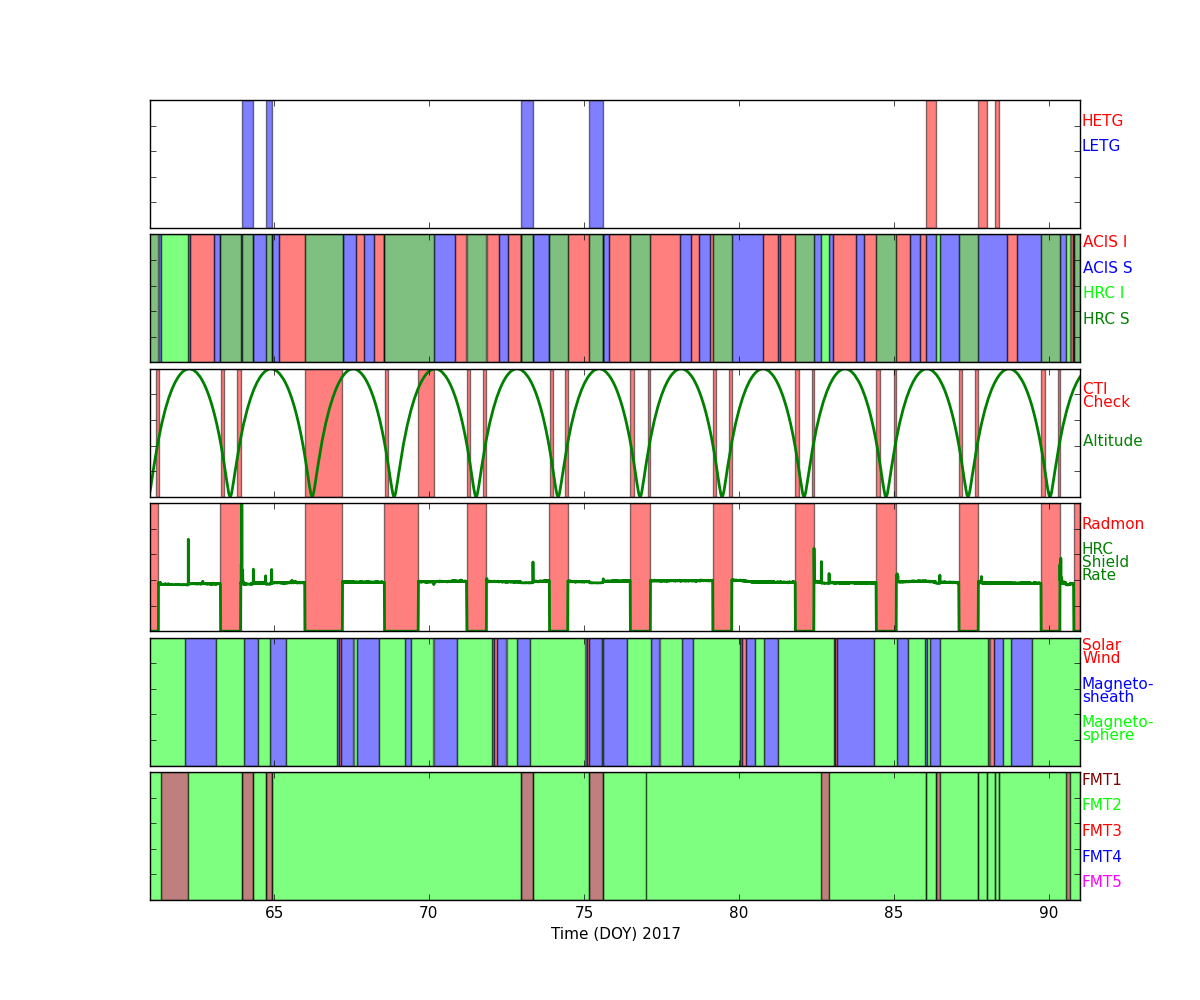
Radiation History
Radiation Zone Timing
Plotted below are radiation zone timing plots based on the following definitions of radiation zone:
- RADZONE - Ephin levels (in any of the E1300,P4GM,P41GM channels) are more than 1/3 of RADMON safing thresholds.
- RADMON - Radmon is disabled for radiation zone (as commanded based on OFLS model, for comparison with actual radiation levels).
- PERIGEE - Time of closest earth approach (for comparison)
Radiation Count Rates of Mar 2017
Sun Spot History
-->
Trending
Critical Trends
| ACIS Temperatures - Daily Maximums | ||||||
|---|---|---|---|---|---|---|
| MSID | MEAN | RMS | DELTA/YR | DELTA/YR/YR | UNITS | DESCRIPTION |
| 1PDEAAT | 305.56 | 8.95 | 2.074e-01 | 6.635e-01 | K | PSMC DEA PS A TEMP |
| 1PIN1AT | 295.31 | 12.77 | 2.338e+00 | 3.320e+00 | K | PSMC TEMP 1A |
)
)
| HRMA Computed Averages - Daily Maximums | ||||||
|---|---|---|---|---|---|---|
| MSID | MEAN | RMS | DELTA/YR | DELTA/YR/YR | UNITS | DESCRIPTION |
| OBAAVG | 293.50 | 1.74 | 1.332e+00 | -1.006e+00 | TEMP | OBA/TFTE |
)
| EPHIN Temperatures - Daily Maximums | ||||||
|---|---|---|---|---|---|---|
| MSID | MEAN | RMS | DELTA/YR | DELTA/YR/YR | UNITS | DESCRIPTION |
| TEIO | 330.85 | 20.90 | 3.544e+00 | -1.567e+00 | K | EPHIN ELECTRONICS HOUSING TEMP |
| TEPHIN | 334.49 | 6.49 | 1.096e+00 | -6.892e-01 | K | EPHIN SENSOR HOUSING TEMP |
)
)
| S/C Main Temperatures - Daily Maximums | ||||||
|---|---|---|---|---|---|---|
| MSID | MEAN | RMS | DELTA/YR | DELTA/YR/YR | UNITS | DESCRIPTION |
| TCYLFMZM | 306.62 | 25.17 | 1.548e+00 | 5.762e+00 | K | CNT CYL TEMP:-Z SIDE UNDER LAE-1 |
| TCYLFMZP | 308.68 | 23.95 | 1.454e+00 | 5.319e+00 | K | CNT CYL TEMP:-Z SIDE UNDER LAE-2 |
)
)
| S/C Ancillary Temperatures - Daily Maximums | ||||||
|---|---|---|---|---|---|---|
| MSID | MEAN | RMS | DELTA/YR | DELTA/YR/YR | UNITS | DESCRIPTION |
| TFSSBKT1 | 343.83 | 19.73 | 6.930e-01 | 2.534e+00 | K | FSS BRACKET-1 TEMP (+Y) |
| TFSSBKT2 | 339.02 | 26.12 | 1.576e+00 | 7.564e-01 | K | FSS BRACKET-2 TEMP (+Y) |
| TSCTSF1 | 305.04 | 3.94 | 2.236e+00 | -1.401e+00 | K | SC-TS FITTING -1 TEMP |
| TSCTSF6 | 307.04 | 4.32 | 2.222e+00 | 5.796e-02 | K | SC-TS FITTING -6 TEMP |
)
)
)
)
| MUPS - Daily Maximums | ||||||
|---|---|---|---|---|---|---|
| MSID | MEAN | RMS | DELTA/YR | DELTA/YR/YR | UNITS | DESCRIPTION |
| PM1THV1T | 333.47 | 8.23 | -2.762e-01 | -1.892e+02 | K | MUPS 1 THRUSTER VALVE 01 TEMP |
| PLINE02T | 317.64 | 11.13 | 3.347e+00 | 5.826e+00 | K | PROP LINE TEMP 02 |
| PLINE03T | 316.64 | 13.64 | 3.278e+00 | 7.846e+00 | K | PROP LINE TEMP 03 |
| PLINE04T | 302.24 | 12.73 | 3.233e+00 | 7.055e+00 | K | PROP LINE TEMP 04 |
)
)
)
)
Quarterly Trends
- PCAD FTS Temperature and Gradient
| Previous Quarter | ||||||
| MSID | MEAN | RMS | DELTA/YR | DELTA/YR/YR | UNITS | DESCRIPTION |
| OHRTHR27 | 297.16 | 1.160e-02 | 5.988e-02 | -2.042e-01 | K | RT 20 : PERISCOPE |
| OHRTHR42 | 294.93 | 0.19 | 8.053e-01 | -7.350e+00 | K | RT 133: PERISCOPE |
| OHRTHR43 | 295.13 | 0.27 | 9.894e-01 | -8.861e+00 | K | RT 134: PERISCOPE |
| OOBAGRD3 | -0.27 | 8.585e-02 | -1.403e-01 | 1.620e+00 | K | RT 505 TO RT 504: PERISCOPE GRADIENT |
| OOBAGRD6 | 0.08 | 5.662e-03 | 1.676e-02 | -2.420e-01 | K | RT 507 TO RT 506: PERISCOPE GRADIENT |
)
)
)
)
)
- SIM Temperature
| Previous Quarter | ||||||
| MSID | MEAN | RMS | DELTA/YR | DELTA/YR/YR | UNITS | DESCRIPTION |
| 3BTU_BPT | 266.52 | 6.72 | 7.553e+00 | -8.683e-12 | K | BTU BASEPLATE (+X)), ABORT HTR TSC2 |
| 3TSMXCET | 246.09 | 3.656e+01 | -4.347e+01 | 1.409e-11 | K | -X TURTLE SHELL NR HRC CEA |
| 3TSMXSPT | 286.50 | 3.345e+01 | -4.190e+01 | 2.719e-11 | K | -X TURTLE SHELL NR ACIS SS |
| BOXTEMP | 282.63 | 1.78 | 2.818e+00 | -1.819e-12 | K | SEA box temperature (3FASEAAT) |
| FAMTRTEMP | 273.54 | 2.56 | 4.317e+00 | -2.193e-12 | K | FA motor temperature |
| FLEXATEMP | 272.17 | 2.68 | 3.560e+00 | 5.529e-13 | K | Flexure A temperature (3FAFLAAT) |
| PSUTEMP | 311.29 | 1.45 | 3.733e+00 | -1.626e-12 | K | SEA power supply temperature (3FAPSAT) |
| TSCMTRTEMP | 273.40 | 18.91 | 3.130e+01 | -1.958e-11 | K | TSC motor temperature |
)
)
)
)
)
)
)
)
- SIIM Electronics
| Previous Quarter | ||||||
| MSID | MEAN | RMS | DELTA/YR | DELTA/YR/YR | UNITS | DESCRIPTION |
| AGRNDADC | 1.058e-04 | 2.090e-04 | -3.125e-04 | -1.528e-02 | V | Analog ground A/D convert reading |
| FATABADC | 5.00 | 2.402e-03 | -4.431e-03 | -2.284e-01 | Converter | FA Tab Position Sensor A/D |
| N15VADC | -15.01 | 5.617e-04 | -9.476e-04 | -1.364e-02 | Reading | -15V Power Supply A/D Converter |
| P15VADC | 14.96 | 5.727e-04 | -1.366e-03 | -4.406e-02 | Reading | +15V Power Supply A/D Converter |
| P5VADC | 4.99 | 2.530e-02 | -5.379e-02 | -2.459e+00 | Reading | +5V Power Supply A/D Converter |
| TSCTABADC | 5.00 | 4.715e-03 | -1.139e-02 | -4.045e-01 | converter | TSC Tab Position Sensor A/D |
)
)
)
)
)
)
Envelope Trending
Spacecraft Motions
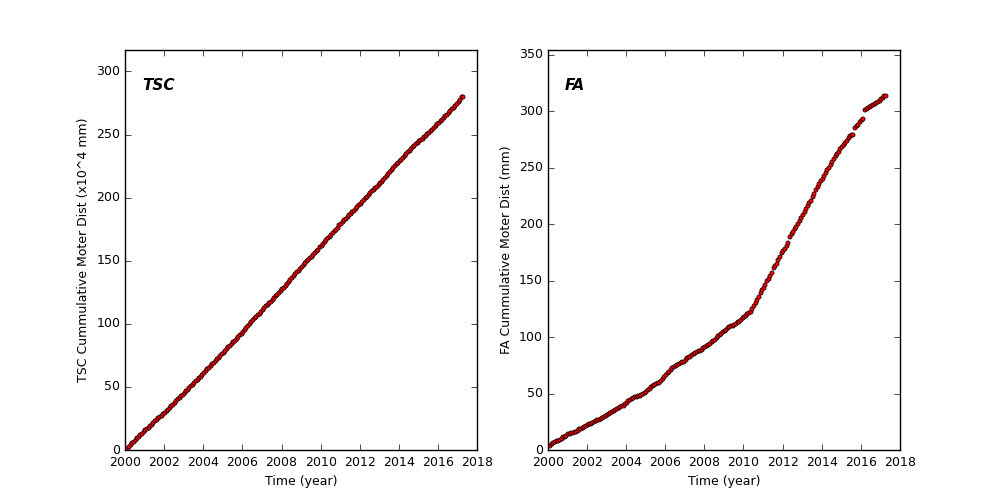
TSC and FA Cummulative Moter Distance
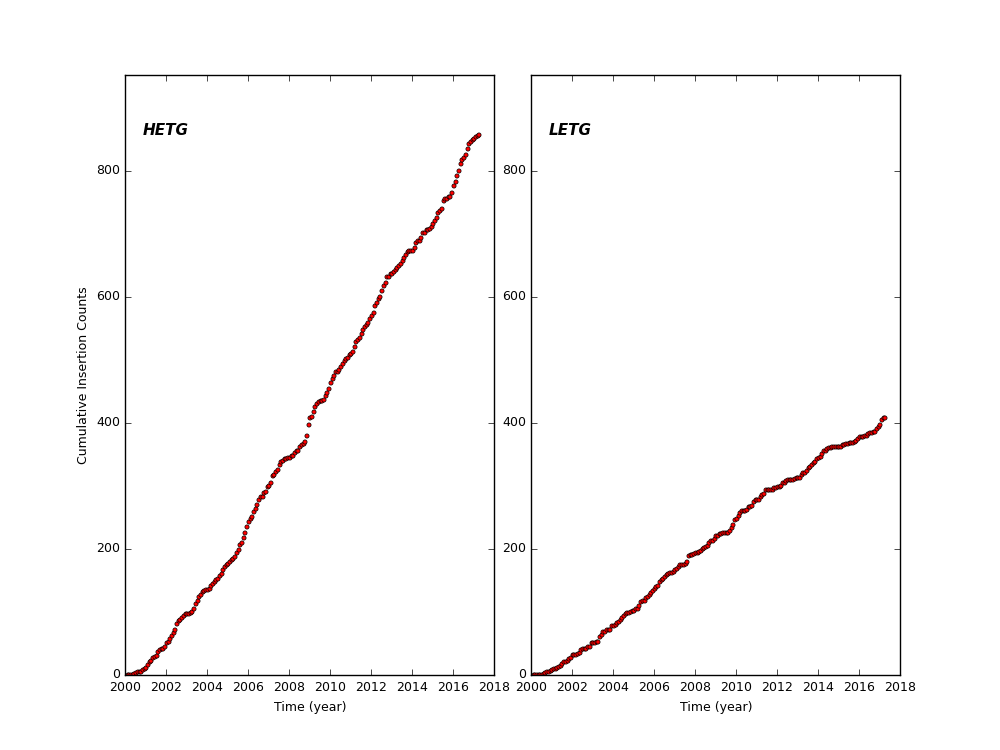
HETG and LETG Cummulative Insertion Counts
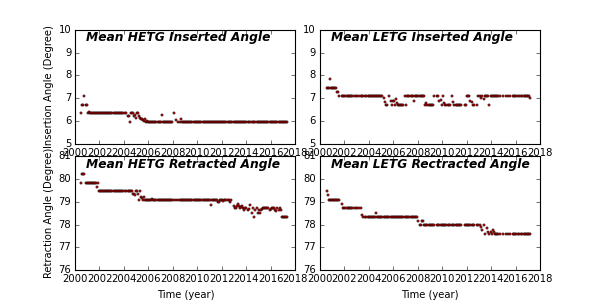
HETG/LETG Insertion/Retraction Angle
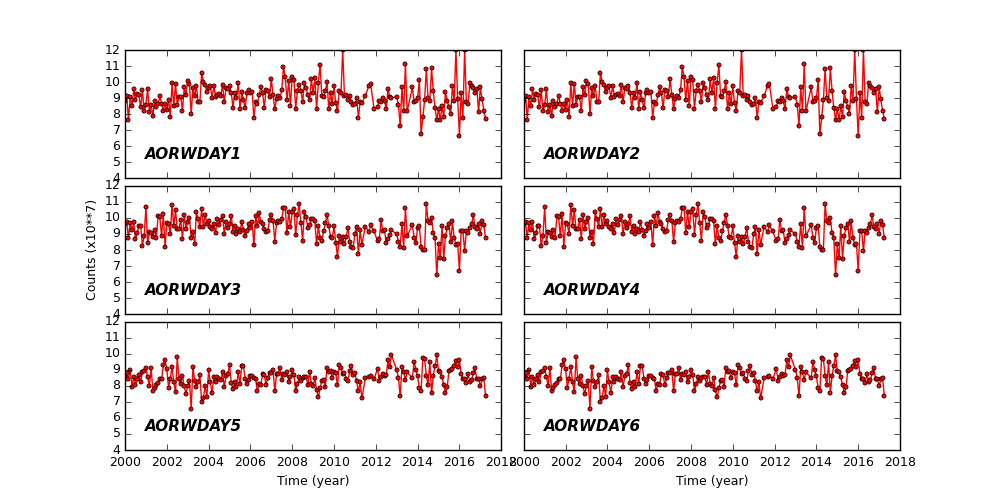
Reaction Wheel Rotations
Links to Past Monthly Reports
| Year | Month | |||||||||||
|---|---|---|---|---|---|---|---|---|---|---|---|---|
| 2017 | Jan | Feb | ||||||||||
| 2016 | Jan | Feb | Mar | Apr | May | Jun | Jul | Aug | Sep | Oct | Nov | Dec |
| 2015 | Jan | Feb | Mar | Apr | May | Jun | Jul | Aug | Sep | Oct | Nov | Dec |
| 2014 | Jan | Feb | Mar | Apr | May | Jun | Jul | Aug | Sep | Oct | Nov | Dec |
| 2013 | Jan | Feb | Mar | Apr | May | Jun | Jul | Aug | Sep | Oct | Nov | Dec |
| 2012 | Jan | Feb | Mar | Apr | May | Jun | Jul | Aug | Sep | Oct | Nov | Dec |
| 2011 | Jan | Feb | Mar | Apr | May | Jun | Jul | Aug | Sep | Oct | Nov | Dec |
| 2010 | Jan | Feb | Mar | Apr | May | Jun | Jul | Aug | Sep | Oct | Nov | Dec |
| 2009 | Jan | Feb | Mar | Apr | May | Jun | Jul | Aug | Sep | Oct | Nov | Dec |
| 2008 | Jan | Feb | Mar | Apr | May | Jun | Jul | Aug | Sep | Oct | Nov | Dec |
| 2007 | Jan | Feb | Mar | Apr | May | Jun | Jul | Aug | Sep | Oct | Nov | Dec |
| 2006 | Jan | Feb | Mar | Apr | May | Jun | Jul | Aug | Sep | Oct | Nov | Dec |
| 2005 | Jan | Feb | Mar | Apr | May | Jun | Jul | Aug | Sep | Oct | Nov | Dec |
| 2004 | Jan | Feb | Mar | Apr | May | Jun | Jul | Aug | Sep | Oct | Nov | Dec |
| 2003 | Jan | Feb | Mar | Apr | May | Jun | Jul | Aug | Sep | Oct | Nov | Dec |
| 2002 | Jan | Feb | Mar | Apr | May | Jun | Jul | Aug | Sep | Oct | Nov | Dec |
| 2001 | Jan | Feb | Mar | Apr | May | Jun | Jul | Aug | Sep | Oct | Nov | Dec |
| 2000 | Jan | Feb | Mar | Apr | May | Jun | Jul | Aug | Sep | Oct | Nov | Dec |
| 1999 | Jul | Aug | Sep | Oct | Nov | Dec | ||||||