ACIS
ACIS DOSE Registered-Photon-Map
The steps we took to compute the dose map are;
- Level 1 Event files for a specified month are obtained from archive.
- Image data including I2, I3, S2, S3 CCDs are extracted from all event files.
- All the extracted image data were merged to create a month long exposure map for the month.
- The exposure map is opened with ds9, and check a distribution of count rates against energy. From this, estimate the upper threshold value. Any events beyond this upper threshold are assumed erroneous events such as bad pixels.
- Using this upper threshold, the data is filtered, and create a cleaned exposure map for the month.
- The exposure map from each month from the Sep 1999 is added up to create a cumulative exposure map for each month.
- Using fimgstatistic, we compute count rate statistics for each CCDs.
- For observations with high data drop rates (e.g., Crab nebula, Cas A), we corrected the observations by adding events.
Please check more detail plots at Telemetered Photon Dose Trend page.
)
)
)
Statistics:
# IMAGE     NPIX     MEAN        RMS        MIN     MAX

ACIS_oct16 6004901   10.808      18.050     0.0     6060


I2 node 0  262654    7.967936    3.494292   0.0   57.0
I2 node 1  262654    8.688127   10.118819   0.0 4673.0
I2 node 2  262654   11.279079    7.035329   0.0   69.0
I2 node 3  262654   13.632164   21.865968   0.0 6035.0

I3 node 0  262654   13.194778    9.646714   0.0 1673.0
I3 node 1  262654   10.886466   12.104625   0.0  281.0
I3 node 2  262654    8.750672    3.649580   0.0   83.0
I3 node 3  262654    8.712252    5.025173   0.0 1232.0

S2 node 0  262654   10.493635    7.474879   0.0 1822.0
S2 node 1  262654   10.783022    6.683305   0.0  501.0
S2 node 2  262654   12.423717   15.661631   0.0 6060.0
S2 node 3  262654   12.877674   13.393162   0.0  686.0

S3 node 0  262654   16.655840   16.501415   0.0  333.0
S3 node 1  262654   32.925778   26.387993   0.0  392.0
S3 node 2  262654   36.854239   33.116528   0.0  233.0
S3 node 3  262654   13.998245   10.703456   0.0  176.0
)
)
)
Statistics:
 IMAGE     NPIX      MEAN        RMS           MIN      MAX

ACIS_total 6004901   2049.973    2670.199      0.0   117108

I2 node 0  262654   1751.187305 338.620501    357.0   9587.0
I2 node 1  262654   1844.729561 468.118184    371.0  54059.0
I2 node 2  262654     11.279079   7.035329      0.0     69.0
I2 node 3  262654   1880.767846 480.421426    360.0  28286.0

I3 node 0  262654   1985.961381  484.405064   359.0   7750.0
I3 node 1  262654   2072.615391 1580.837081   358.0  39342.0
I3 node 2  262654   1813.556460  330.048974   345.0   9873.0
I3 node 3  262654      8.712252    5.025173     0.0   1232.0

S2 node 0  262654   2389.412810  349.665948  1279.0  21487.0
S2 node 1  262654     10.783022    6.683305     0.0    501.0
S2 node 2  262654   2798.911294  532.022664  1686.0  27413.0
S2 node 3  262654   2734.759487  384.630165  1583.0  48284.0

S3 node 0  262654   4250.397936 1867.861589  1756.0  13920.0
S3 node 1  262654   5444.166118 2152.412136     0.0  14381.0
S3 node 2  262654   4219.301030 1069.145349  1753.0  10140.0
S3 node 3  262654   3254.593927  489.144277  1874.0  10929.0
)
|
)
|
)
|
)
|
| Jul 2016 | Apr 2016 | Jan 2016 | Oct 2015 |
|---|
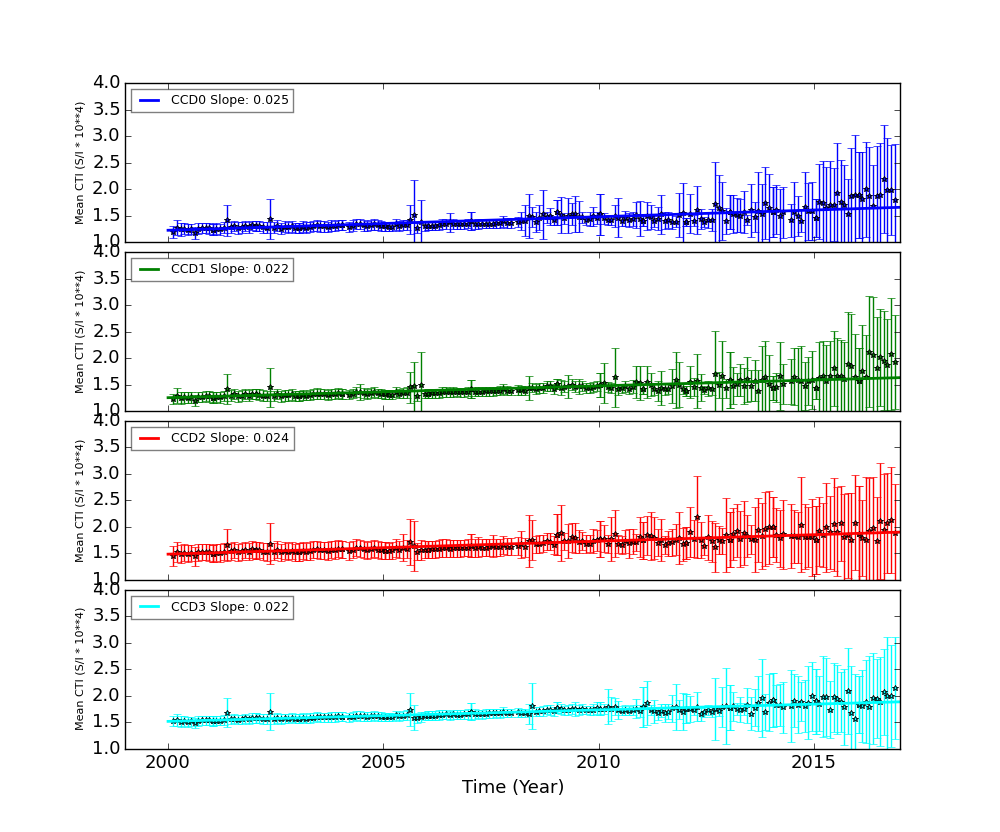
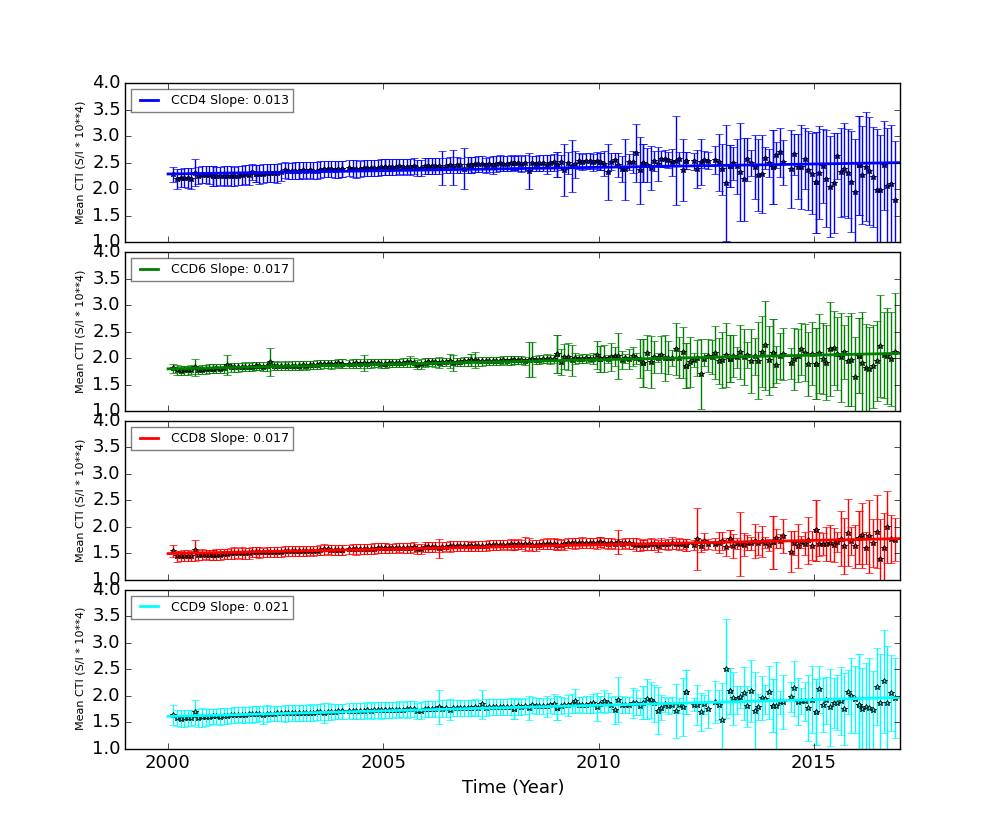
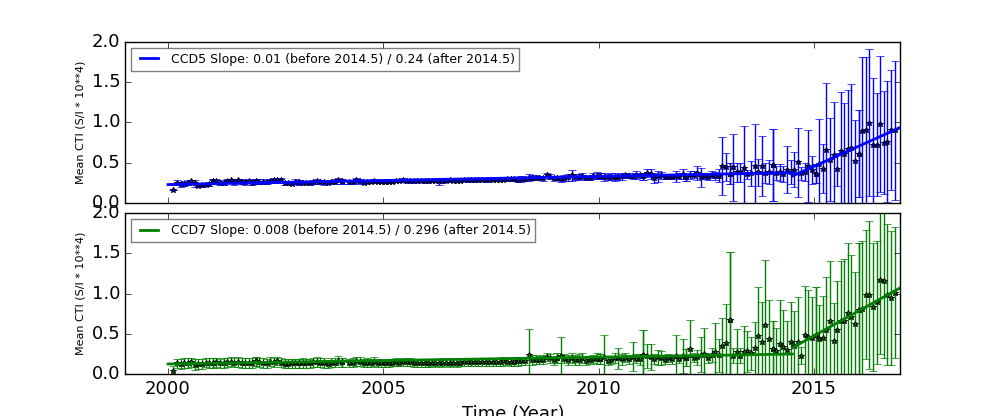
The Mean Detrended CTI
We report CTIs with a refined data definition. CTIs were computed for the temperature dependency corrected data. Please see CTI page for detailed explanation. CTI's are computed for Mn K alpha, and defined as slope/intercept x10^4 of row # vs ADU. Data file: here
Imaging CCDs
Spectral CCDs
Backside CCDs
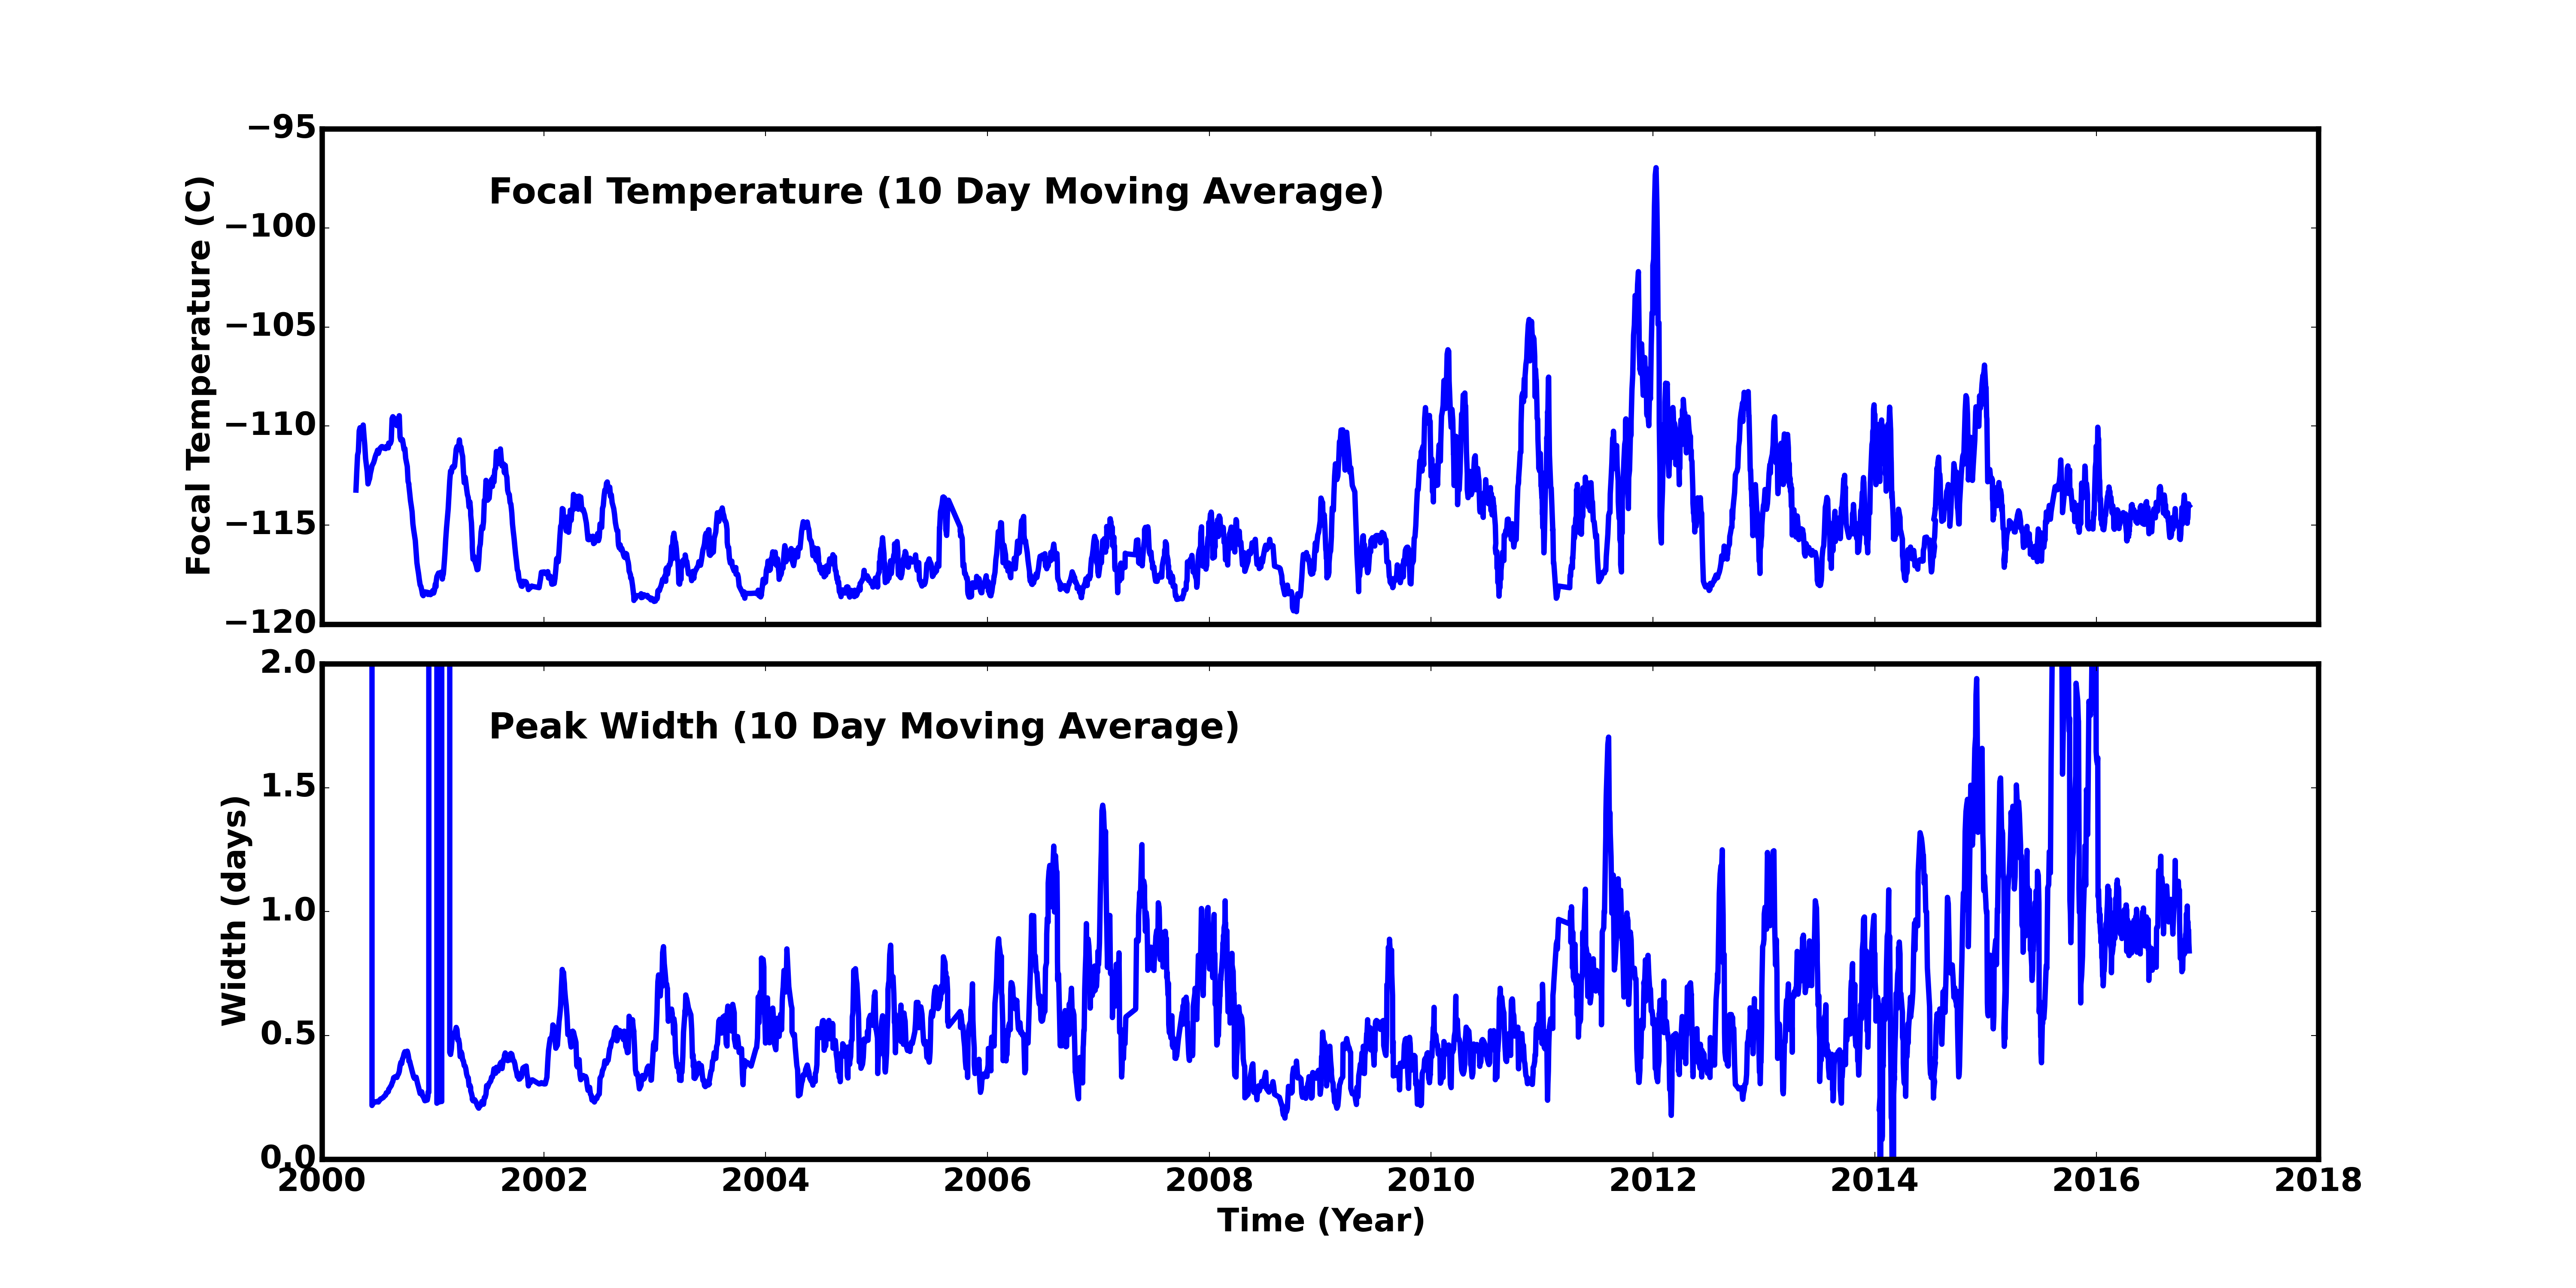
Focal Plane Temperature
Oct 2016 Focal Temperature
| The Mean (max) FPT: | |
|---|---|
| -114.11 | +/- 2.62 C |
| Mean Width: | |
| 0.86 | +/- 0.33 days |
Averaged Focal Plane Temperature
We are using 10 period moving averages to show trends of peak temperatures and peak widths. Note, the gaps in the width plot are due to missing/corrupted data.
Focal Plane Temperature, Sun Angle and Altitude
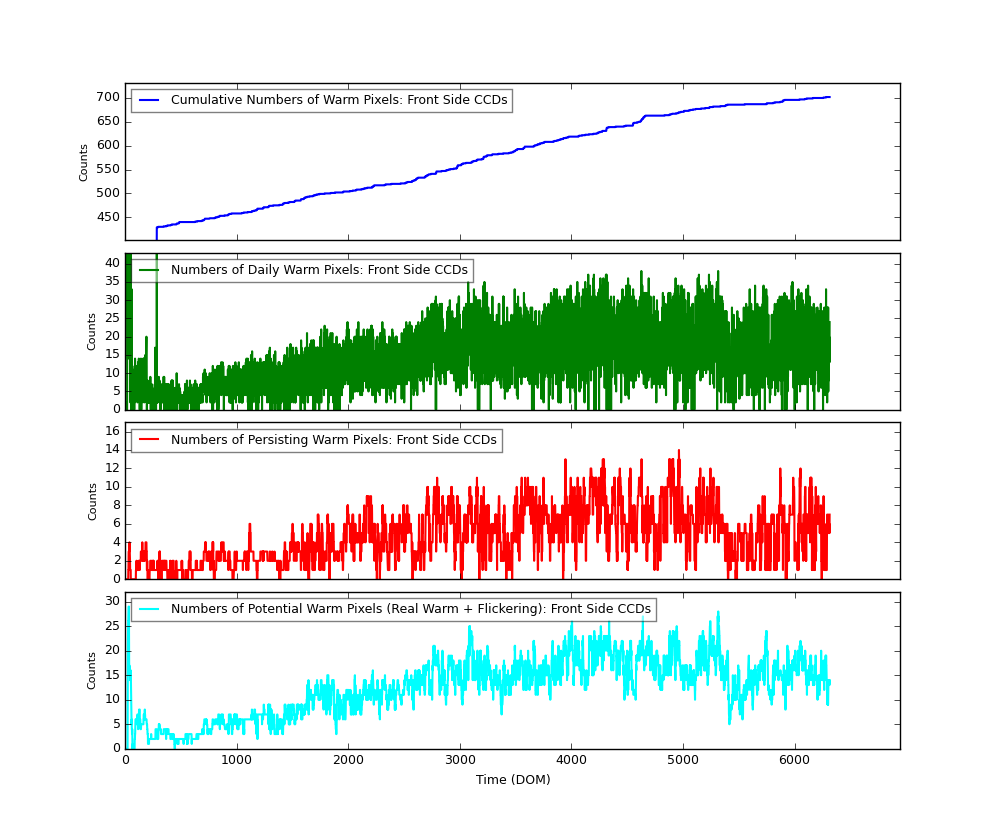
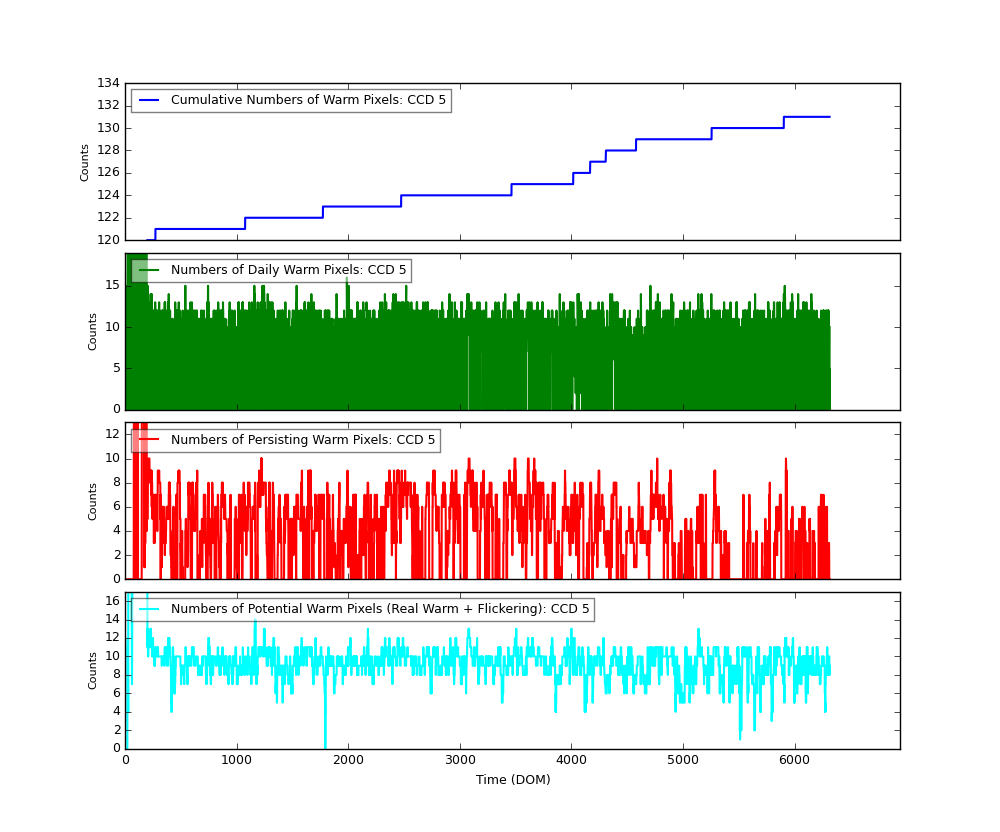
Bad Pixels
The plots below were generated with a new warm pixel finding script. Please see Acis Bad Pixel Page for details.
Front Side CCDs
Back Side CCD (CCD5)
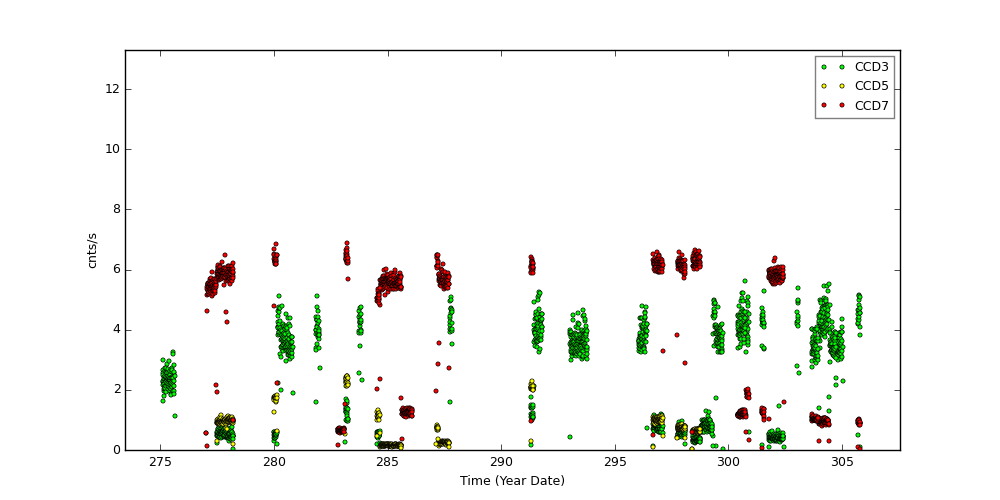
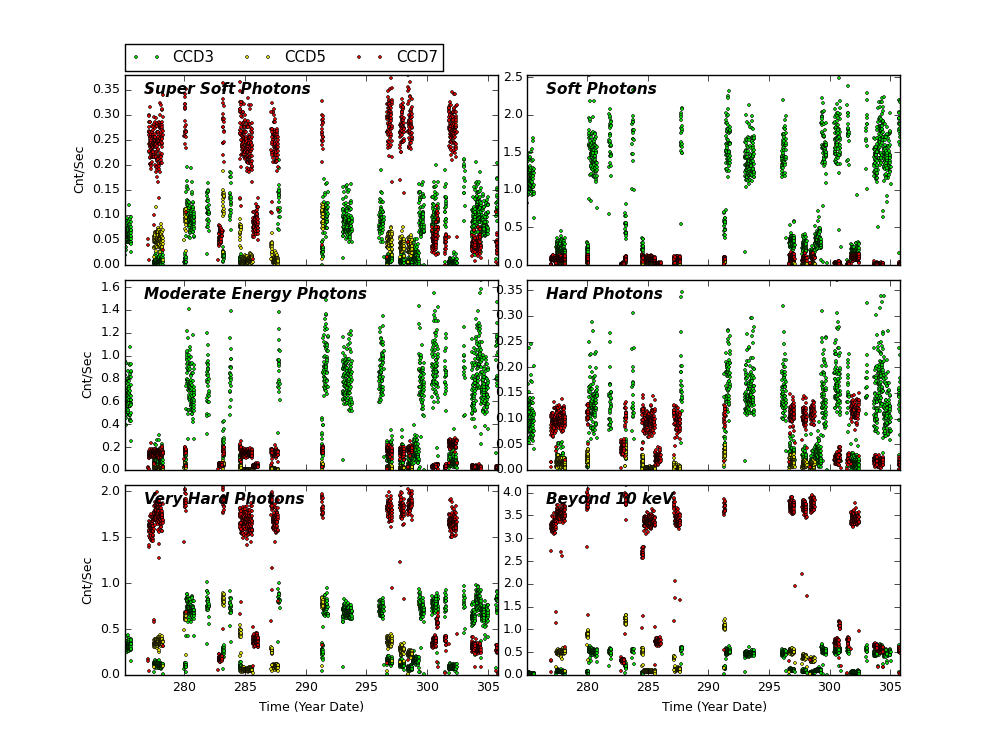
Science Instrument Background Rates
| Name | Low (keV) | High(KeV) | Description |
|---|---|---|---|
| SSoft | 0.00 | 0.50 | Super soft photons |
| Soft | 0.50 | 1.00 | Soft photons |
| Med | 1.00 | 3.00 | Moderate energy photons |
| Hard | 3.00 | 5.00 | Hard Photons |
| Harder | 5.00 | 10.00 | Very Hard photons |
| Hardest | 10.00 | Beyond 10 keV |
[an error occurred while processing this directive]
HRC
DOSE of Central 4K Pore-Pairs
Please refer to Maximum Dose Trends for more details.
)
|
|---|
        IMAGE                NPIX      MEAN    STDDEV      MIN       MAX
HRCI_10_2016.fits          16777216   0.008    0.0921      0.0       6.0
)
        IMAGE                NPIX      MEAN    STDDEV      MIN       MAX
HRCI_08_1999_10_2016.fits  16777216   4.525    5.035       0.0       292.0
)
|
|---|
     IMAGE                NPIX      MEAN    STDDEV      MIN       MAX
HRCS_10_2016.fits         16777216  0.011   0.1079      0.0       3.0
)
        IMAGE                NPIX     MEAN      STDDEV      MIN      MAX
HRCS_08_1999_10_2016.fits  16777216  16.037     28.593      0.0      1701.0
|
|
Max dose trend plots corrected for events that "pile-up"
in the center of the taps due to bad position information.
|
)
|
)
|
)
|
)
|
| Jul 2016 | Apr 2016 | Jan 2016 | Oct 2015 |
|---|
)
|
)
|
)
|
)
|
| Jul 2016 | Apr 2016 | Jan 2016 | Oct 2015 |
|---|
Gratings
Focus
We plot the width of the zero order streak of ACIS/HETG observations and the width of the zero order image for HRC/LETG observations of point sources. No significant defocusing trend is seen at this time. See Gratings Focus pages.
Gratings Resolving Power
We plot E/dE vs. E for fits to detected lines with fwhm_error/fwhm less than 0.15 for the plus and minus arms of HEG, MEG, and LEG. Also shown are conservative (dotted line) and optimistic (dashed line) pre-launch resolving power expectations.
We have selected only calibration observations of Capella, HR1099, and Sigma Gem. See MIT technotes for a parallel analysis.
| Plot symbol indicates dispersion arm: | Color indicates observation date: |
Minus side = cross (x) |
2002-2004 blue 2005-2006 yellow 2007-2009 orange |
PCAD
ACA Trending
Gyro Bias Drift
Radiation History
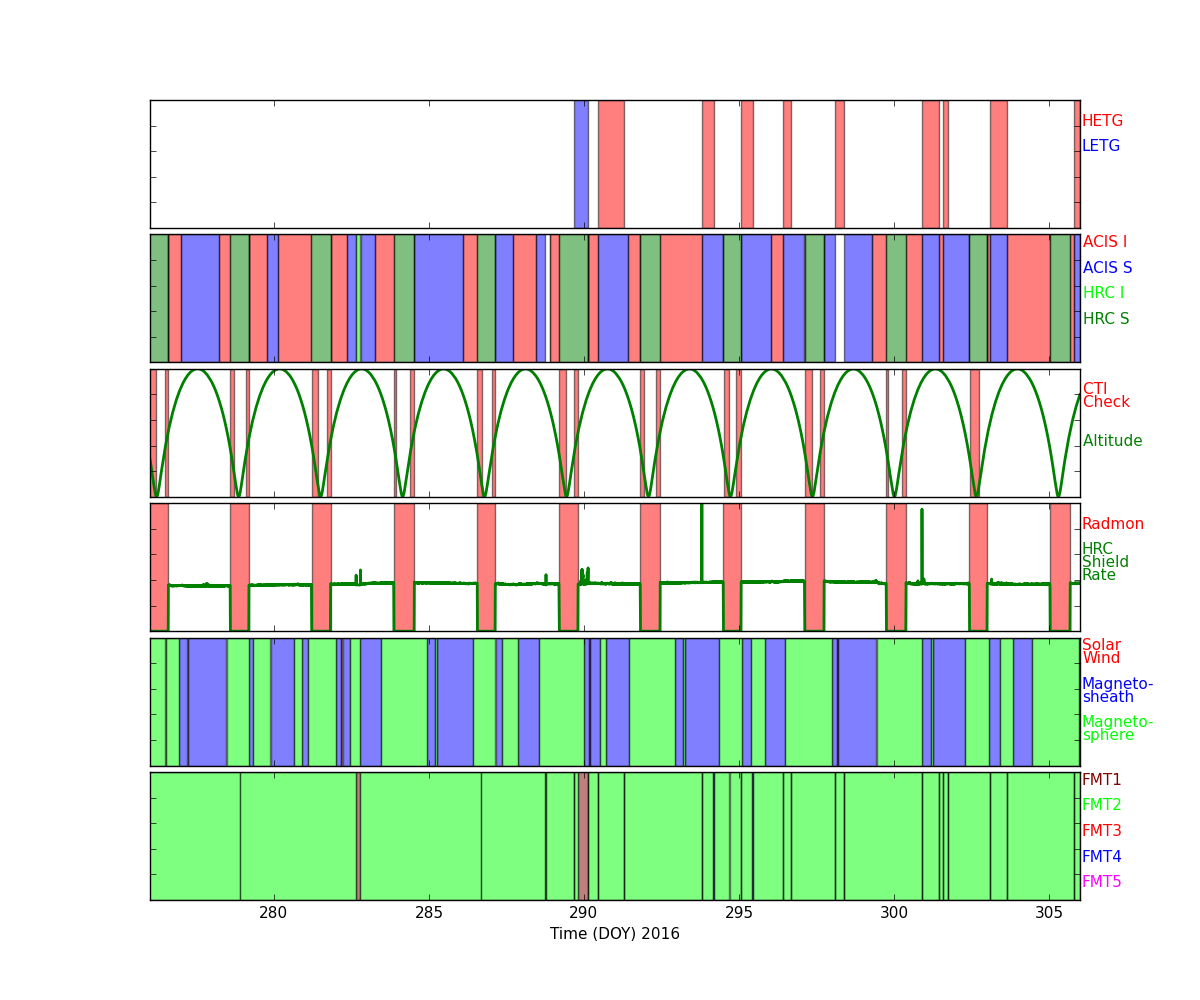
Radiation Zone Timing
Plotted below are radiation zone timing plots based on the following definitions of radiation zone:
- RADZONE - Ephin levels (in any of the E1300,P4GM,P41GM channels) are more than 1/3 of RADMON safing thresholds.
- RADMON - Radmon is disabled for radiation zone (as commanded based on OFLS model, for comparison with actual radiation levels).
- PERIGEE - Time of closest earth approach (for comparison)
Radiation Count Rates of Oct 2016
Sun Spot History
SIM
SIM Shift and Twist
SIM Shift and Twist Trend The following plots show trends of SIM shifts (dy and dz) and twist (dtheta). All quantities are directly taken from pcaf*_asol1.fits files. The units are mm for dy and dz, and degree for dtheta. We fit three lines separated before and after (Days of Mission)= 1400 (May 21, 2003), 2700 (Dec 11, 2006), and 4400 (Aug 07, 2011). The unit of slopes are mm per day or degree per day.
The sudden shift around DOM = 1400, 2700 and 4400 are due to fid light drift (see a memo by Aldcroft fiducial light drift). On the dtheta plot, two tracks are clearly observed. The track around 0.01 is due to HRC-I, and all others are clustered around -0.002. For more detail, please see SIM Shift and Twist Trend page
Trending
Quarterly Trends
- OBA Heaters
| Previous Quarter | ||||||
| MSID | MEAN | RMS | DELTA/YR | DELTA/YR/YR | UNITS | DESCRIPTION |
| OOBTHR04 | 294.45 | 1.05 | 5.298e+00 | -2.273e+01 | K | RT 27: HRMA STRUT |
| OOBTHR12 | 291.93 | 1.59 | 7.143e+00 | -6.610e+01 | K | RT 35: OBA CONE |
| OOBTHR23 | 292.53 | 2.31 | 8.787e+00 | -1.133e+02 | K | RT 45: OBA CONE |
| OOBTHR36 | 283.31 | 1.647e-02 | 6.816e-02 | 4.755e-01 | K | RT 58: TFTE CONE |
| OOBTHR58 | 294.63 | 1.63 | 7.527e+00 | -6.126e+01 | K | RT 151: OBA CONE |
)
)
)
)
)
- HRMA Heaters
| Previous Quarter | ||||||
| MSID | MEAN | RMS | DELTA/YR | DELTA/YR/YR | UNITS | DESCRIPTION |
| OHRTHR04 | 295.31 | 2.037e-03 | -2.625e-03 | 3.540e-03 | K | RT 9: HRMA PRECOLLIMATOR PLATE 10 |
| OHRTHR19 | 294.61 | 8.517e-02 | 2.370e-01 | -2.789e+00 | K | RT 132: HRMA AFT HEATER PLATE |
| OHRTHR21 | 295.27 | 3.382e-03 | -9.844e-03 | -3.924e-02 | K | RT 3: HRMA FOWARD APERTURE PLATE |
| OHRTHR44 | 295.29 | 1.702e-03 | -9.495e-03 | -5.570e-02 | K | RT 1: HRMA FORWARD APERTURE PLATE |
| OHRTHR54 | 294.45 | 6.196e-02 | 2.293e-01 | -9.682e+00 | K | RT 106: HRMA CAP |
)
)
)
)
)
- HRMA Thermal
| Previous Quarter | ||||||
| MSID | MEAN | RMS | DELTA/YR | DELTA/YR/YR | UNITS | DESCRIPTION |
| 4RT567T | 295.41 | 1.241e-02 | -4.376e-02 | 4.216e-01 | K | RT 567 - HRMA TEMP |
| 4RT568T | 294.23 | 1.04 | 8.842e-01 | -1.377e+02 | K | RT 568 - HRMA TEMP |
| 4RT575T | 297.76 | 1.43 | 4.065e-01 | -1.882e+02 | K | RT 575 - OB CONE TEMP |
| 4RT578T | 296.44 | 2.15 | 1.702e+00 | -1.949e+02 | K | RT 578 - OB CONE TEMP |
| 4RT579T | 292.00 | 2.21 | 2.578e+00 | -1.795e+02 | K | RT 579 - OB CONE TEMP |
)
)
)
)
)
Envelope Trending
EPHTV
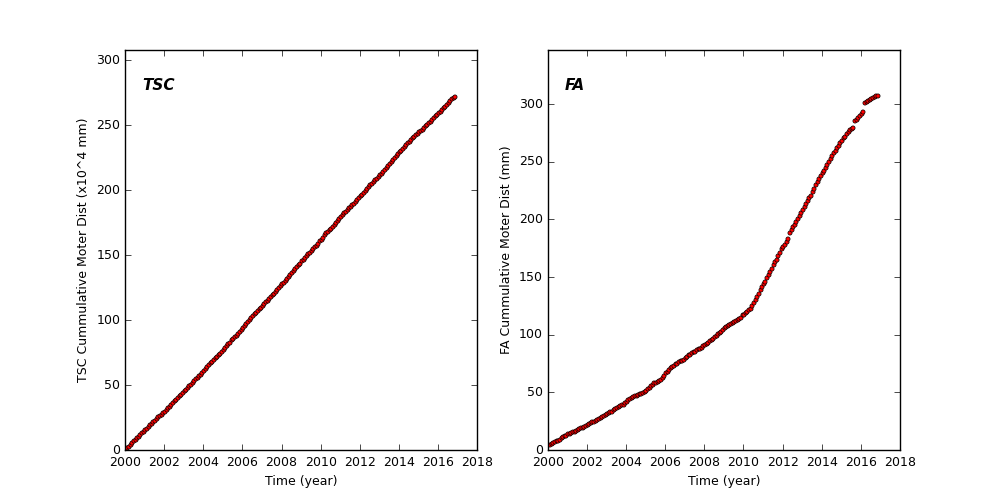
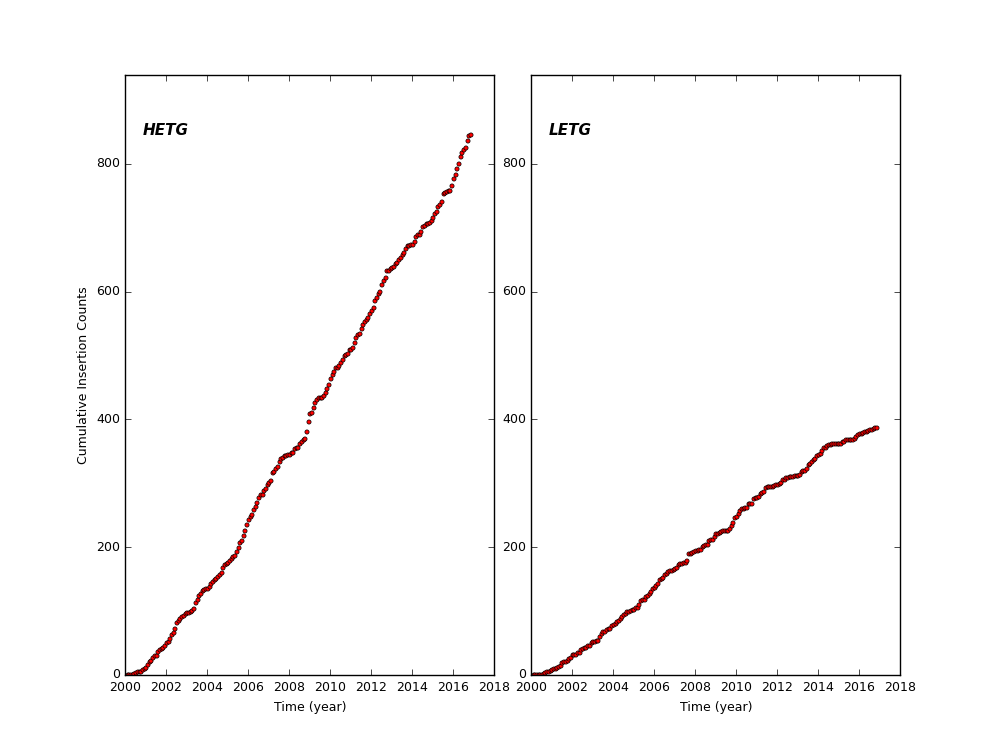
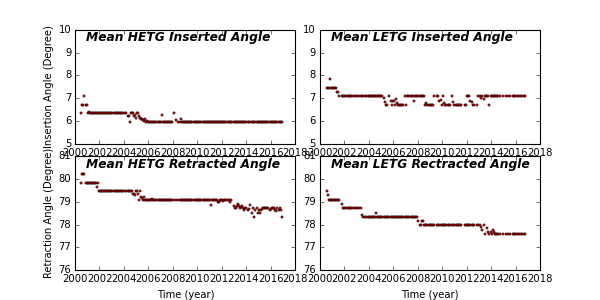
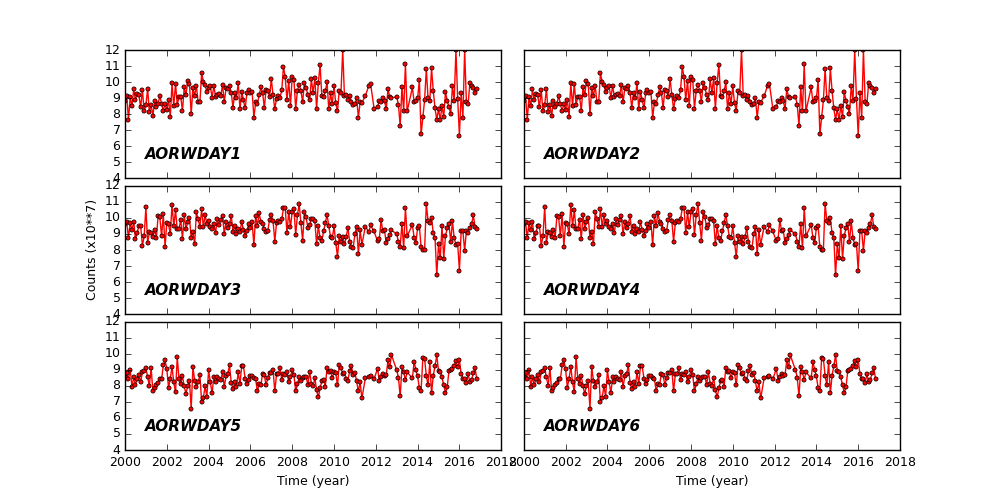
Spacecraft Motions
TSC and FA Cummulative Moter Distance
HETG and LETG Cummulative Insertion Counts
HETG/LETG Insertion/Retraction Angle
Reaction Wheel Rotations
Links to Past Monthly Reports
| Year | Month | |||||||||||
|---|---|---|---|---|---|---|---|---|---|---|---|---|
| 2016 | Jan | Feb | Mar | Apr | May | Jun | Jul | Aug | Sep | |||
| 2015 | Jan | Feb | Mar | Apr | May | Jun | Jul | Aug | Sep | Oct | Nov | Dec |
| 2014 | Jan | Feb | Mar | Apr | May | Jun | Jul | Aug | Sep | Oct | Nov | Dec |
| 2013 | Jan | Feb | Mar | Apr | May | Jun | Jul | Aug | Sep | Oct | Nov | Dec |
| 2012 | Jan | Feb | Mar | Apr | May | Jun | Jul | Aug | Sep | Oct | Nov | Dec |
| 2011 | Jan | Feb | Mar | Apr | May | Jun | Jul | Aug | Sep | Oct | Nov | Dec |
| 2010 | Jan | Feb | Mar | Apr | May | Jun | Jul | Aug | Sep | Oct | Nov | Dec |
| 2009 | Jan | Feb | Mar | Apr | May | Jun | Jul | Aug | Sep | Oct | Nov | Dec |
| 2008 | Jan | Feb | Mar | Apr | May | Jun | Jul | Aug | Sep | Oct | Nov | Dec |
| 2007 | Jan | Feb | Mar | Apr | May | Jun | Jul | Aug | Sep | Oct | Nov | Dec |
| 2006 | Jan | Feb | Mar | Apr | May | Jun | Jul | Aug | Sep | Oct | Nov | Dec |
| 2005 | Jan | Feb | Mar | Apr | May | Jun | Jul | Aug | Sep | Oct | Nov | Dec |
| 2004 | Jan | Feb | Mar | Apr | May | Jun | Jul | Aug | Sep | Oct | Nov | Dec |
| 2003 | Jan | Feb | Mar | Apr | May | Jun | Jul | Aug | Sep | Oct | Nov | Dec |
| 2002 | Jan | Feb | Mar | Apr | May | Jun | Jul | Aug | Sep | Oct | Nov | Dec |
| 2001 | Jan | Feb | Mar | Apr | May | Jun | Jul | Aug | Sep | Oct | Nov | Dec |
| 2000 | Jan | Feb | Mar | Apr | May | Jun | Jul | Aug | Sep | Oct | Nov | Dec |
| 1999 | Jul | Aug | Sep | Oct | Nov | Dec | ||||||