ACIS
ACIS DOSE Registered-Photon-Map
The steps we took to compute the dose map are;
- Level 1 Event files for a specified month are obtained from archive.
- Image data including I2, I3, S2, S3 CCDs are extracted from all event files.
- All the extracted image data were merged to create a month long exposure map for the month.
- The exposure map is opened with ds9, and check a distribution of count rates against energy. From this, estimate the upper threshold value. Any events beyond this upper threshold are assumed erroneous events such as bad pixels.
- Using this upper threshold, the data is filtered, and create a cleaned exposure map for the month.
- The exposure map from each month from the Sep 1999 is added up to create a cumulative exposure map for each month.
- Using fimgstatistic, we compute count rate statistics for each CCDs.
- For observations with high data drop rates (e.g., Crab nebula, Cas A), we corrected the observations by adding events.
Please check more detail plots at Telemetered Photon Dose Trend page.
)
)
)
Statistics:
# IMAGE     NPIX     MEAN        RMS        MIN     MAX
ACIS_may17 6004901       10.545         19.877           0.0     9173


I2 node 0  262654	8.482170	7.733817	0.0	974.0
I2 node 1  262654	8.911242	9.021418	0.0	1577.0
I2 node 2  262654	8.880064	7.701869	0.0	1015.0
I2 node 3  262654	9.251118	18.690848	0.0	5331.0

I3 node 0  262654	10.721857	11.280958	0.0	1487.0
I3 node 1  262654	9.458063	17.834800	0.0	5284.0
I3 node 2  262654	8.985393	10.589752	0.0	1170.0
I3 node 3  262654	9.016202	11.162669	0.0	1990.0

S2 node 0  262654	10.086125	10.342902	0.0	3007.0
S2 node 1  262654	10.701467	7.749465	0.0	541.0
S2 node 2  262654	13.645883	16.992568	0.0	3251.0
S2 node 3  262654	14.544430	18.574369	0.0	543.0

S3 node 0  262654	16.723621	25.952478	0.0	391.0
S3 node 1  262654	36.841659	32.365199	0.0	238.0
S3 node 2  262654	35.598200	29.348656	0.0	210.0
S3 node 3  262654	14.745071	14.265803	0.0	174.0
)
)
)
Statistics:
 IMAGE     NPIX      MEAN        RMS           MIN      MAX
ACIS_total   6004901       2105.137         2737.344           0.0   119719


I2 node 0  262654	1810.102564	352.853052	370.0	9998.0
I2 node 1  262654	1905.961378	488.479858	392.0	62334.0
I2 node 2  262654	8.880064	7.701869	0.0	1015.0
I2 node 3  262654	1944.154638	500.186292	378.0	28371.0

I3 node 0  262654	2055.367114	507.927008	375.0	8037.0
I3 node 1  262654	2138.139421	1621.116496	383.0	50627.0
I3 node 2  262654	1874.158901	343.180028	360.0	10325.0
I3 node 3  262654	9.016202	11.162669	0.0	1990.0

S2 node 0  262654	2448.988645	360.999819	1306.0	21573.0
S2 node 1  262654	10.701467	7.749465	0.0	541.0
S2 node 2  262654	2869.079856	543.456037	1716.0	27517.0
S2 node 3  262654	2809.411632	399.813431	1614.0	49945.0

S3 node 0  262654	4348.576264	1928.172767	1786.0	15872.0
S3 node 1  262654	5555.546576	2177.175517	0.0	14459.0
S3 node 2  262654	4326.189315	1091.821820	1807.0	10381.0
S3 node 3  262654	3331.663986	498.166508	1926.0	11065.0
)
|
)
|
)
|
)
|
| Feb 2017 | Nov 2016 | Aug 2016 | May 2016 |
|---|
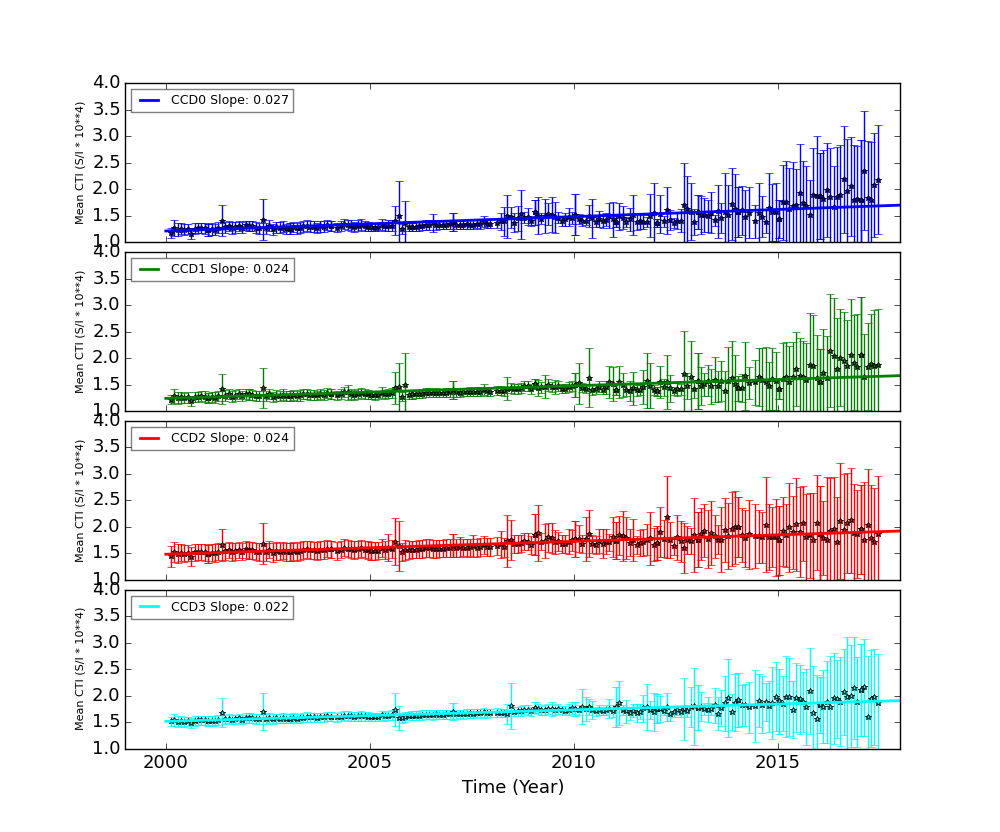
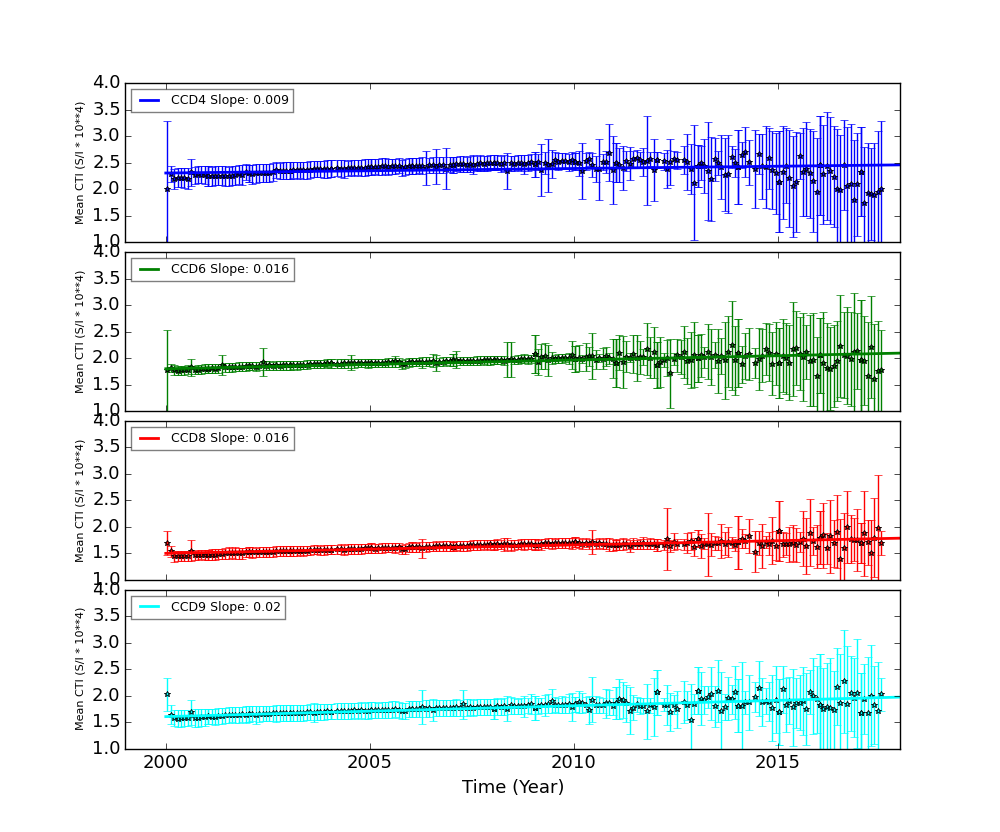
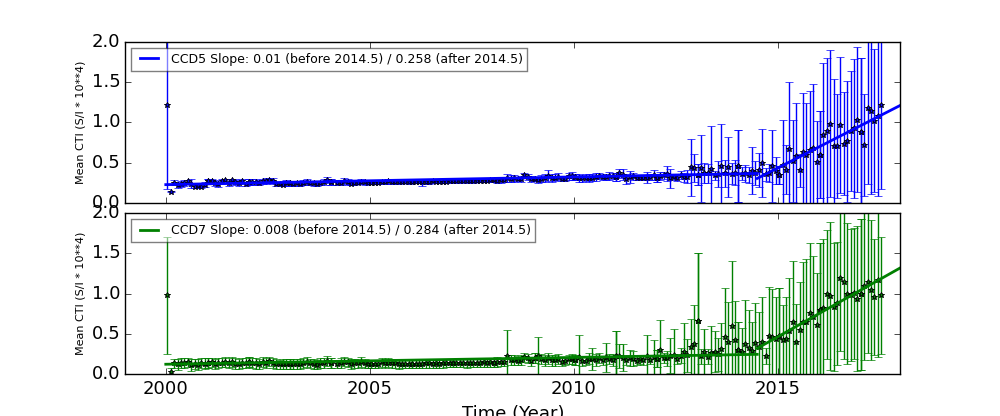
The Mean Detrended CTI
We report CTIs with a refined data definition. CTIs were computed for the temperature dependency corrected data. Please see CTI page for detailed explanation. CTI's are computed for Mn K alpha, and defined as slope/intercept x10^4 of row # vs ADU. Data file: here
Imaging CCDs
Spectral CCDs
Backside CCDs
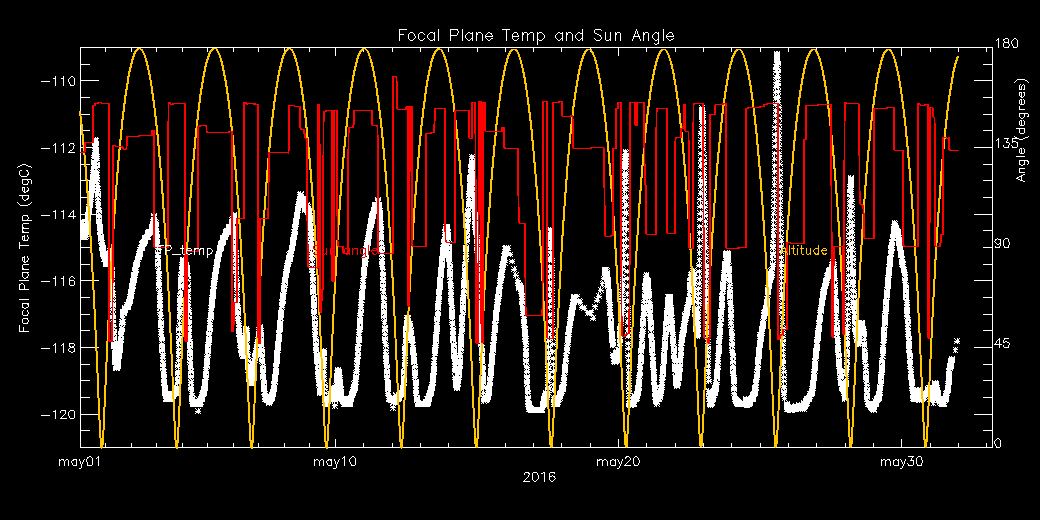
Focal Plane Temperature
May 2017 Focal Temperature
| The Mean (max) FPT: | |
|---|---|
| -114.52 | +/- 1.81 C |
| Mean Width: | |
| 1.06 | +/- 0.43 days |
Averaged Focal Plane Temperature
We are using 10 period moving averages to show trends of peak temperatures and peak widths. Note, the gaps in the width plot are due to missing/corrupted data.

Focal Plane Temperature, Sun Angle and Altitude
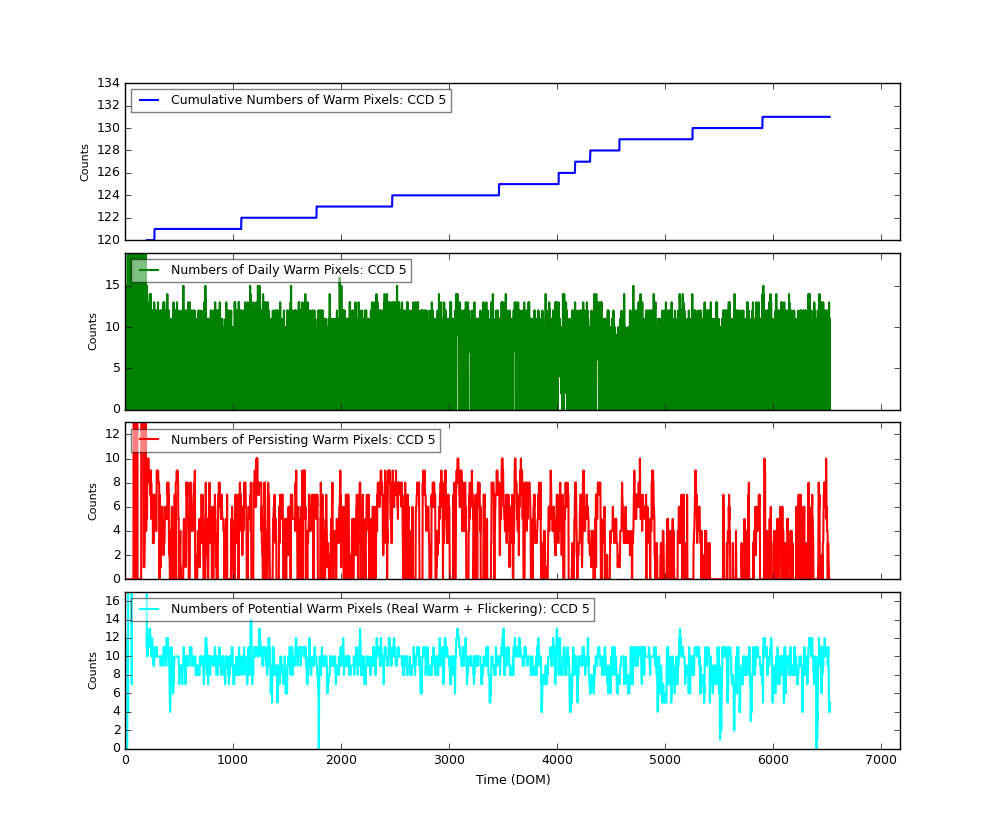
Bad Pixels
The plots below were generated with a new warm pixel finding script. Please see Acis Bad Pixel Page for details.
Front Side CCDs

Back Side CCD (CCD5)
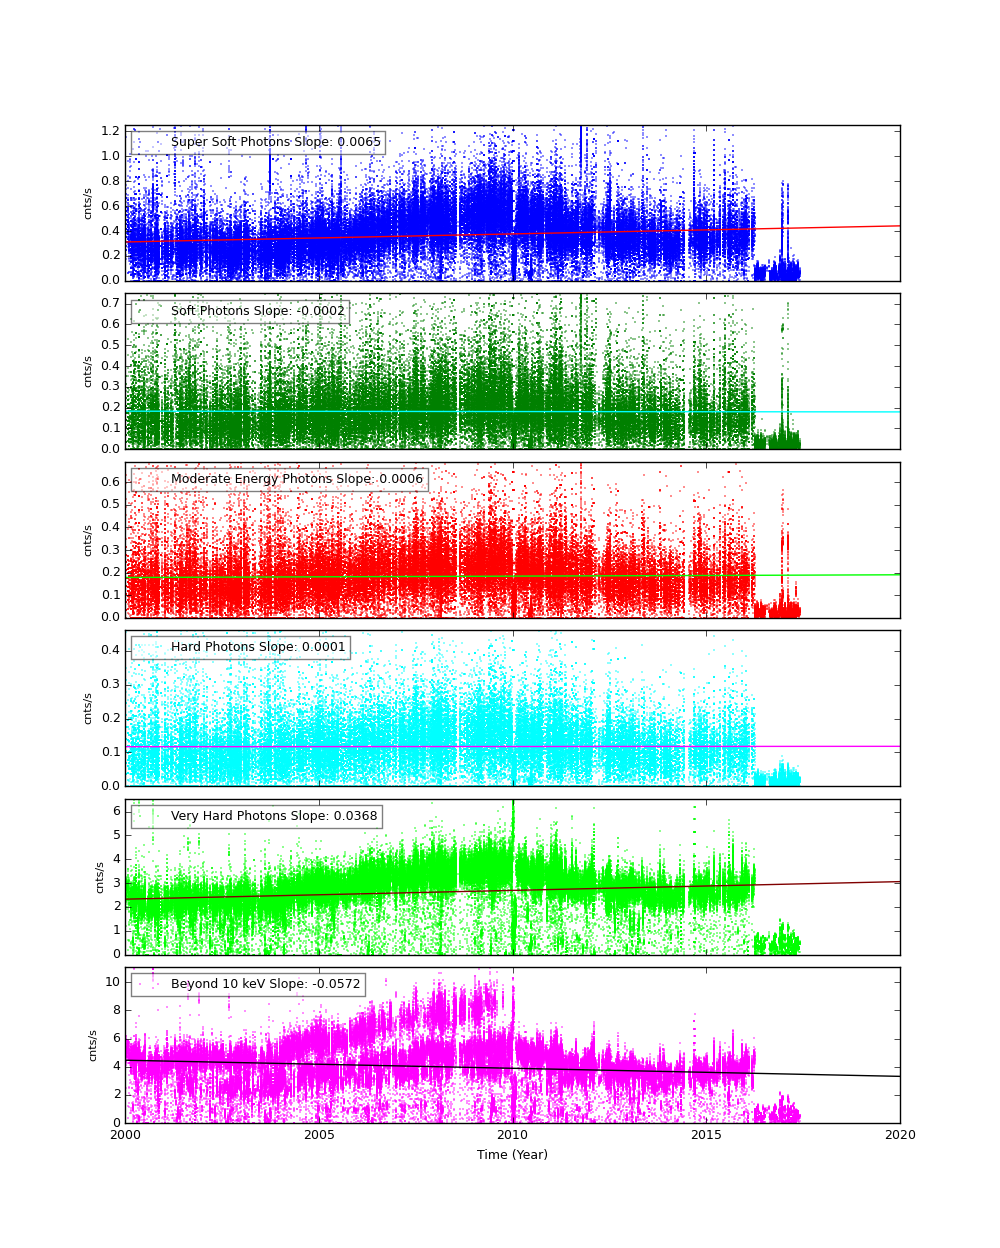
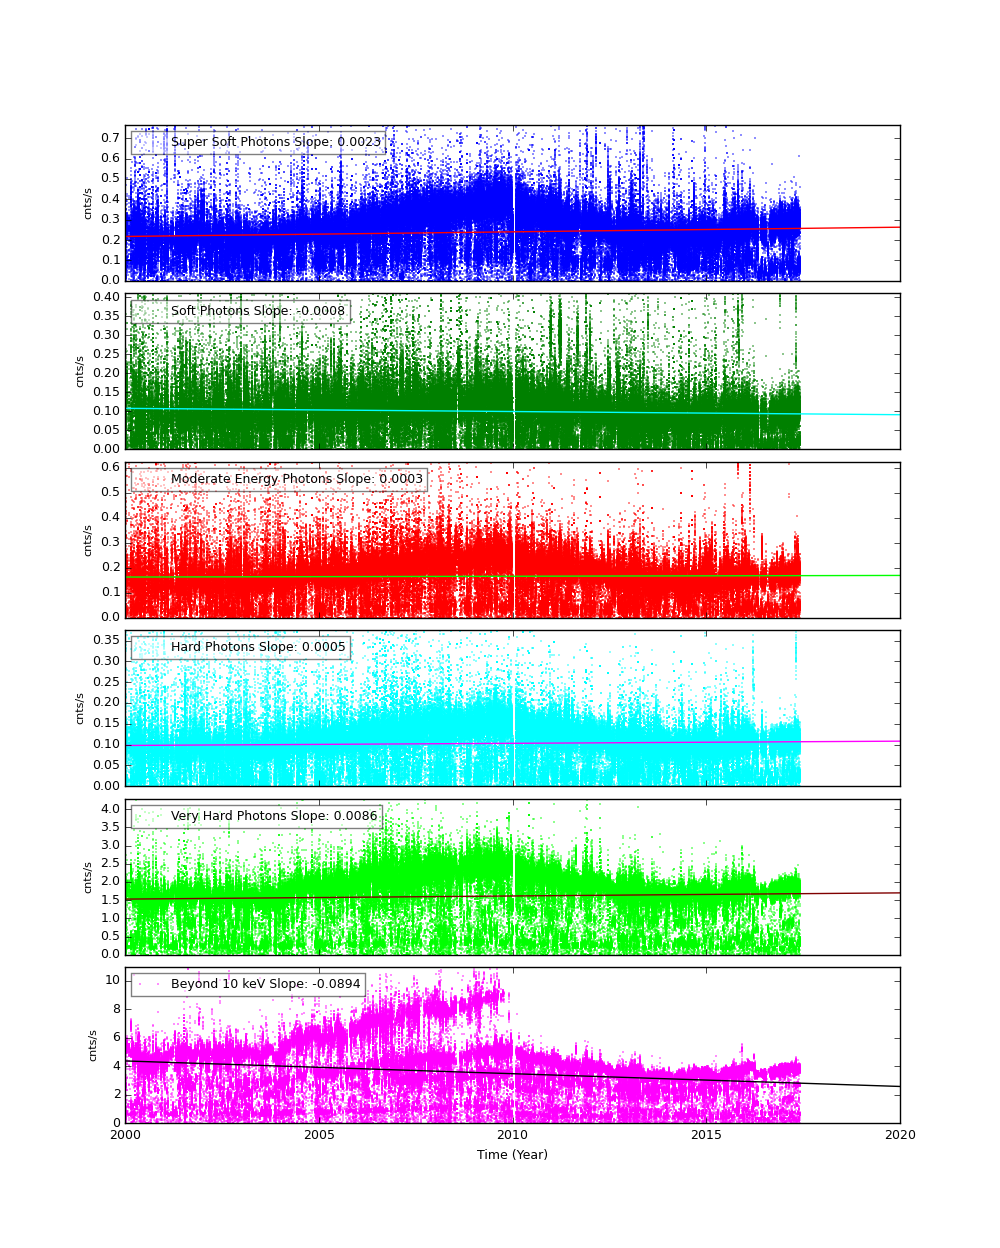
Science Instrument Background Rates
| Name | Low (keV) | High(KeV) | Description |
|---|---|---|---|
| SSoft | 0.00 | 0.50 | Super soft photons |
| Soft | 0.50 | 1.00 | Soft photons |
| Med | 1.00 | 3.00 | Moderate energy photons |
| Hard | 3.00 | 5.00 | Hard Photons |
| Harder | 5.00 | 10.00 | Very Hard photons |
| Hardest | 10.00 | Beyond 10 keV |
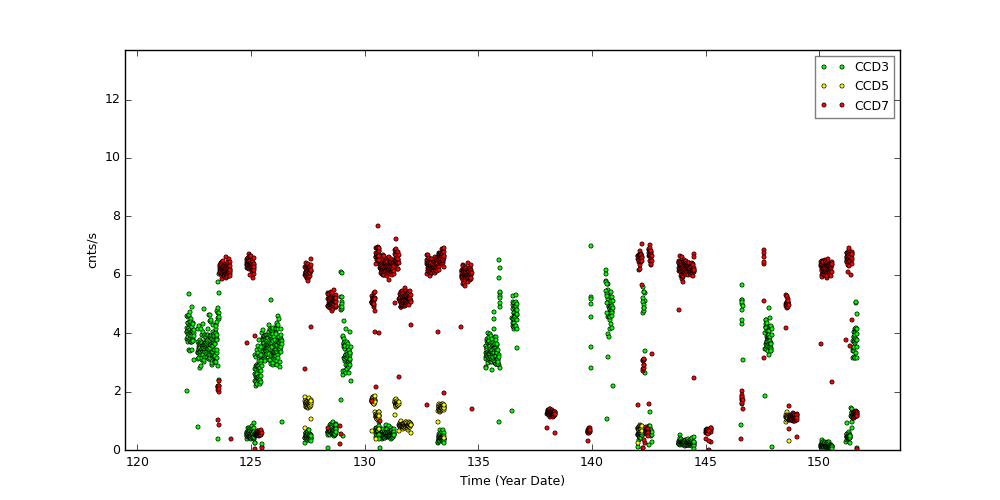
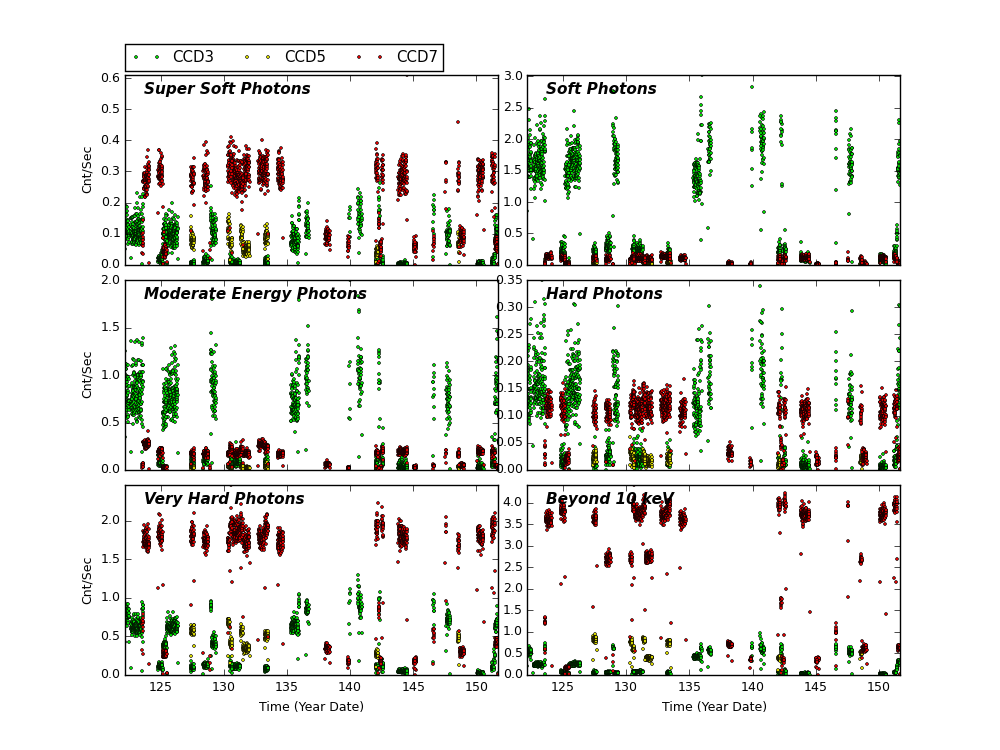
The following three plots show trends of SIB from year 2000. CCDs shown here are CCD3, CCD5, and CCD7. Fitted lines are linear fit after eliminating extreme outliers. For >10 keV plots, 2 lines are fit. One is with a 13 keV filter, and another without.
CCD 3

CCD 5
CCD 7
ACIS Histogram Mode Trends
We collected data from acis histogram mode data, and created trend plots of peak portions and peak widths against time (DOM). The peaks were estimated by fitting a simple Gaussian on three peaks (Al, Ti, and Mn), and the widths were estimated by a width at the half max from the peak.
All histogram data are taken under TIMED and GRADED_HIST mode, SIM position is at an external calibration source position, the focal temperature is around -119.7 C, and parameter settings in aciselec, acistemp are set to about same for all.
CCD 3, Peak Position
CCD 3, Peak Widths
CCD 3, Count Rates
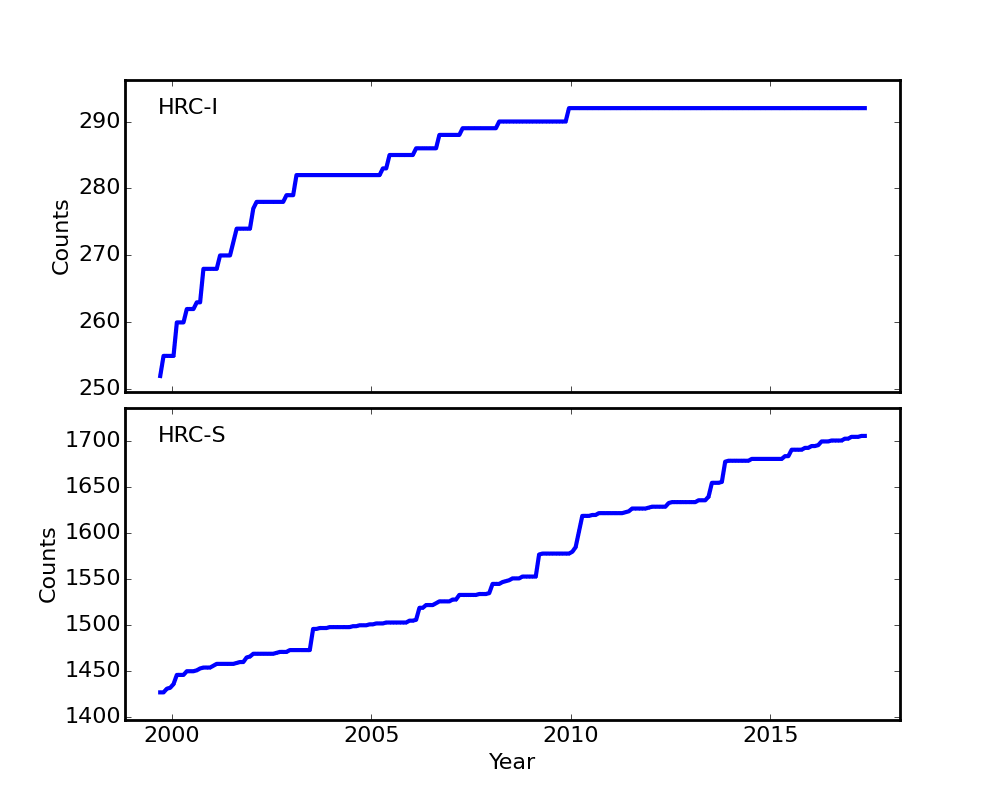
HRC
DOSE of Central 4K Pore-Pairs
Please refer to Maximum Dose Trends for more details.
)
|
|---|
IMAGE                NPIX      MEAN    STDDEV      MIN       MAX
HRCI_05_2017.fits  16777216	0.039 	0.202 	0.000 	9.000
)
IMAGE                       NPIX      MEAN    STDDEV      MIN       MAX
HRCI_08_1999_05_2017.fits  16777216	4.887 	5.209 	0.000 	292.000
)
|
|---|
IMAGE                NPIX      MEAN    STDDEV      MIN       MAX
HRCS_05_2017.fits  16777216	0.067 	0.278 	0.000 	6.000
)
IMAGE                       NPIX      MEAN    STDDEV      MIN       MAX
HRCS_08_1999_05_2017.fits  16777216	16.462 	29.439 	0.000 	1706.000
|
|
Max dose trend plots corrected for events that "pile-up"
in the center of the taps due to bad position information.
|
)
|
)
|
)
|
)
|
| Feb 2017 | Nov 2016 | Aug 2016 | May 2016 |
|---|
)
|
)
|
)
|
)
|
| Feb 2017 | Nov 2016 | Aug 2016 | May 2016 |
|---|
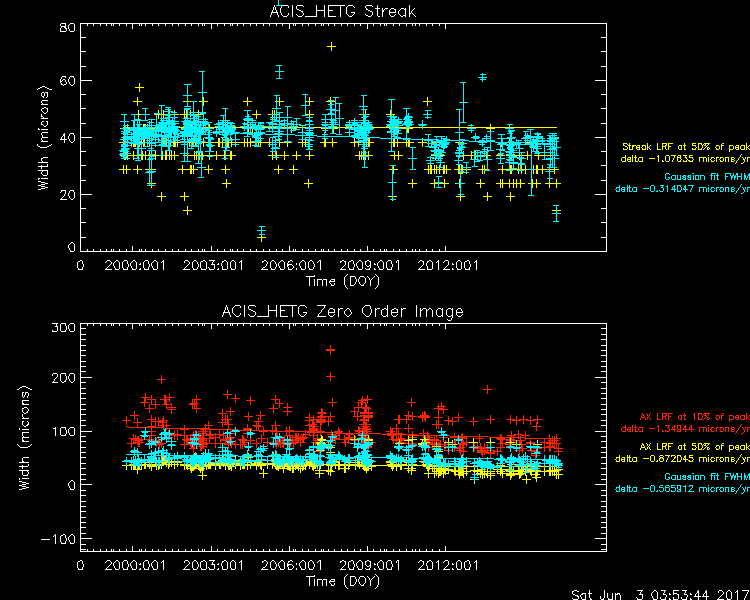
Gratings
Focus
We plot the width of the zero order streak of ACIS/HETG observations and the width of the zero order image for HRC/LETG observations of point sources. No significant defocusing trend is seen at this time. See Gratings Focus pages.
PCAD
ACA Trending
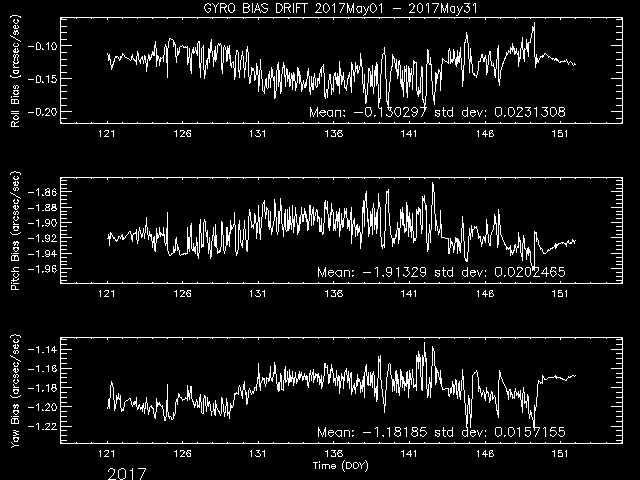
Gyro Bias Drift
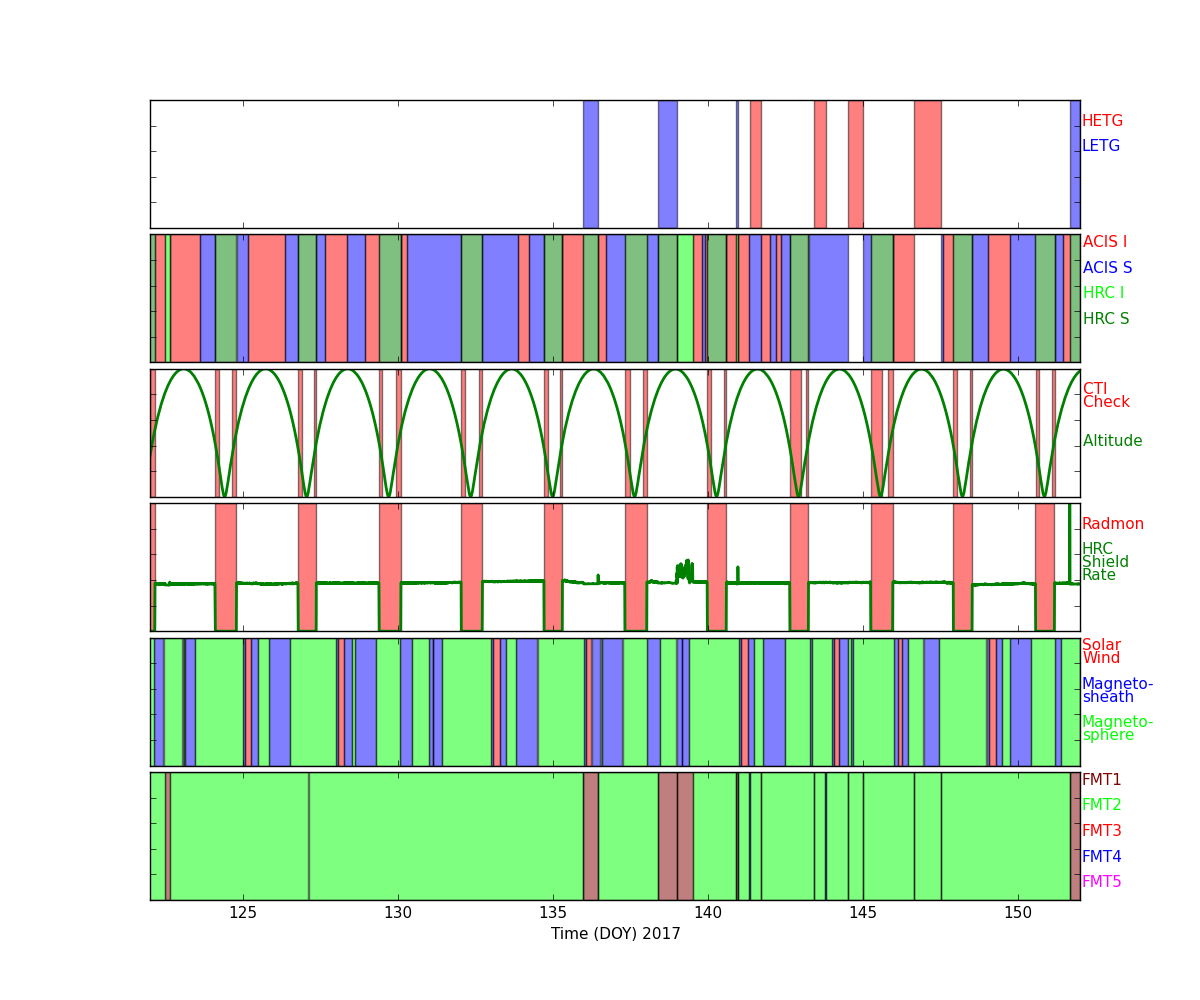
Radiation History
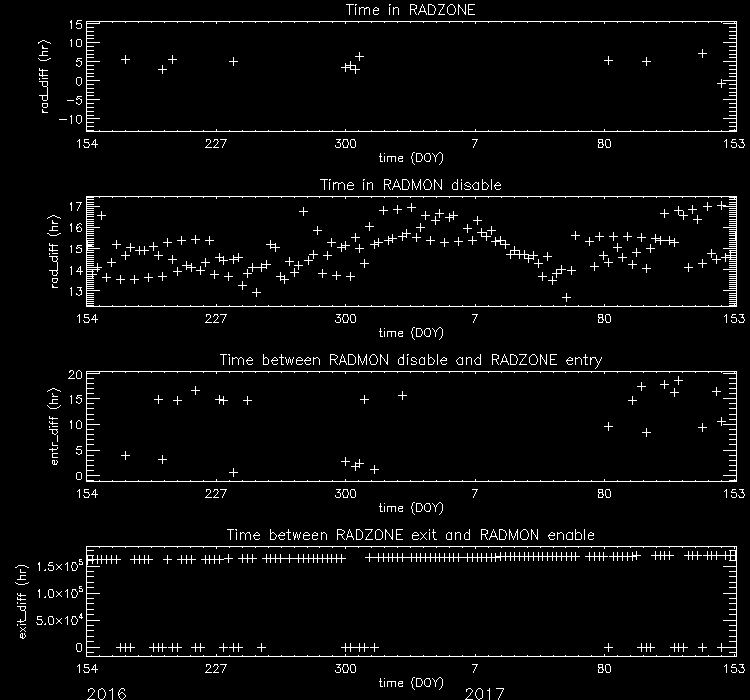
Radiation Zone Timing
Plotted below are radiation zone timing plots based on the following definitions of radiation zone:
- RADZONE - Ephin levels (in any of the E1300,P4GM,P41GM channels) are more than 1/3 of RADMON safing thresholds.
- RADMON - Radmon is disabled for radiation zone (as commanded based on OFLS model, for comparison with actual radiation levels).
- PERIGEE - Time of closest earth approach (for comparison)
Radiation Count Rates of May 2017

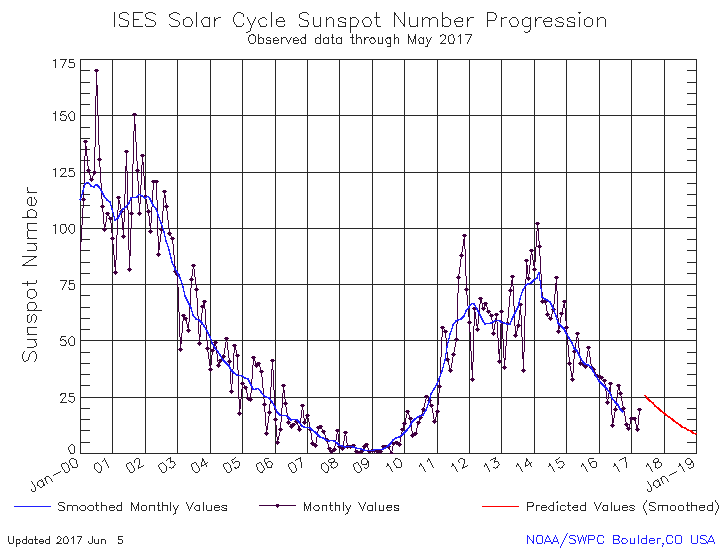
Sun Spot History
Trending
Quarterly Trends
- HRMA Heater
| Previous Quarter | ||||||
| MSID | MEAN | RMS | DELTA/YR | DELTA/YR/YR | UNITS | DESCRIPTION |
| OHRTHR03 | 295.24 | 1.102e-03 | 3.355e-03 | 3.940e-02 | K | RT 5: HRMA FORWARD APERTURE PLATE |
| OHRTHR09 | 294.72 | 0.10 | 4.532e-01 | 2.484e+00 | K | RT 105: HRMA CAP |
| OHRTHR17 | 294.59 | 0.11 | 4.758e-01 | 2.453e+00 | K | RT 125: HSA OUTER CYNLINDER |
| OHRTHR24 | 294.90 | 0.19 | 6.087e-01 | 2.654e-02 | K | RT 12: HRMA AFT HEATER PLATE |
| OHRTHR38 | 296.29 | 0.97 | 2.110e+00 | 6.203e+00 | K | RT 120: HRMA AFT COLLIMATOR OUTER CYLINDER |
| OHRTHR52 | 294.58 | 0.11 | 4.756e-01 | 2.688e+00 | K | RT 100: HRMA CAP |
)
)
)
)
)
)
- HRMA Thermal
| Previous Quarter | ||||||
| MSID | MEAN | RMS | DELTA/YR | DELTA/YR/YR | UNITS | DESCRIPTION |
| 4RT568T | 294.99 | 1.15 | -5.554e+00 | -3.139e+00 | K | RT 568 - HRMA TEMP |
| 4RT569T | 294.78 | 0.20 | -1.334e+00 | 7.246e+00 | K | RT 569 - HRMA TEMP |
| 4RT570T | 294.67 | 9.028e-02 | -4.922e-01 | 7.423e+00 | K | RT 570 - HRMA TEMP |
| 4RT575T | 298.87 | 1.48 | -6.196e+00 | -7.826e+00 | K | RT 575 - OB CONE TEMP |
| 4RT576T | 290.83 | 1.13 | -5.489e+00 | -2.442e-01 | K | RT 576 - OB CONE TEMP |
| 4RT578T | 297.15 | 2.41 | -8.996e+00 | 3.213e+00 | K | RT 578 - OB CONE TEMP |
)
)
)
)
)
)
- MUPS
| Previous Quarter | ||||||
| MSID | MEAN | RMS | DELTA/YR | DELTA/YR/YR | UNITS | DESCRIPTION |
| PM1THV1T | 331.85 | 8.13 | 7.987e+00 | -7.932e+02 | K | MUPS 1 THRUSTER VALVE 01 TEMP |
| PLINE02T | 320.68 | 9.61 | -1.517e+00 | 5.416e+02 | K | PROP LINE TEMP 02 |
| PLINE03T | 318.18 | 11.95 | 4.329e-01 | 6.675e+02 | K | PROP LINE TEMP 03 |
| PLINE04T | 304.38 | 11.62 | 8.152e+00 | 6.499e+02 | K | PROP LINE TEMP 04 |
)
)
)
)
Envelope Trending
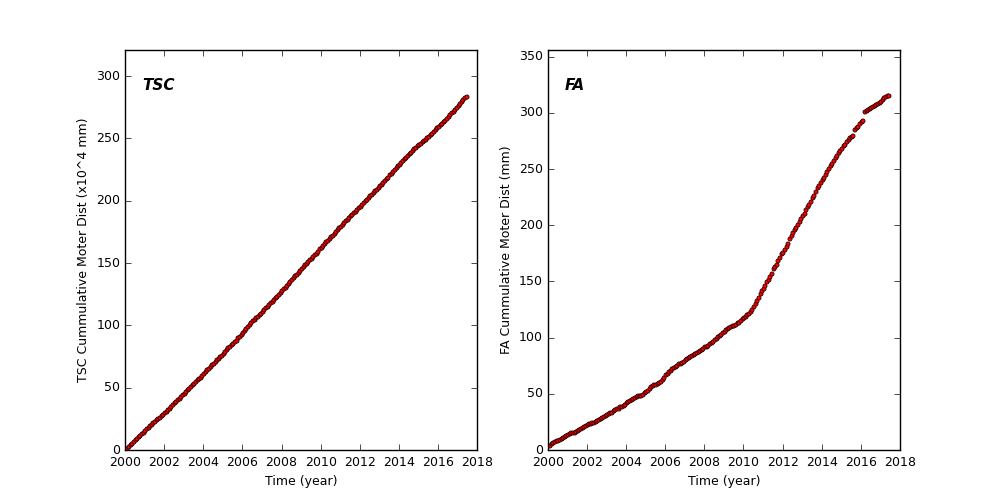
Spacecraft Motions
TSC and FA Cummulative Moter Distance
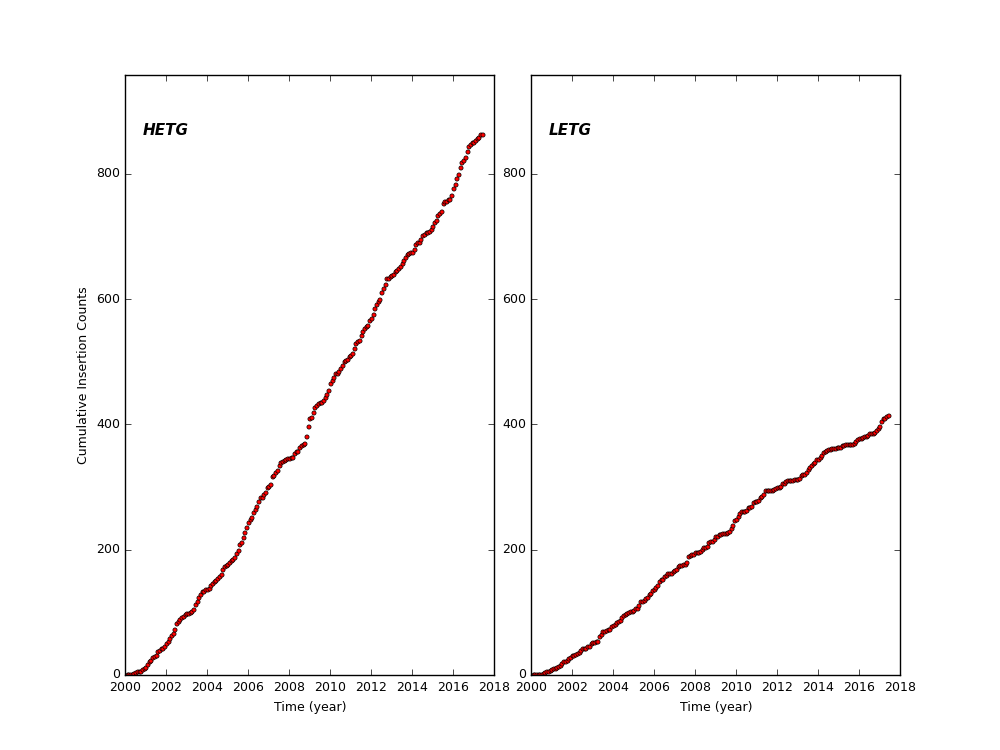
HETG and LETG Cummulative Insertion Counts
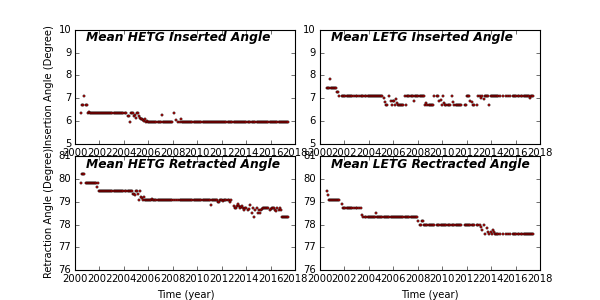
HETG/LETG Insertion/Retraction Angle
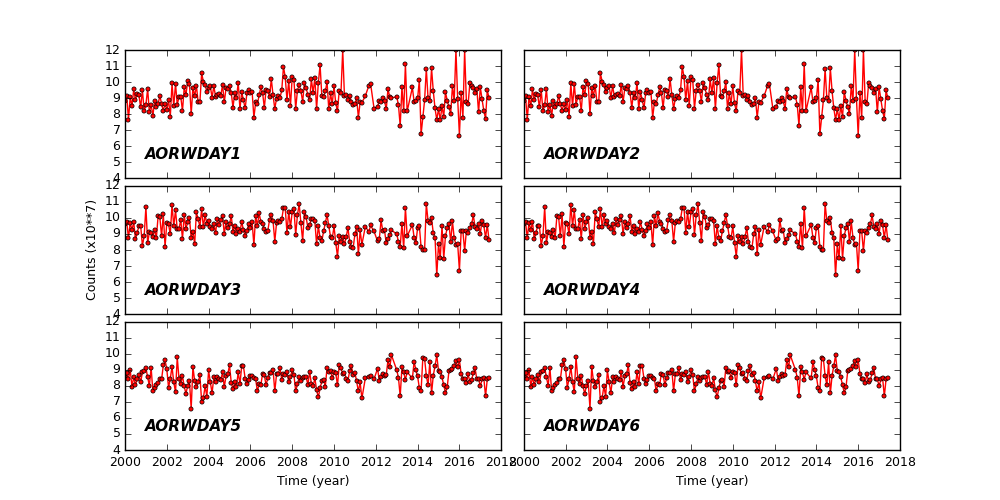
Reaction Wheel Rotations
Links to Past Monthly Reports
| Year | Month | |||||||||||
|---|---|---|---|---|---|---|---|---|---|---|---|---|
| 2017 | Jan | Feb | Mar | Apr | ||||||||
| 2016 | Jan | Feb | Mar | Apr | May | Jun | Jul | Aug | Sep | Oct | Nov | Dec |
| 2015 | Jan | Feb | Mar | Apr | May | Jun | Jul | Aug | Sep | Oct | Nov | Dec |
| 2014 | Jan | Feb | Mar | Apr | May | Jun | Jul | Aug | Sep | Oct | Nov | Dec |
| 2013 | Jan | Feb | Mar | Apr | May | Jun | Jul | Aug | Sep | Oct | Nov | Dec |
| 2012 | Jan | Feb | Mar | Apr | May | Jun | Jul | Aug | Sep | Oct | Nov | Dec |
| 2011 | Jan | Feb | Mar | Apr | May | Jun | Jul | Aug | Sep | Oct | Nov | Dec |
| 2010 | Jan | Feb | Mar | Apr | May | Jun | Jul | Aug | Sep | Oct | Nov | Dec |
| 2009 | Jan | Feb | Mar | Apr | May | Jun | Jul | Aug | Sep | Oct | Nov | Dec |
| 2008 | Jan | Feb | Mar | Apr | May | Jun | Jul | Aug | Sep | Oct | Nov | Dec |
| 2007 | Jan | Feb | Mar | Apr | May | Jun | Jul | Aug | Sep | Oct | Nov | Dec |
| 2006 | Jan | Feb | Mar | Apr | May | Jun | Jul | Aug | Sep | Oct | Nov | Dec |
| 2005 | Jan | Feb | Mar | Apr | May | Jun | Jul | Aug | Sep | Oct | Nov | Dec |
| 2004 | Jan | Feb | Mar | Apr | May | Jun | Jul | Aug | Sep | Oct | Nov | Dec |
| 2003 | Jan | Feb | Mar | Apr | May | Jun | Jul | Aug | Sep | Oct | Nov | Dec |
| 2002 | Jan | Feb | Mar | Apr | May | Jun | Jul | Aug | Sep | Oct | Nov | Dec |
| 2001 | Jan | Feb | Mar | Apr | May | Jun | Jul | Aug | Sep | Oct | Nov | Dec |
| 2000 | Jan | Feb | Mar | Apr | May | Jun | Jul | Aug | Sep | Oct | Nov | Dec |
| 1999 | Jul | Aug | Sep | Oct | Nov | Dec | ||||||