ACIS
ACIS DOSE Registered-Photon-Map
The steps we took to compute the dose map are;
- Level 1 Event files for a specified month are obtained from archive.
- Image data including I2, I3, S2, S3 CCDs are extracted from all event files.
- All the extracted image data were merged to create a month long exposure map for the month.
- The exposure map is opened with ds9, and check a distribution of count rates against energy. From this, estimate the upper threshold value. Any events beyond this upper threshold are assumed erroneous events such as bad pixels.
- Using this upper threshold, the data is filtered, and create a cleaned exposure map for the month.
- The exposure map from each month from the Sep 1999 is added up to create a cumulative exposure map for each month.
- Using fimgstatistic, we compute count rate statistics for each CCDs.
- For observations with high data drop rates (e.g., Crab nebula, Cas A), we corrected the observations by adding events.
Please check more detail plots at Telemetered Photon Dose Trend page.
)
)
)
Statistics:
# IMAGE     NPIX     MEAN        RMS        MIN     MAX
ACIS_jul17 6004901       8.989         24.313           0.0     3159


I2 node 0  262654	7.389368	3.342079	0.0	 66.0
I2 node 1  262654	7.837271	4.839284	0.0	1568.0
I2 node 2  262654	7.708831	6.993289	0.0	3139.0
I2 node 3  262654	7.583353	3.496748	0.0	 89.0

I3 node 0  262654	8.053008	3.616681	0.0	104.0
I3 node 1  262654	7.975653	12.592219	0.0	3135.0
I3 node 2  262654	7.539710	3.304808	0.0	 68.0
I3 node 3  262654	7.647474	10.889823	0.0	3137.0

S2 node 0  262654	10.199713	8.628753	0.0	473.0
S2 node 1  262654	11.125405	12.213908	0.0	154.0
S2 node 2  262654	15.554982	33.149753	0.0	3159.0
S2 node 3  262654	16.189153	34.764831	0.0	602.0

S3 node 0  262654	20.139951	61.555849	0.0	1041.0
S3 node 1  262654	20.474837	45.395360	0.0	637.0
S3 node 2  262654	20.630300	45.589591	0.0	600.0
S3 node 3  262654	14.302299	20.422687	0.0	291.0
)
)
)
Statistics:
 IMAGE     NPIX      MEAN        RMS           MIN      MAX
ACIS_total   6004901       2122.676         2756.853           0.0   120418


I2 node 0  262654	1822.738904	355.636185	375.0	10104.0
I2 node 1  262654	1919.306728	493.320450	395.0	65083.0
I2 node 2  262654	7.708831	6.993289	0.0	3139.0
I2 node 3  262654	1957.148425	503.578013	382.0	28387.0

I3 node 0  262654	2070.002959	511.642598	380.0	8101.0
I3 node 1  262654	2152.528754	1625.517791	389.0	50681.0
I3 node 2  262654	1887.927162	346.004010	367.0	10446.0
I3 node 3  262654	7.647474	10.889823	0.0	3137.0

S2 node 0  262654	2468.327673	362.217698	1319.0	21596.0
S2 node 1  262654	11.125405	12.213908	0.0	154.0
S2 node 2  262654	2899.723709	543.934786	1725.0	27533.0
S2 node 3  262654	2844.422569	399.260318	1621.0	50416.0

S3 node 0  262654	4397.905476	1964.630898	1794.0	17865.0
S3 node 1  262654	5596.539963	2173.044612	0.0	14473.0
S3 node 2  262654	4365.060405	1088.004314	1815.0	10432.0
S3 node 3  262654	3357.989714	499.357611	1937.0	11114.0
)
|
)
|
)
|
)
|
| Apr 2017 | Jan 2017 | Oct 2016 | Jul 2016 |
|---|
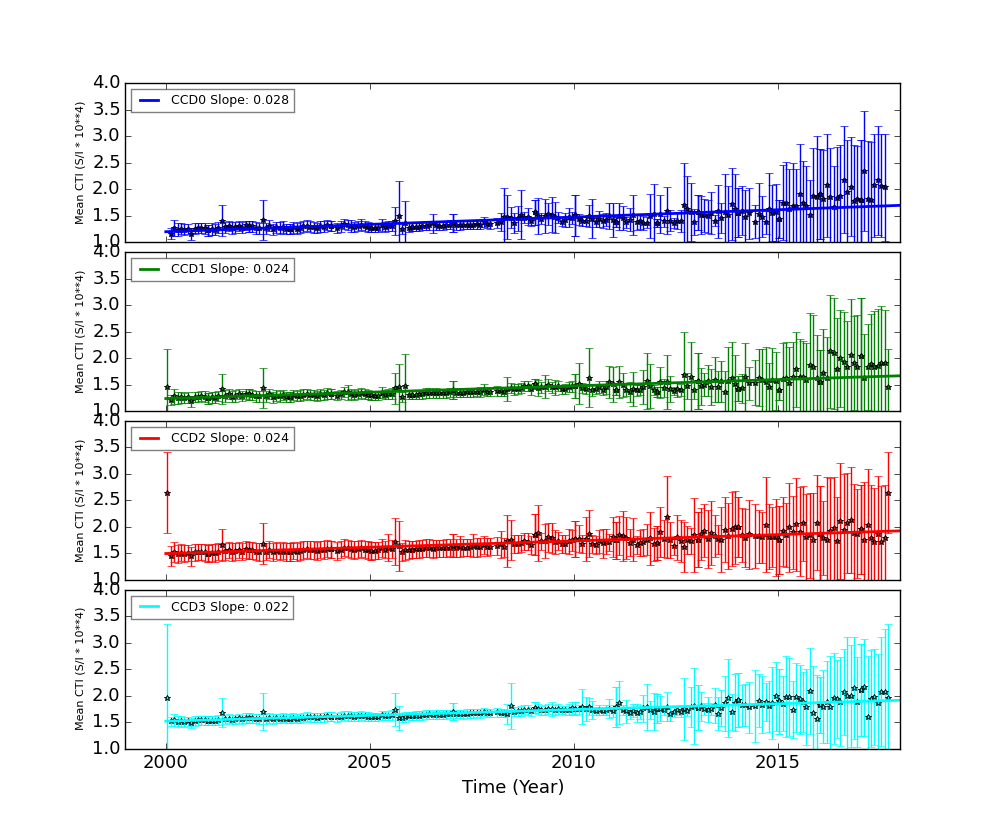
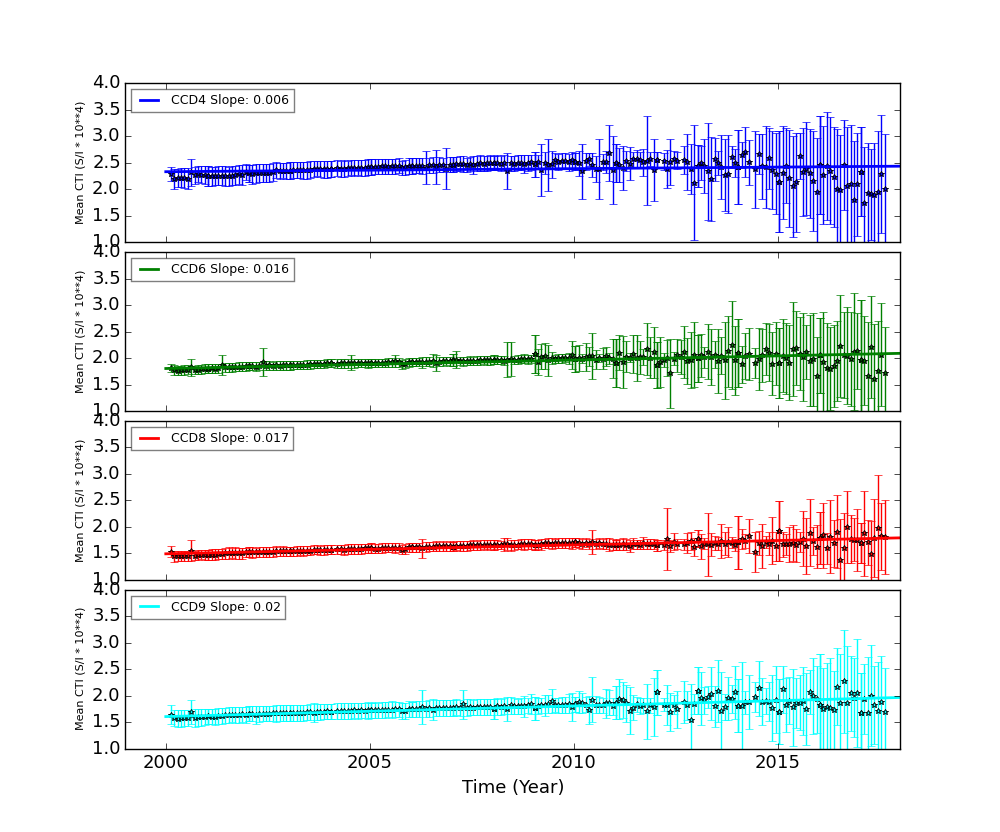
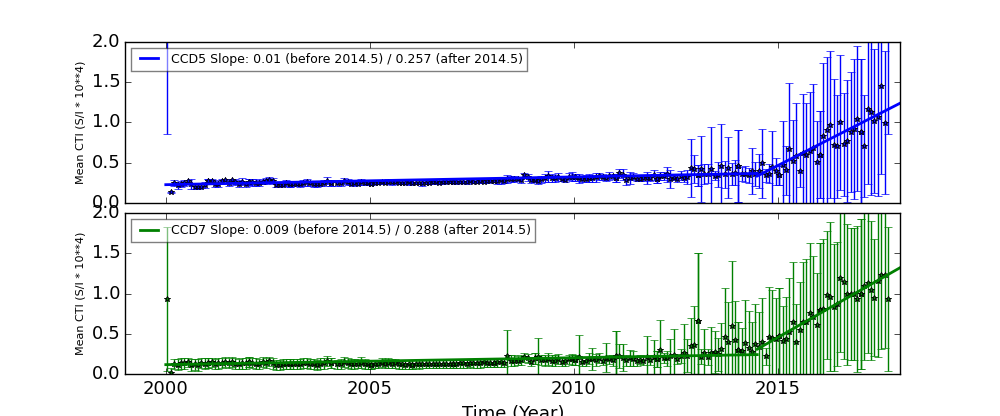
The Mean Detrended CTI
We report CTIs with a refined data definition. CTIs were computed for the temperature dependency corrected data. Please see CTI page for detailed explanation. CTI's are computed for Mn K alpha, and defined as slope/intercept x10^4 of row # vs ADU. Data file: here
Imaging CCDs
Spectral CCDs
Backside CCDs
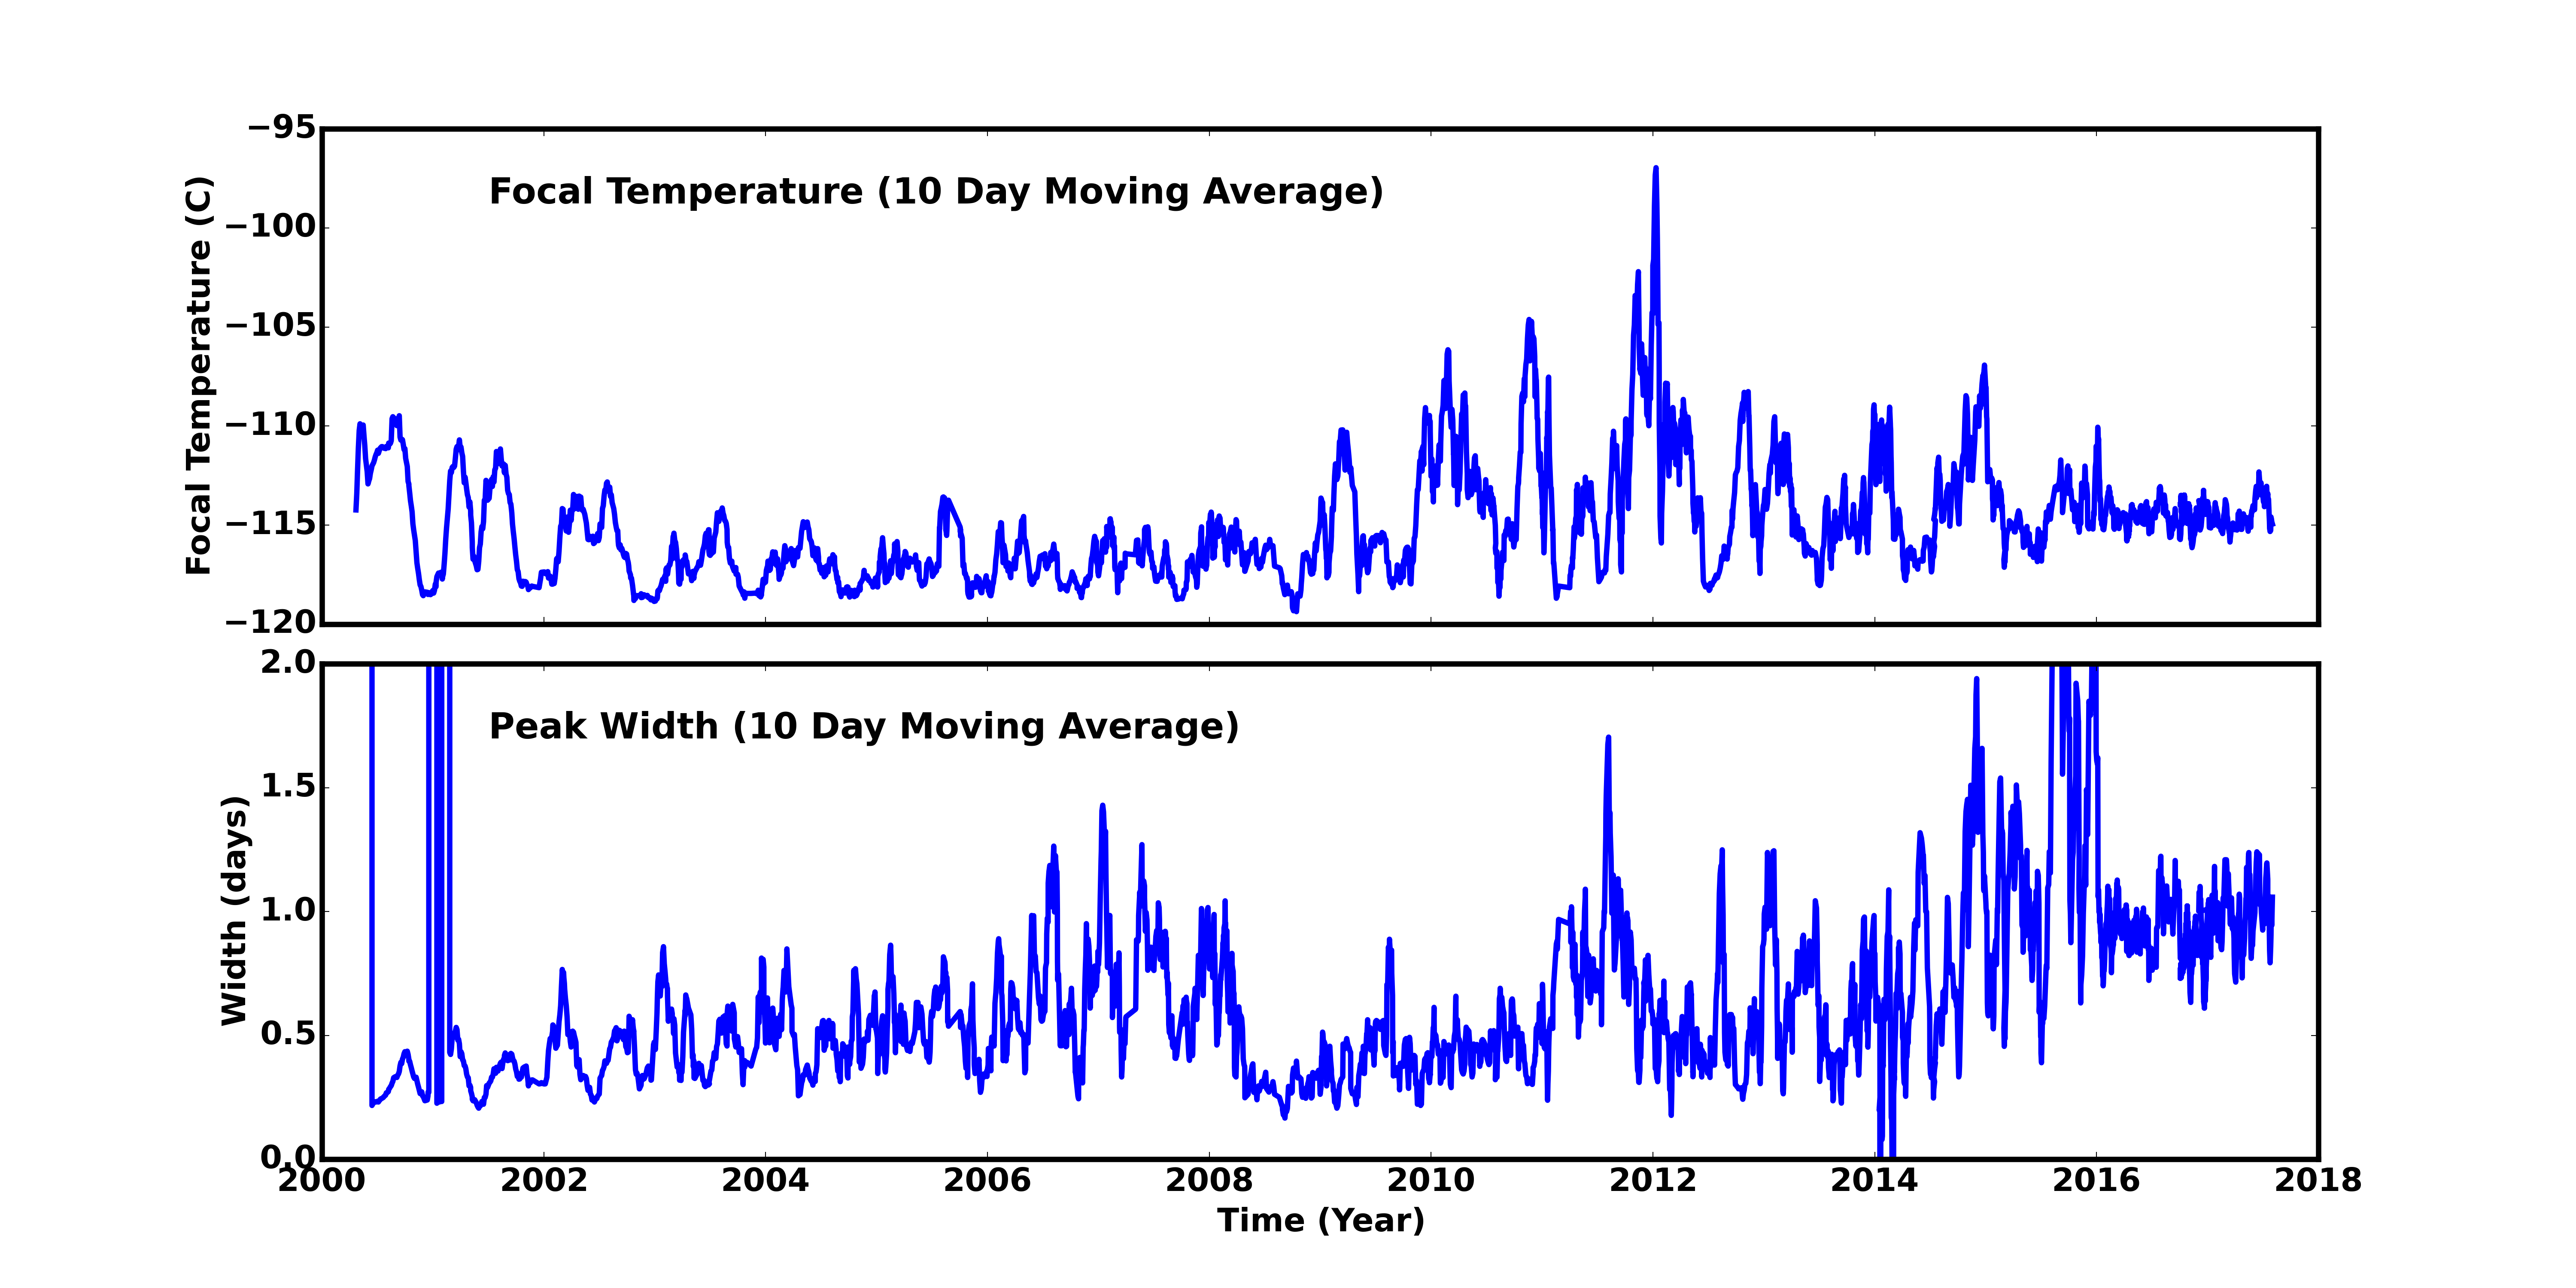
Focal Plane Temperature
Jul 2017 Focal Temperature
| The Mean (max) FPT: | |
|---|---|
| -114.13 | +/- 2.35 C |
| Mean Width: | |
| 1.06 | +/- 0.52 days |
Averaged Focal Plane Temperature
We are using 10 period moving averages to show trends of peak temperatures and peak widths. Note, the gaps in the width plot are due to missing/corrupted data.
Focal Plane Temperature, Sun Angle and Altitude
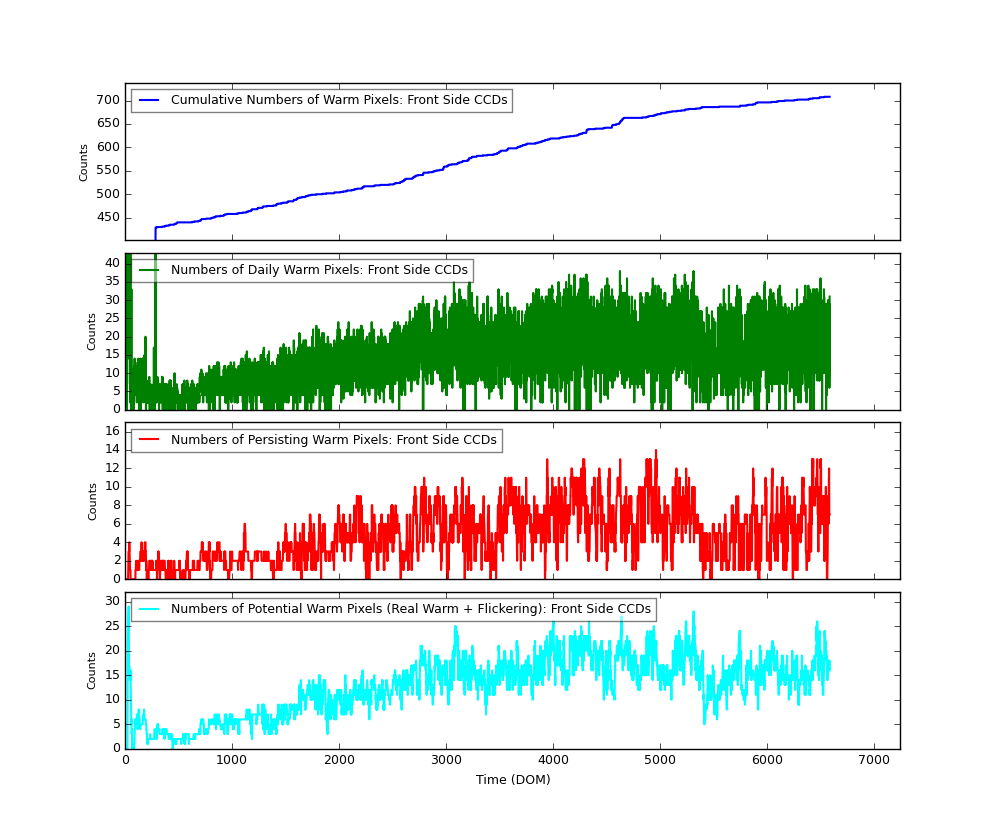
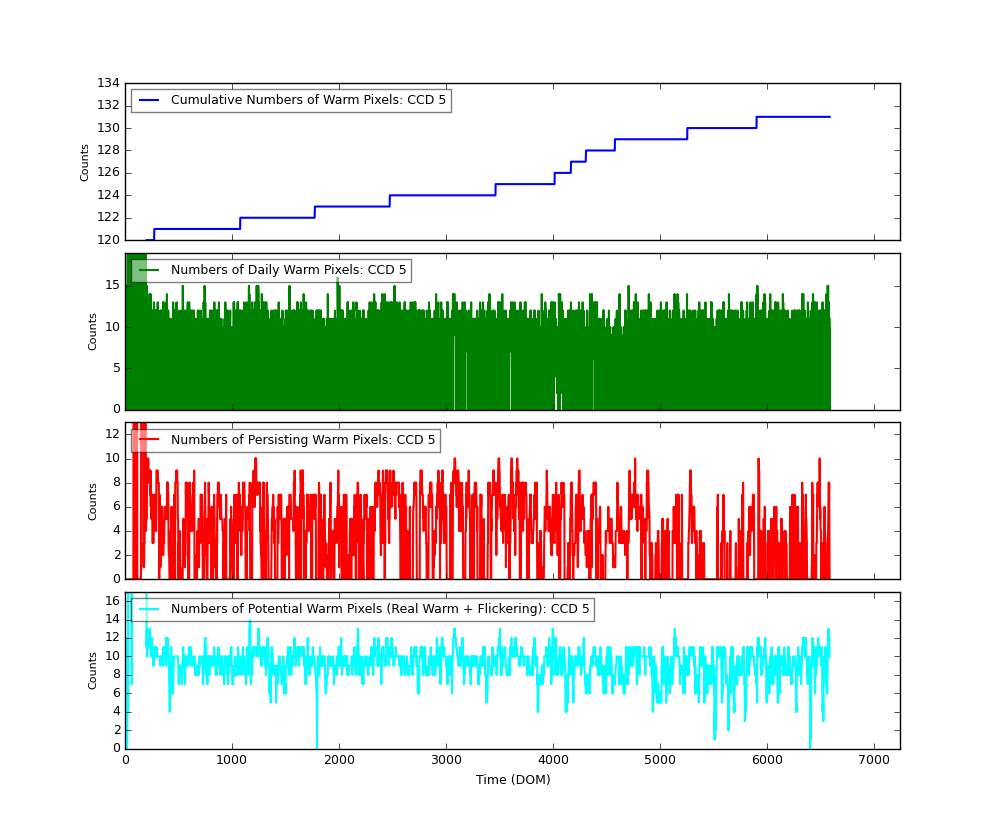
Bad Pixels
The plots below were generated with a new warm pixel finding script. Please see Acis Bad Pixel Page for details.
Front Side CCDs
Back Side CCD (CCD5)
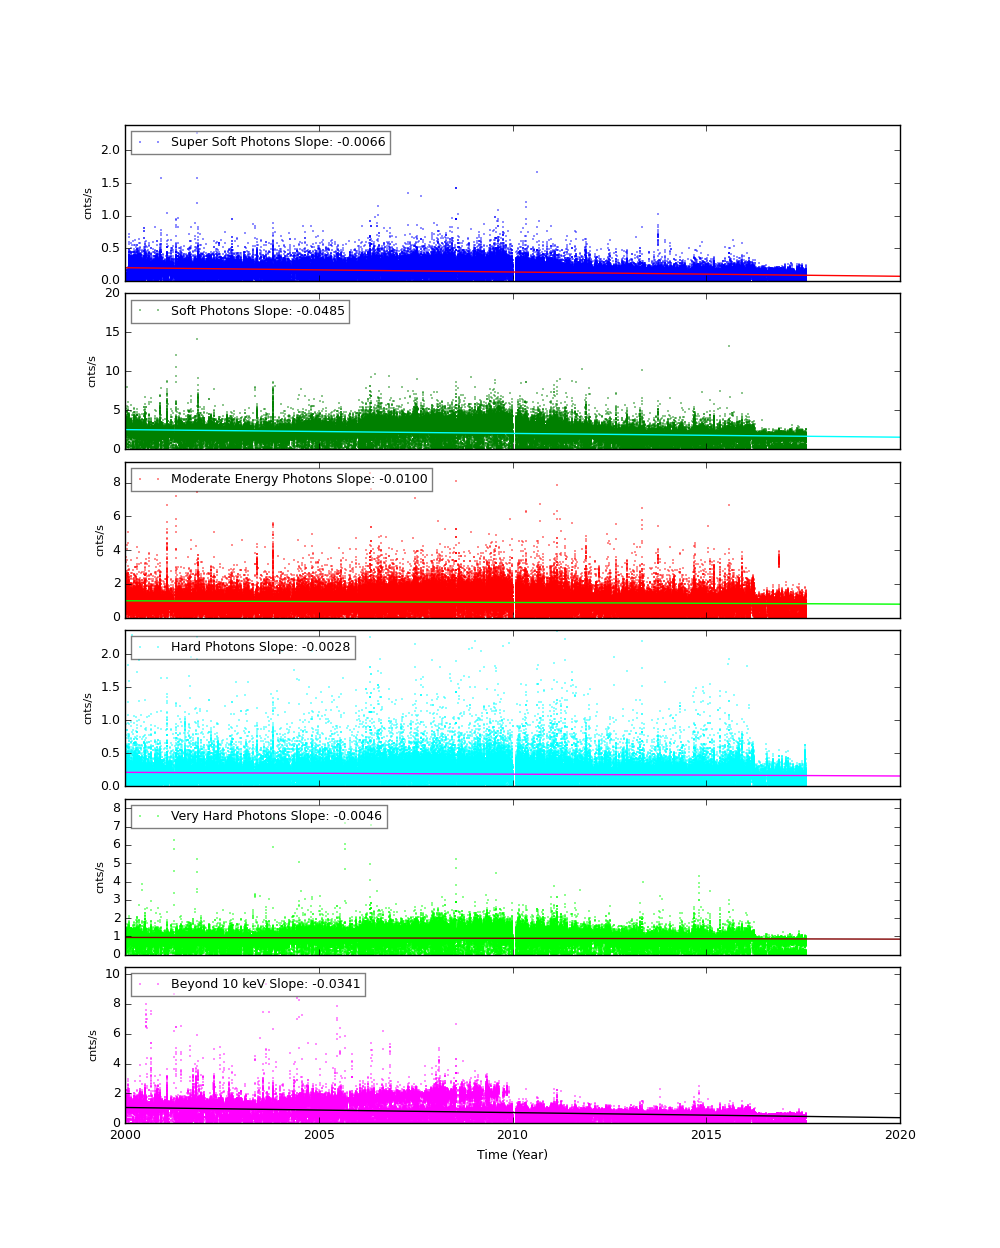
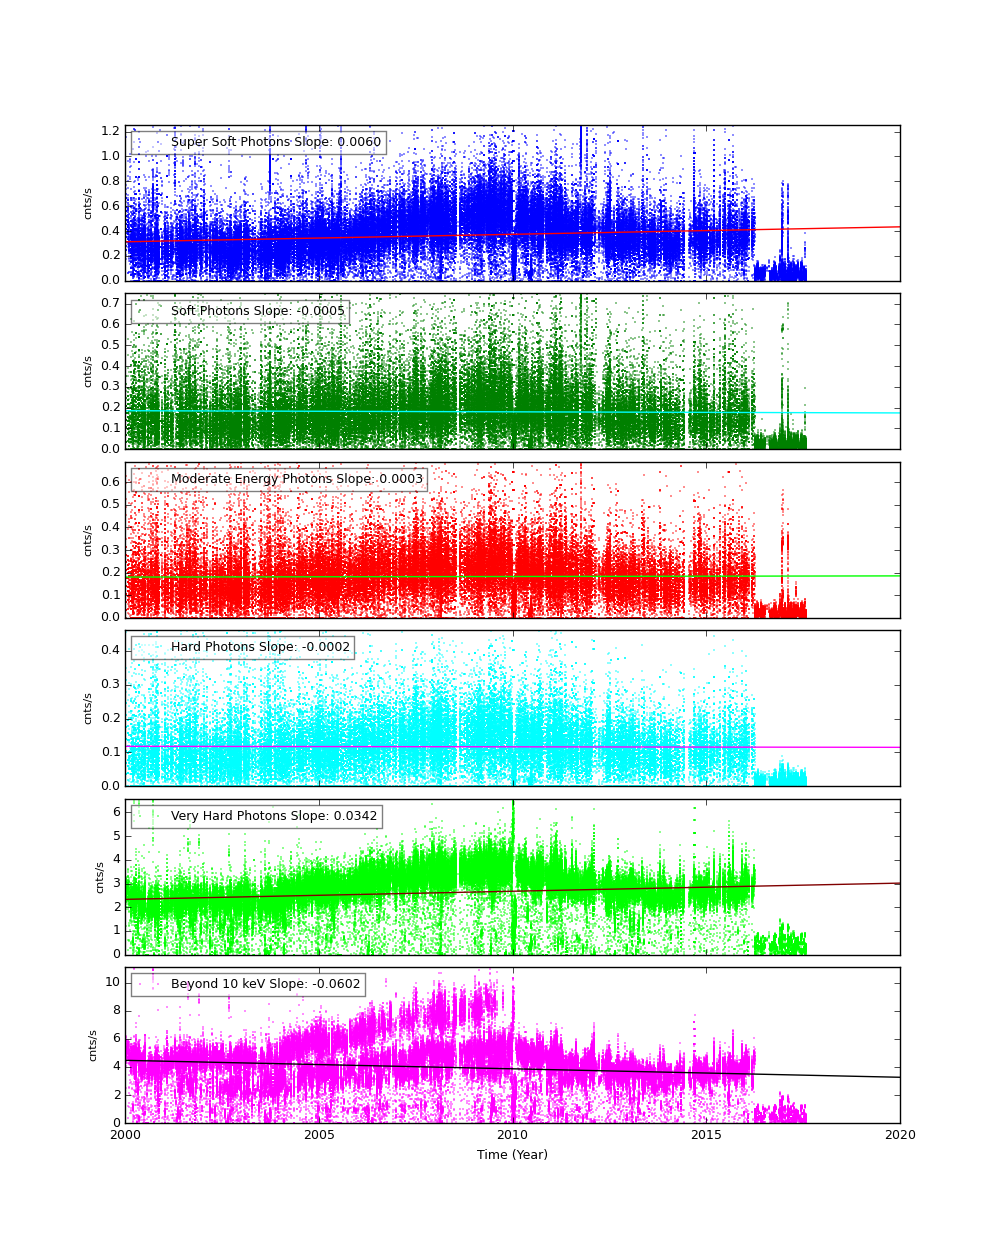
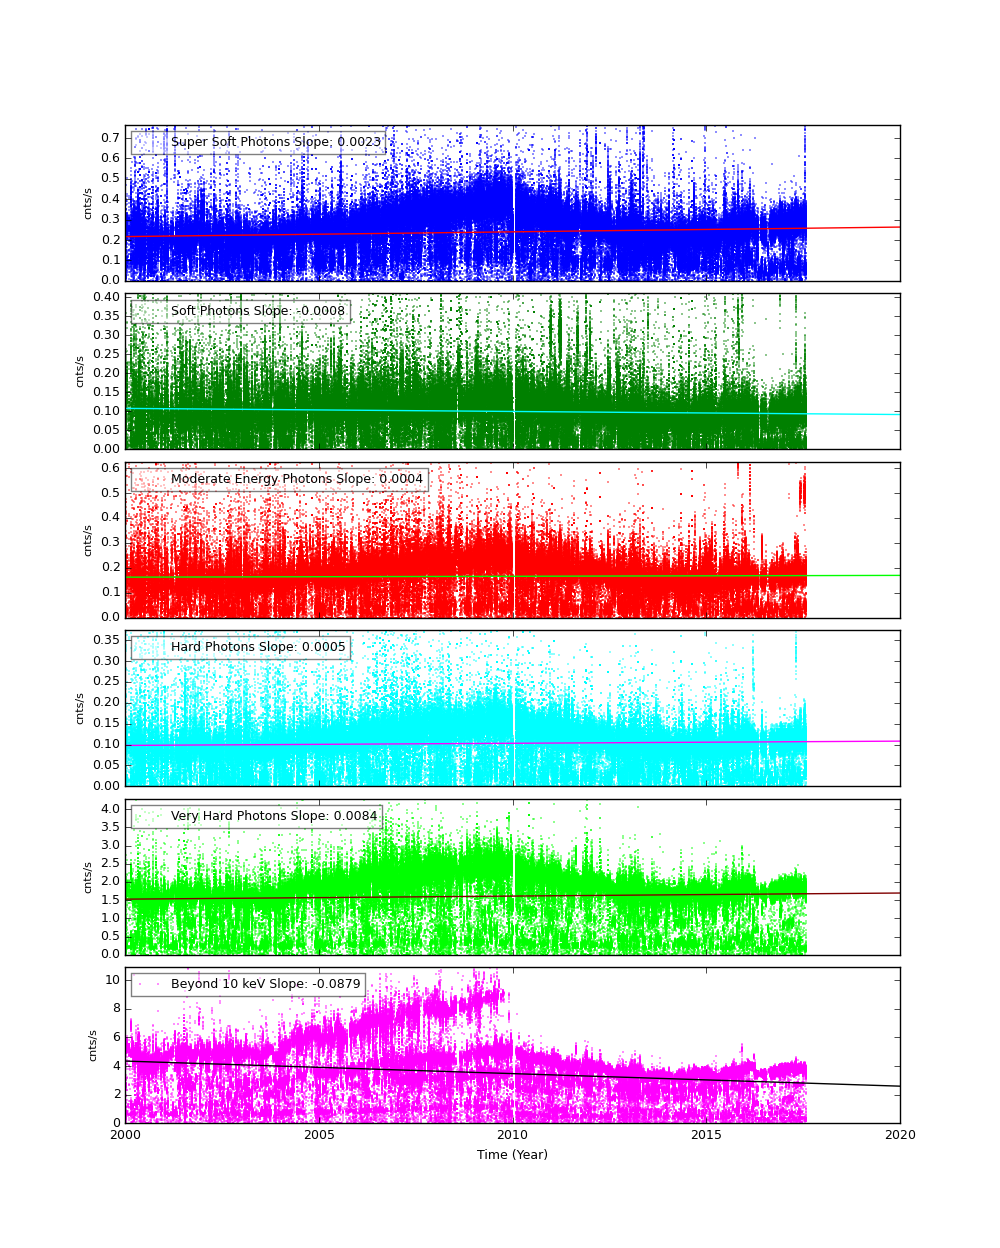
Science Instrument Background Rates
| Name | Low (keV) | High(KeV) | Description |
|---|---|---|---|
| SSoft | 0.00 | 0.50 | Super soft photons |
| Soft | 0.50 | 1.00 | Soft photons |
| Med | 1.00 | 3.00 | Moderate energy photons |
| Hard | 3.00 | 5.00 | Hard Photons |
| Harder | 5.00 | 10.00 | Very Hard photons |
| Hardest | 10.00 | Beyond 10 keV |
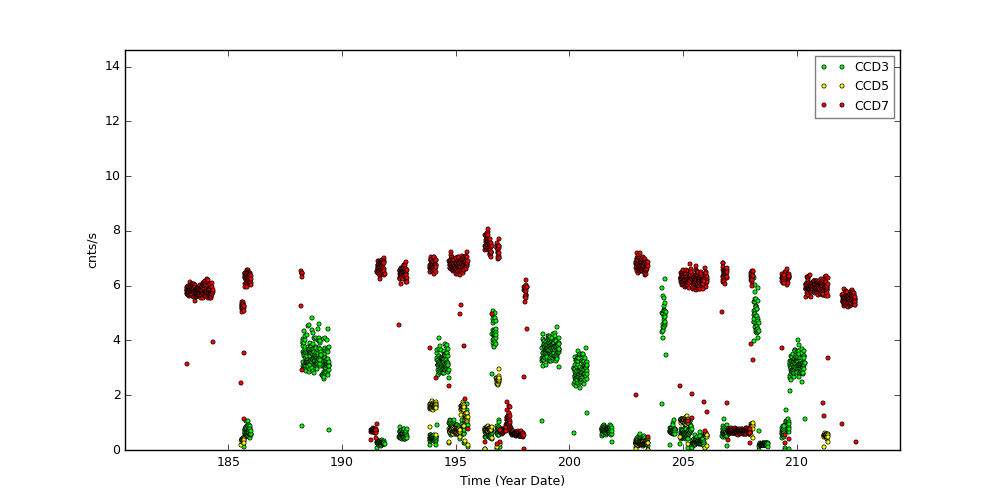
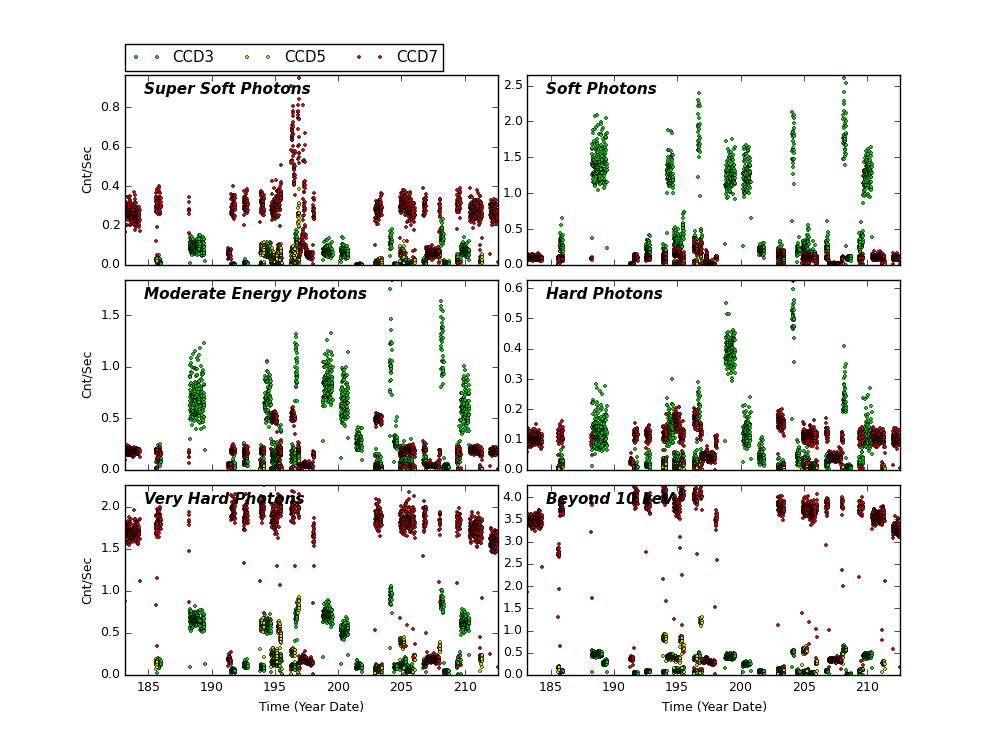
The following three plots show trends of SIB from year 2000. CCDs shown here are CCD3, CCD5, and CCD7. Fitted lines are linear fit after eliminating extreme outliers. For >10 keV plots, 2 lines are fit. One is with a 13 keV filter, and another without.
CCD 3
CCD 5
CCD 7
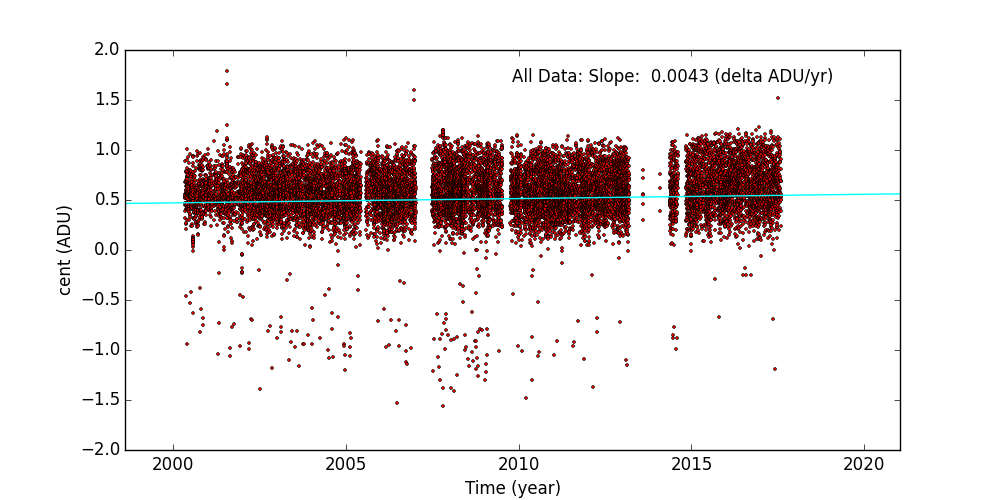
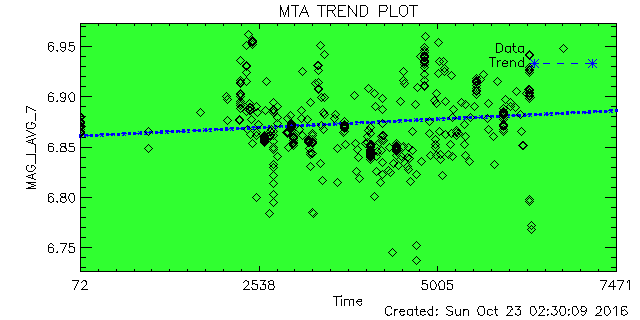
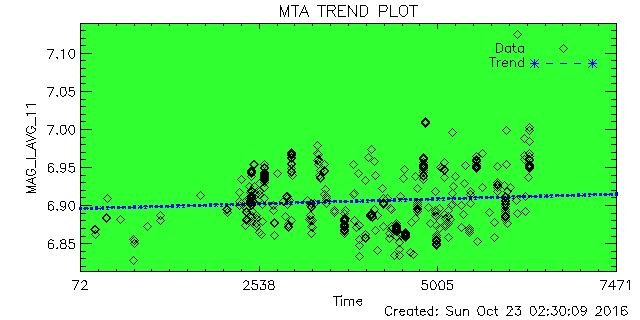
ACIS Corner Pixels
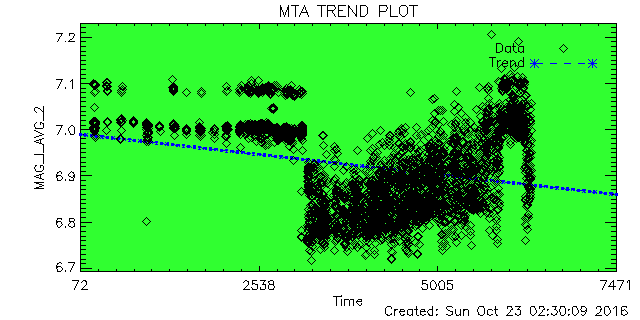
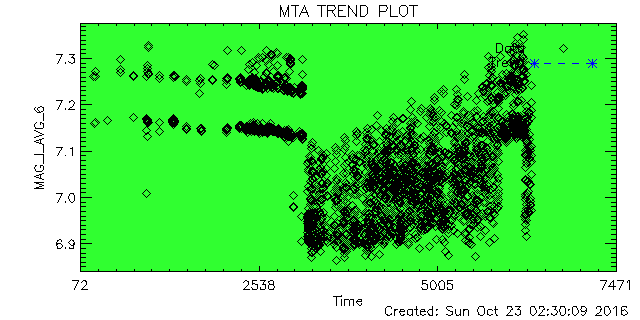
We plot the average corner pixel centroid slope and mean for ACIS observations. Separate plots are shown for FAINT MODE (3X3) and VFAINT MODE (5X5) observations. Metric is the centroid of a Gaussian fit to the histogram of corner pixel PHA values of detected events. Plus signs are FAINT observations, diamonds are VFAINT observations, and boxes are VFAINT observations with centroids computed using only the corner pixels of a 3X3 event island (referred to as AFAINT). We see a very small upward trend.
CCD: I3
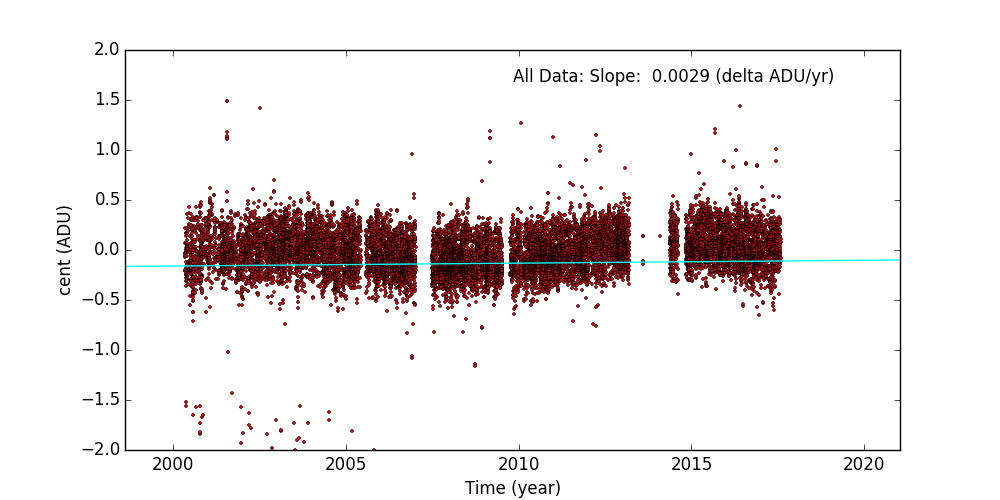
CCD: S3
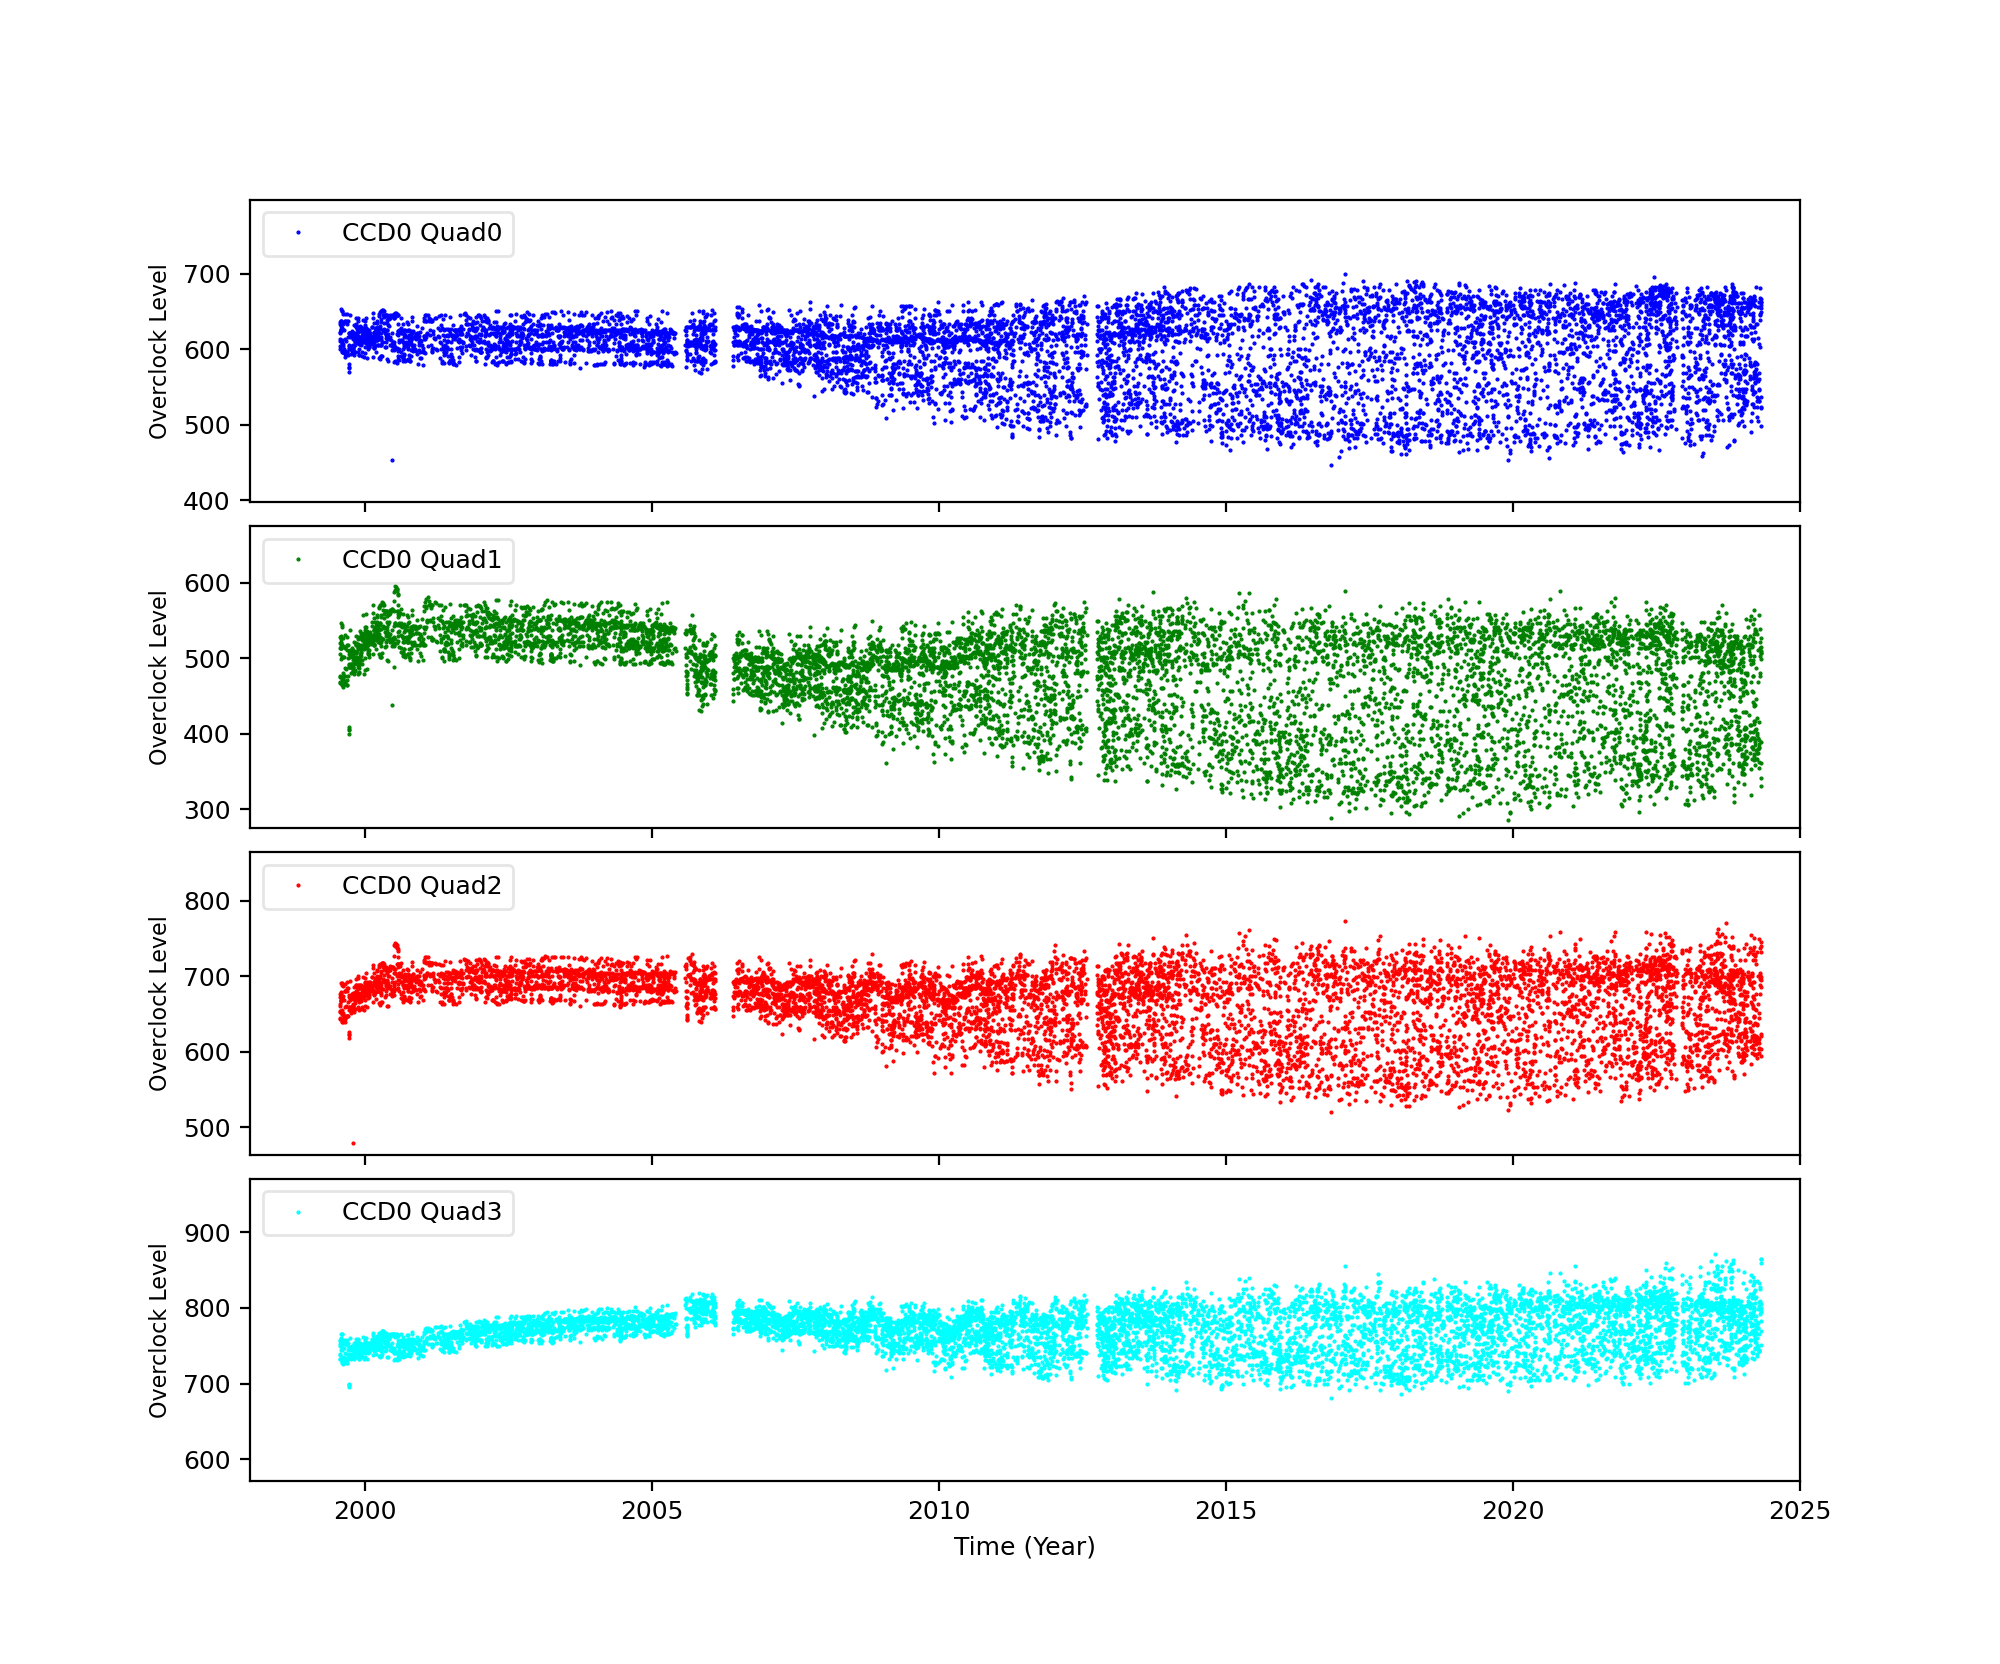
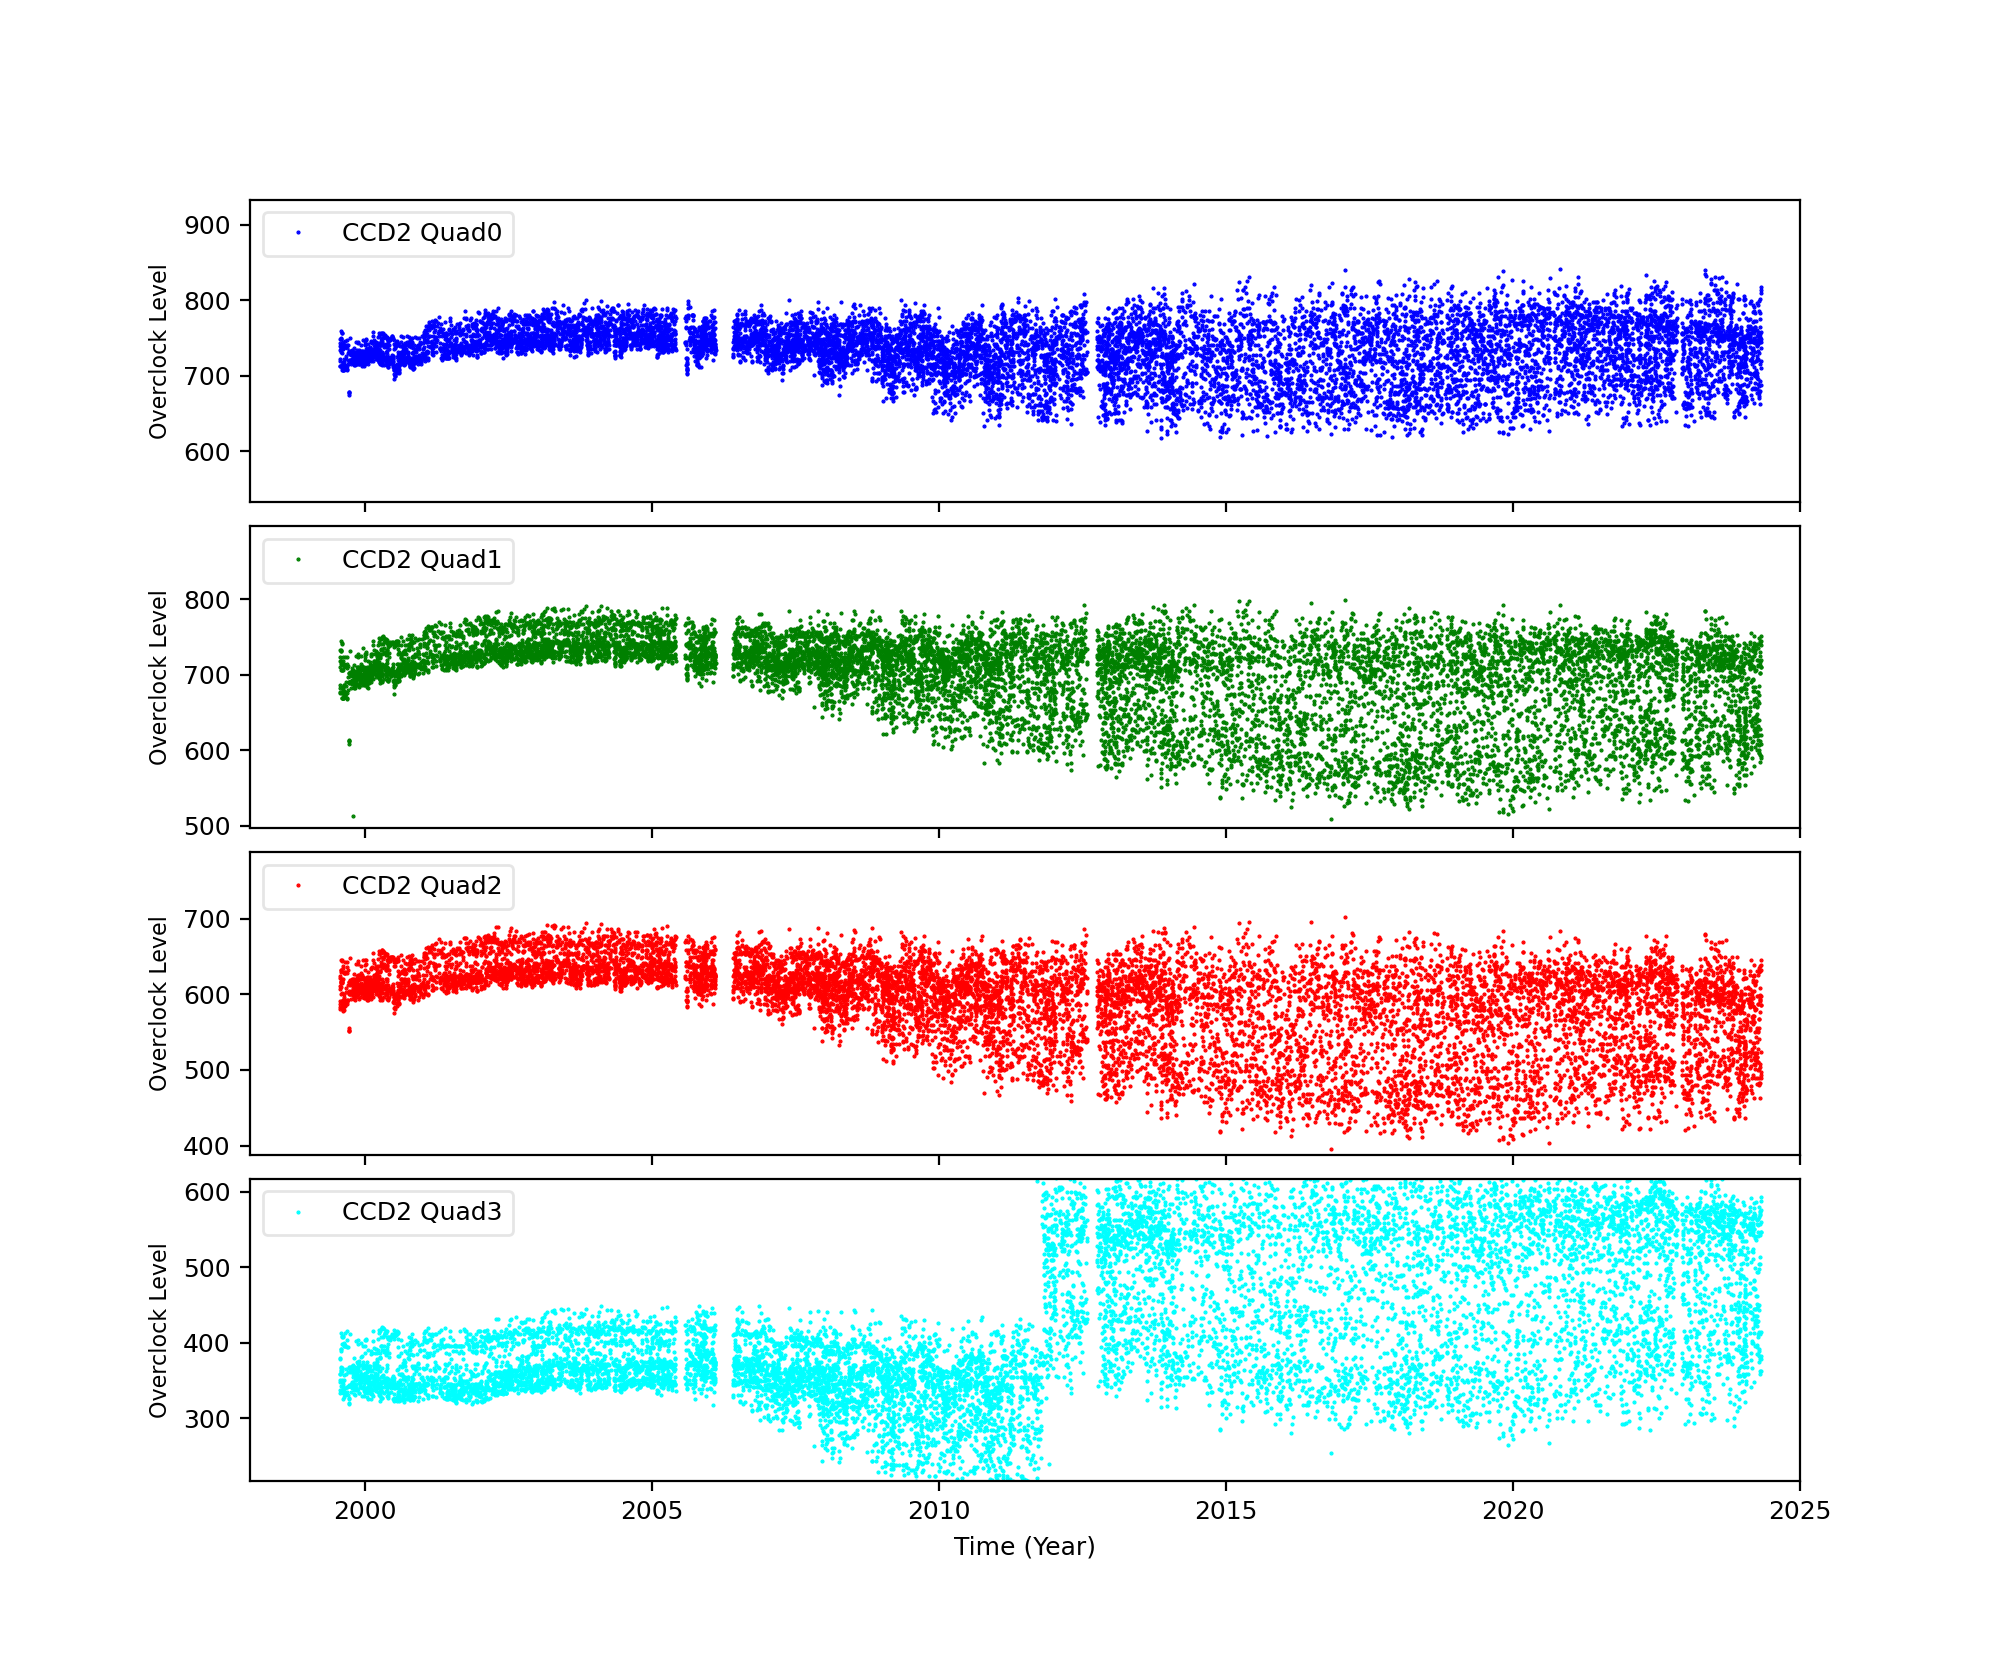
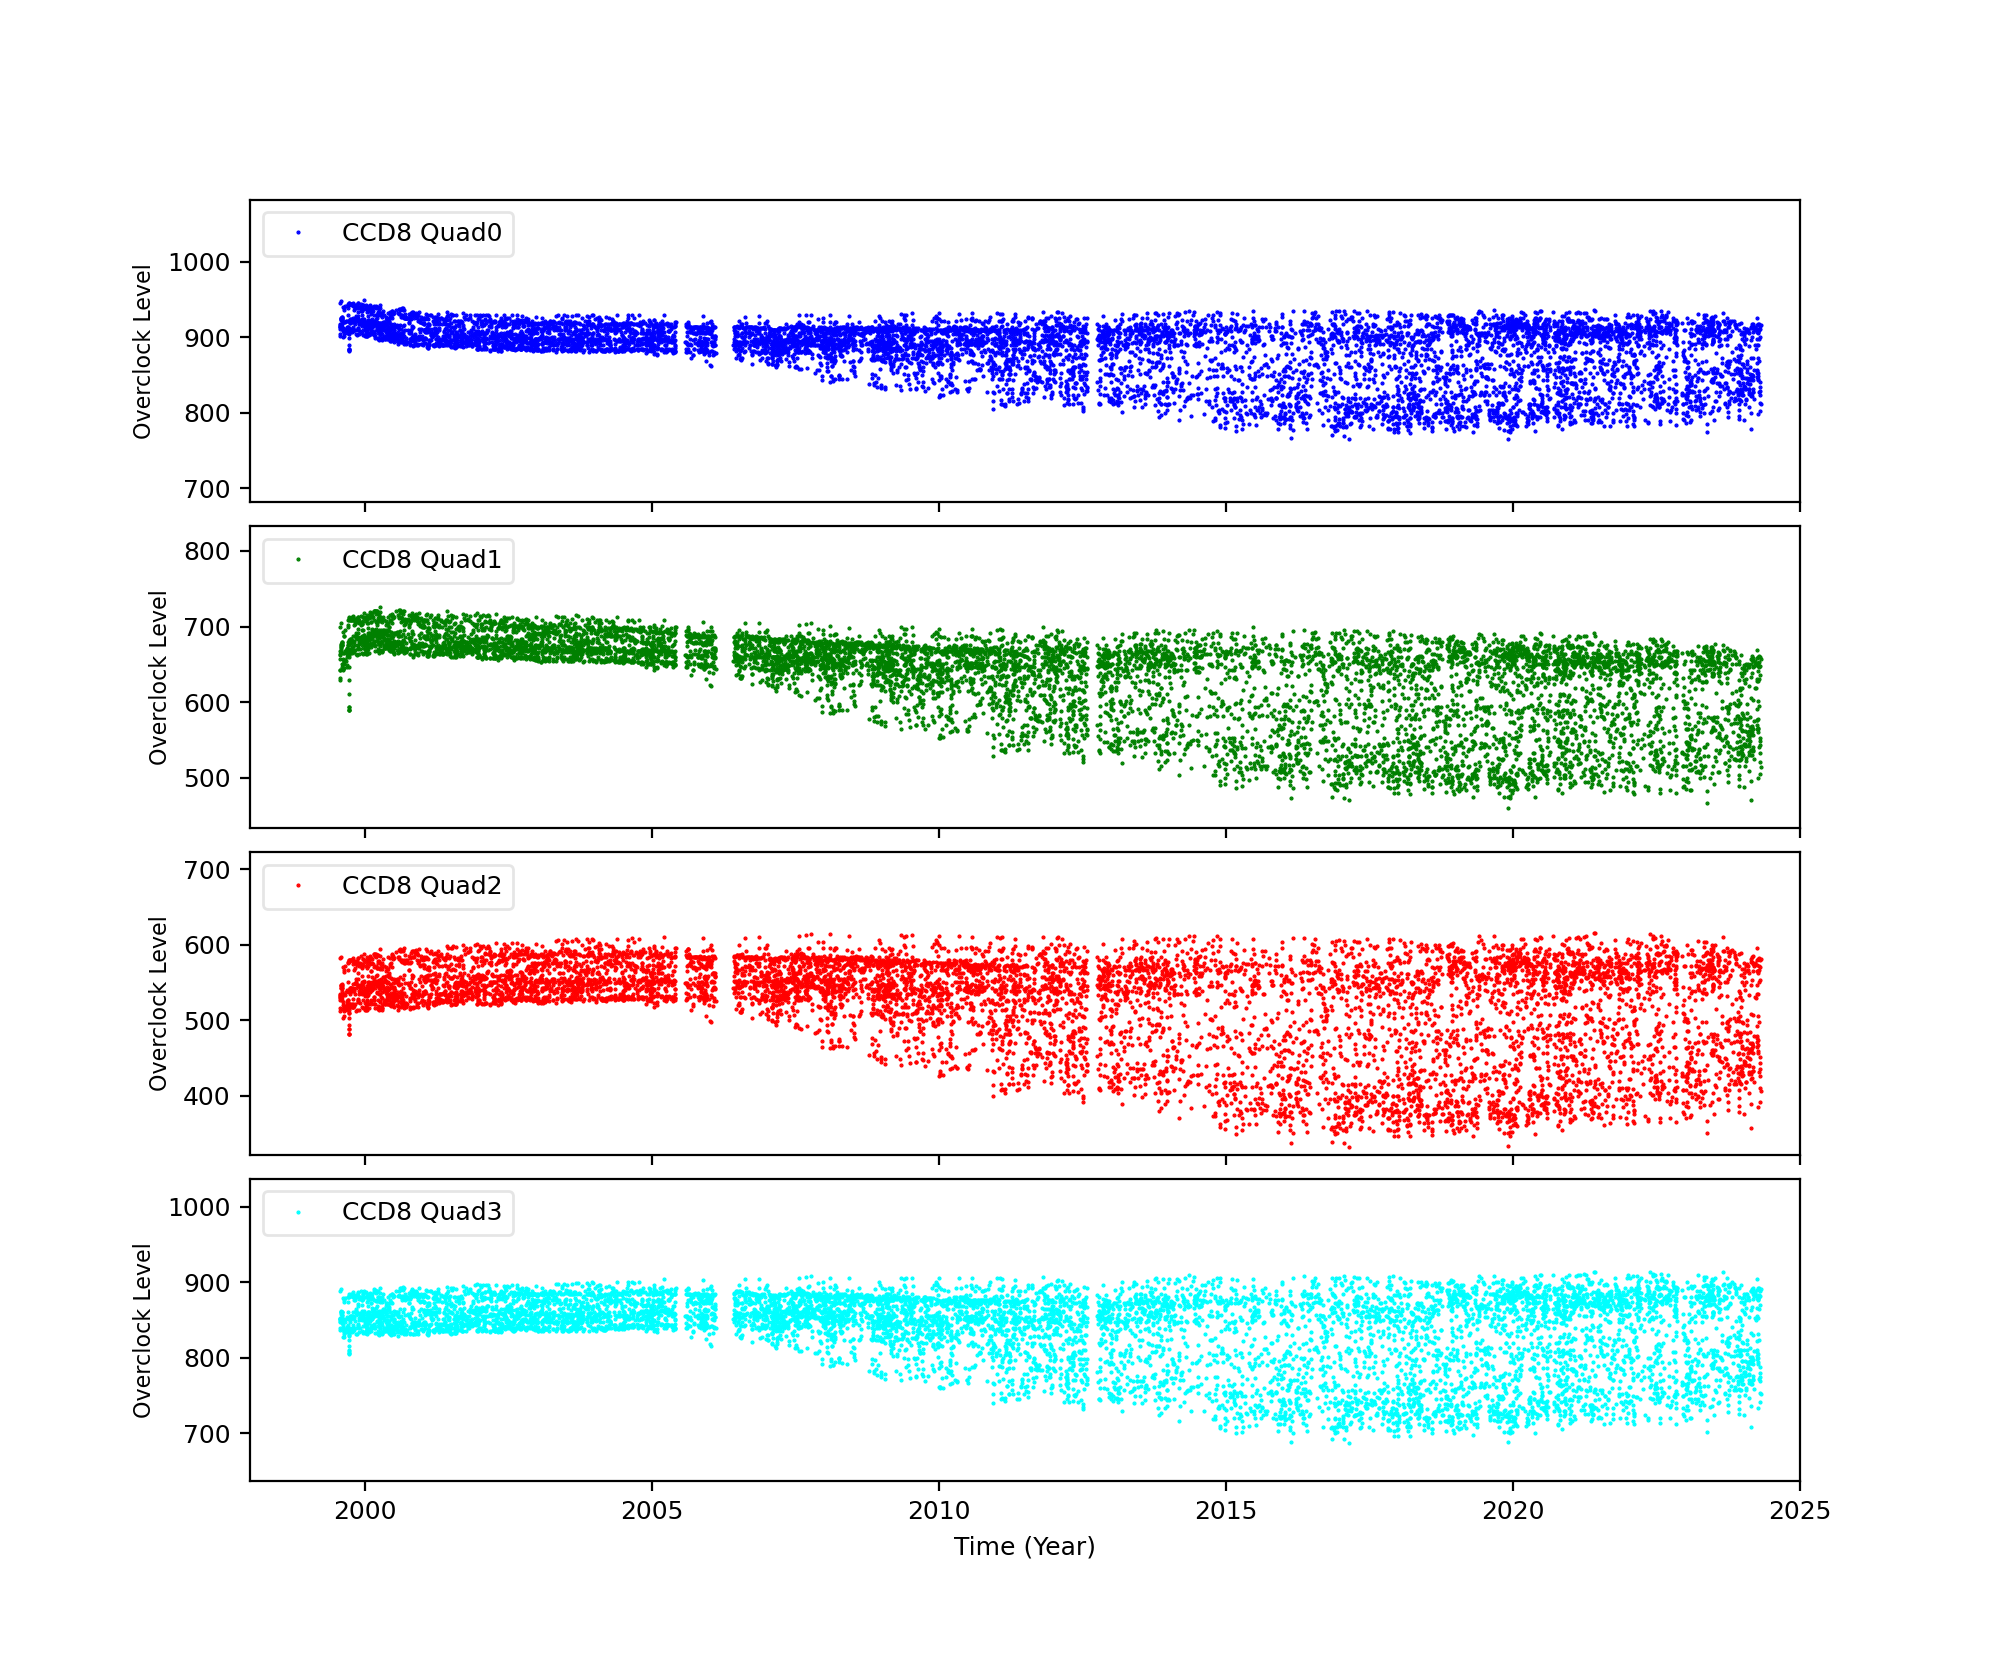
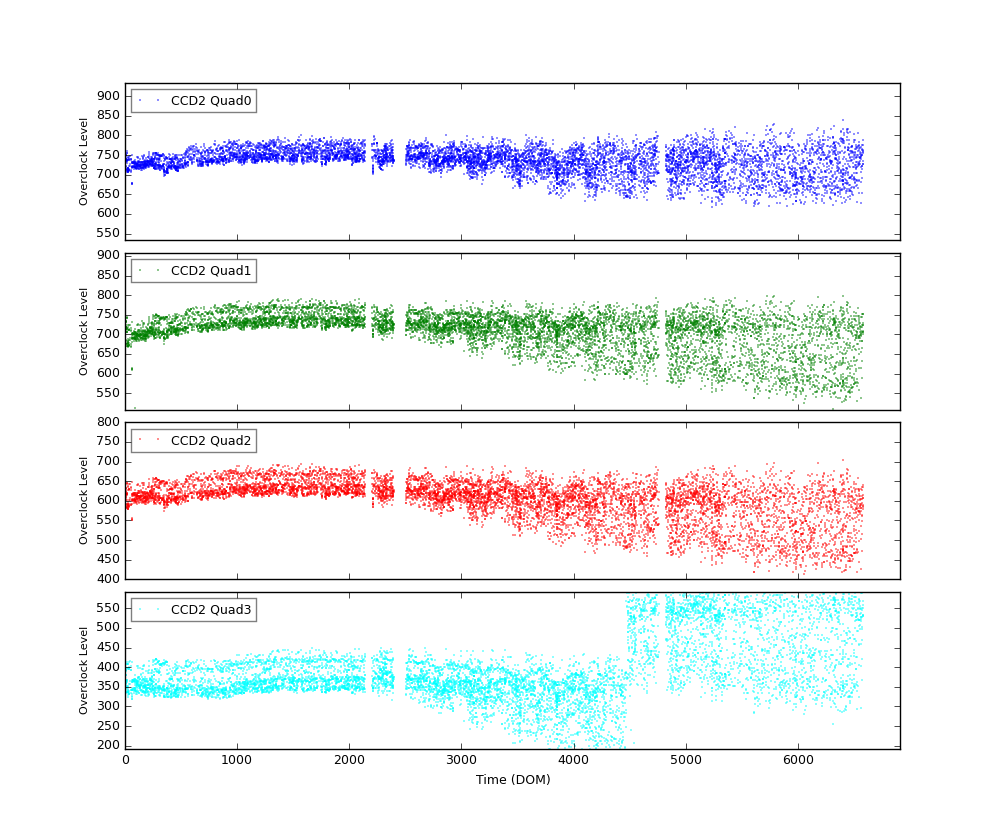
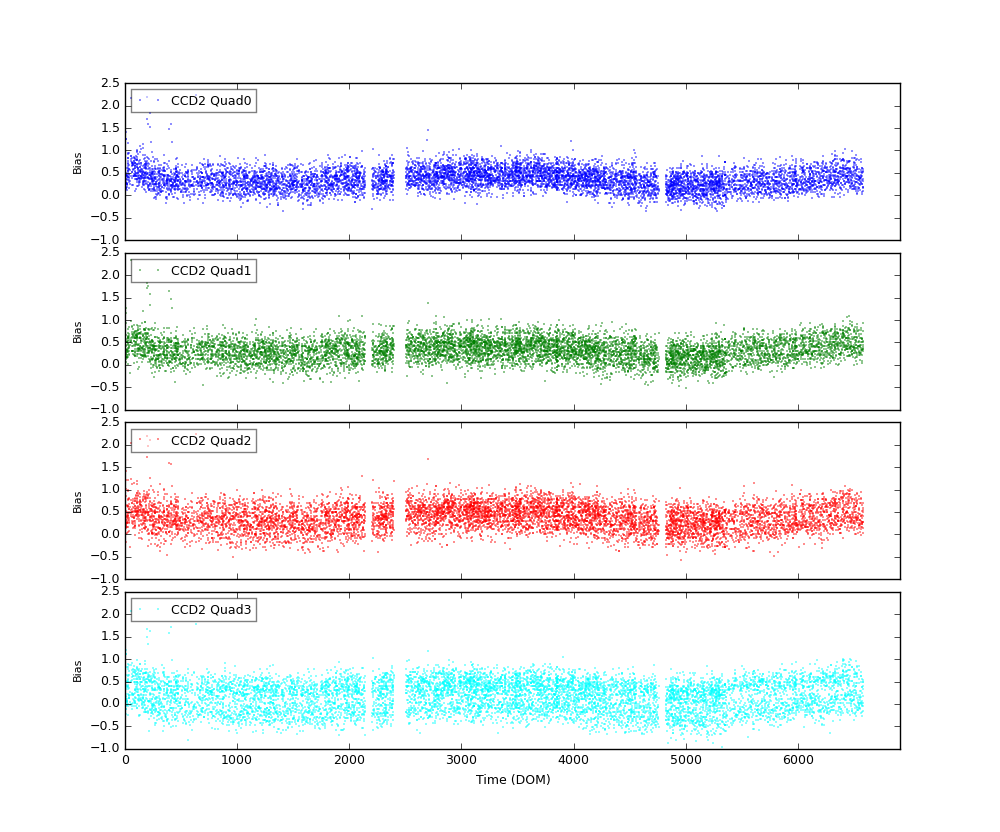
ACIS Bias Trends
The bias plus overclock level was calculated as follows:
- Get acisf*bias0.fits is obtained from a database or /dsops/ap/sdp/cache/*/acis/
- Data with timed mode exposure is selected.
- Fits files were divided into 4 quads, then an average of bias level for each quad is computed. No corrections for dead spots, columns etc were included.
An example of Overclock values as reported in FITS file header:
An example of mean bias minus overclock value:
HRC
DOSE of Central 4K Pore-Pairs
Please refer to Maximum Dose Trends for more details.
)
|
|---|
IMAGE                NPIX      MEAN    STDDEV      MIN       MAX
HRCI_07_2017.fits  16777216	0.029 	0.169 	0.000 	3.000
)
IMAGE                       NPIX      MEAN    STDDEV      MIN       MAX
HRCI_08_1999_07_2017.fits  16777216	4.971 	5.226 	0.000 	292.000
No Data
)
IMAGE                       NPIX      MEAN    STDDEV      MIN       MAX
HRCS_08_1999_07_2017.fits  16777216	16.577 	29.653 	0.000 	1712.000
|
|
Max dose trend plots corrected for events that "pile-up"
in the center of the taps due to bad position information.
|
)
|
)
|
)
|
)
|
| Apr 2017 | Jan 2017 | Oct 2016 | Jul 2016 |
|---|
)
|
)
|
)
|
)
|
| Apr 2017 | Jan 2017 | Oct 2016 | Jul 2016 |
|---|
Gratings
Focus
We plot the width of the zero order streak of ACIS/HETG observations and the width of the zero order image for HRC/LETG observations of point sources. No significant defocusing trend is seen at this time. See Gratings Focus pages.
PCAD
ACA Trending
ACIS-1
ACIS-6
HRC-I-1
HRC-S-1
Gyro Bias Drift
Radiation History
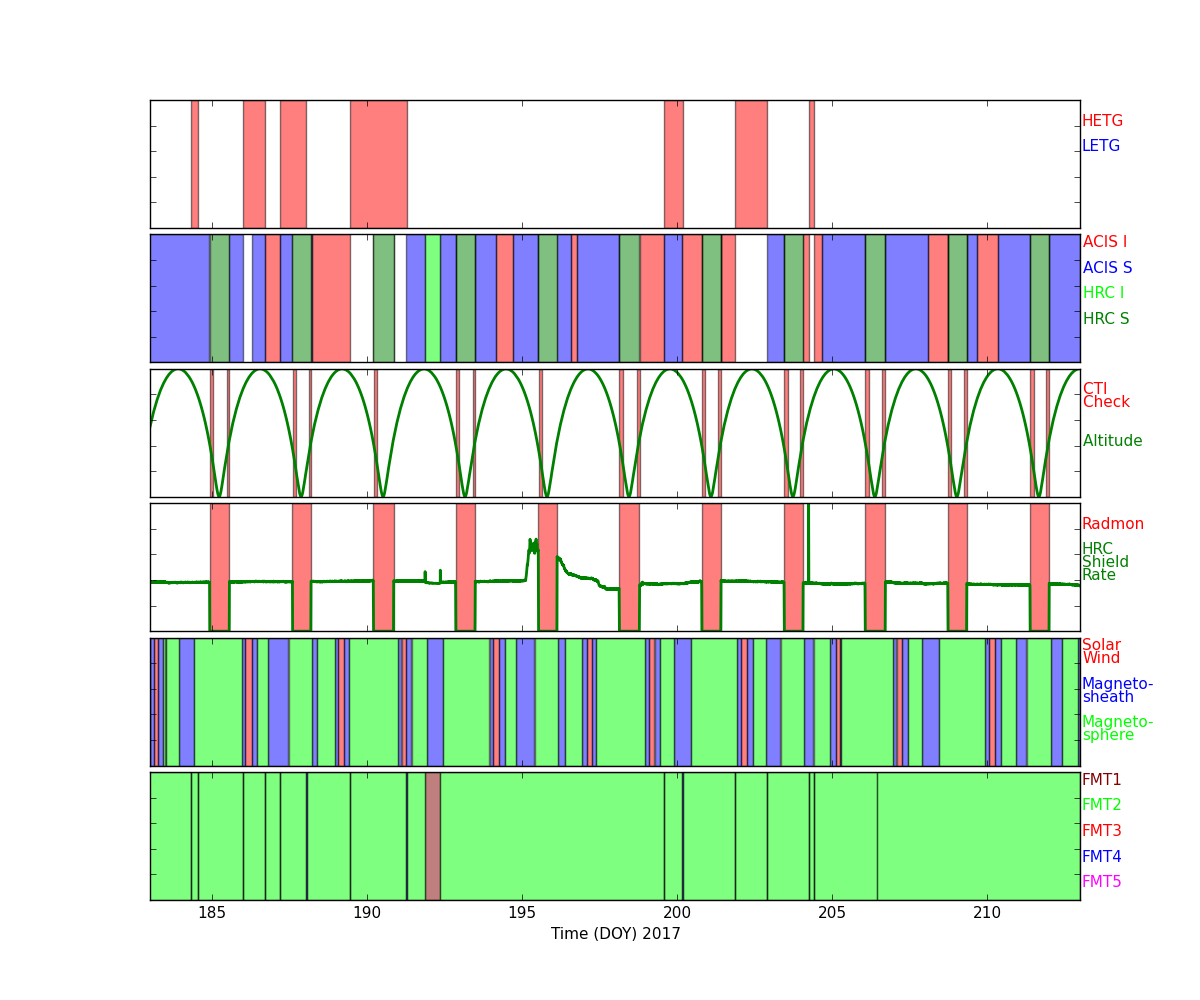
Radiation Zone Timing
Plotted below are radiation zone timing plots based on the following definitions of radiation zone:
- RADZONE - Ephin levels (in any of the E1300,P4GM,P41GM channels) are more than 1/3 of RADMON safing thresholds.
- RADMON - Radmon is disabled for radiation zone (as commanded based on OFLS model, for comparison with actual radiation levels).
- PERIGEE - Time of closest earth approach (for comparison)
Radiation Count Rates of Jul 2017
Sun Spot History
Trending
Quarterly Trends
- ACIS Temperature
| Previous Quarter | ||||||
| MSID | MEAN | RMS | DELTA/YR | DELTA/YR/YR | UNITS | DESCRIPTION |
| 1CBAT | 208.57 | 2.41 | -1.291e+00 | 6.205e+01 | K | CAMERA BODY TEMP. A |
| 1CRAT | 148.33 | 2.35 | 1.432e-01 | 3.047e+01 | K | COLD RADIATOR TEMP. A |
| 1CRBT | 149.08 | 2.45 | 3.869e-01 | 3.109e+01 | K | COLD RADIATOR TEMP. B |
| 1DACTBT | 257.62 | 2.93 | 2.286e+00 | 7.564e+01 | K | DA COLLIMATOR TEMP. B |
| 1DEAMZT | 291.99 | 7.79 | -6.906e+00 | 1.506e+02 | K | DEA -Z PANEL TEMP |
| 1DPAMYT | 293.18 | 7.84 | -8.303e+00 | 6.285e+01 | K | DPA -Y PANEL TEMP |
| 1DPAMZT | 296.17 | 7.68 | -8.555e+00 | 8.025e+01 | K | DPA -Z PANEL TEMP |
| 1OAHAT | 245.42 | 2.33 | -1.695e-01 | 5.277e+01 | K | OPEN ACTUATOR HOUSING TEMP. A |
| 1OAHBT | 241.43 | 2.16 | -5.268e-01 | 7.623e+01 | K | OPEN ACTUATOR HOUSING TEMP. B |
| 1PDEAAT | 302.42 | 6.33 | 3.035e+00 | -1.385e+02 | K | PSMC DEA PS A TEMP |
| 1PDEABT | 294.61 | 6.35 | 3.408e+00 | -1.465e+02 | K | PSMC DEA PS B TEMP |
| 1PIN1AT | 330.82 | 16.44 | 1.379e+01 | 7.254e+02 | K | PSMC TEMP 1A |
| 1WRAT | 191.68 | 2.34 | -1.016e+00 | 4.821e+01 | K | WARM RADIATOR TEMP. A |
| 1WRBT | 191.27 | 2.33 | -1.287e+00 | 5.667e+01 | K | WARM RADIATOR TEMP. B |
)
)
)
)
)
)
)
)
)
)
)
)
)
)
- ACIS Electronics Side B
| Previous Quarter | ||||||
| MSID | MEAN | RMS | DELTA/YR | DELTA/YR/YR | UNITS | DESCRIPTION |
| 1DAHBCU | 1.108e-05 | 5.226e-05 | 1.278e-05 | -2.101e-04 | AMP | DA HEATER CURRENT B |
| 1DAHBVO | 0.000e+00 | 0.000e+00 | 0.000e+00 | 0.000e+00 | V | DA HEATER VOLTAGE B |
| 1DAHHBVO | 0.000e+00 | 0.000e+00 | 0.000e+00 | 0.000e+00 | V | DA HOUSING HEATER INPUT VOLTAGE B |
| 1DE28BVO | 28.34 | 0.16 | 8.945e-01 | -8.733e+00 | V | DEA +28V INPUT B |
| 1DEICBCU | 16.39 | 1.773e-02 | 2.618e-02 | -3.243e-01 | AMP | DEA INPUT CURRENT B |
| 1DEN0BVO | -0.16 | 1.782e-02 | 1.643e-02 | 2.830e-01 | V | DEA -6V VOLTAGE B |
| 1DEN1BVO | -0.35 | 4.930e-02 | 4.469e-02 | 6.534e-01 | V | DEA -15V VOLTAGE B |
| 1DEP0BVO | 0.06 | 1.818e-02 | -1.875e-02 | -2.048e-01 | V | DEA +6V VOLTAGE B |
| 1DEP1BVO | 0.15 | 4.543e-02 | -4.228e-02 | -6.237e-01 | V | DEA +15V ANALOG B |
| 1DEP2BVO | 0.24 | 6.955e-02 | -6.588e-02 | -9.572e-01 | V | DEA +24V ANALOG B |
| 1DEP3BVO | 0.30 | 9.006e-02 | -8.475e-02 | -1.176e+00 | V | DEA +28V ANALOG B |
| 1DP28BVO | 28.36 | 0.16 | 8.765e-01 | -8.971e+00 | V | DPA +28V INPUT B |
| 1DPICBCU | 1.00 | 0.33 | -4.320e-01 | -2.385e+00 | AMP | DPA INPUT CURRENT B |
| 1DPP0BVO | 5.23 | 4.651e-02 | -5.403e-02 | -4.311e-01 | V | DPA +5V ANALOG B |
)
)
)
)
)
)
)
)
)
)
)
)
)
)
- EPHIN Temperature and Voltage
| Previous Quarter | ||||||
| MSID | MEAN | RMS | DELTA/YR | DELTA/YR/YR | UNITS | DESCRIPTION |
| 5EIOT | 354.71 | 19.52 | -1.024e+01 | 1.635e+02 | K | EIO TEMP |
| 5EPHINT | 334.27 | 6.20 | -2.124e+01 | 1.981e+02 | K | EPHIN TEMP |
| HKEBOXTEMP | 339.48 | 6.45 | -2.204e+01 | 1.982e+02 | K | EPHIN HOUSEKEEPING EBOX: TEMPERATURE (5EHSE300) |
| HKN6I | 73.13 | 0.24 | 5.066e-01 | -6.930e+00 | AMP | HK 6 Volts Rail - Current |
| HKN6V | -5.97 | 1.149e-02 | -1.547e-02 | 3.482e-01 | V | HK -6 Volts Rail - Voltage |
| HKP27I | 6.98 | 0.10 | 2.538e-01 | -2.608e+00 | AMP | HK 27 Volts Rail - Current |
| HKP27V | 26.88 | 4.905e-02 | -8.520e-02 | 1.580e+00 | V | HK 27 Volts Rail - Voltage |
| HKP5I | 49.31 | 1.90 | -1.158e+00 | 6.135e+01 | AMP | HK 5 Volts Rail - Current |
| HKP5V | 5.08 | 8.875e-03 | 1.587e-02 | -1.002e-01 | V | HK 5 Volts Rail - Voltage |
| HKP6I | 137.55 | 0.73 | -2.404e+00 | 8.670e+00 | AMP | HK 6 Volts Rail - Current |
| HKP6V | 5.77 | 1.356e-02 | 3.652e-02 | -2.107e-01 | V | HK 6 Volts Rail - Voltage |
| TEIO | 327.99 | 20.59 | -1.003e+01 | 2.788e+02 | K | EPHIN ELECTRONICS HOUSING TEMP |
| TEPHIN | 334.43 | 6.39 | -2.093e+01 | 2.040e+02 | K | EPHIN SENSOR HOUSING TEMP |
)
)
)
)
)
)
)
)
)
)
)
)
)
Envelope Trending
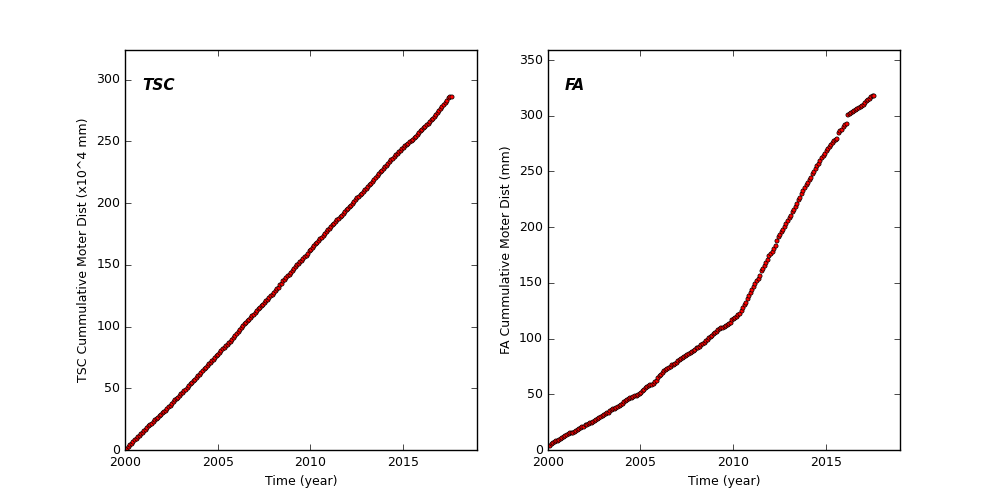
Spacecraft Motions
TSC and FA Cummulative Moter Distance
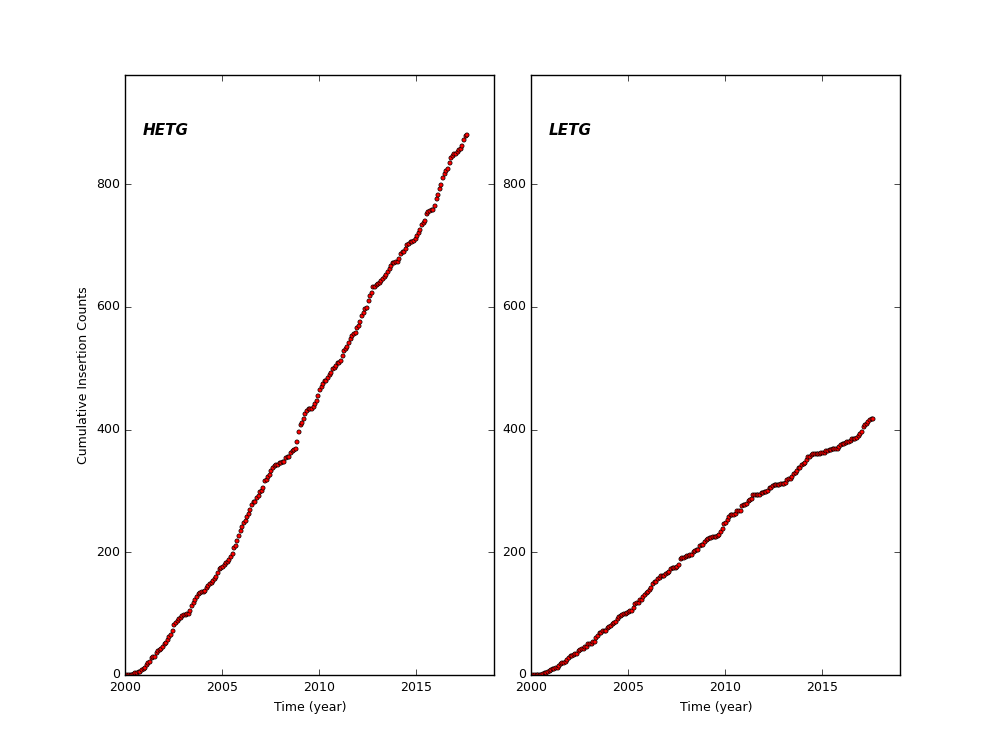
HETG and LETG Cummulative Insertion Counts
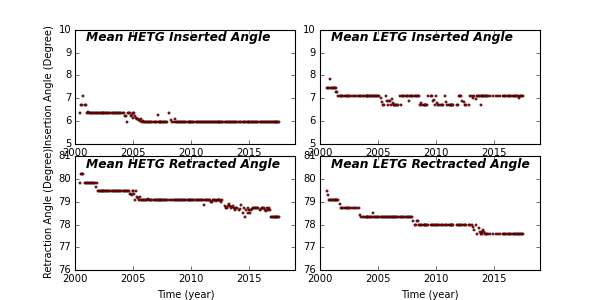
HETG/LETG Insertion/Retraction Angle
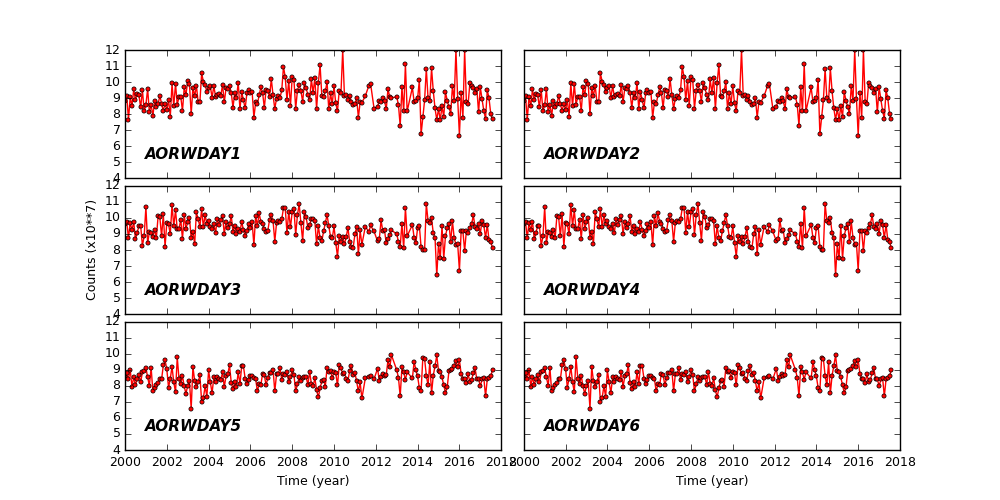
Reaction Wheel Rotations
Links to Past Monthly Reports
| Year | Month | |||||||||||
|---|---|---|---|---|---|---|---|---|---|---|---|---|
| 2017 | Jan | Feb | Mar | Apr | May | Jun | ||||||
| 2016 | Jan | Feb | Mar | Apr | May | Jun | Jul | Aug | Sep | Oct | Nov | Dec |
| 2015 | Jan | Feb | Mar | Apr | May | Jun | Jul | Aug | Sep | Oct | Nov | Dec |
| 2014 | Jan | Feb | Mar | Apr | May | Jun | Jul | Aug | Sep | Oct | Nov | Dec |
| 2013 | Jan | Feb | Mar | Apr | May | Jun | Jul | Aug | Sep | Oct | Nov | Dec |
| 2012 | Jan | Feb | Mar | Apr | May | Jun | Jul | Aug | Sep | Oct | Nov | Dec |
| 2011 | Jan | Feb | Mar | Apr | May | Jun | Jul | Aug | Sep | Oct | Nov | Dec |
| 2010 | Jan | Feb | Mar | Apr | May | Jun | Jul | Aug | Sep | Oct | Nov | Dec |
| 2009 | Jan | Feb | Mar | Apr | May | Jun | Jul | Aug | Sep | Oct | Nov | Dec |
| 2008 | Jan | Feb | Mar | Apr | May | Jun | Jul | Aug | Sep | Oct | Nov | Dec |
| 2007 | Jan | Feb | Mar | Apr | May | Jun | Jul | Aug | Sep | Oct | Nov | Dec |
| 2006 | Jan | Feb | Mar | Apr | May | Jun | Jul | Aug | Sep | Oct | Nov | Dec |
| 2005 | Jan | Feb | Mar | Apr | May | Jun | Jul | Aug | Sep | Oct | Nov | Dec |
| 2004 | Jan | Feb | Mar | Apr | May | Jun | Jul | Aug | Sep | Oct | Nov | Dec |
| 2003 | Jan | Feb | Mar | Apr | May | Jun | Jul | Aug | Sep | Oct | Nov | Dec |
| 2002 | Jan | Feb | Mar | Apr | May | Jun | Jul | Aug | Sep | Oct | Nov | Dec |
| 2001 | Jan | Feb | Mar | Apr | May | Jun | Jul | Aug | Sep | Oct | Nov | Dec |
| 2000 | Jan | Feb | Mar | Apr | May | Jun | Jul | Aug | Sep | Oct | Nov | Dec |
| 1999 | Jul | Aug | Sep | Oct | Nov | Dec | ||||||