ACIS
ACIS DOSE Registered-Photon-Map
The steps we took to compute the dose map are;
- Level 1 Event files for a specified month are obtained from archive.
- Image data including I2, I3, S2, S3 CCDs are extracted from all event files.
- All the extracted image data were merged to create a month long exposure map for the month.
- The exposure map is opened with ds9, and check a distribution of count rates against energy. From this, estimate the upper threshold value. Any events beyond this upper threshold are assumed erroneous events such as bad pixels.
- Using this upper threshold, the data is filtered, and create a cleaned exposure map for the month.
- The exposure map from each month from the Sep 1999 is added up to create a cumulative exposure map for each month.
- Using fimgstatistic, we compute count rate statistics for each CCDs.
- For observations with high data drop rates (e.g., Crab nebula, Cas A), we corrected the observations by adding events.
Please check more detail plots at Telemetered Photon Dose Trend page.
)
)
)
Statistics:
# IMAGE     NPIX     MEAN        RMS        MIN     MAX
ACIS_jun17 6004901       8.551         33.294           0.0     6173


I2 node 0  262654	5.246973	2.701529	0.0	 40.0
I2 node 1  262654	5.508080	3.672984	0.0	1181.0
I2 node 2  262654	5.516584	2.769673	0.0	 61.0
I2 node 3  262654	5.410435	13.180072	0.0	6042.0

I3 node 0  262654	6.582836	3.258896	0.0	 42.0
I3 node 1  262654	6.413680	3.547317	0.0	128.0
I3 node 2  262654	6.228551	2.917640	0.0	 68.0
I3 node 3  262654	6.269837	3.007158	0.0	100.0

S2 node 0  262654	9.139315	8.866881	0.0	1044.0
S2 node 1  262654	10.331513	11.493727	0.0	2536.0
S2 node 2  262654	13.645883	16.992568	0.0	3251.0
S2 node 3  262654	14.544430	18.574369	0.0	543.0

S3 node 0  262654	16.723621	25.952478	0.0	391.0
S3 node 1  262654	36.841659	32.365199	0.0	238.0
S3 node 2  262654	35.598200	29.348656	0.0	210.0
S3 node 3  262654	14.745071	14.265803	0.0	174.0
)
)
)
Statistics:
 IMAGE     NPIX      MEAN        RMS           MIN      MAX
ACIS_total   6004901       2113.688         2747.628           0.0   120031


I2 node 0  262654	1815.349537	353.975545	370.0	10038.0
I2 node 1  262654	1911.469458	490.390262	393.0	63515.0
I2 node 2  262654	5.516584	2.769673	0.0	 61.0
I2 node 3  262654	1949.565072	501.700957	380.0	28377.0

I3 node 0  262654	2061.949950	509.705062	378.0	8056.0
I3 node 1  262654	2144.553101	1623.052452	385.0	50649.0
I3 node 2  262654	1880.387452	344.415444	362.0	10378.0
I3 node 3  262654	6.269837	3.007158	0.0	100.0

S2 node 0  262654	2458.127960	362.057370	1311.0	21583.0
S2 node 1  262654	10.331513	11.493727	0.0	2536.0
S2 node 2  262654	2884.168727	543.886458	1722.0	27524.0
S2 node 3  262654	2809.411632	399.813431	1614.0	49945.0

S3 node 0  262654	4348.576264	1928.172767	1786.0	15872.0
S3 node 1  262654	5555.546576	2177.175517	0.0	14459.0
S3 node 2  262654	4326.189315	1091.821820	1807.0	10381.0
S3 node 3  262654	3331.663986	498.166508	1926.0	11065.0
)
|
)
|
)
|
)
|
| Mar 2017 | Dec 2016 | Sep 2016 | Jun 2016 |
|---|
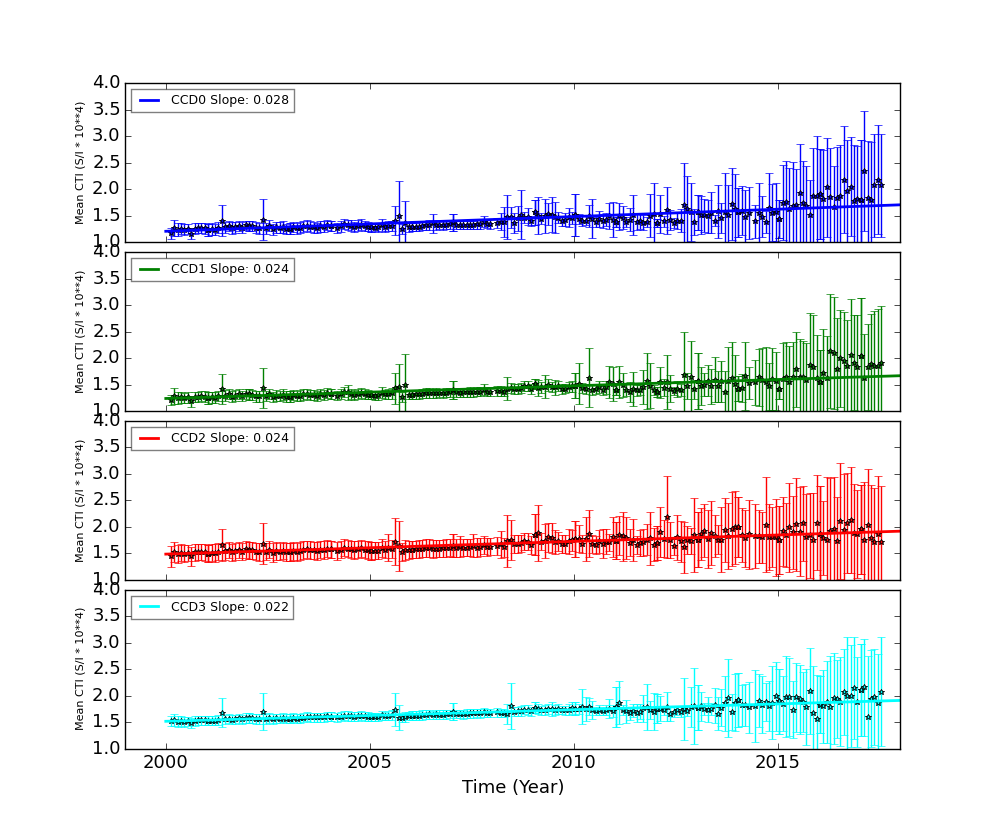
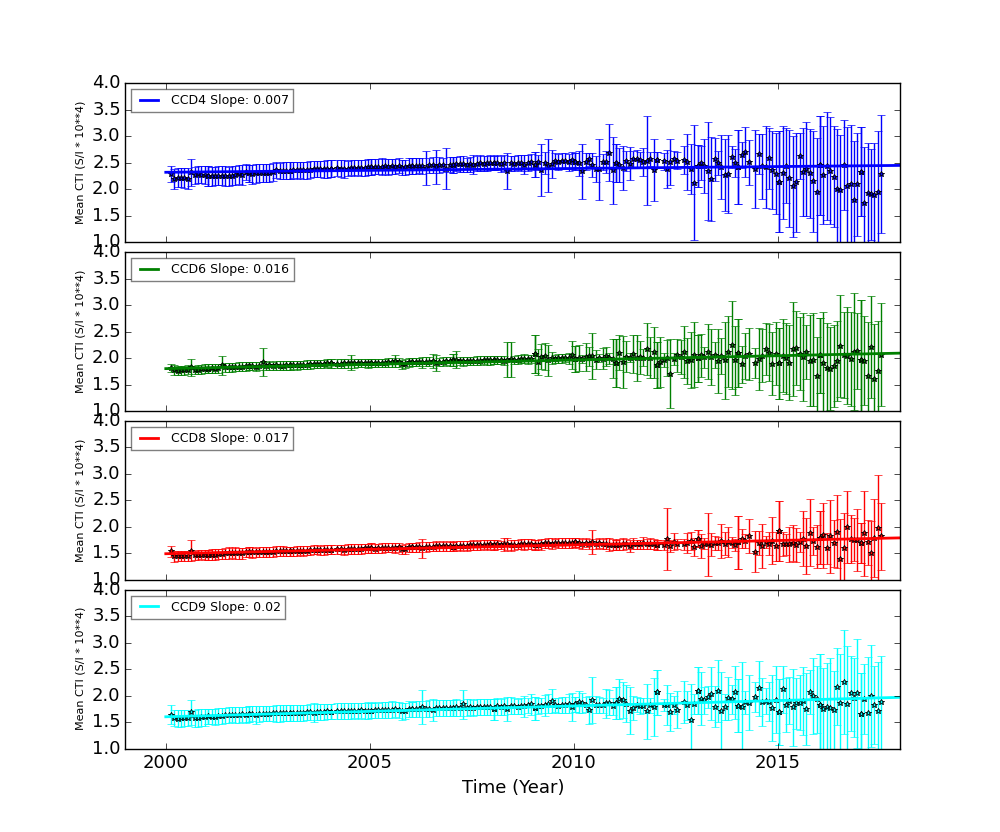
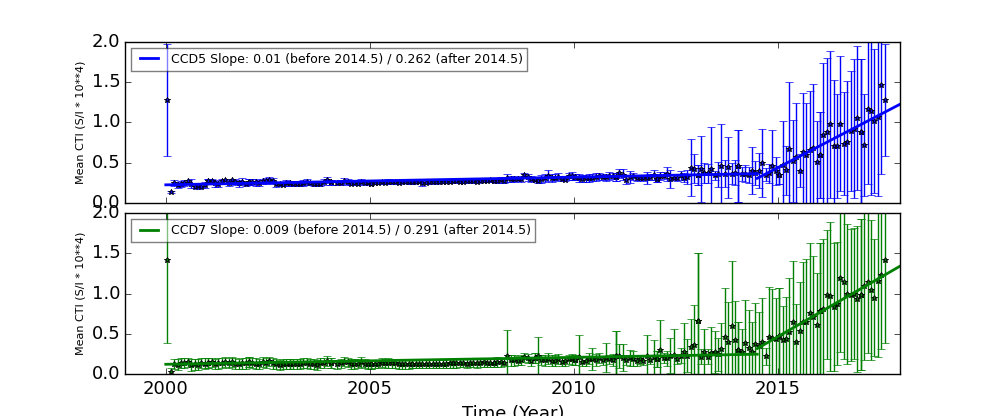
The Mean Detrended CTI
We report CTIs with a refined data definition. CTIs were computed for the temperature dependency corrected data. Please see CTI page for detailed explanation. CTI's are computed for Mn K alpha, and defined as slope/intercept x10^4 of row # vs ADU. Data file: here
Imaging CCDs
Spectral CCDs
Backside CCDs
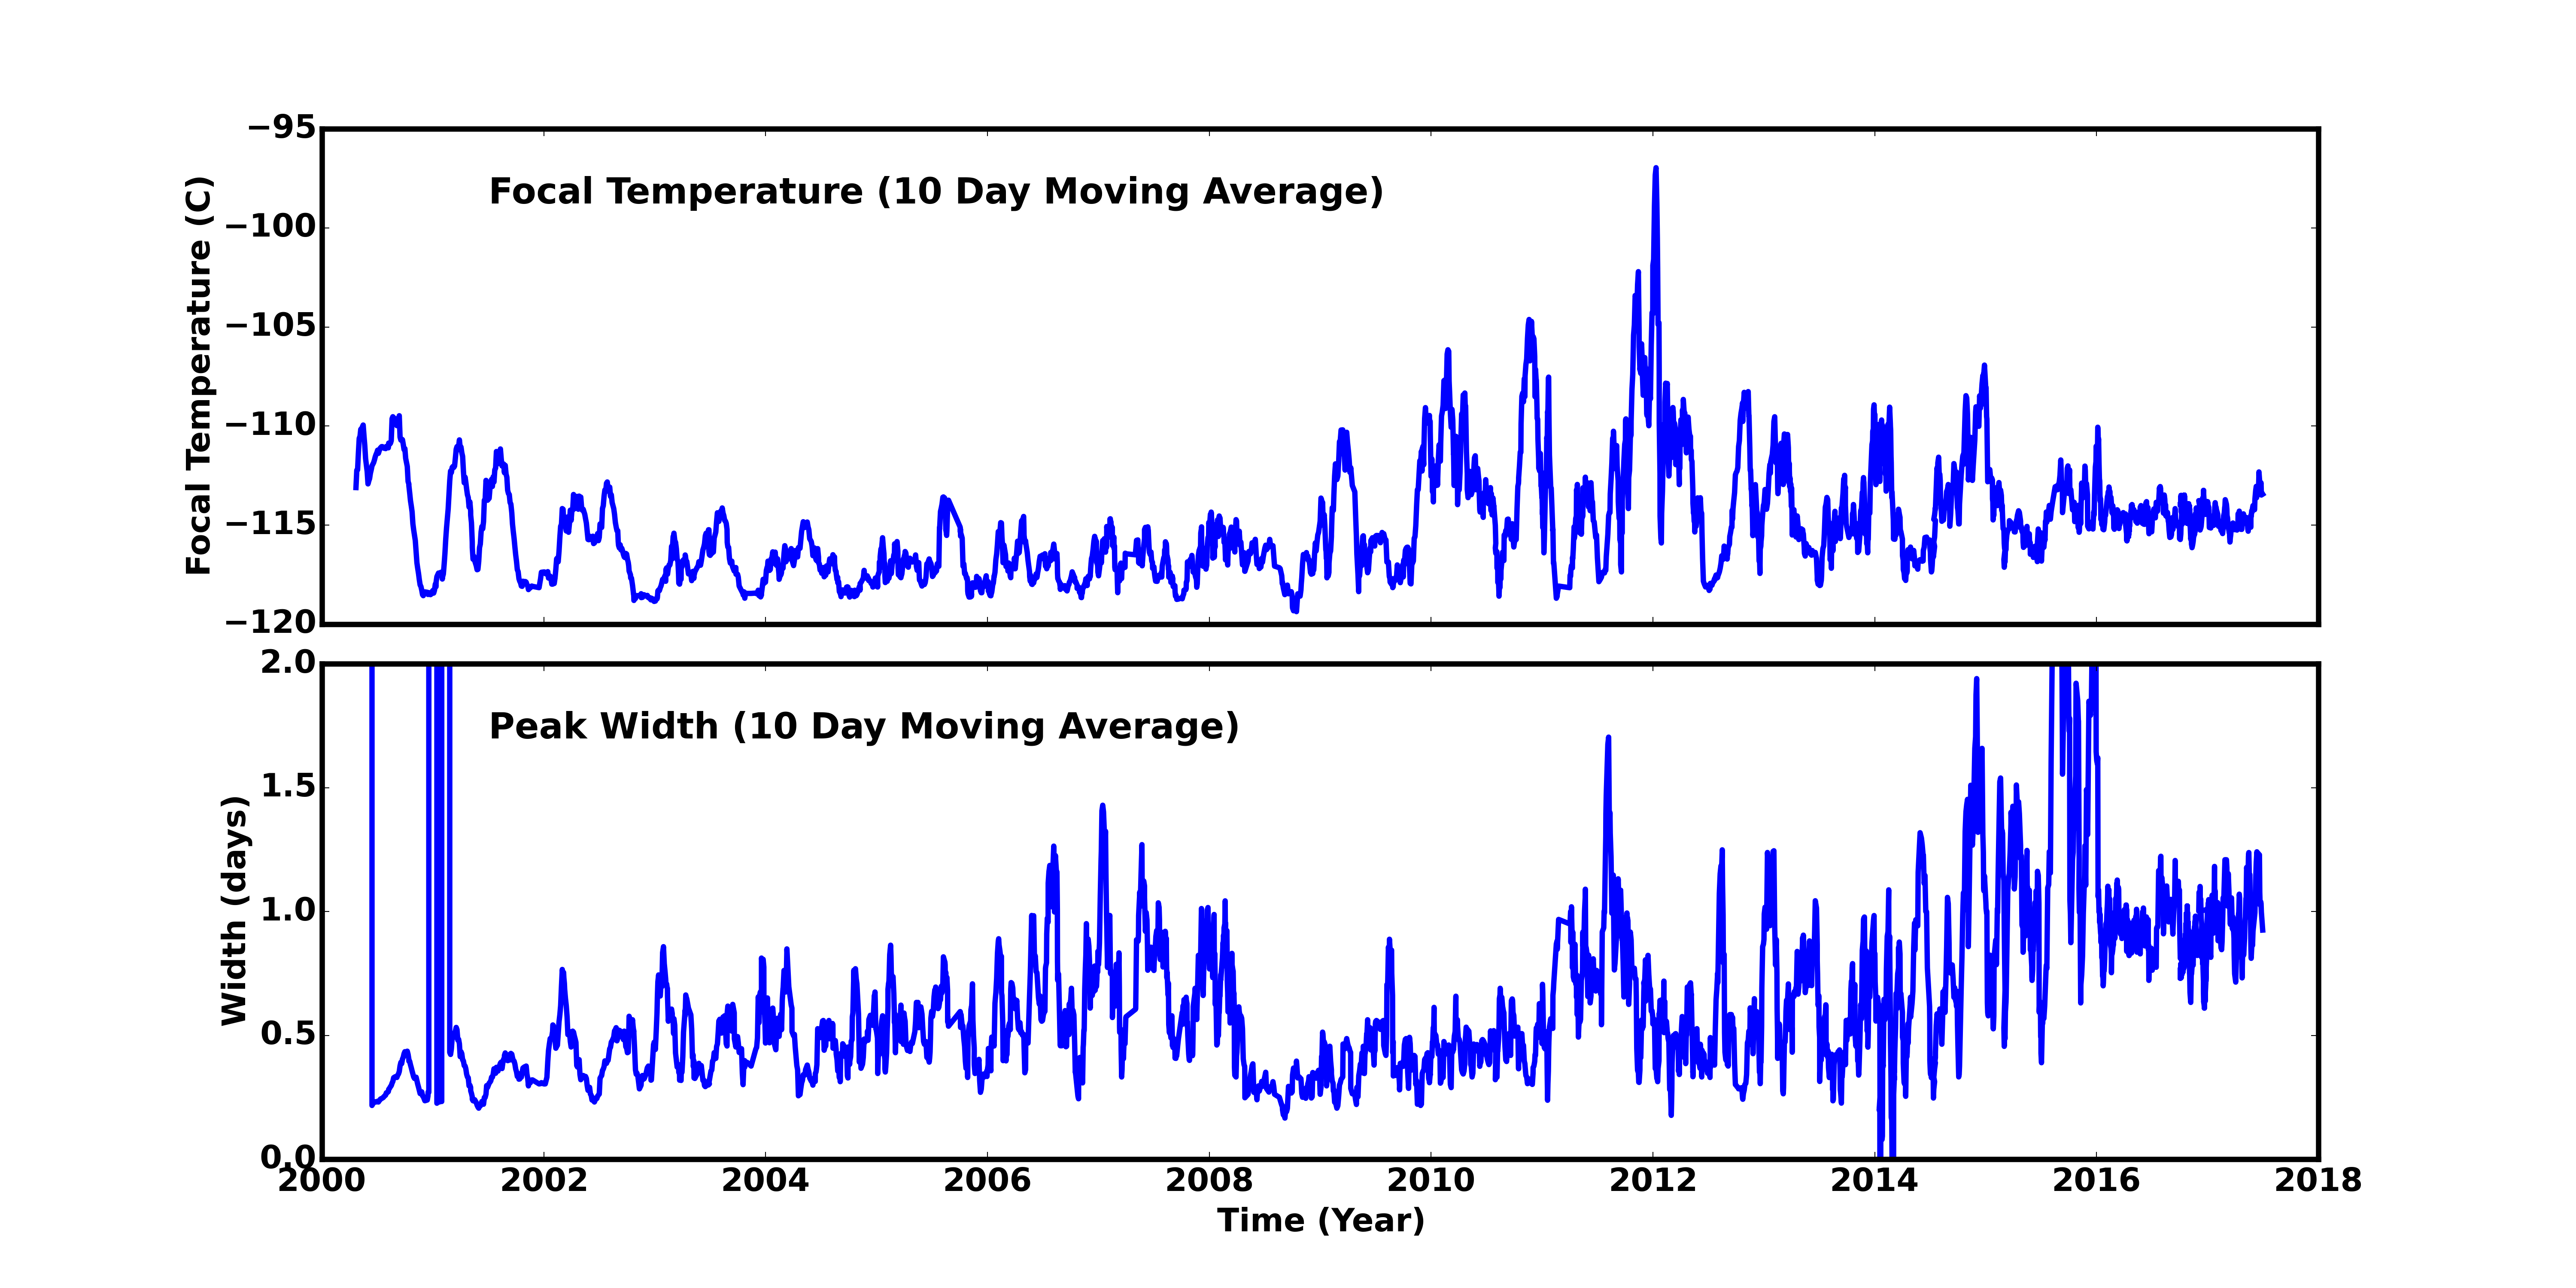
Focal Plane Temperature
Jun 2017 Focal Temperature
| The Mean (max) FPT: | |
|---|---|
| -113.34 | +/- 2.75 C |
| Mean Width: | |
| 1.09 | +/- 0.38 days |
Averaged Focal Plane Temperature
We are using 10 period moving averages to show trends of peak temperatures and peak widths. Note, the gaps in the width plot are due to missing/corrupted data.
Focal Plane Temperature, Sun Angle and Altitude
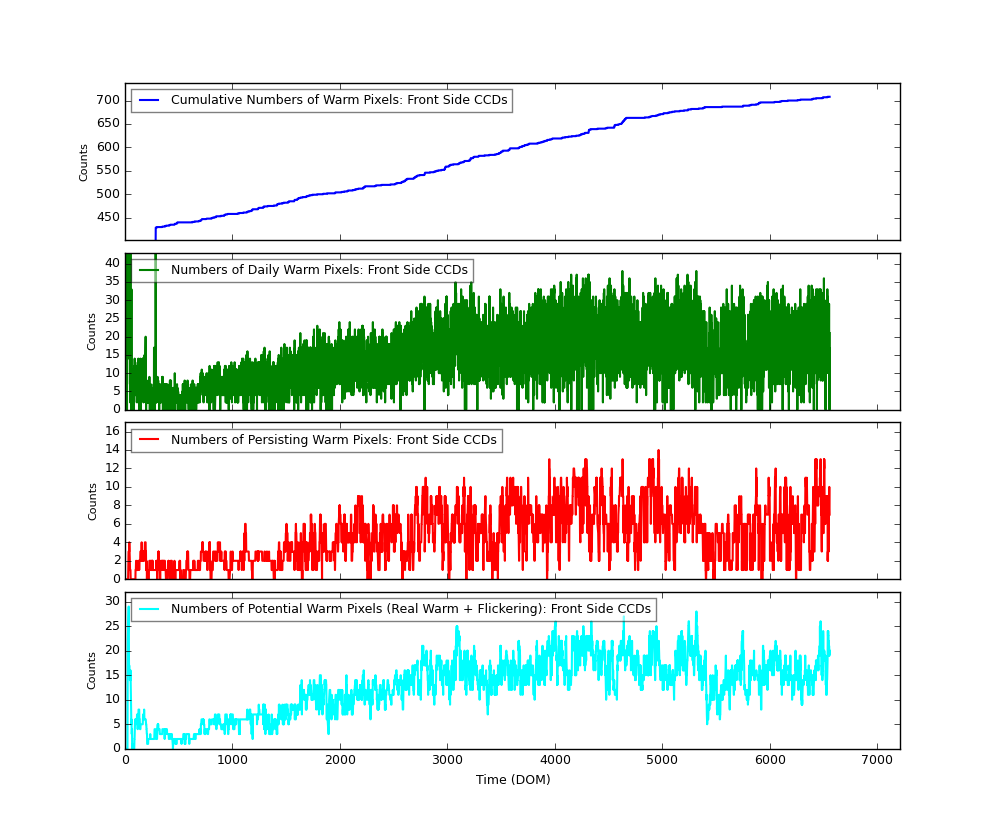
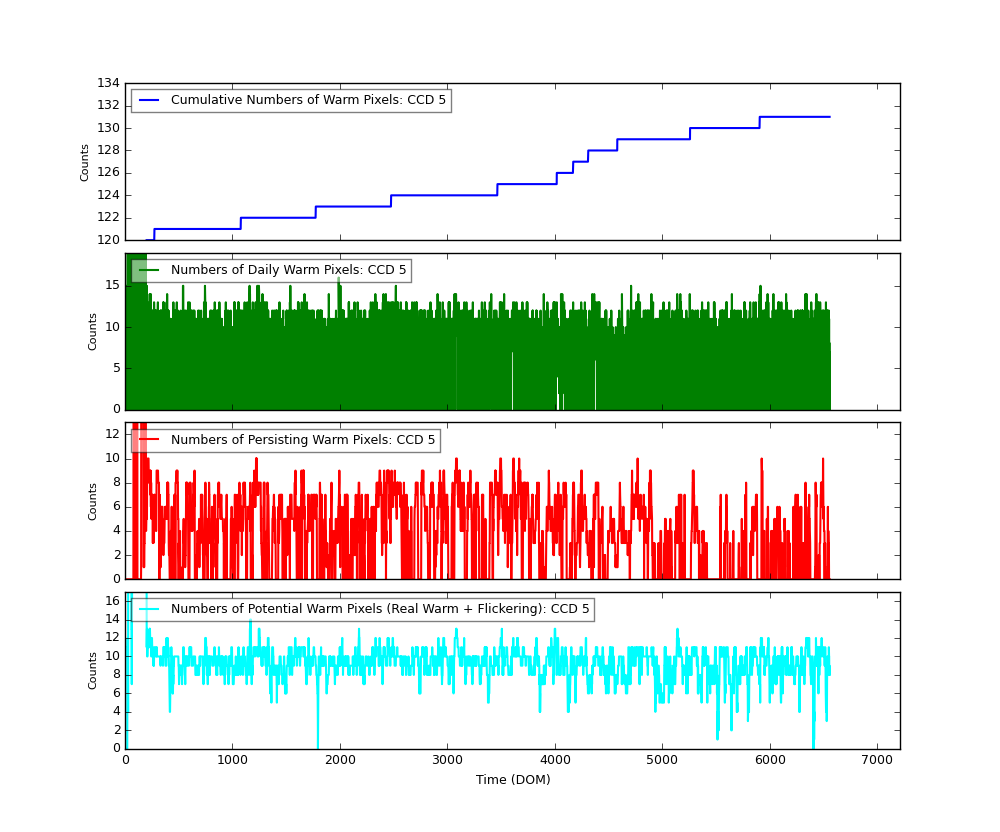
Bad Pixels
The plots below were generated with a new warm pixel finding script. Please see Acis Bad Pixel Page for details.
Front Side CCDs
Back Side CCD (CCD5)
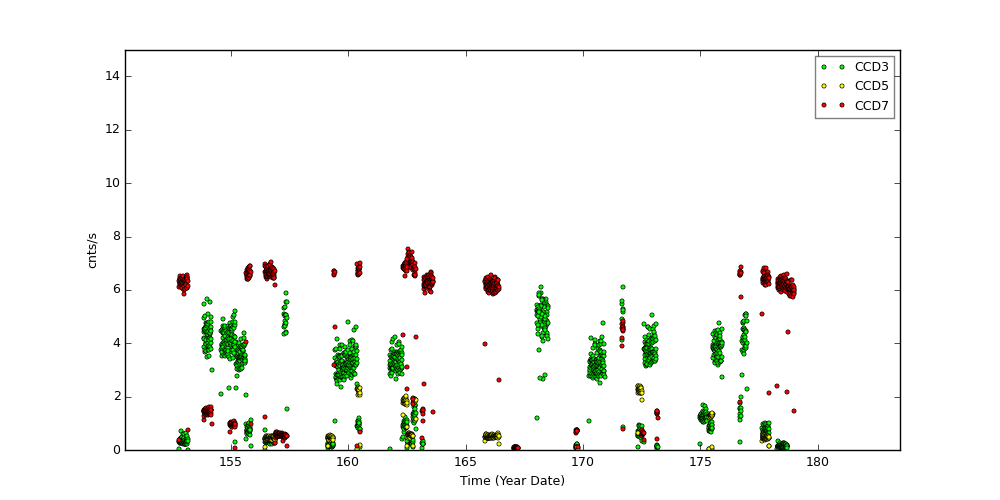
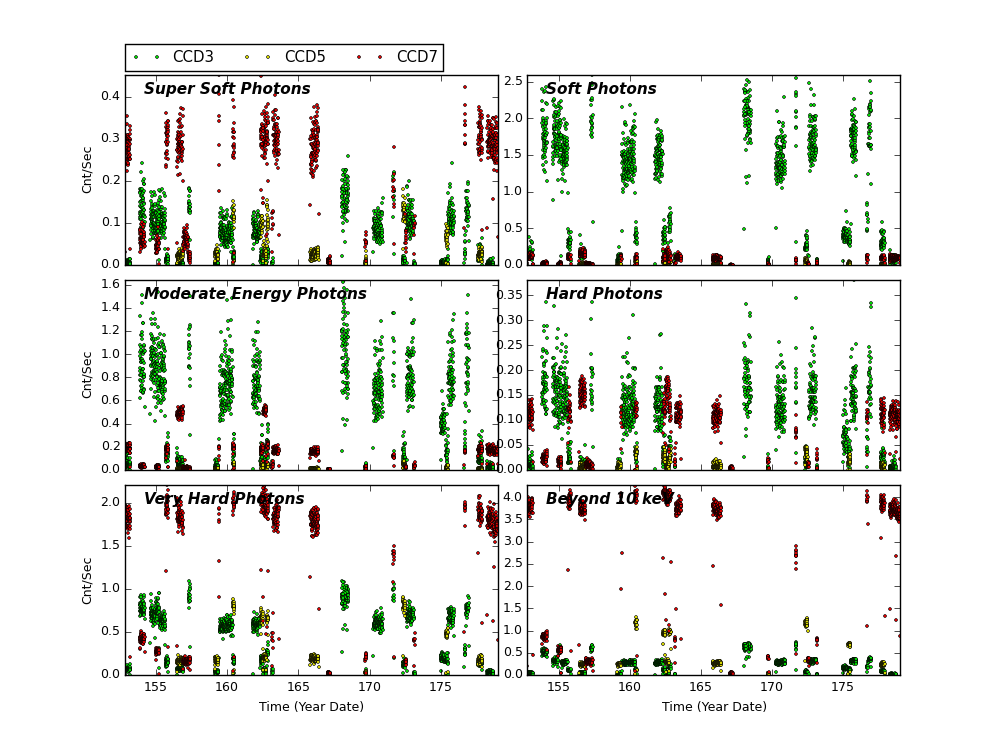
Science Instrument Background Rates
| Name | Low (keV) | High(KeV) | Description |
|---|---|---|---|
| SSoft | 0.00 | 0.50 | Super soft photons |
| Soft | 0.50 | 1.00 | Soft photons |
| Med | 1.00 | 3.00 | Moderate energy photons |
| Hard | 3.00 | 5.00 | Hard Photons |
| Harder | 5.00 | 10.00 | Very Hard photons |
| Hardest | 10.00 | Beyond 10 keV |
HRC
DOSE of Central 4K Pore-Pairs
Please refer to Maximum Dose Trends for more details.
)
|
|---|
IMAGE                NPIX      MEAN    STDDEV      MIN       MAX
HRCI_06_2017.fits  16777216	0.055 	0.235 	0.000 	4.000
)
IMAGE                       NPIX      MEAN    STDDEV      MIN       MAX
HRCI_08_1999_06_2017.fits  16777216	4.942 	5.220 	0.000 	292.000
)
|
|---|
IMAGE                NPIX      MEAN    STDDEV      MIN       MAX
HRCS_06_2017.fits  16777216	0.115 	0.473 	0.000 	30.000
)
IMAGE                       NPIX      MEAN    STDDEV      MIN       MAX
HRCS_08_1999_06_2017.fits  16777216	16.577 	29.653 	0.000 	1712.000
|
|
Max dose trend plots corrected for events that "pile-up"
in the center of the taps due to bad position information.
|
)
|
)
|
)
|
)
|
| Mar 2017 | Dec 2016 | Sep 2016 | Jun 2016 |
|---|
)
|
)
|
)
|
)
|
| Mar 2017 | Dec 2016 | Sep 2016 | Jun 2016 |
|---|
Gratings
Focus
We plot the width of the zero order streak of ACIS/HETG observations and the width of the zero order image for HRC/LETG observations of point sources. No significant defocusing trend is seen at this time. See Gratings Focus pages.
PCAD
ACA Trending
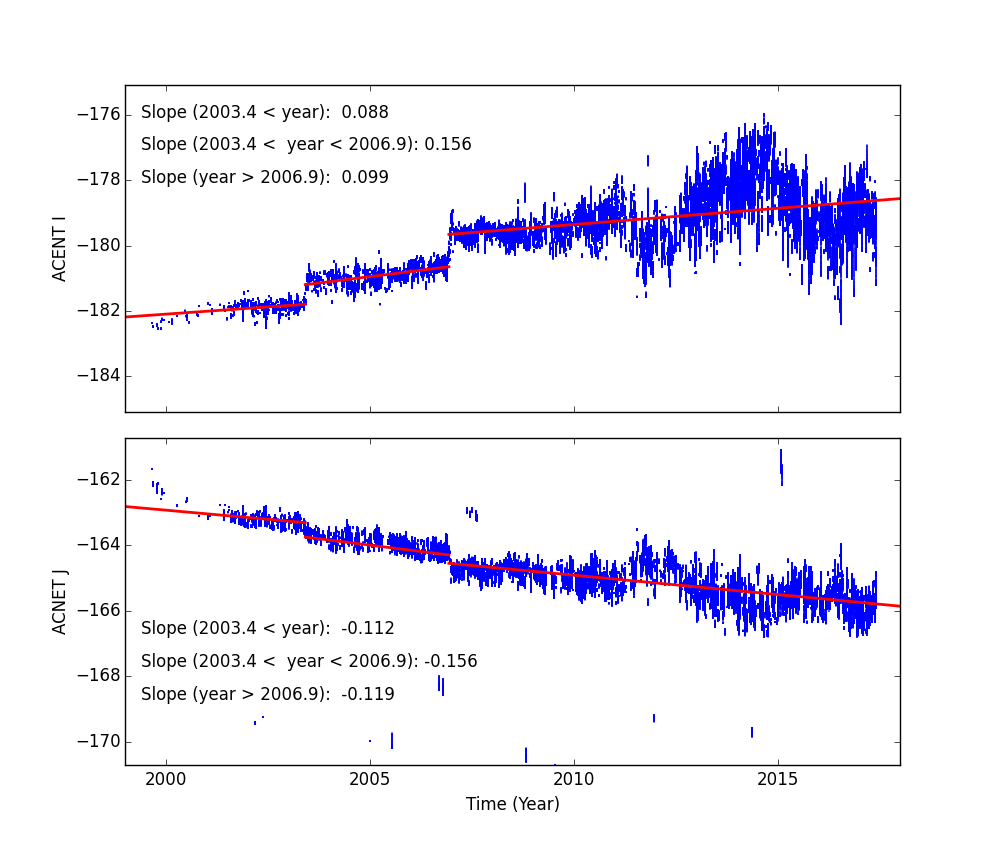
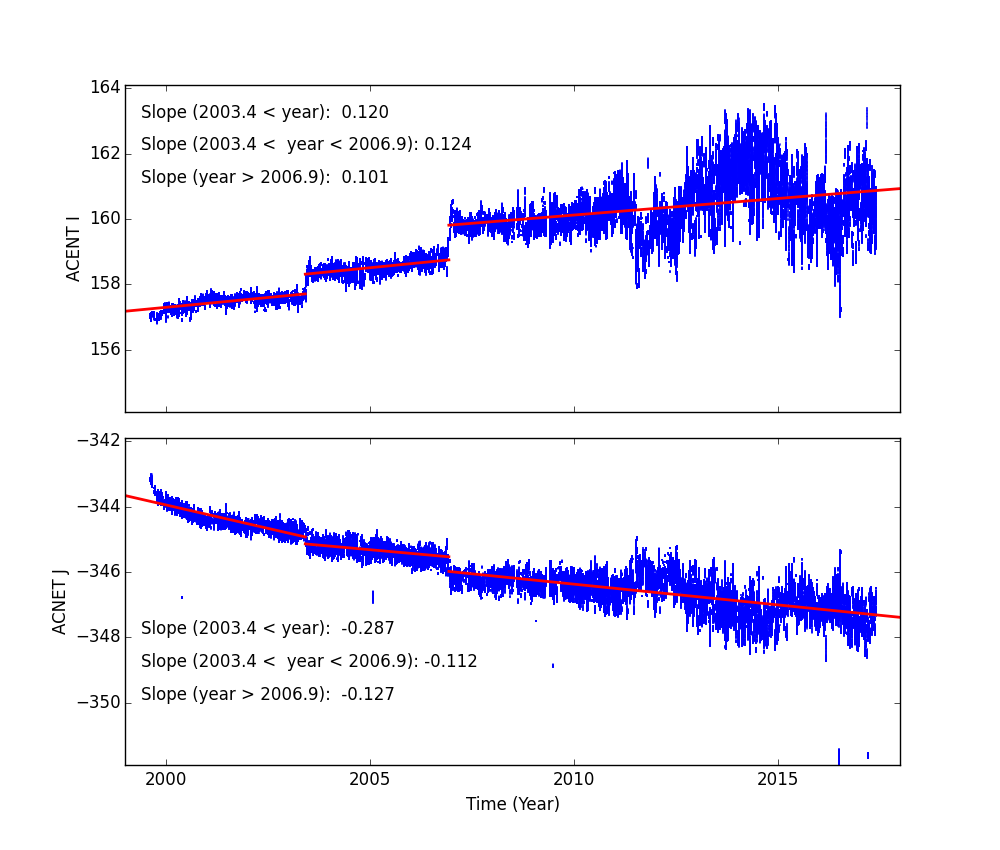
Fid Light Drift
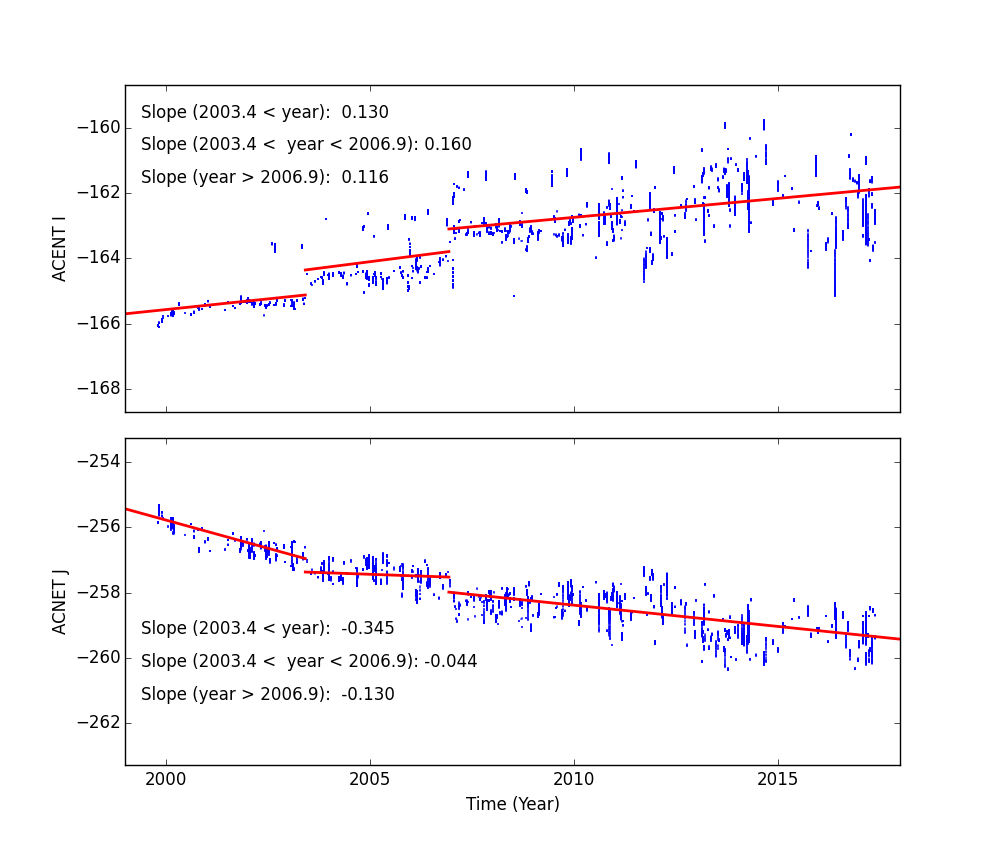
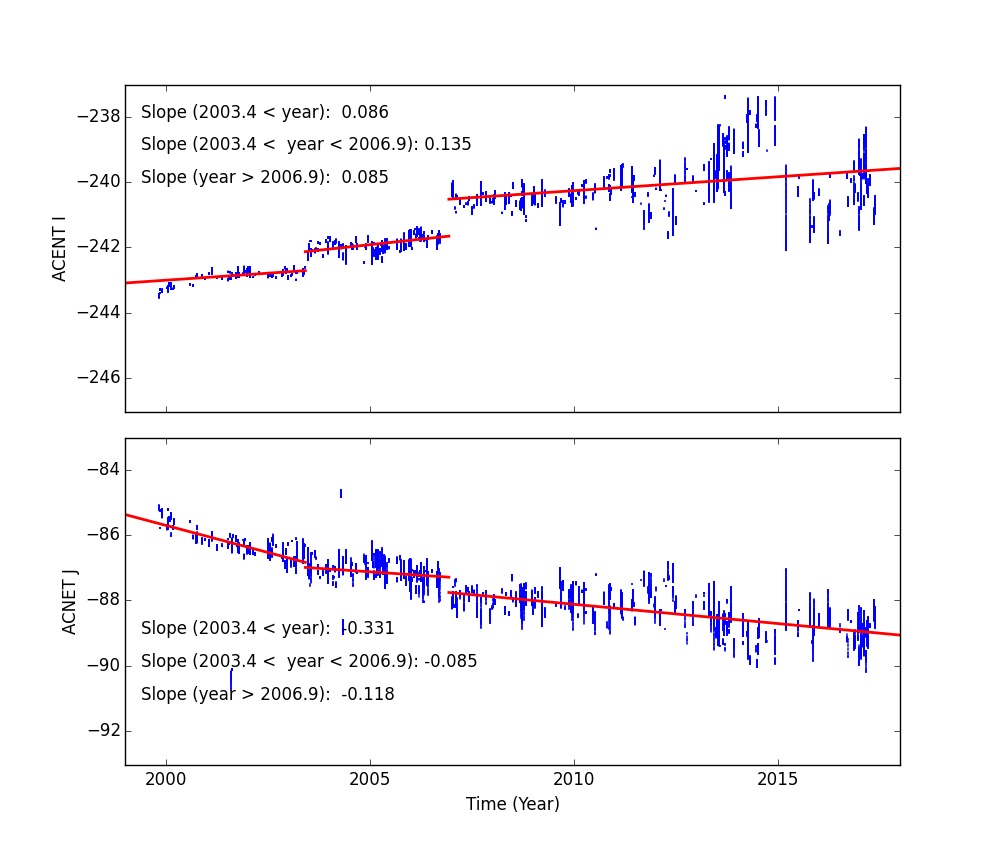
Fid light positions on ACA drift with time. The drift trends of Fid light 2 with ACIS-I and ACIS-S configurations are shown below.
The top panel shows Fid light 2 drift in ACENT I (app. along with -Y axis), and the
bottom panel shows that in ACENT J (app. along with Z axis). The unit is a pixel, and
one pixel is approximately 0.5 arcsec. The slope listed at the top right corner is
the change in a position per year (arcsec/yr). The vertical line on DOM = 1411 (Jun 1, 2003)
indicates a transition date of use of IRU-1 to IRU-2.
See also Tom Aldcroft's updated page:
https://cxc.cfa.harvard.edu/mta/ASPECT/fid_drift
Fid 2 (ACIS-I)
Fid 2 (ACIS-S)
Fid 8 (HRC-I)
Fid 12 (HRC-S)
Gyro Bias Drift
Radiation History
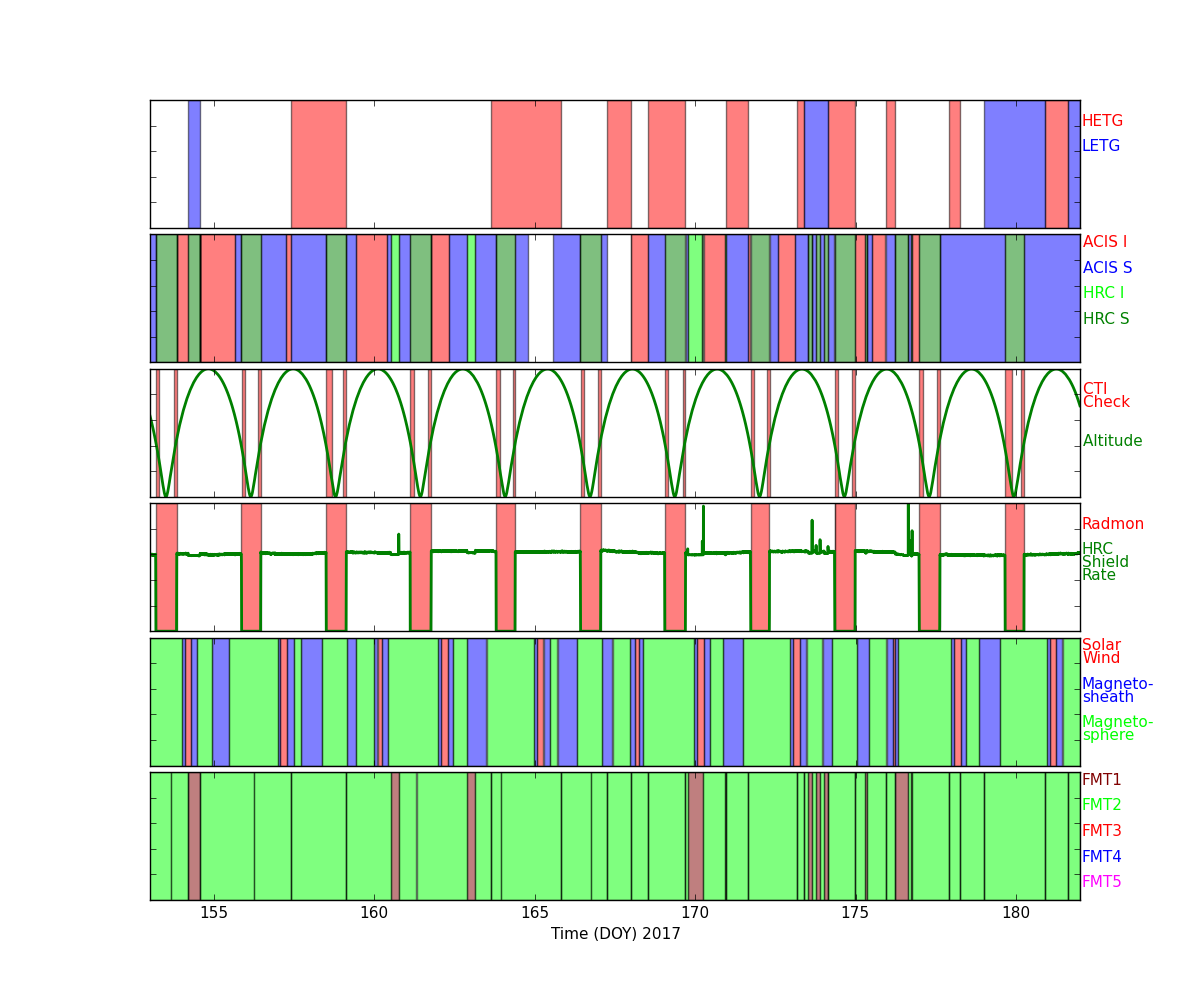
Radiation Zone Timing
Plotted below are radiation zone timing plots based on the following definitions of radiation zone:
- RADZONE - Ephin levels (in any of the E1300,P4GM,P41GM channels) are more than 1/3 of RADMON safing thresholds.
- RADMON - Radmon is disabled for radiation zone (as commanded based on OFLS model, for comparison with actual radiation levels).
- PERIGEE - Time of closest earth approach (for comparison)
Radiation Count Rates of Jun 2017
Sun Spot History
Trending
Critical Trends
| ACIS Temperatures - Daily Maximums | ||||||
|---|---|---|---|---|---|---|
| MSID | MEAN | RMS | DELTA/YR | DELTA/YR/YR | UNITS | DESCRIPTION |
| 1PDEAAT | 305.13 | 8.84 | 2.684e-02 | 7.452e-01 | K | PSMC DEA PS A TEMP |
| 1PIN1AT | 296.79 | 15.26 | 3.034e+00 | 4.924e+00 | K | PSMC TEMP 1A |
)
)
| HRMA Computed Averages - Daily Maximums | ||||||
|---|---|---|---|---|---|---|
| MSID | MEAN | RMS | DELTA/YR | DELTA/YR/YR | UNITS | DESCRIPTION |
| OBAAVG | 289.12 | 8.77 | 9.505e-01 | -9.758e-02 | TEMP | OBA/TFTE |
)
| EPHIN Temperatures - Daily Maximums | ||||||
|---|---|---|---|---|---|---|
| MSID | MEAN | RMS | DELTA/YR | DELTA/YR/YR | UNITS | DESCRIPTION |
| TEIO | 330.78 | 20.51 | 2.719e+00 | 4.726e+00 | K | EPHIN ELECTRONICS HOUSING TEMP |
| TEPHIN | 335.22 | 6.64 | 1.646e+00 | 4.505e+00 | K | EPHIN SENSOR HOUSING TEMP |
)
)
| S/C Main Temperatures - Daily Maximums | ||||||
|---|---|---|---|---|---|---|
| MSID | MEAN | RMS | DELTA/YR | DELTA/YR/YR | UNITS | DESCRIPTION |
| TCYLFMZM | 307.48 | 24.91 | 1.024e+00 | 6.616e-02 | K | CNT CYL TEMP:-Z SIDE UNDER LAE-1 |
| TCYLFMZP | 309.45 | 23.68 | 9.447e-01 | 2.420e-01 | K | CNT CYL TEMP:-Z SIDE UNDER LAE-2 |
)
)
| S/C Ancillary Temperatures - Daily Maximums | ||||||
|---|---|---|---|---|---|---|
| MSID | MEAN | RMS | DELTA/YR | DELTA/YR/YR | UNITS | DESCRIPTION |
| TFSSBKT1 | 343.29 | 19.25 | 2.671e-01 | 1.601e+00 | K | FSS BRACKET-1 TEMP (+Y) |
| TFSSBKT2 | 338.79 | 25.73 | 1.203e+00 | -1.262e-01 | K | FSS BRACKET-2 TEMP (+Y) |
| TSCTSF1 | 305.26 | 4.34 | 2.550e+00 | -1.879e+00 | K | SC-TS FITTING -1 TEMP |
| TSCTSF6 | 307.12 | 4.63 | 2.387e+00 | -1.501e+00 | K | SC-TS FITTING -6 TEMP |
)
)
)
)
| MUPS - Daily Maximums | ||||||
|---|---|---|---|---|---|---|
| MSID | MEAN | RMS | DELTA/YR | DELTA/YR/YR | UNITS | DESCRIPTION |
| PM1THV1T | 333.47 | 8.23 | -2.762e-01 | -1.892e+02 | K | MUPS 1 THRUSTER VALVE 01 TEMP |
| PLINE02T | 317.64 | 11.13 | 3.347e+00 | 5.826e+00 | K | PROP LINE TEMP 02 |
| PLINE03T | 316.64 | 13.64 | 3.278e+00 | 7.846e+00 | K | PROP LINE TEMP 03 |
| PLINE04T | 302.24 | 12.73 | 3.233e+00 | 7.055e+00 | K | PROP LINE TEMP 04 |
)
)
)
)
Quarterly Trends
- HRMA Struts
| Previous Quarter | ||||||
| MSID | MEAN | RMS | DELTA/YR | DELTA/YR/YR | UNITS | DESCRIPTION |
| 4RT584T | 296.87 | 0.80 | -3.235e+00 | -8.353e+01 | K | RT 584 - STRUT TEMP |
| 4RT585T | 297.00 | 0.78 | -2.734e+00 | -7.535e+01 | K | RT 585 - STRUT TEMP |
| 4RT586T | 293.70 | 0.65 | -2.051e+00 | -5.381e+01 | K | RT 586 - STRUT TEMP |
| 4RT587T | 288.85 | 0.47 | -1.249e+00 | -3.263e+01 | K | RT 587 - STRUT TEMP |
| 4RT597T | 301.88 | 2.01 | -5.796e+00 | -1.805e+02 | K | RT 597 - TFTE TEMP |
| 4RT598T | 300.89 | 1.92 | -4.650e+00 | -1.616e+02 | K | RT 598 - TFTE TEMP |
)
)
)
)
)
)
- OB Forward Bulkhead
| Previous Quarter | ||||||
| MSID | MEAN | RMS | DELTA/YR | DELTA/YR/YR | UNITS | DESCRIPTION |
| 4RT705T | 288.14 | 0.98 | -2.029e+00 | -6.924e+01 | K | RT 705 - OB BULKHEAD TEMP |
| 4RT706T | 286.69 | 1.02 | -2.249e+00 | -6.887e+01 | K | RT 706 - OB BULKHEAD TEMP |
| 4RT707T | 289.31 | 1.02 | -2.160e+00 | -6.578e+01 | K | RT 707 - OB BULKHEAD TEMP |
| 4RT708T | 293.82 | 1.12 | -2.632e+00 | -7.920e+01 | K | RT 708 - OB BULKHEAD TEMP |
| 4RT709T | 295.00 | 1.20 | -2.927e+00 | -9.276e+01 | K | RT 709 - OB BULKHEAD TEMP |
| 4RT710T | 296.35 | 1.29 | -3.165e+00 | -1.004e+02 | K | RT 710 - OB BULKHEAD TEMP |
)
)
)
)
)
)
- HRMA Thermal
| Previous Quarter | ||||||
| MSID | MEAN | RMS | DELTA/YR | DELTA/YR/YR | UNITS | DESCRIPTION |
| 4RT568T | 294.55 | 1.09 | -2.926e+00 | -7.711e+01 | K | RT 568 - HRMA TEMP |
| 4RT569T | 294.70 | 0.13 | -3.773e-01 | -7.522e+00 | K | RT 569 - HRMA TEMP |
| 4RT570T | 294.63 | 7.927e-02 | -4.535e-01 | -4.602e+00 | K | RT 570 - HRMA TEMP |
| 4RT575T | 298.35 | 1.46 | -3.892e+00 | -1.181e+02 | K | RT 575 - OB CONE TEMP |
| 4RT576T | 290.43 | 1.08 | -2.113e+00 | -7.535e+01 | K | RT 576 - OB CONE TEMP |
| 4RT578T | 296.53 | 2.36 | -1.471e+00 | -7.398e+01 | K | RT 578 - OB CONE TEMP |
)
)
)
)
)
)
Envelope Trending
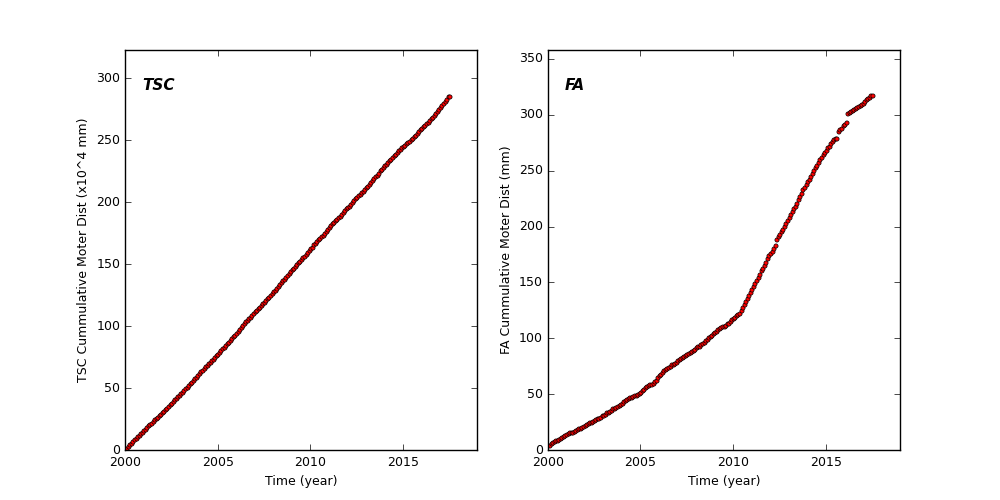
Spacecraft Motions
TSC and FA Cummulative Moter Distance
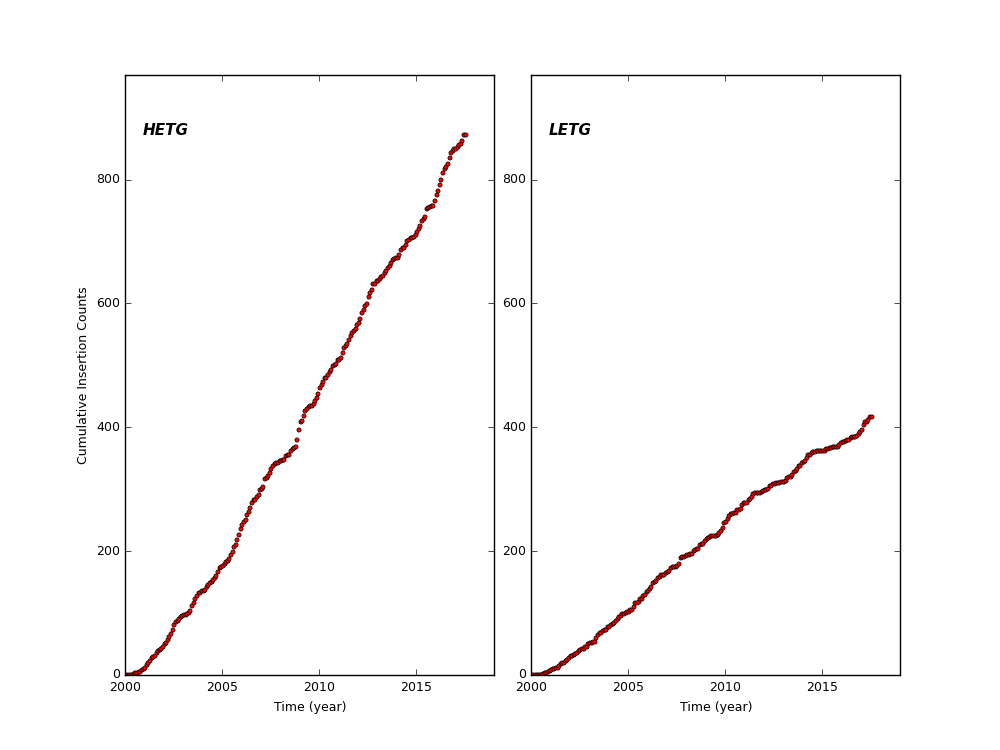
HETG and LETG Cummulative Insertion Counts
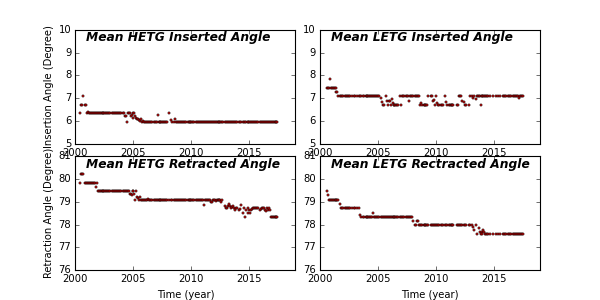
HETG/LETG Insertion/Retraction Angle
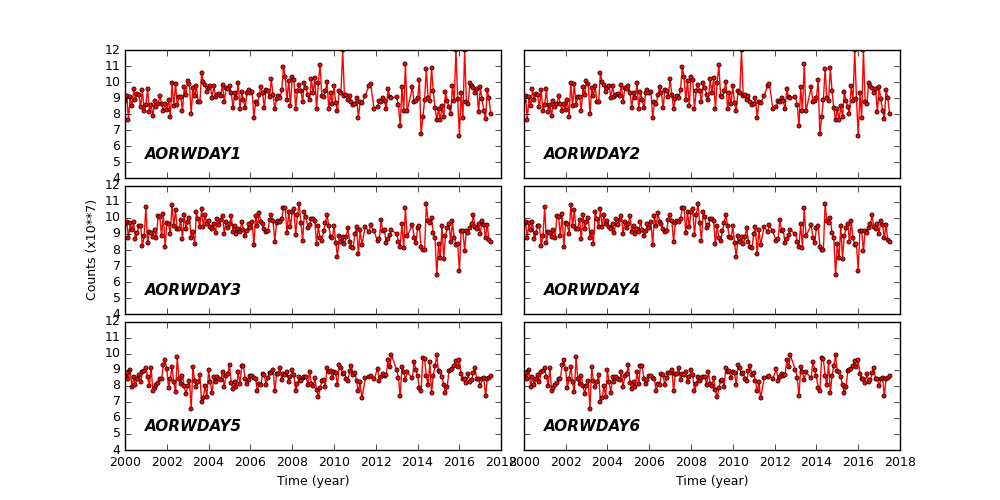
Reaction Wheel Rotations
Links to Past Monthly Reports
| Year | Month | |||||||||||
|---|---|---|---|---|---|---|---|---|---|---|---|---|
| 2017 | Jan | Feb | Mar | Apr | May | |||||||
| 2016 | Jan | Feb | Mar | Apr | May | Jun | Jul | Aug | Sep | Oct | Nov | Dec |
| 2015 | Jan | Feb | Mar | Apr | May | Jun | Jul | Aug | Sep | Oct | Nov | Dec |
| 2014 | Jan | Feb | Mar | Apr | May | Jun | Jul | Aug | Sep | Oct | Nov | Dec |
| 2013 | Jan | Feb | Mar | Apr | May | Jun | Jul | Aug | Sep | Oct | Nov | Dec |
| 2012 | Jan | Feb | Mar | Apr | May | Jun | Jul | Aug | Sep | Oct | Nov | Dec |
| 2011 | Jan | Feb | Mar | Apr | May | Jun | Jul | Aug | Sep | Oct | Nov | Dec |
| 2010 | Jan | Feb | Mar | Apr | May | Jun | Jul | Aug | Sep | Oct | Nov | Dec |
| 2009 | Jan | Feb | Mar | Apr | May | Jun | Jul | Aug | Sep | Oct | Nov | Dec |
| 2008 | Jan | Feb | Mar | Apr | May | Jun | Jul | Aug | Sep | Oct | Nov | Dec |
| 2007 | Jan | Feb | Mar | Apr | May | Jun | Jul | Aug | Sep | Oct | Nov | Dec |
| 2006 | Jan | Feb | Mar | Apr | May | Jun | Jul | Aug | Sep | Oct | Nov | Dec |
| 2005 | Jan | Feb | Mar | Apr | May | Jun | Jul | Aug | Sep | Oct | Nov | Dec |
| 2004 | Jan | Feb | Mar | Apr | May | Jun | Jul | Aug | Sep | Oct | Nov | Dec |
| 2003 | Jan | Feb | Mar | Apr | May | Jun | Jul | Aug | Sep | Oct | Nov | Dec |
| 2002 | Jan | Feb | Mar | Apr | May | Jun | Jul | Aug | Sep | Oct | Nov | Dec |
| 2001 | Jan | Feb | Mar | Apr | May | Jun | Jul | Aug | Sep | Oct | Nov | Dec |
| 2000 | Jan | Feb | Mar | Apr | May | Jun | Jul | Aug | Sep | Oct | Nov | Dec |
| 1999 | Jul | Aug | Sep | Oct | Nov | Dec | ||||||