ACIS
ACIS DOSE Registered-Photon-Map
The steps we took to compute the dose map are;
- Level 1 Event files for a specified month are obtained from archive.
- Image data including I2, I3, S2, S3 CCDs are extracted from all event files.
- All the extracted image data were merged to create a month long exposure map for the month.
- The exposure map is opened with ds9, and check a distribution of count rates against energy. From this, estimate the upper threshold value. Any events beyond this upper threshold are assumed erroneous events such as bad pixels.
- Using this upper threshold, the data is filtered, and create a cleaned exposure map for the month.
- The exposure map from each month from the Sep 1999 is added up to create a cumulative exposure map for each month.
- Using fimgstatistic, we compute count rate statistics for each CCDs.
- For observations with high data drop rates (e.g., Crab nebula, Cas A), we corrected the observations by adding events.
Please check more detail plots at Telemetered Photon Dose Trend page.
)
)
)
Statistics:
# IMAGE     NPIX     MEAN        RMS        MIN     MAX
ACIS_sep17 6004901       6.747         51.025           0.0     8967


I2 node 0  262654	5.446627	12.631287	0.0	2463.0
I2 node 1  262654	5.641630	18.159710	0.0	7516.0
I2 node 2  262654	5.385117	9.441597	0.0	1259.0
I2 node 3  262654	5.461036	11.674240	0.0	1677.0

I3 node 0  262654	5.830479	9.914828	0.0	1115.0
I3 node 1  262654	5.900555	22.089031	0.0	7917.0
I3 node 2  262654	5.373544	10.189073	0.0	1099.0
I3 node 3  262654	5.641240	10.003345	0.0	1218.0

S2 node 0  262654	6.648227	5.435089	0.0	380.0
S2 node 1  262654	7.049560	7.241540	0.0	526.0
S2 node 2  262654	8.557755	14.195049	0.0	601.0
S2 node 3  262654	10.498879	29.237717	0.0	4190.0

S3 node 0  262654	20.365816	118.709293	0.0	5552.0
S3 node 1  262654	14.850082	23.428352	0.0	490.0
S3 node 2  262654	14.986952	25.369265	0.0	376.0
S3 node 3  262654	12.280252	16.044098	0.0	299.0
)
)
)
Statistics:
 IMAGE     NPIX      MEAN        RMS           MIN      MAX
ACIS_total   6004901       2137.787         2775.199           0.0   120998


I2 node 0  262654	1838.067568	360.161316	377.0	10237.0
I2 node 1  262654	1935.315779	500.125986	399.0	68633.0
I2 node 2  262654	5.385117	9.441597	0.0	1259.0
I2 node 3  262654	1972.793694	508.262933	385.0	28405.0

I3 node 0  262654	2086.391261	515.911229	381.0	8163.0
I3 node 1  262654	2169.519856	1631.025279	391.0	51305.0
I3 node 2  262654	1903.288265	350.038553	370.0	10552.0
I3 node 3  262654	5.641240	10.003345	0.0	1218.0

S2 node 0  262654	2483.686853	366.150683	1349.0	21611.0
S2 node 1  262654	7.049560	7.241540	0.0	526.0
S2 node 2  262654	2908.281464	544.651118	1727.0	27544.0
S2 node 3  262654	2854.921447	401.591421	1624.0	50622.0

S3 node 0  262654	4418.271293	1996.980726	1798.0	22810.0
S3 node 1  262654	5611.390044	2177.201346	0.0	14488.0
S3 node 2  262654	4380.047357	1093.605190	1824.0	10453.0
S3 node 3  262654	3370.269966	501.153104	1942.0	11133.0
)
|
)
|
)
|
)
|
| Jun 2017 | Mar 2017 | Dec 2016 | Sep 2016 |
|---|
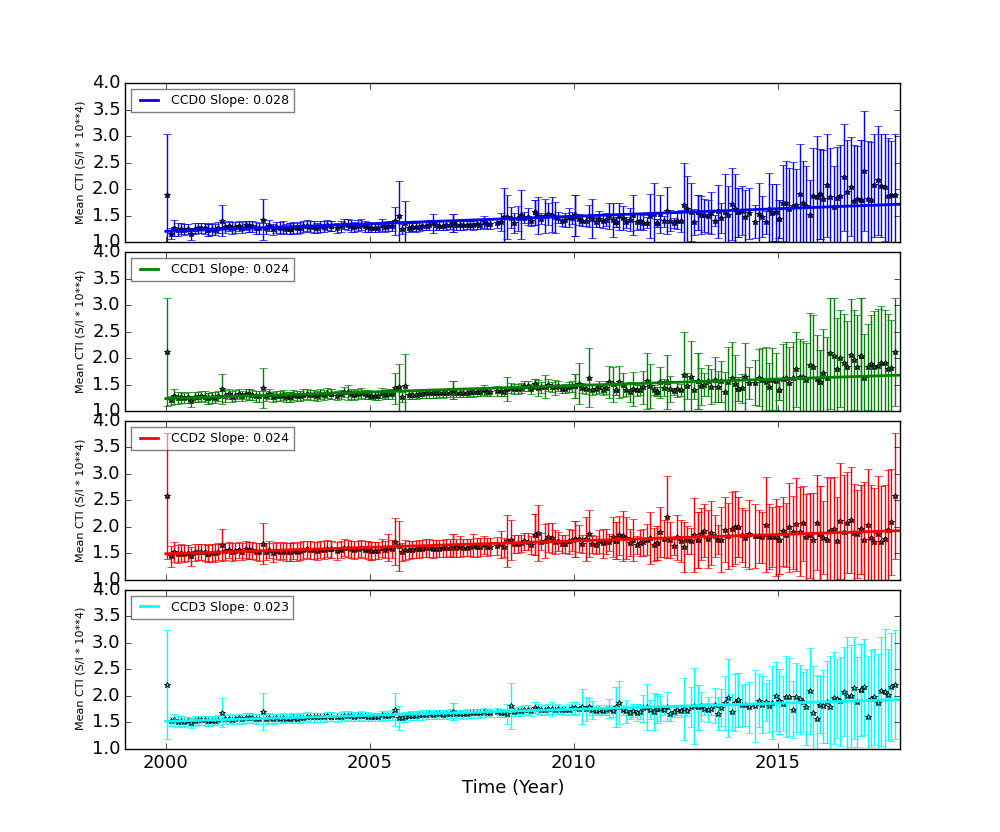
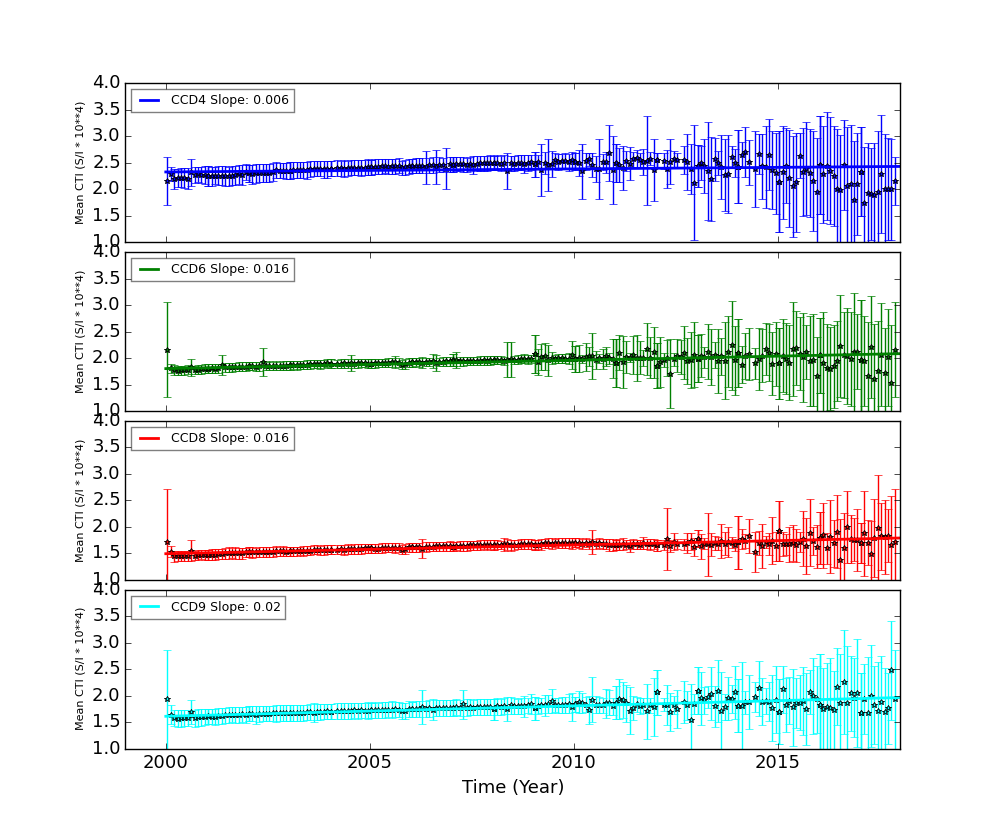
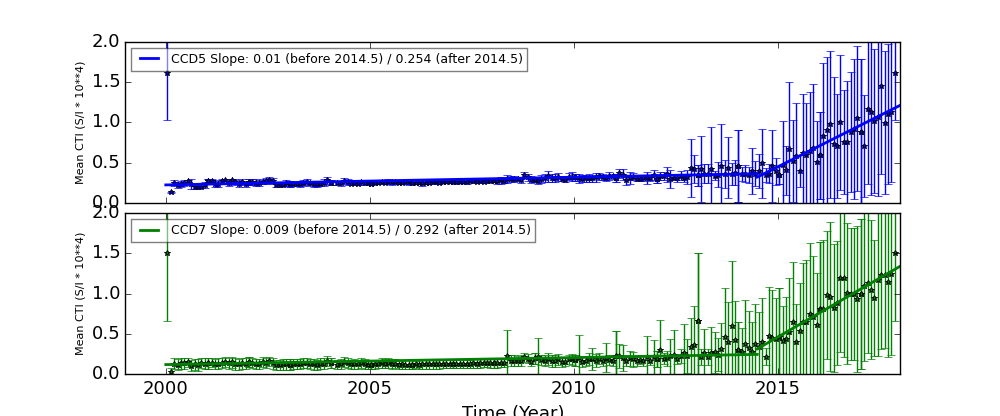
The Mean Detrended CTI
We report CTIs with a refined data definition. CTIs were computed for the temperature dependency corrected data. Please see CTI page for detailed explanation. CTI's are computed for Mn K alpha, and defined as slope/intercept x10^4 of row # vs ADU. Data file: here
Imaging CCDs
Spectral CCDs
Backside CCDs
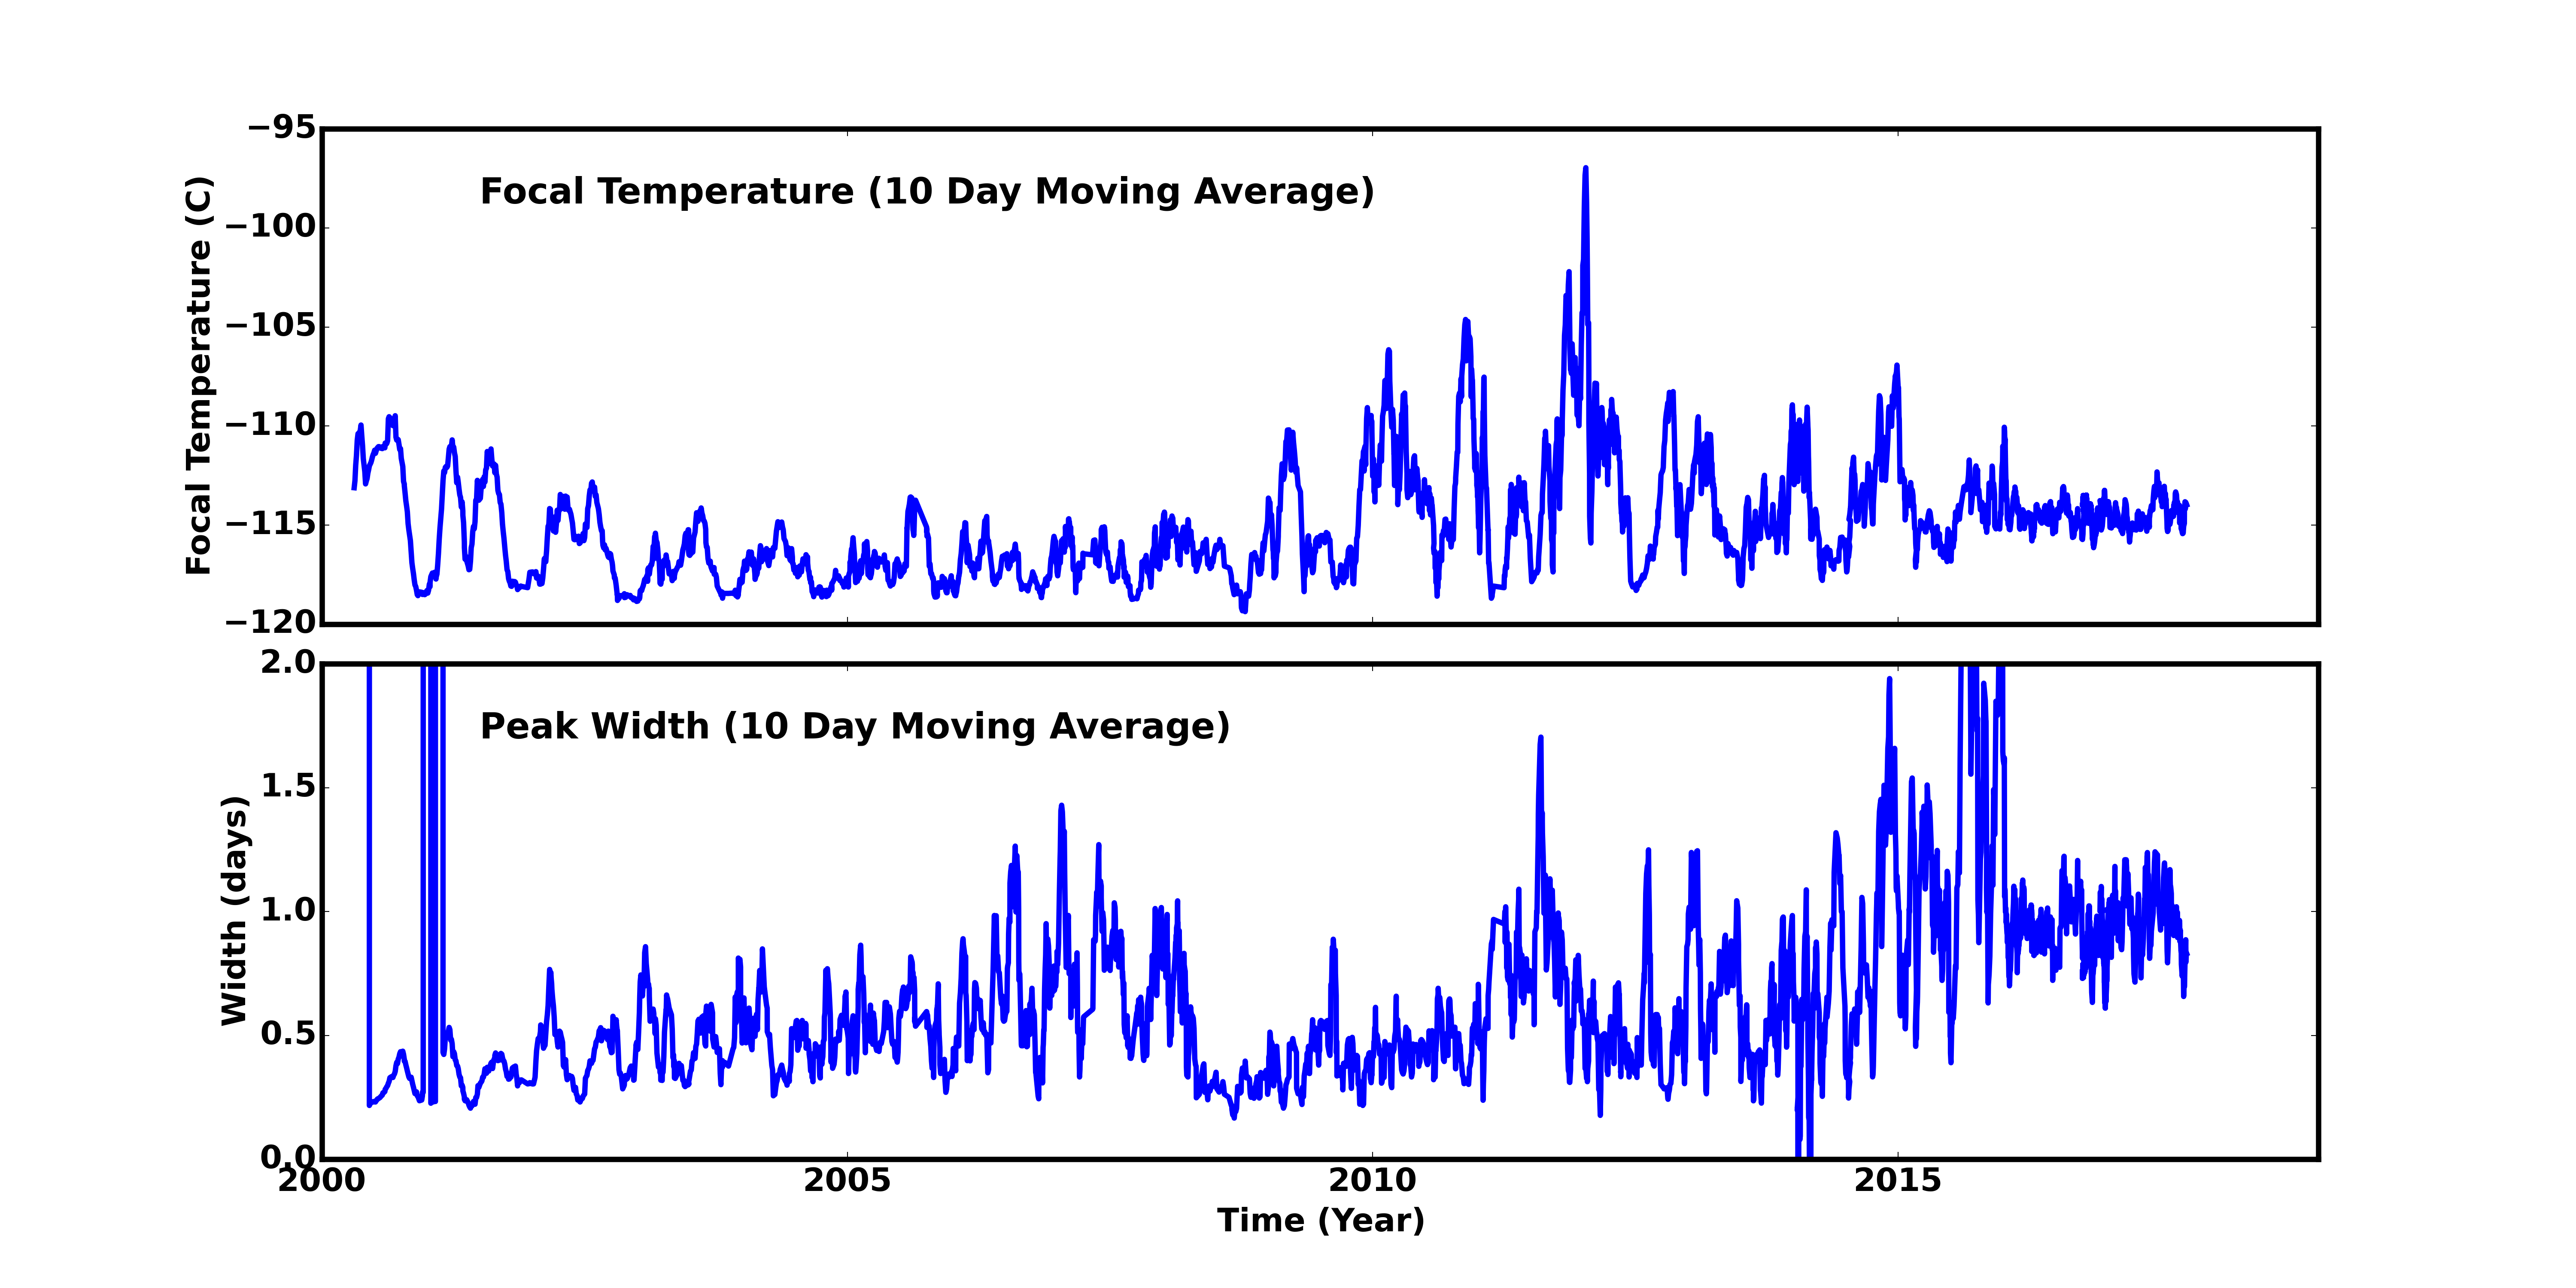
Focal Plane Temperature
Sep 2017 Focal Temperature
| The Mean (max) FPT: | |
|---|---|
| -114.67 | +/- 1.93 C |
| Mean Width: | |
| 0.79 | +/- 0.46 days |
Averaged Focal Plane Temperature
We are using 10 period moving averages to show trends of peak temperatures and peak widths. Note, the gaps in the width plot are due to missing/corrupted data.
Focal Plane Temperature, Sun Angle and Altitude
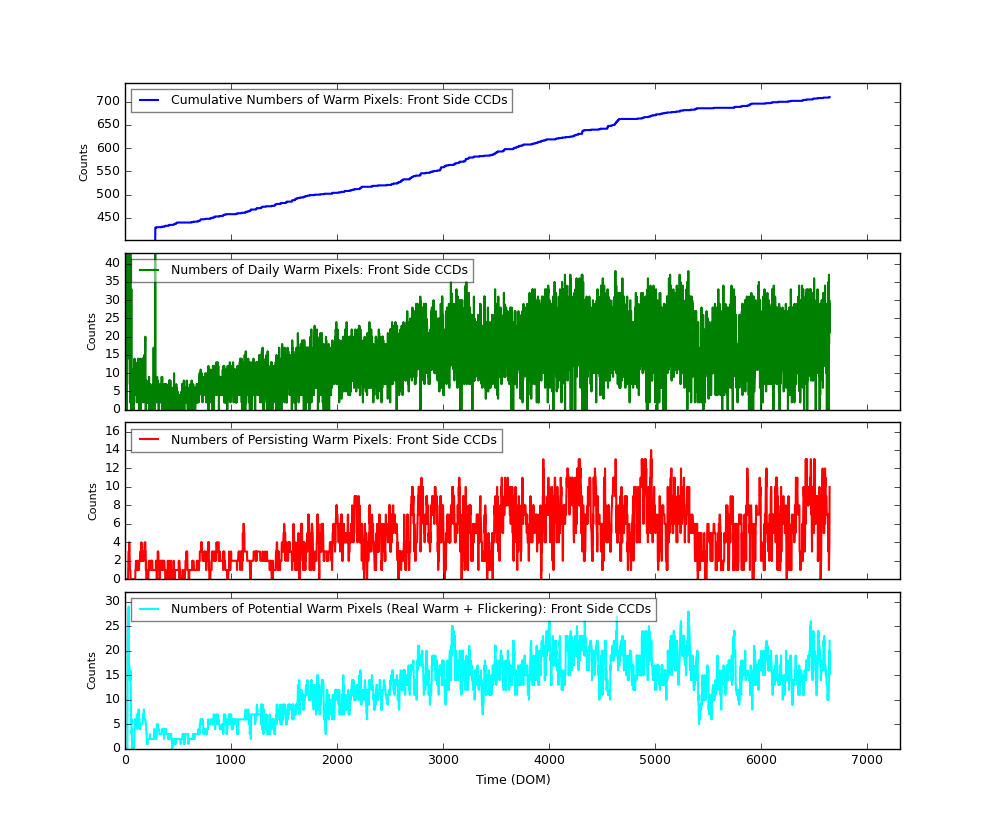
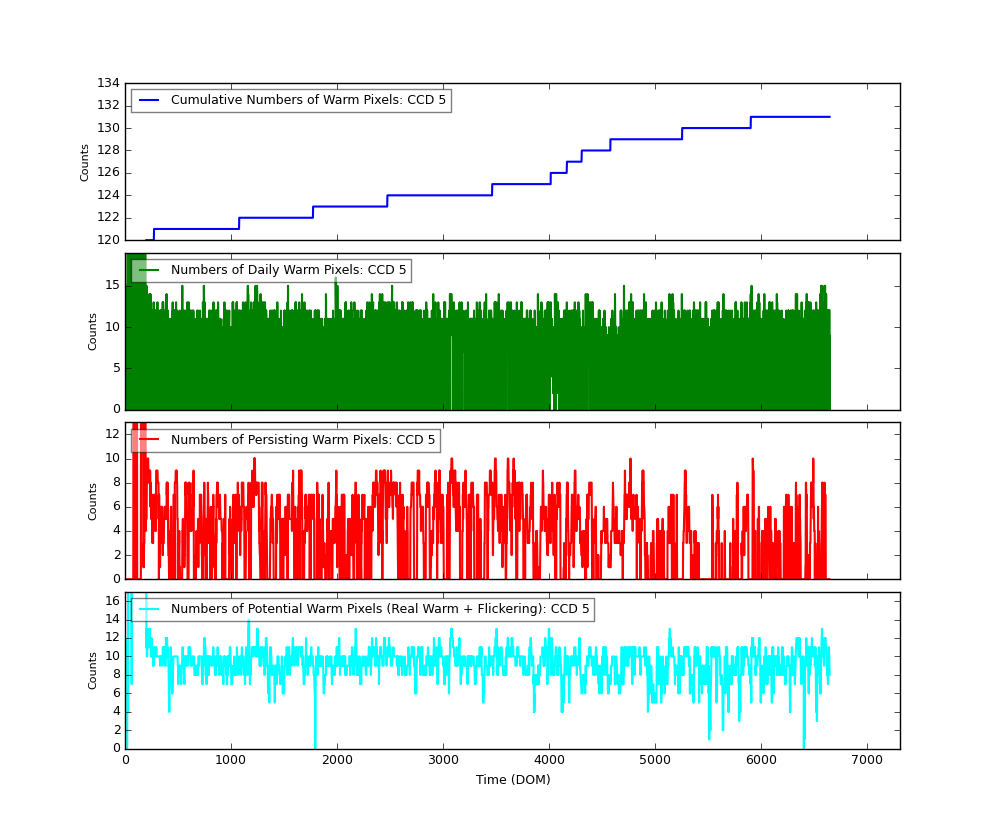
Bad Pixels
The plots below were generated with a new warm pixel finding script. Please see Acis Bad Pixel Page for details.
Front Side CCDs
Back Side CCD (CCD5)
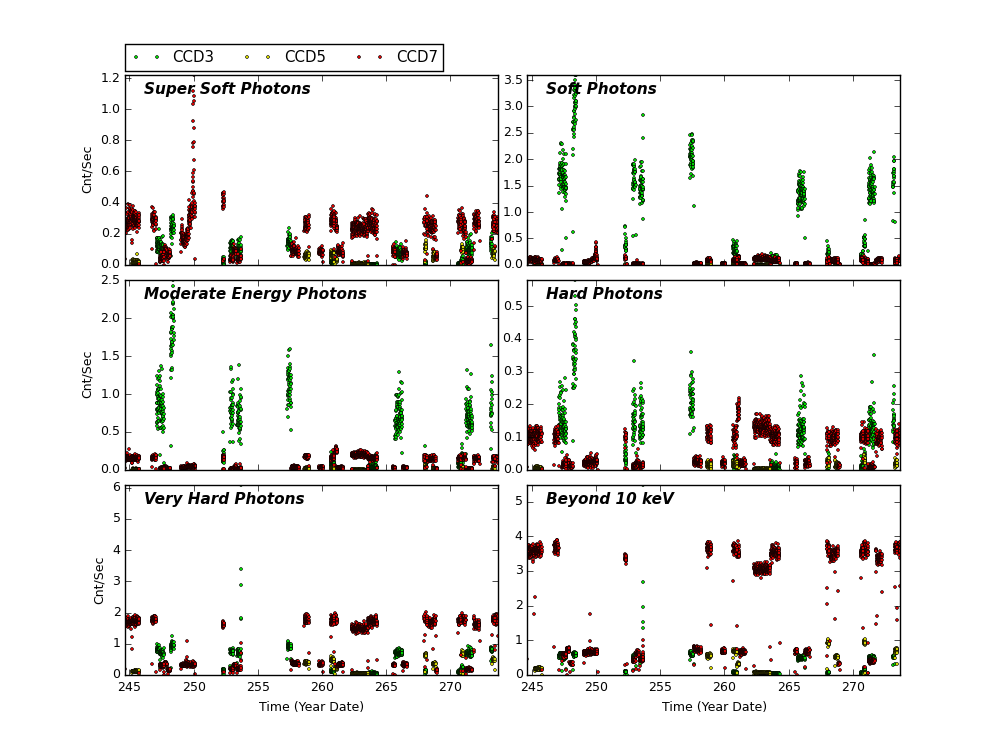
Science Instrument Background Rates
| Name | Low (keV) | High(KeV) | Description |
|---|---|---|---|
| SSoft | 0.00 | 0.50 | Super soft photons |
| Soft | 0.50 | 1.00 | Soft photons |
| Med | 1.00 | 3.00 | Moderate energy photons |
| Hard | 3.00 | 5.00 | Hard Photons |
| Harder | 5.00 | 10.00 | Very Hard photons |
| Hardest | 10.00 | Beyond 10 keV |
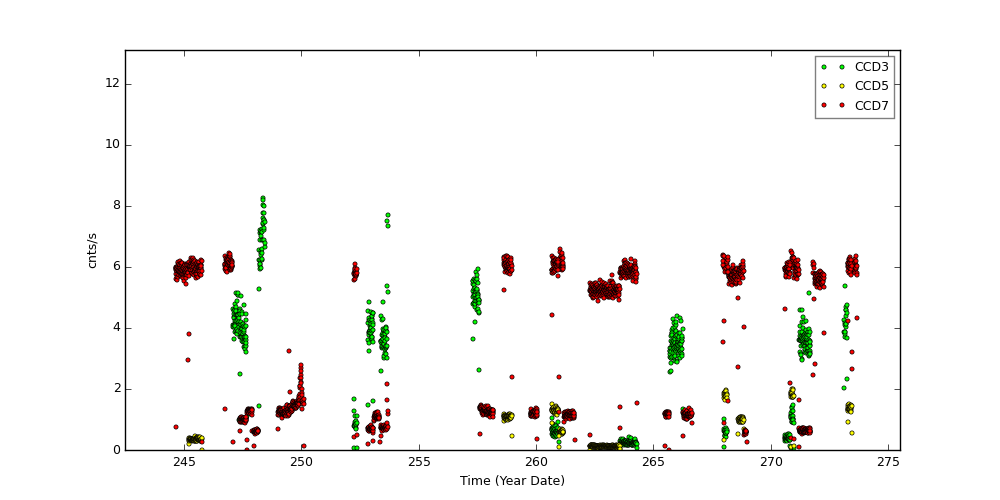
ACIS Rejected Events
The links below are plots of stat1 quantities, showing on-board rejected events. The average EVTSENT, DROP_AMP, DROP_POS, DROP_GRD, THR_PIX, and maximum BERR_SUM obtained from L1 acis*stat1.fits files are plotted for each observation. CTI observations are plotted separately from regular science observations.
Column definitions:
- EVTSENT - number of events sent in data record
- DROP_AMP - number of discarded events due to corrected amplitude
- DROP_POS - number of discarded events due to CCD position
- DROP_GRD - number of discarded events due to grade code
- THR_PIX - number of pixels above respective threshold level
- BERR_SUM - number of pixel bias errors so far in science run
Note the half-life decline of the CTI source is clearly evidenced in the steady janline of EVTSENT.
CCD3 CTI Observations
CCD3 Science Observations
CCD7 CTI Observations
CCD7 Science Observations
ACIS Gain Trends
We computed ACIS gain and offset from ACIS event1 files used in CTI computation, following the step described by C. Grant ACIS gain @ -120C page.
Instead computing gains and offsets from individual observations, we combined all data from each month and computed an monthly averaged gain and offset.
The following plots show CCD3 and CCD5 gains and offset trends.
| CCD 3 | |
)
|
)
|
| CCD 5 | |
)
|
)
|
[an error occurred while processing this directive]
HRC
DOSE of Central 4K Pore-Pairs
Please refer to Maximum Dose Trends for more details.
)
|
|---|
IMAGE                NPIX      MEAN    STDDEV      MIN       MAX
HRCI_09_2017.fits  16777216	0.042 	0.220 	0.000 	14.000
)
IMAGE                       NPIX      MEAN    STDDEV      MIN       MAX
HRCI_08_1999_09_2017.fits  16777216	5.037 	5.259 	0.000 	293.000
)
|
|---|
IMAGE                NPIX      MEAN    STDDEV      MIN       MAX
HRCS_09_2017.fits  16777216	0.045 	0.229 	0.000 	13.000
)
IMAGE                       NPIX      MEAN    STDDEV      MIN       MAX
HRCS_08_1999_09_2017.fits  16777216	16.658 	29.779 	0.000 	1714.000
|
|
Max dose trend plots corrected for events that "pile-up"
in the center of the taps due to bad position information.
|
)
|
)
|
)
|
)
|
| Jun 2017 | Mar 2017 | Dec 2016 | Sep 2016 |
|---|
)
|
)
|
)
|
)
|
| Jun 2017 | Mar 2017 | Dec 2016 | Sep 2016 |
|---|
Gratings
Focus
We plot the width of the zero order streak of ACIS/HETG observations and the width of the zero order image for HRC/LETG observations of point sources. No significant defocusing trend is seen at this time. See Gratings Focus pages.
PCAD
ACA Trending
Gyro Bias Drift
Radiation History
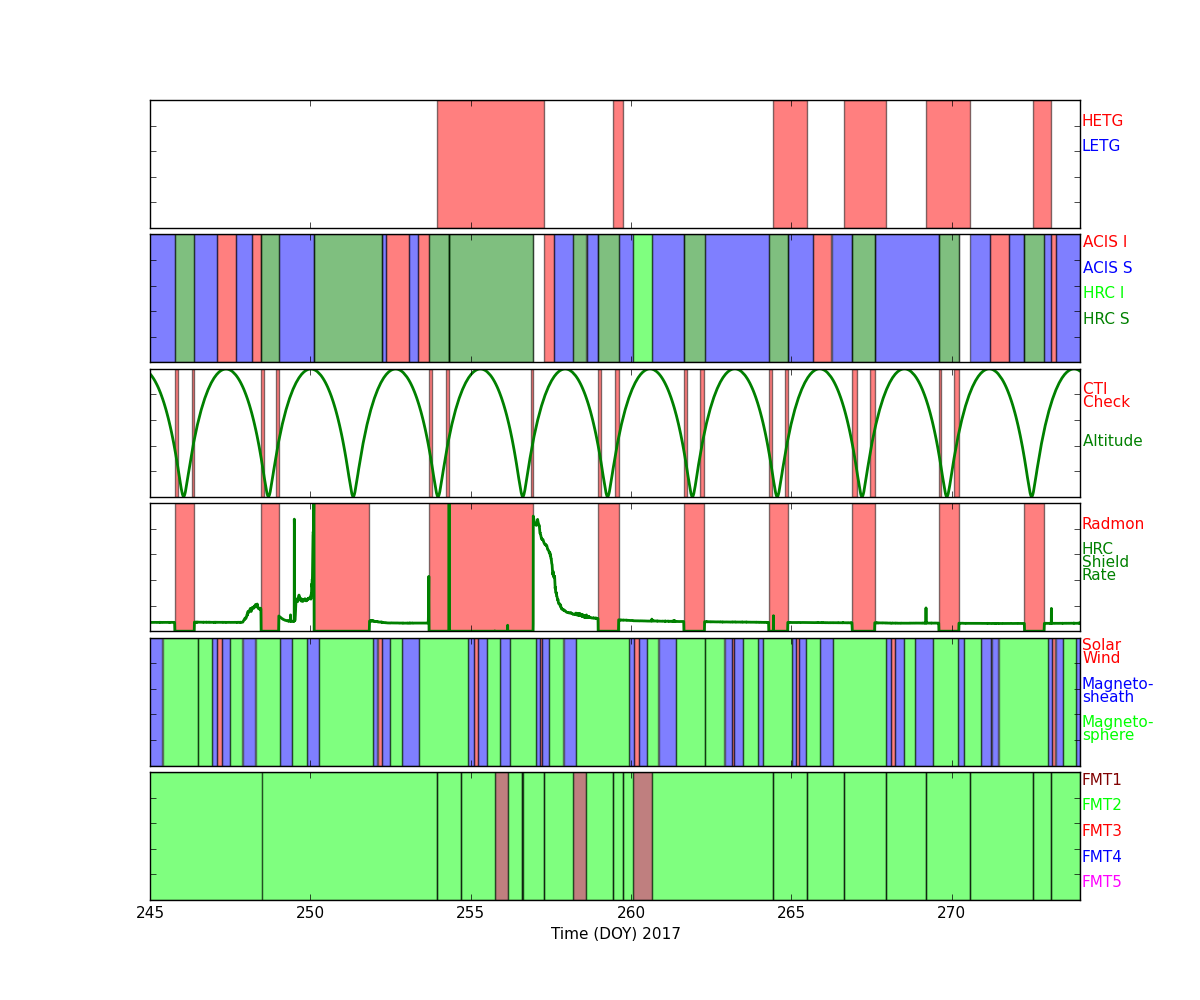
Radiation Zone Timing
Plotted below are radiation zone timing plots based on the following definitions of radiation zone:
- RADZONE - Ephin levels (in any of the E1300,P4GM,P41GM channels) are more than 1/3 of RADMON safing thresholds.
- RADMON - Radmon is disabled for radiation zone (as commanded based on OFLS model, for comparison with actual radiation levels).
- PERIGEE - Time of closest earth approach (for comparison)
Radiation Count Rates of Sep 2017
Sun Spot History
-->
Trending
Critical Trends
| ACIS Temperatures - Daily Maximums | ||||||
|---|---|---|---|---|---|---|
| MSID | MEAN | RMS | DELTA/YR | DELTA/YR/YR | UNITS | DESCRIPTION |
| 1PDEAAT | 306.06 | 7.81 | -6.886e-01 | -7.299e+00 | K | PSMC DEA PS A TEMP |
| 1PIN1AT | 320.72 | 18.67 | 1.992e+01 | -4.136e+01 | K | PSMC TEMP 1A |
)
)
| HRMA Computed Averages - Daily Maximums | ||||||
|---|---|---|---|---|---|---|
| MSID | MEAN | RMS | DELTA/YR | DELTA/YR/YR | UNITS | DESCRIPTION |
| OBAAVG | 289.52 | 3.21 | 1.102e+00 | 8.659e-02 | TEMP | OBA/TFTE |
)
| EPHIN Temperatures - Daily Maximums | ||||||
|---|---|---|---|---|---|---|
| MSID | MEAN | RMS | DELTA/YR | DELTA/YR/YR | UNITS | DESCRIPTION |
| TEIO | 335.95 | 19.81 | -8.239e-01 | -1.167e+01 | K | EPHIN ELECTRONICS HOUSING TEMP |
| TEPHIN | 336.80 | 6.52 | 2.093e+00 | 5.670e+00 | K | EPHIN SENSOR HOUSING TEMP |
)
)
| S/C Main Temperatures - Daily Maximums | ||||||
|---|---|---|---|---|---|---|
| MSID | MEAN | RMS | DELTA/YR | DELTA/YR/YR | UNITS | DESCRIPTION |
| S/C Ancillary Temperatures - Daily Maximums | ||||||
|---|---|---|---|---|---|---|
| MSID | MEAN | RMS | DELTA/YR | DELTA/YR/YR | UNITS | DESCRIPTION |
| TFSSBKT1 | 343.96 | 20.70 | -1.201e+00 | -4.637e+01 | K | FSS BRACKET-1 TEMP (+Y) |
| TFSSBKT2 | 340.17 | 26.86 | -8.393e-01 | -6.949e+01 | K | FSS BRACKET-2 TEMP (+Y) |
| TSCTSF1 | 308.69 | 4.04 | 4.389e+00 | 2.813e+00 | K | SC-TS FITTING -1 TEMP |
| TSCTSF6 | 310.25 | 4.20 | 3.444e+00 | 4.617e-02 | K | SC-TS FITTING -6 TEMP |
)
)
)
)
| MUPS - Daily Maximums | ||||||
|---|---|---|---|---|---|---|
| MSID | MEAN | RMS | DELTA/YR | DELTA/YR/YR | UNITS | DESCRIPTION |
| PM1THV1T | 333.47 | 8.23 | -2.762e-01 | -1.892e+02 | K | MUPS 1 THRUSTER VALVE 01 TEMP |
| PLINE02T | 317.64 | 11.13 | 3.347e+00 | 5.826e+00 | K | PROP LINE TEMP 02 |
| PLINE03T | 316.64 | 13.64 | 3.278e+00 | 7.846e+00 | K | PROP LINE TEMP 03 |
| PLINE04T | 302.24 | 12.73 | 3.233e+00 | 7.055e+00 | K | PROP LINE TEMP 04 |
)
)
)
)
Quarterly Trends
- PCAD FTS Temperature and Gradient
| Previous Quarter | ||||||
| MSID | MEAN | RMS | DELTA/YR | DELTA/YR/YR | UNITS | DESCRIPTION |
| OHRTHR27 | 297.16 | 1.156e-02 | 3.610e-02 | 2.289e-01 | K | RT 20 : PERISCOPE |
| OHRTHR42 | 294.79 | 0.16 | 8.214e-01 | 5.068e+00 | K | RT 133: PERISCOPE |
| OHRTHR43 | 294.91 | 0.27 | 1.317e+00 | 6.979e+00 | K | RT 134: PERISCOPE |
| OOBAGRD3 | -0.20 | 0.12 | -4.933e-01 | -2.314e+00 | K | RT 505 TO RT 504: PERISCOPE GRADIENT |
| OOBAGRD6 | 0.08 | 4.809e-03 | 1.618e-02 | 2.015e-01 | K | RT 507 TO RT 506: PERISCOPE GRADIENT |
)
)
)
)
)
- SIM Temperature
| Previous Quarter | ||||||
| MSID | MEAN | RMS | DELTA/YR | DELTA/YR/YR | UNITS | DESCRIPTION |
| 3BTU_BPT | 268.22 | 7.38 | 2.458e+01 | 1.979e-12 | K | BTU BASEPLATE (+X)), ABORT HTR TSC2 |
| 3TSMXCET | 244.38 | 3.686e+01 | 1.473e+00 | -1.786e-13 | K | -X TURTLE SHELL NR HRC CEA |
| 3TSMXSPT | 283.58 | 3.341e+01 | -3.745e+00 | -1.675e-12 | K | -X TURTLE SHELL NR ACIS SS |
| BOXTEMP | 282.84 | 1.80 | 4.788e+00 | 1.438e-12 | K | SEA box temperature (3FASEAAT) |
| FAMTRTEMP | 273.38 | 2.81 | 9.755e+00 | -6.358e-13 | K | FA motor temperature |
| FLEXATEMP | 271.91 | 2.97 | 8.832e+00 | -2.711e-12 | K | Flexure A temperature (3FAFLAAT) |
| PSUTEMP | 311.91 | 1.43 | 2.281e+00 | -5.912e-13 | K | SEA power supply temperature (3FAPSAT) |
| TSCMTRTEMP | 275.45 | 19.29 | 4.619e+01 | -4.354e-12 | K | TSC motor temperature |
)
)
)
)
)
)
)
)
- SIIM Electronics
| Previous Quarter | ||||||
| MSID | MEAN | RMS | DELTA/YR | DELTA/YR/YR | UNITS | DESCRIPTION |
| AGRNDADC | 3.790e-05 | 1.994e-04 | -4.448e-04 | 9.836e-03 | V | Analog ground A/D convert reading |
| FATABADC | 5.00 | 2.382e-03 | -5.315e-03 | -6.071e-02 | Converter | FA Tab Position Sensor A/D |
| N15VADC | -15.01 | 5.634e-04 | -9.879e-04 | -3.388e-03 | Reading | -15V Power Supply A/D Converter |
| P15VADC | 14.96 | 5.839e-04 | -1.596e-03 | 1.706e-02 | Reading | +15V Power Supply A/D Converter |
| P5VADC | 4.99 | 2.315e-02 | -5.623e-02 | 2.405e-01 | Reading | +5V Power Supply A/D Converter |
| TSCTABADC | 5.00 | 4.186e-03 | -8.977e-03 | -6.058e-02 | converter | TSC Tab Position Sensor A/D |
)
)
)
)
)
)
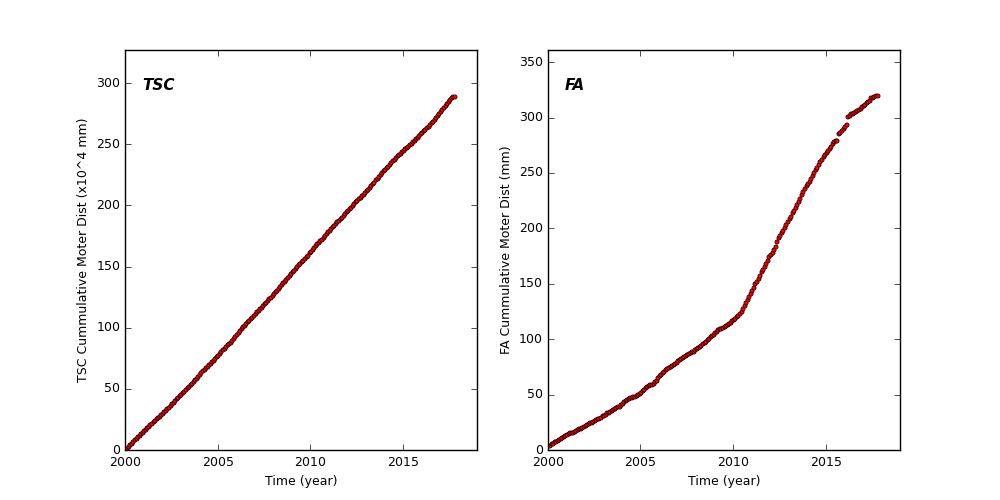
Envelope Trending
Spacecraft Motions
TSC and FA Cummulative Moter Distance
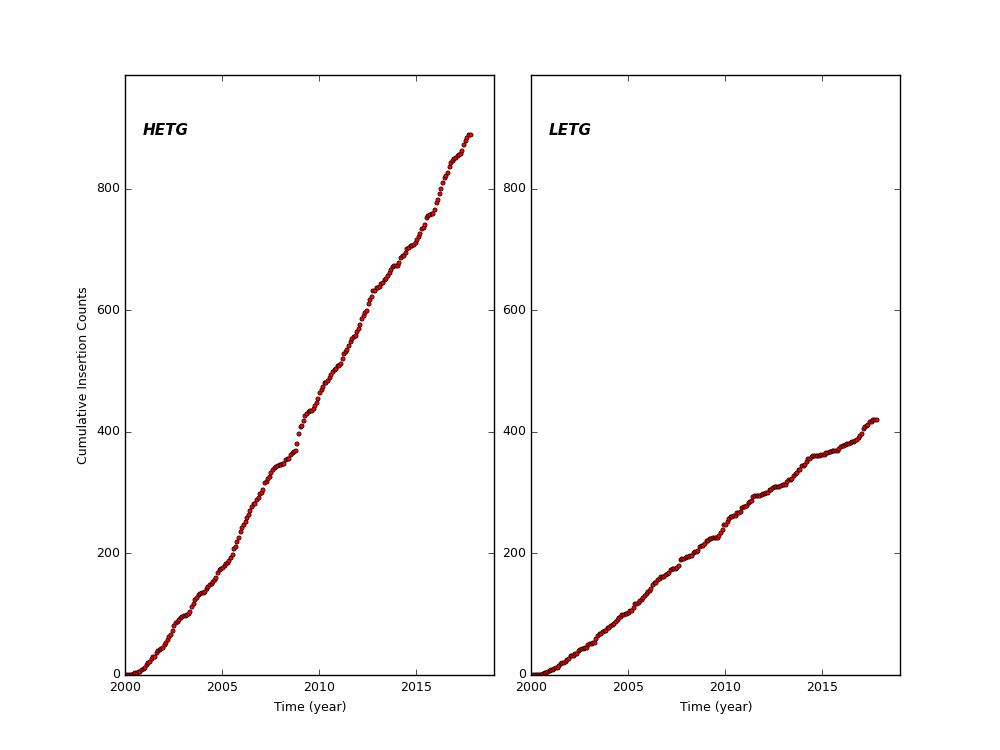
HETG and LETG Cummulative Insertion Counts
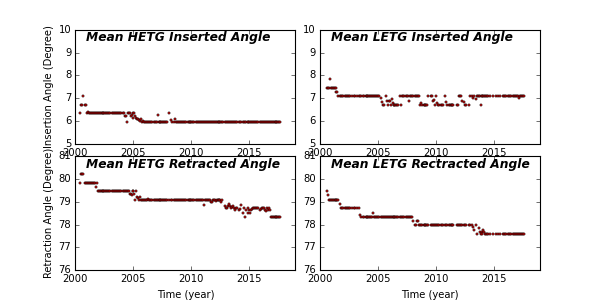
HETG/LETG Insertion/Retraction Angle
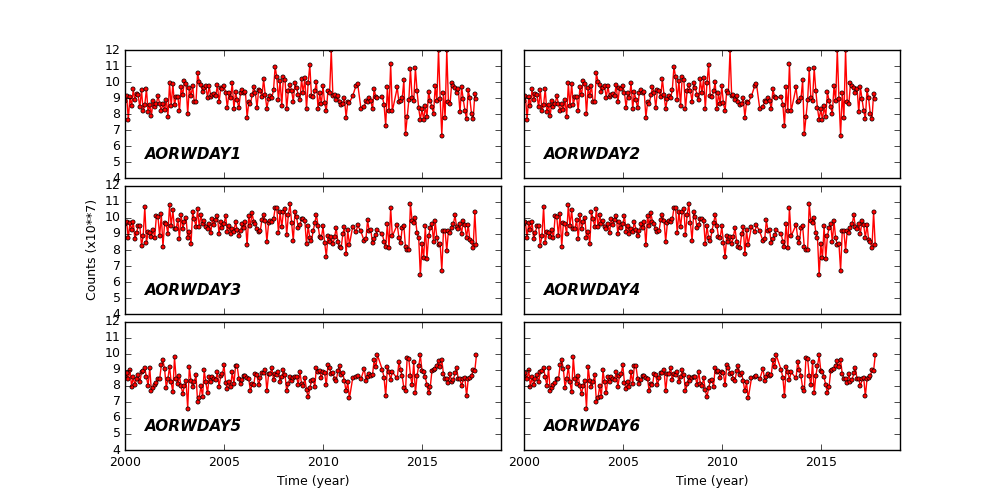
Reaction Wheel Rotations
Links to Past Monthly Reports
| Year | Month | |||||||||||
|---|---|---|---|---|---|---|---|---|---|---|---|---|
| 2017 | Jan | Feb | Mar | Apr | May | Jun | Jul | Aug | ||||
| 2016 | Jan | Feb | Mar | Apr | May | Jun | Jul | Aug | Sep | Oct | Nov | Dec |
| 2015 | Jan | Feb | Mar | Apr | May | Jun | Jul | Aug | Sep | Oct | Nov | Dec |
| 2014 | Jan | Feb | Mar | Apr | May | Jun | Jul | Aug | Sep | Oct | Nov | Dec |
| 2013 | Jan | Feb | Mar | Apr | May | Jun | Jul | Aug | Sep | Oct | Nov | Dec |
| 2012 | Jan | Feb | Mar | Apr | May | Jun | Jul | Aug | Sep | Oct | Nov | Dec |
| 2011 | Jan | Feb | Mar | Apr | May | Jun | Jul | Aug | Sep | Oct | Nov | Dec |
| 2010 | Jan | Feb | Mar | Apr | May | Jun | Jul | Aug | Sep | Oct | Nov | Dec |
| 2009 | Jan | Feb | Mar | Apr | May | Jun | Jul | Aug | Sep | Oct | Nov | Dec |
| 2008 | Jan | Feb | Mar | Apr | May | Jun | Jul | Aug | Sep | Oct | Nov | Dec |
| 2007 | Jan | Feb | Mar | Apr | May | Jun | Jul | Aug | Sep | Oct | Nov | Dec |
| 2006 | Jan | Feb | Mar | Apr | May | Jun | Jul | Aug | Sep | Oct | Nov | Dec |
| 2005 | Jan | Feb | Mar | Apr | May | Jun | Jul | Aug | Sep | Oct | Nov | Dec |
| 2004 | Jan | Feb | Mar | Apr | May | Jun | Jul | Aug | Sep | Oct | Nov | Dec |
| 2003 | Jan | Feb | Mar | Apr | May | Jun | Jul | Aug | Sep | Oct | Nov | Dec |
| 2002 | Jan | Feb | Mar | Apr | May | Jun | Jul | Aug | Sep | Oct | Nov | Dec |
| 2001 | Jan | Feb | Mar | Apr | May | Jun | Jul | Aug | Sep | Oct | Nov | Dec |
| 2000 | Jan | Feb | Mar | Apr | May | Jun | Jul | Aug | Sep | Oct | Nov | Dec |
| 1999 | Jul | Aug | Sep | Oct | Nov | Dec | ||||||