ACIS
ACIS DOSE Registered-Photon-Map
The steps we took to compute the dose map are;
- Level 1 Event files for a specified month are obtained from archive.
- Image data including I2, I3, S2, S3 CCDs are extracted from all event files.
- All the extracted image data were merged to create a month long exposure map for the month.
- The exposure map is opened with ds9, and check a distribution of count rates against energy. From this, estimate the upper threshold value. Any events beyond this upper threshold are assumed erroneous events such as bad pixels.
- Using this upper threshold, the data is filtered, and create a cleaned exposure map for the month.
- The exposure map from each month from the Sep 1999 is added up to create a cumulative exposure map for each month.
- Using fimgstatistic, we compute count rate statistics for each CCDs.
- For observations with high data drop rates (e.g., Crab nebula, Cas A), we corrected the observations by adding events.
Please check more detail plots at Telemetered Photon Dose Trend page.
)
)
)
Statistics:
# IMAGE     NPIX     MEAN        RMS        MIN     MAX
ACIS_oct17 6004901       11.297         99.619           0.0     10999


I2 node 0  262654	6.835081	3.177120	0.0	 51.0
I2 node 1  262654	7.049370	7.051444	0.0	3077.0
I2 node 2  262654	6.828083	3.103283	0.0	 66.0
I2 node 3  262654	6.961214	15.847241	0.0	7818.0

I3 node 0  262654	6.511781	3.185150	0.0	263.0
I3 node 1  262654	6.405562	3.446495	0.0	113.0
I3 node 2  262654	6.164434	2.883854	0.0	 61.0
I3 node 3  262654	6.270364	10.829154	0.0	5299.0

S2 node 0  262654	15.841713	78.589598	0.0	5504.0
S2 node 1  262654	17.485310	87.995284	0.0	4197.0
S2 node 2  262654	20.888140	156.736039	0.0	10128.0
S2 node 3  262654	20.075670	119.889403	0.0	5860.0

S3 node 0  262654	27.557334	147.140583	0.0	7608.0
S3 node 1  262654	26.400086	148.385124	0.0	9055.0
S3 node 2  262654	30.117272	271.965364	0.0	10882.0
S3 node 3  262654	23.954287	212.406272	0.0	10999.0
)
)
)
Statistics:
 IMAGE     NPIX      MEAN        RMS           MIN      MAX
ACIS_total   6004901       2149.085         2790.435           0.0   121400


I2 node 0  262654	1844.902650	361.640192	380.0	10288.0
I2 node 1  262654	1942.365149	502.222579	400.0	69319.0
I2 node 2  262654	6.828083	3.103283	0.0	 66.0
I2 node 3  262654	1979.754908	510.132348	387.0	28412.0

I3 node 0  262654	2092.903042	517.398035	383.0	8184.0
I3 node 1  262654	2175.925418	1632.841345	393.0	51338.0
I3 node 2  262654	1909.452699	351.233029	371.0	10611.0
I3 node 3  262654	6.270364	10.829154	0.0	5299.0

S2 node 0  262654	2499.528565	381.348282	1437.0	21625.0
S2 node 1  262654	17.485310	87.995284	0.0	4197.0
S2 node 2  262654	2939.693222	588.182092	2017.0	27559.0
S2 node 3  262654	2884.999238	438.963619	1746.0	51390.0

S3 node 0  262654	4458.758938	2020.793263	1951.0	23479.0
S3 node 1  262654	5651.520927	2195.798018	0.0	24948.0
S3 node 2  262654	4425.735198	1175.066566	1840.0	21554.0
S3 node 3  262654	3407.523518	597.311632	2073.0	20927.0
)
|
)
|
)
|
)
|
| Jul 2017 | Apr 2017 | Jan 2017 | Oct 2016 |
|---|
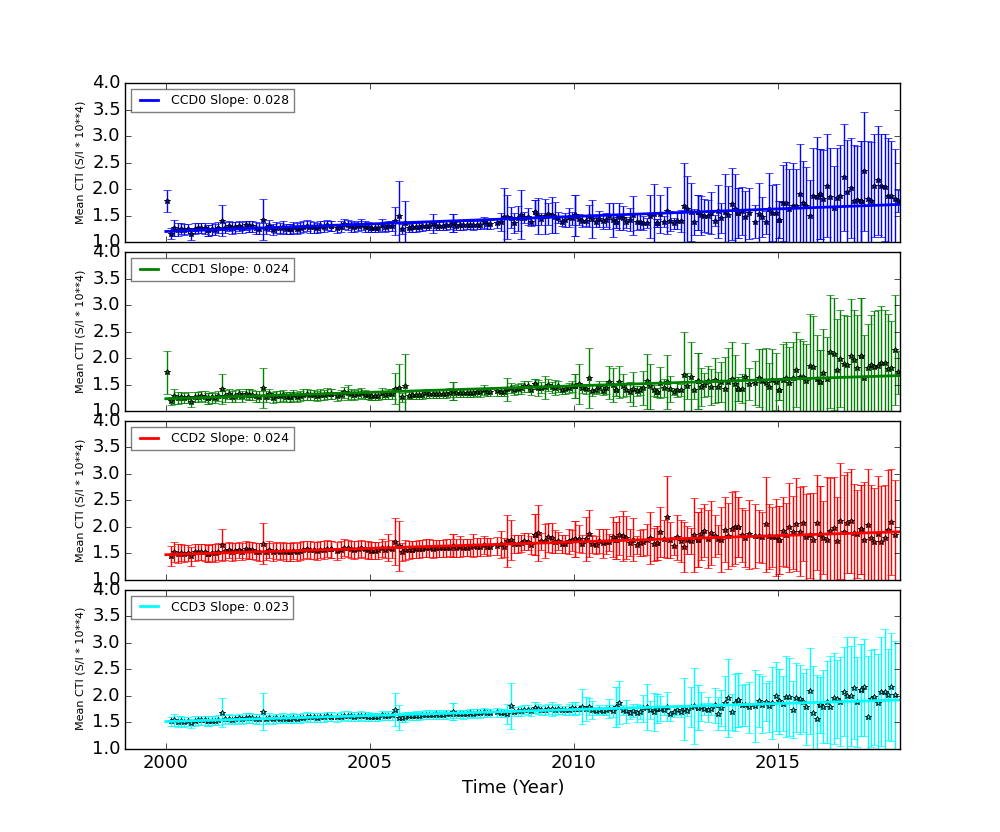
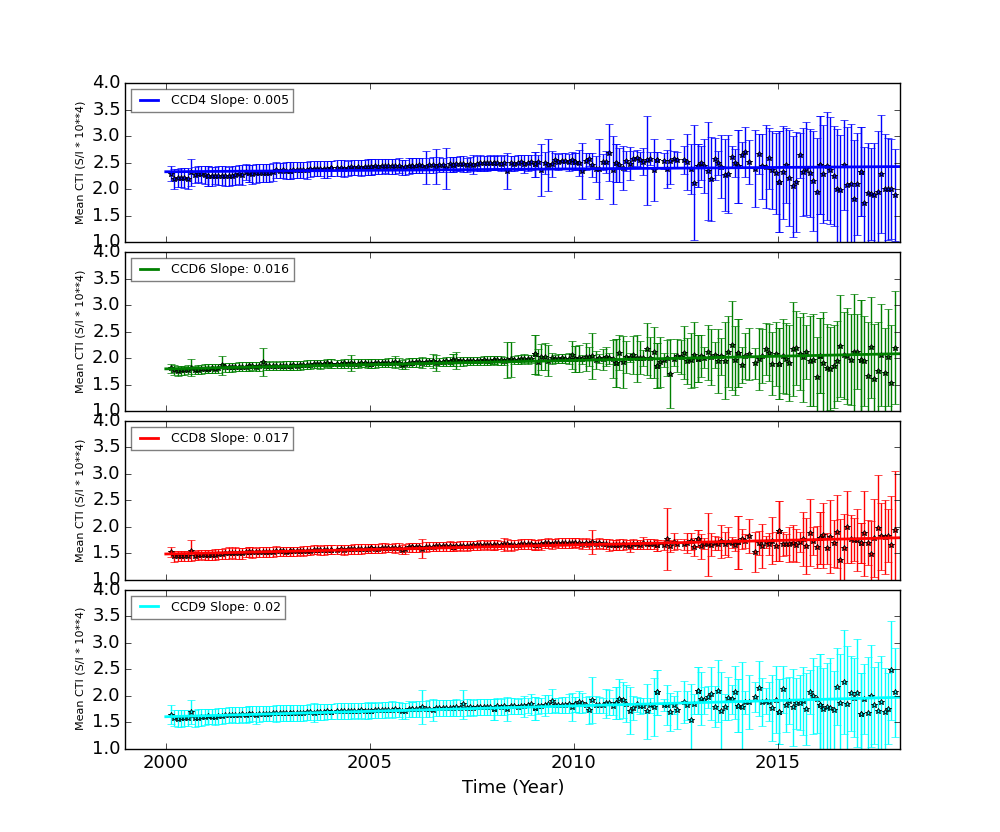
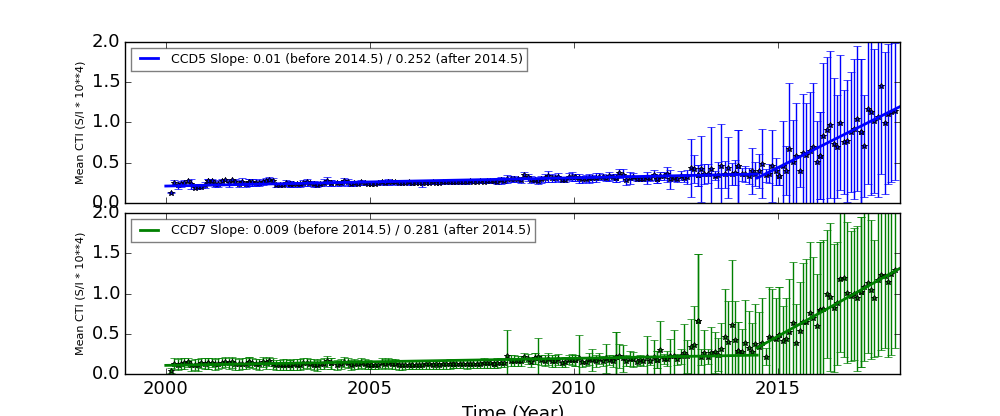
The Mean Detrended CTI
We report CTIs with a refined data definition. CTIs were computed for the temperature dependency corrected data. Please see CTI page for detailed explanation. CTI's are computed for Mn K alpha, and defined as slope/intercept x10^4 of row # vs ADU. Data file: here
Imaging CCDs
Spectral CCDs
Backside CCDs
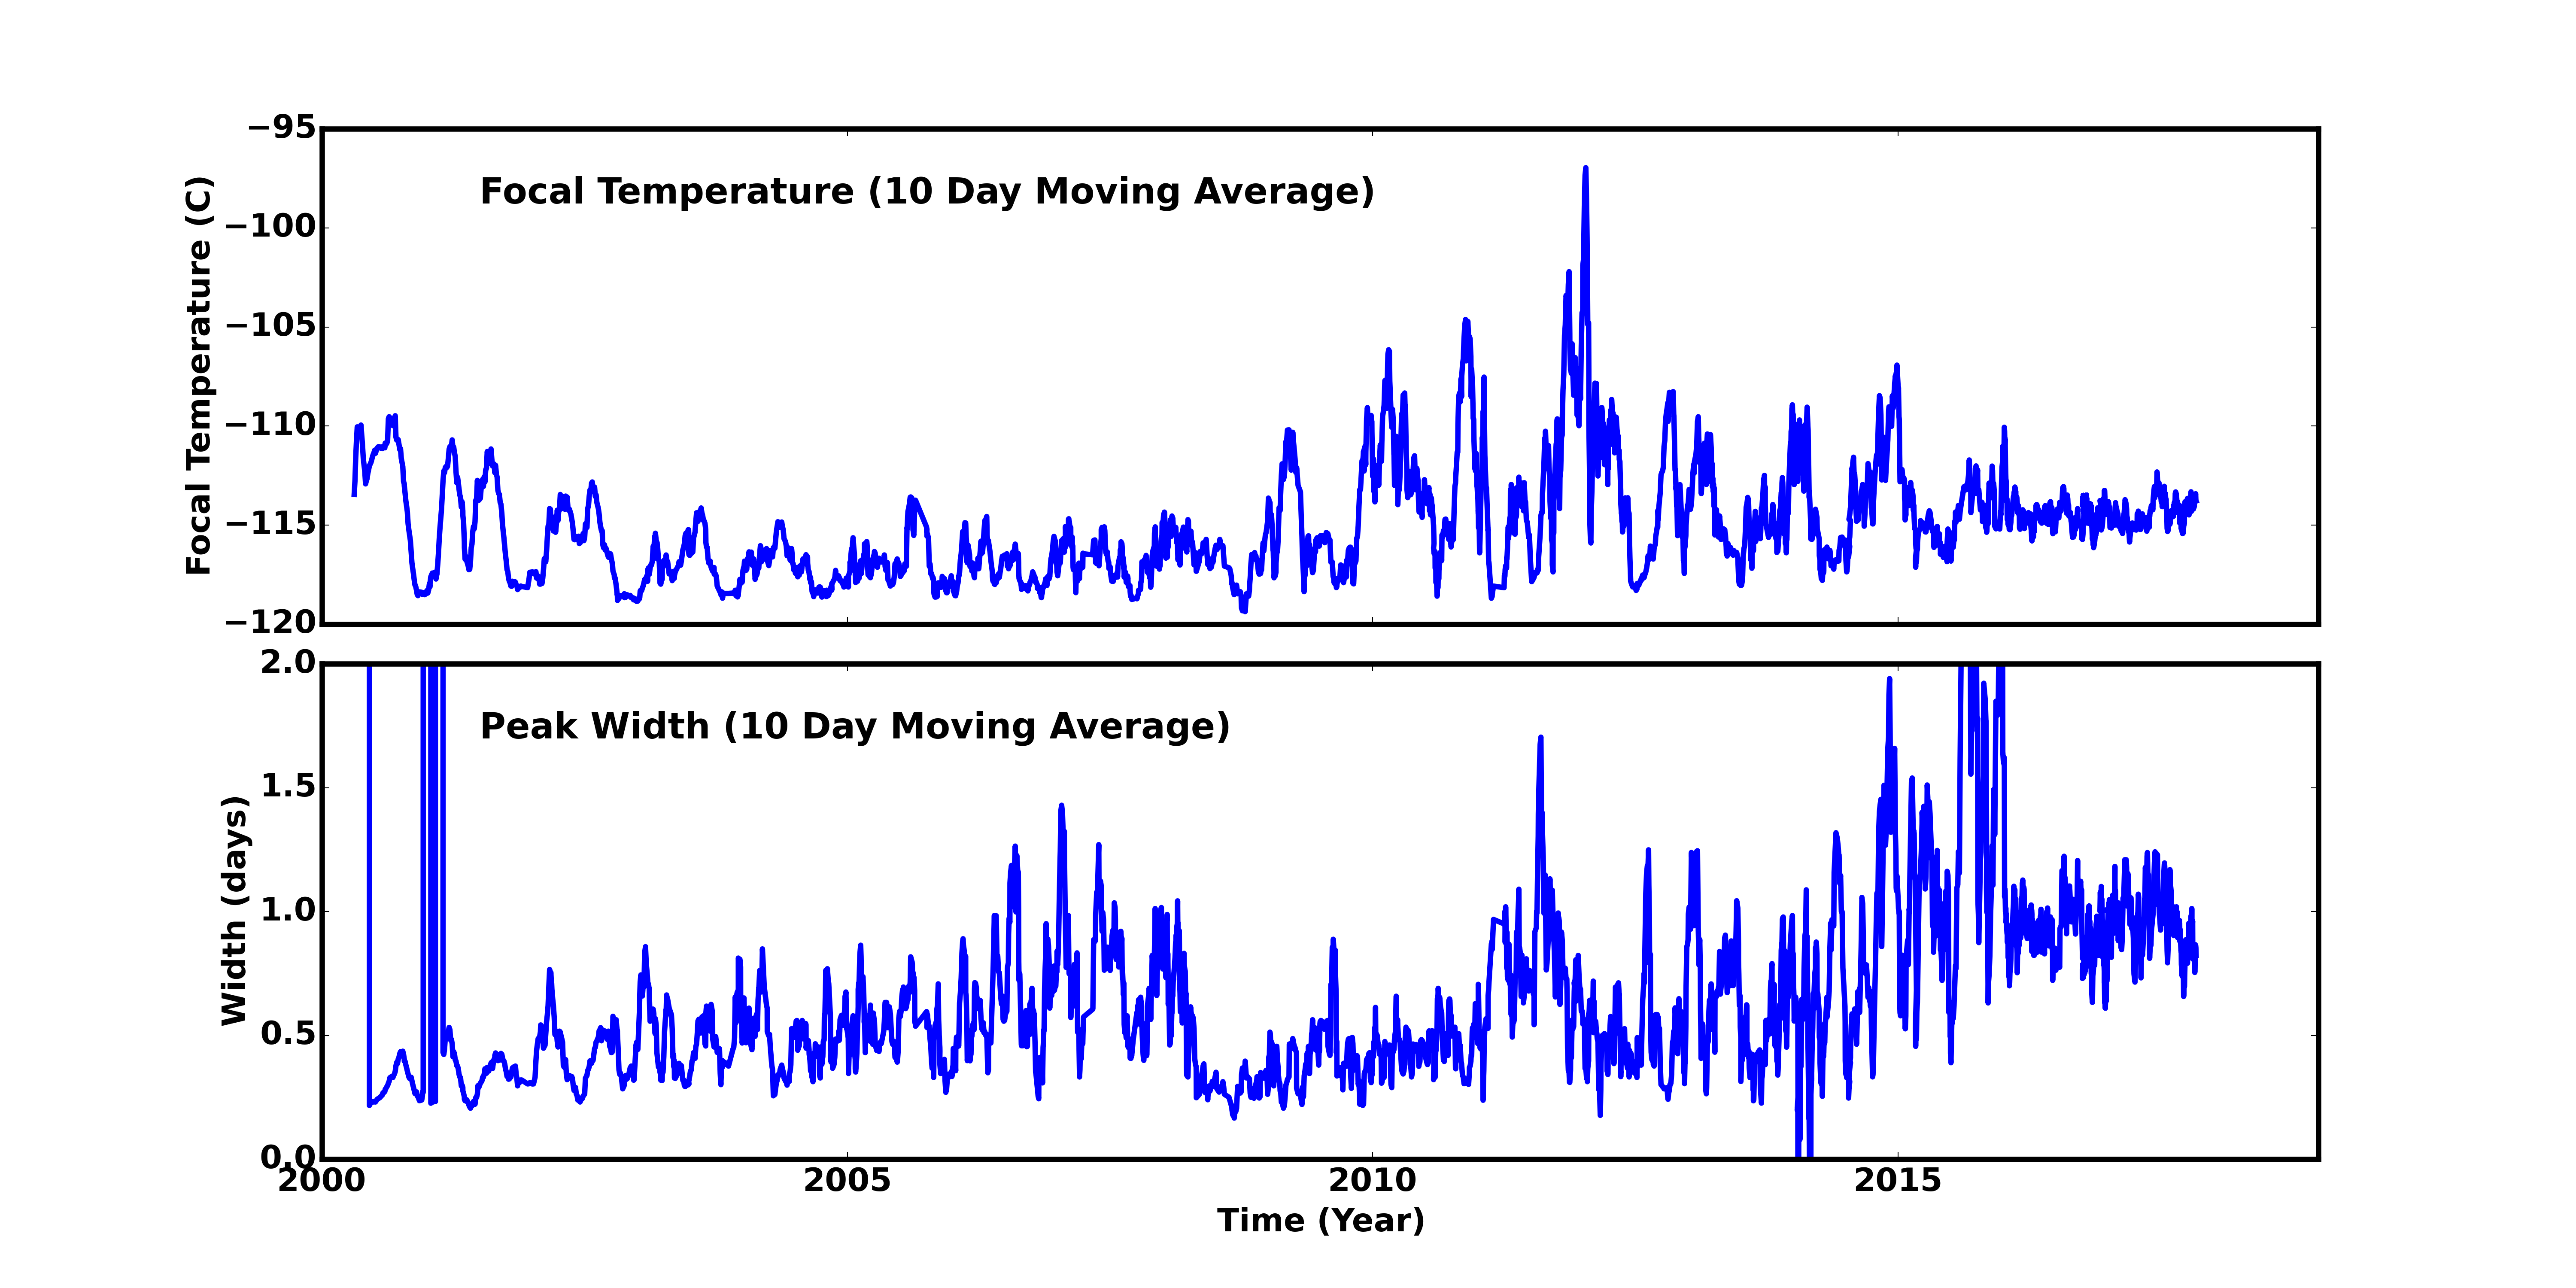
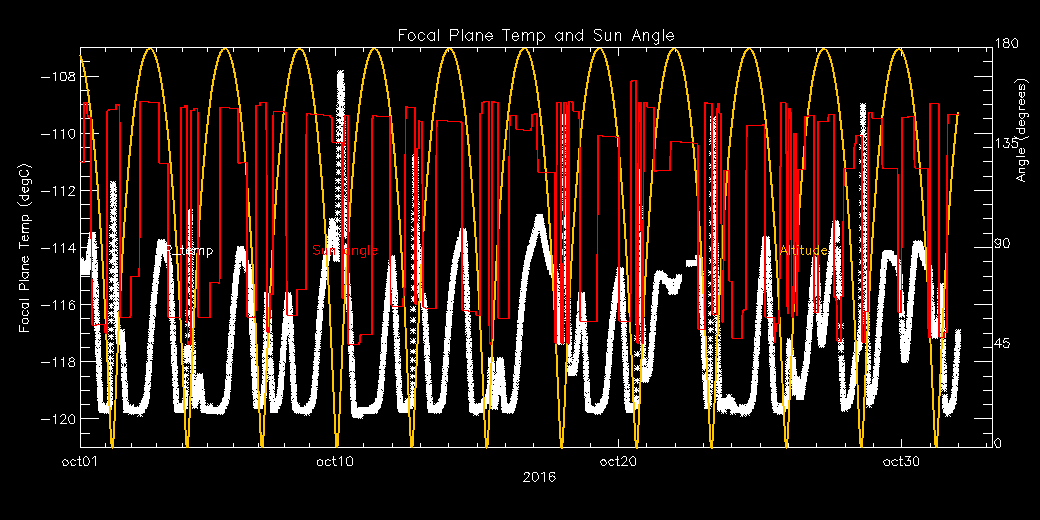
Focal Plane Temperature
Oct 2017 Focal Temperature
| The Mean (max) FPT: | |
|---|---|
| -113.85 | +/- 2.32 C |
| Mean Width: | |
| 0.88 | +/- 0.41 days |
Averaged Focal Plane Temperature
We are using 10 period moving averages to show trends of peak temperatures and peak widths. Note, the gaps in the width plot are due to missing/corrupted data.
Focal Plane Temperature, Sun Angle and Altitude
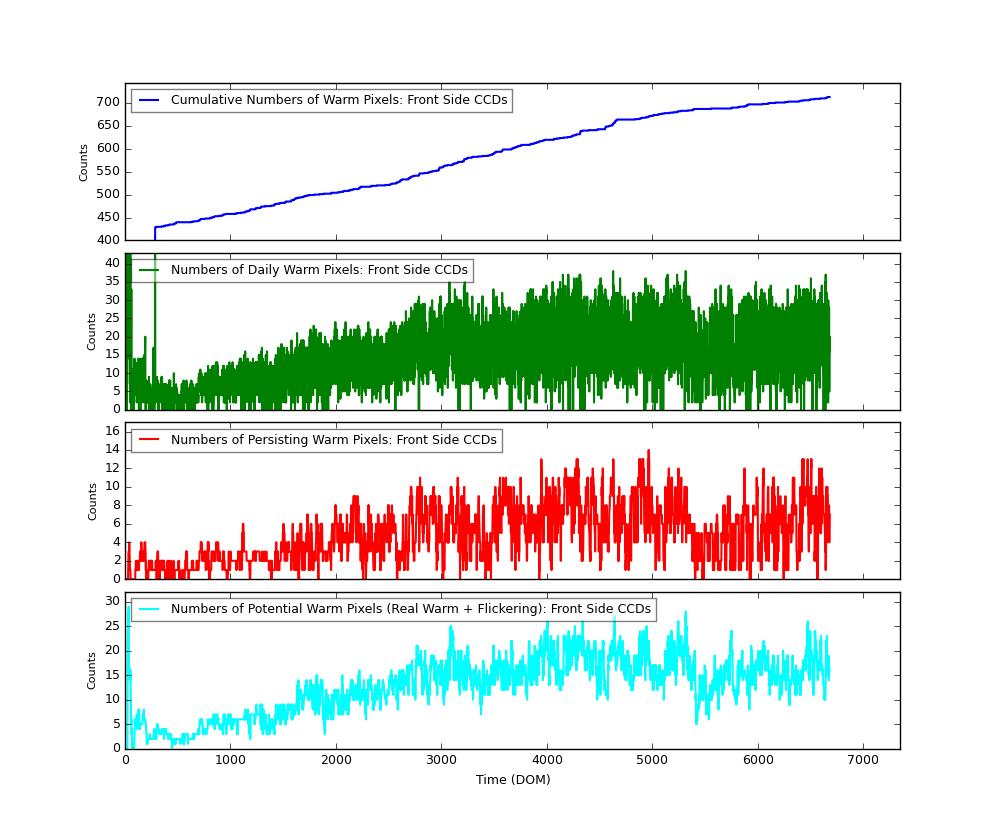
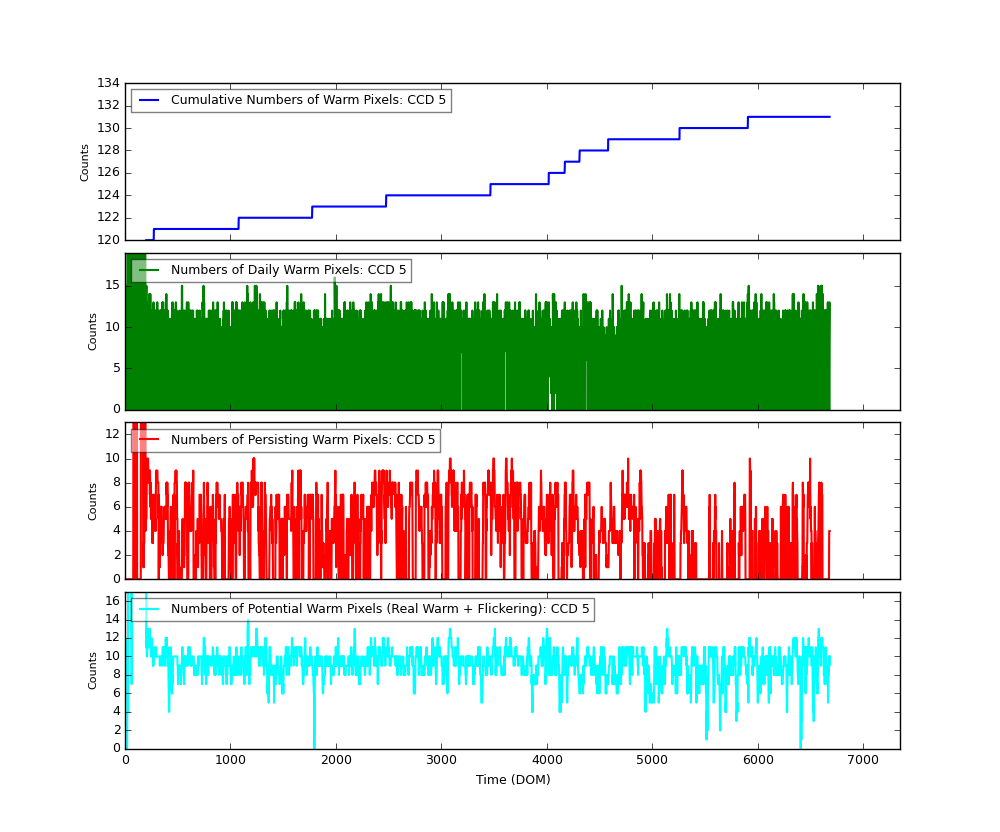
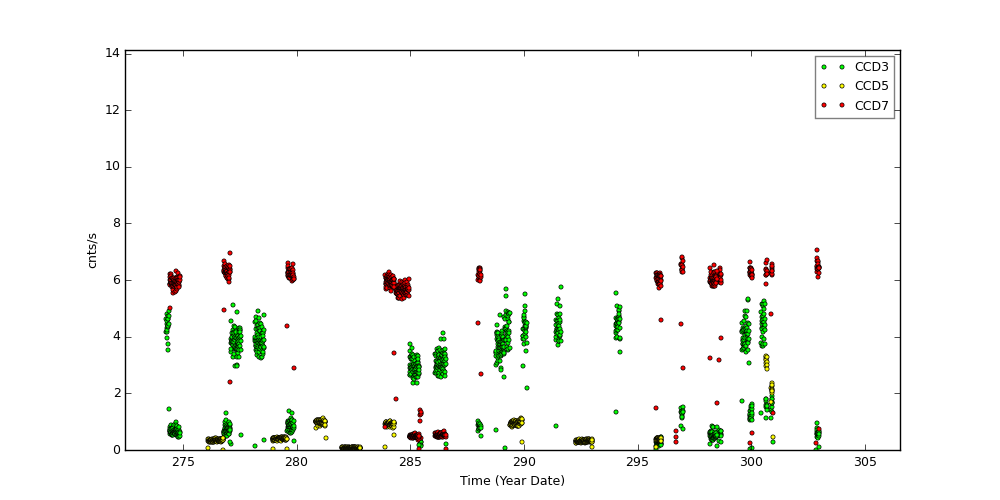
Bad Pixels
The plots below were generated with a new warm pixel finding script. Please see Acis Bad Pixel Page for details.
Front Side CCDs
Back Side CCD (CCD5)
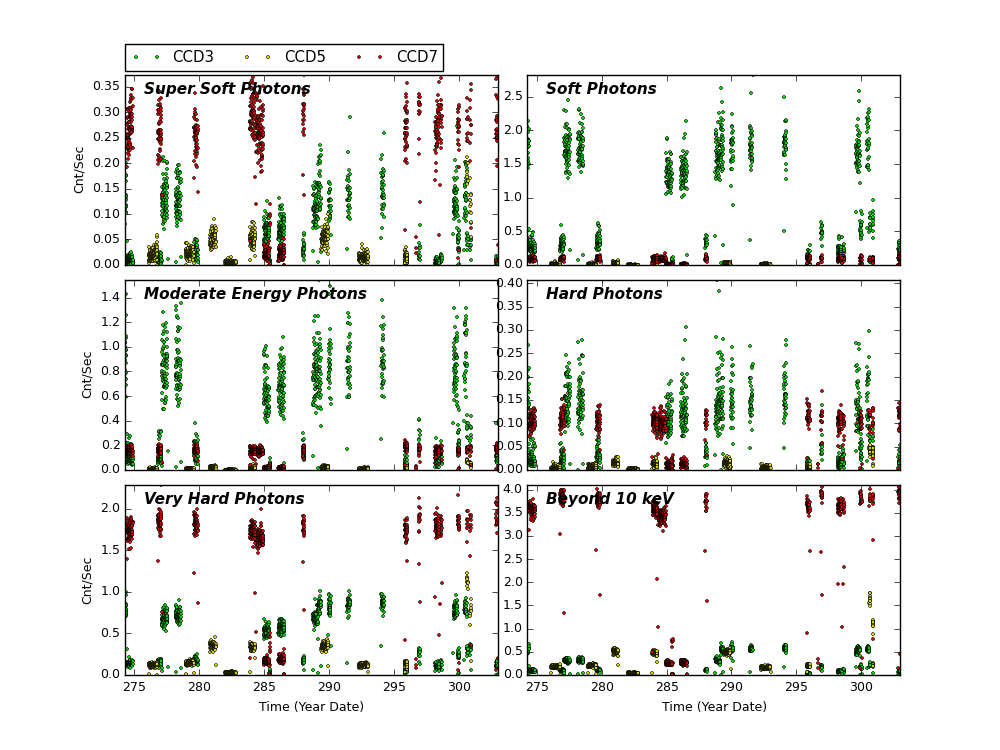
Science Instrument Background Rates
| Name | Low (keV) | High(KeV) | Description |
|---|---|---|---|
| SSoft | 0.00 | 0.50 | Super soft photons |
| Soft | 0.50 | 1.00 | Soft photons |
| Med | 1.00 | 3.00 | Moderate energy photons |
| Hard | 3.00 | 5.00 | Hard Photons |
| Harder | 5.00 | 10.00 | Very Hard photons |
| Hardest | 10.00 | Beyond 10 keV |
HRC
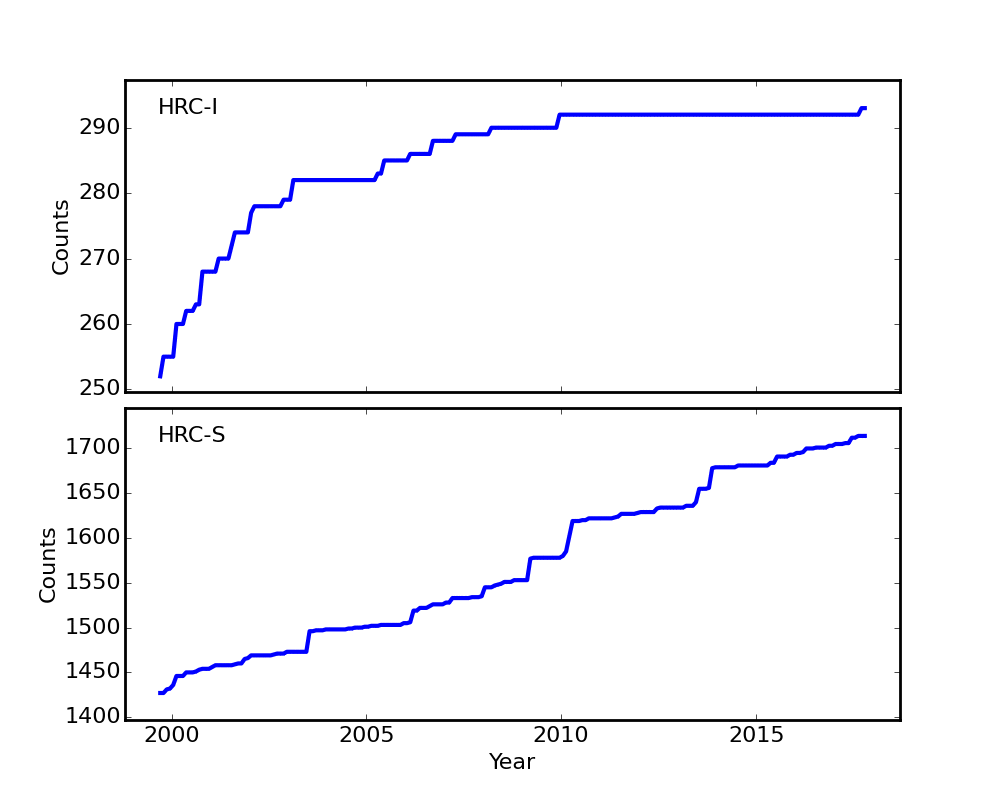
DOSE of Central 4K Pore-Pairs
Please refer to Maximum Dose Trends for more details.
)
|
|---|
IMAGE                NPIX      MEAN    STDDEV      MIN       MAX
HRCI_10_2017.fits  16777216	0.009 	0.103 	0.000 	10.000
)
IMAGE                       NPIX      MEAN    STDDEV      MIN       MAX
HRCI_08_1999_10_2017.fits  16777216	5.046 	5.270 	0.000 	293.000
)
|
|---|
IMAGE                NPIX      MEAN    STDDEV      MIN       MAX
HRCS_10_2017.fits  16777216	0.002 	0.049 	0.000 	4.000
)
IMAGE                       NPIX      MEAN    STDDEV      MIN       MAX
HRCS_08_1999_10_2017.fits  16777216	16.660 	29.781 	0.000 	1714.000
|
|
Max dose trend plots corrected for events that "pile-up"
in the center of the taps due to bad position information.
|
)
|
)
|
)
|
)
|
| Jul 2017 | Apr 2017 | Jan 2017 | Oct 2016 |
|---|
)
|
)
|
)
|
)
|
| Jul 2017 | Apr 2017 | Jan 2017 | Oct 2016 |
|---|
Gratings
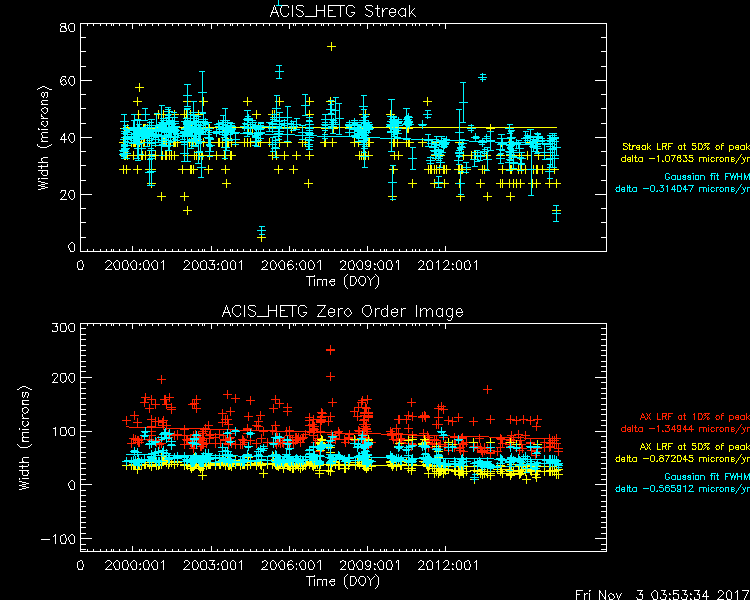
Focus
We plot the width of the zero order streak of ACIS/HETG observations and the width of the zero order image for HRC/LETG observations of point sources. No significant defocusing trend is seen at this time. See Gratings Focus pages.
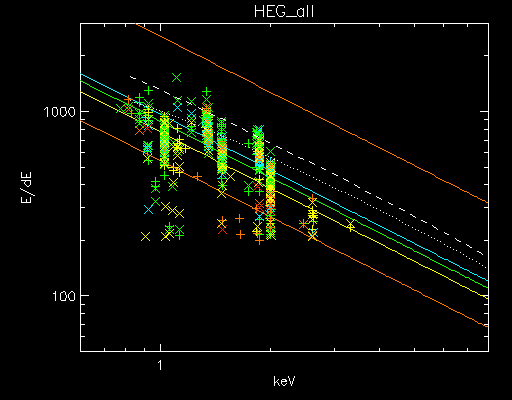
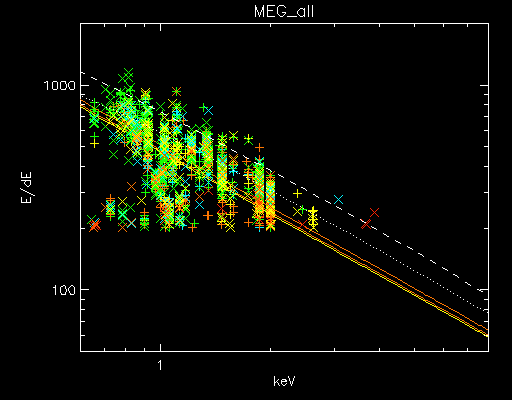
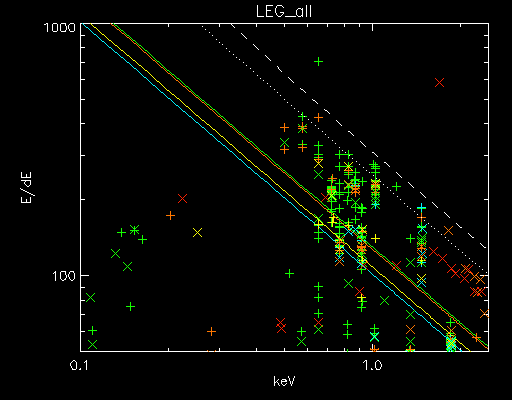
Gratings Resolving Power
We plot E/dE vs. E for fits to detected lines with fwhm_error/fwhm less than 0.15 for the plus and minus arms of HEG, MEG, and LEG. Also shown are conservative (dotted line) and optimistic (dashed line) pre-launch resolving power expectations.
We have selected only calibration observations of Capella, HR1099, and Sigma Gem. See MIT technotes for a parallel analysis.
| Plot symbol indicates dispersion arm: | Color indicates observation date: |
Minus side = cross (x) |
2002-2004 blue 2005-2006 yellow 2007-2009 orange |
PCAD
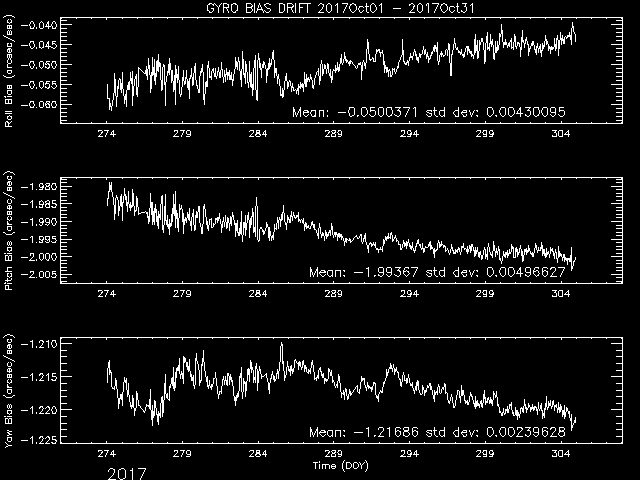
ACA Trending
Gyro Bias Drift
Radiation History
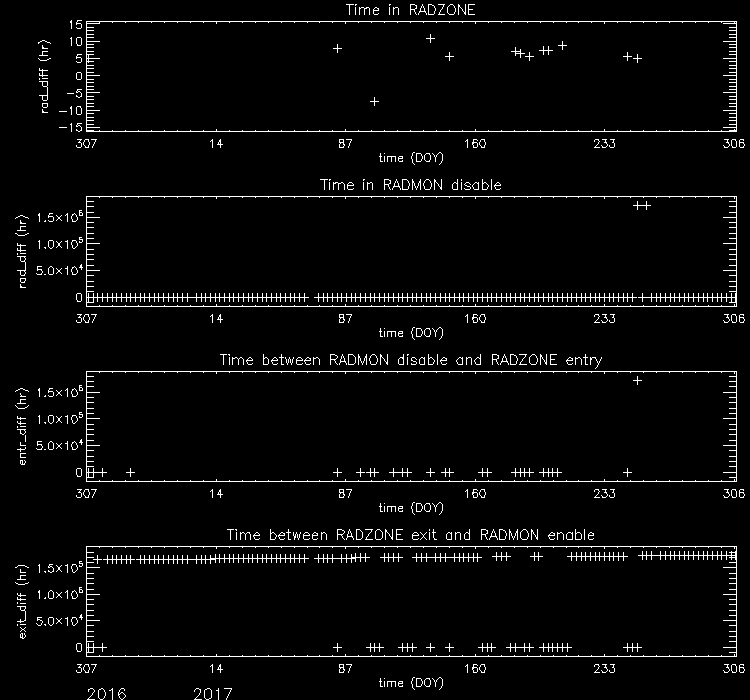
Radiation Zone Timing
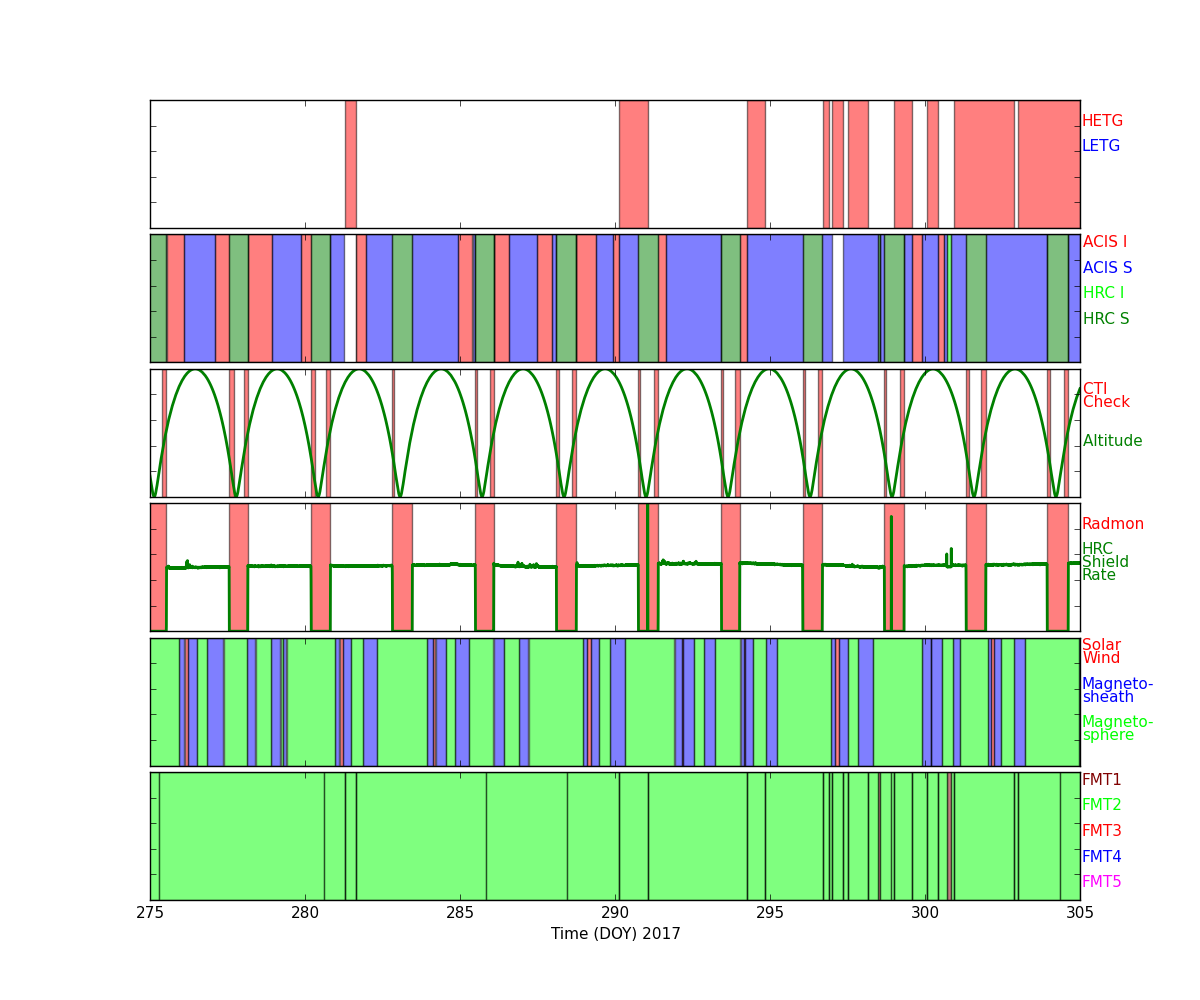
Plotted below are radiation zone timing plots based on the following definitions of radiation zone:
- RADZONE - Ephin levels (in any of the E1300,P4GM,P41GM channels) are more than 1/3 of RADMON safing thresholds.
- RADMON - Radmon is disabled for radiation zone (as commanded based on OFLS model, for comparison with actual radiation levels).
- PERIGEE - Time of closest earth approach (for comparison)
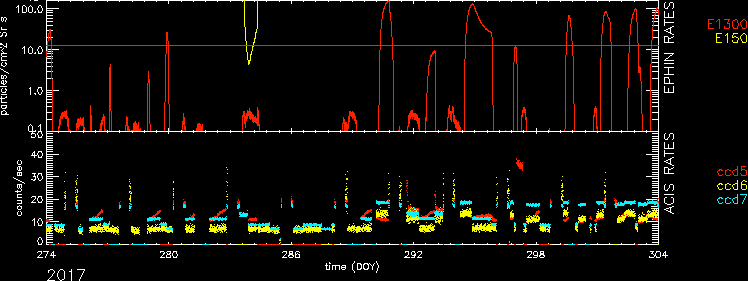
Radiation Count Rates of Oct 2017
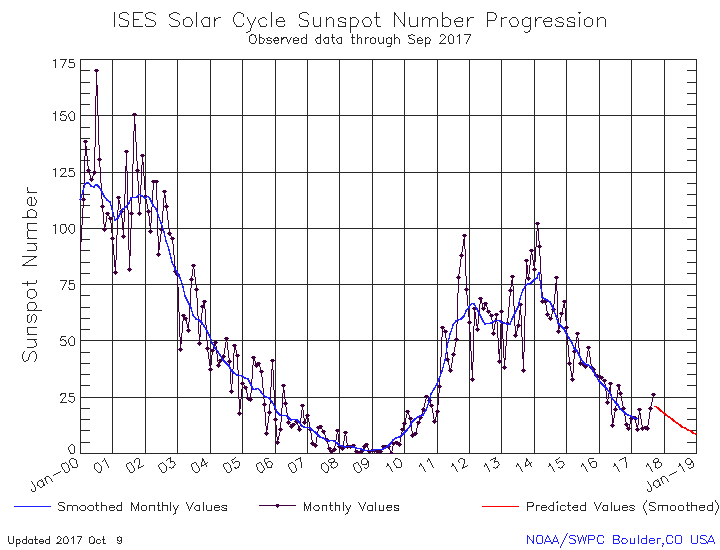
Sun Spot History
SIM
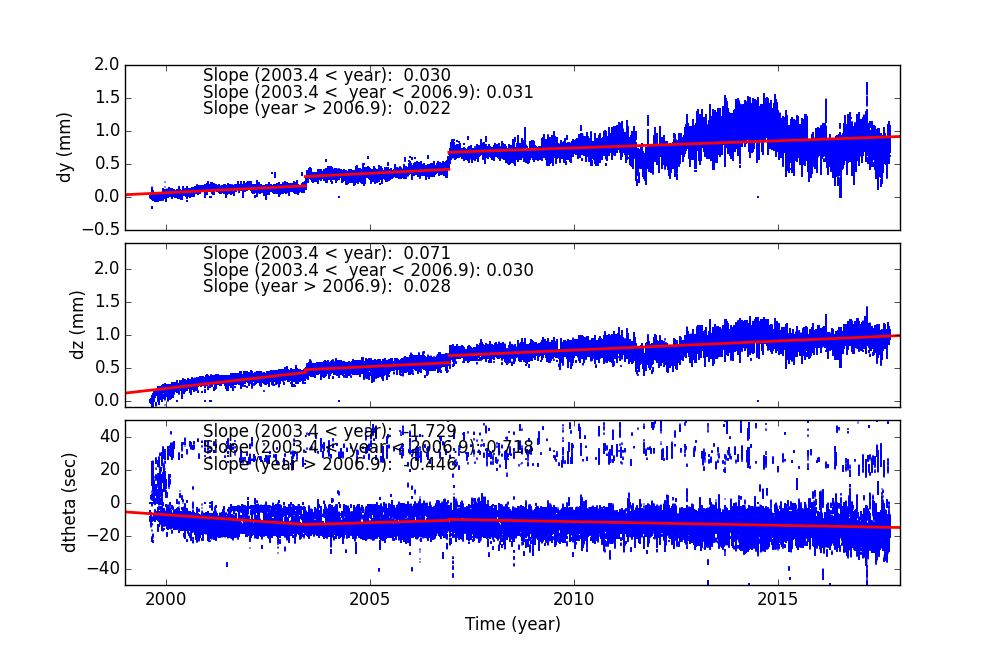
SIM Shift and Twist
SIM Shift and Twist Trend The following plots show trends of SIM shifts (dy and dz) and twist (dtheta). All quantities are directly taken from pcaf*_asol1.fits files. The units are mm for dy and dz, and degree for dtheta. We fit three lines separated before and after (Days of Mission)= 1400 (May 21, 2003), 2700 (Dec 11, 2006), and 4400 (Aug 07, 2011). The unit of slopes are mm per day or degree per day.
The sudden shift around DOM = 1400, 2700 and 4400 are due to fid light drift (see a memo by Aldcroft fiducial light drift). On the dtheta plot, two tracks are clearly observed. The track around 0.01 is due to HRC-I, and all others are clustered around -0.002. For more detail, please see SIM Shift and Twist Trend page
Trending
Quarterly Trends
- EPS Batteries
| Previous Quarter | ||||||
| MSID | MEAN | RMS | DELTA/YR | DELTA/YR/YR | UNITS | DESCRIPTION |
| EB2CI | 0.31 | 9.297e-03 | 8.928e-02 | 5.216e-01 | AMP | BATT 2 CHARGE CURRENT |
| EB2DI | 0.01 | 0.000e+00 | 0.000e+00 | 0.000e+00 | AMP | BATT 2 DISCHARGE CURRENT |
| EB2V | 32.39 | 5.726e-02 | 7.260e-01 | 1.173e+00 | V | BATT 2 VOLTAGE |
| ECNV1V | 14.89 | 2.855e-03 | -3.728e-03 | 4.174e-02 | V | CONV 1 +15V OUTPUT |
| ECNV2V | 14.84 | 1.099e-02 | -8.056e-03 | 1.698e-01 | V | CONV 2 +15V OUTPUT |
| ECNV3V | 15.29 | 3.201e-03 | -1.144e-02 | -6.192e-03 | V | CONV 3 +15V OUTPUT |
)
)
)
)
)
)
- Spacecraft Electronics
| Previous Quarter | ||||||
| MSID | MEAN | RMS | DELTA/YR | DELTA/YR/YR | UNITS | DESCRIPTION |
| ELBI | 55.50 | 1.24 | -9.318e-01 | 7.955e-01 | AMP | LOAD BUS CURRENT |
| ELBV | 28.65 | 0.17 | -2.111e+00 | -4.892e+00 | V | LOAD BUS VOLTAGE |
| OHRMAPWR | 46.11 | 1.77 | 5.916e-01 | -2.063e+02 | W | HRMA COMPUTED TOTAL POWER |
| OOBAPWR | 42.50 | 2.02 | 2.015e-01 | -1.938e+02 | W | OBA COMPUTED TOTAL POWER |
)
)
)
)
- OBA Heater
| Previous Quarter | ||||||
| MSID | MEAN | RMS | DELTA/YR | DELTA/YR/YR | UNITS | DESCRIPTION |
| OOBTHR04 | 294.45 | 1.05 | 5.298e+00 | -2.273e+01 | K | RT 27: HRMA STRUT |
| OOBTHR12 | 291.93 | 1.59 | 7.143e+00 | -6.610e+01 | K | RT 35: OBA CONE |
| OOBTHR26 | 294.85 | 2.73 | 9.472e+00 | -1.336e+02 | K | RT 48: OBA CONE |
| OOBTHR38 | 283.17 | 1.337e-02 | 3.475e-02 | 7.015e-01 | K | RT 60: TFTE CONE |
| OOBTHR44 | 293.99 | 1.61 | 6.914e+00 | -4.602e+01 | K | RT 66: TFTE COVER |
| OOBTHR50 | 288.82 | 1.65 | 7.587e+00 | -6.063e+01 | K | RT 76: S/C STRUT |
)
)
)
)
)
)
Envelope Trending
Spacecraft Motions
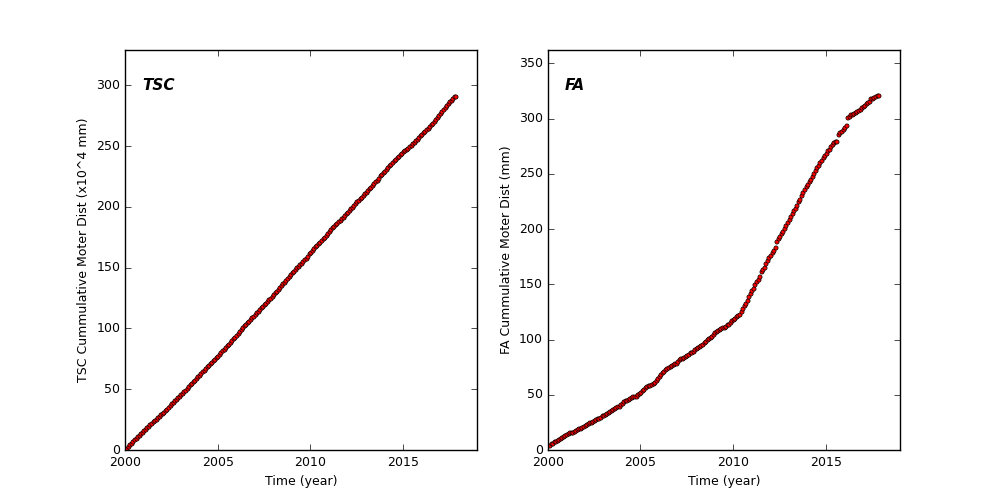
TSC and FA Cummulative Moter Distance
HETG and LETG Cummulative Insertion Counts

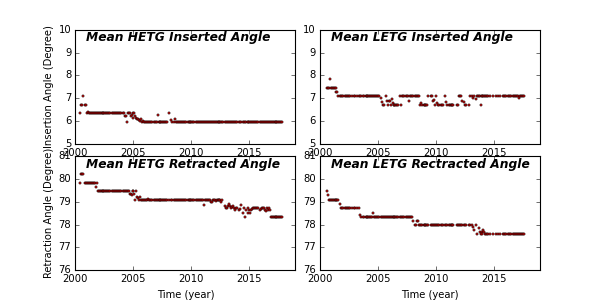
HETG/LETG Insertion/Retraction Angle
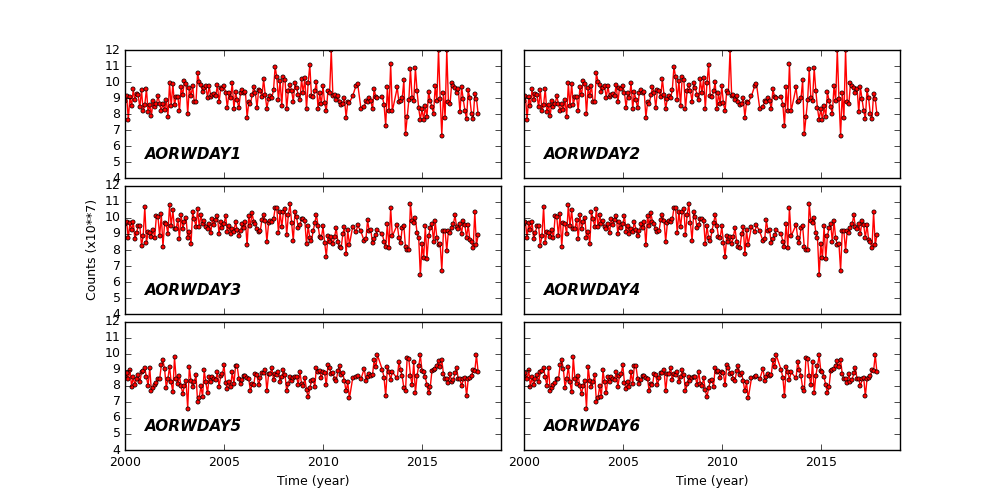
Reaction Wheel Rotations
Links to Past Monthly Reports
| Year | Month | |||||||||||
|---|---|---|---|---|---|---|---|---|---|---|---|---|
| 2017 | Jan | Feb | Mar | Apr | May | Jun | Jul | Aug | Sep | |||
| 2016 | Jan | Feb | Mar | Apr | May | Jun | Jul | Aug | Sep | Oct | Nov | Dec |
| 2015 | Jan | Feb | Mar | Apr | May | Jun | Jul | Aug | Sep | Oct | Nov | Dec |
| 2014 | Jan | Feb | Mar | Apr | May | Jun | Jul | Aug | Sep | Oct | Nov | Dec |
| 2013 | Jan | Feb | Mar | Apr | May | Jun | Jul | Aug | Sep | Oct | Nov | Dec |
| 2012 | Jan | Feb | Mar | Apr | May | Jun | Jul | Aug | Sep | Oct | Nov | Dec |
| 2011 | Jan | Feb | Mar | Apr | May | Jun | Jul | Aug | Sep | Oct | Nov | Dec |
| 2010 | Jan | Feb | Mar | Apr | May | Jun | Jul | Aug | Sep | Oct | Nov | Dec |
| 2009 | Jan | Feb | Mar | Apr | May | Jun | Jul | Aug | Sep | Oct | Nov | Dec |
| 2008 | Jan | Feb | Mar | Apr | May | Jun | Jul | Aug | Sep | Oct | Nov | Dec |
| 2007 | Jan | Feb | Mar | Apr | May | Jun | Jul | Aug | Sep | Oct | Nov | Dec |
| 2006 | Jan | Feb | Mar | Apr | May | Jun | Jul | Aug | Sep | Oct | Nov | Dec |
| 2005 | Jan | Feb | Mar | Apr | May | Jun | Jul | Aug | Sep | Oct | Nov | Dec |
| 2004 | Jan | Feb | Mar | Apr | May | Jun | Jul | Aug | Sep | Oct | Nov | Dec |
| 2003 | Jan | Feb | Mar | Apr | May | Jun | Jul | Aug | Sep | Oct | Nov | Dec |
| 2002 | Jan | Feb | Mar | Apr | May | Jun | Jul | Aug | Sep | Oct | Nov | Dec |
| 2001 | Jan | Feb | Mar | Apr | May | Jun | Jul | Aug | Sep | Oct | Nov | Dec |
| 2000 | Jan | Feb | Mar | Apr | May | Jun | Jul | Aug | Sep | Oct | Nov | Dec |
| 1999 | Jul | Aug | Sep | Oct | Nov | Dec | ||||||