ACIS
ACIS DOSE Registered-Photon-Map
The steps we took to compute the dose map are;
- Level 1 Event files for a specified month are obtained from archive.
- Image data including I2, I3, S2, S3 CCDs are extracted from all event files.
- All the extracted image data were merged to create a month long exposure map for the month.
- The exposure map is opened with ds9, and check a distribution of count rates against energy. From this, estimate the upper threshold value. Any events beyond this upper threshold are assumed erroneous events such as bad pixels.
- Using this upper threshold, the data is filtered, and create a cleaned exposure map for the month.
- The exposure map from each month from the Sep 1999 is added up to create a cumulative exposure map for each month.
- Using fimgstatistic, we compute count rate statistics for each CCDs.
- For observations with high data drop rates (e.g., Crab nebula, Cas A), we corrected the observations by adding events.
Please check more detail plots at Telemetered Photon Dose Trend page.
)
)
)
Statistics:
# IMAGE     NPIX     MEAN        RMS        MIN     MAX
ACIS_nov17 6004901       9.495         34.859           0.0     7149


I2 node 0  262654	7.352981	3.324236	0.0	 54.0
I2 node 1  262654	7.580980	14.627800	0.0	7149.0
I2 node 2  262654	7.394592	3.267046	0.0	 83.0
I2 node 3  262654	7.494541	19.266064	0.0	7048.0

I3 node 0  262654	8.438865	4.582687	0.0	1336.0
I3 node 1  262654	8.257144	18.368639	0.0	6320.0
I3 node 2  262654	7.913933	3.338799	0.0	 86.0
I3 node 3  262654	8.013014	3.496563	0.0	138.0

S2 node 0  262654	11.856867	26.598577	0.0	1107.0
S2 node 1  262654	12.868873	25.189814	0.0	1164.0
S2 node 2  262654	14.633628	50.052591	0.0	2093.0
S2 node 3  262654	15.684564	51.882505	0.0	2195.0

S3 node 0  262654	19.149927	31.339484	0.0	1793.0
S3 node 1  262654	20.577046	53.496692	0.0	3601.0
S3 node 2  262654	20.504553	75.006338	0.0	3378.0
S3 node 3  262654	18.179898	75.994314	0.0	3474.0
)
)
)
Statistics:
 IMAGE     NPIX      MEAN        RMS           MIN      MAX
ACIS_total   6004901       2158.580         2802.229           0.0   121753


I2 node 0  262654	1852.255630	363.172633	383.0	10342.0
I2 node 1  262654	1949.946130	504.692819	404.0	70300.0
I2 node 2  262654	7.394592	3.267046	0.0	 83.0
I2 node 3  262654	1987.249449	512.284259	390.0	28420.0

I3 node 0  262654	2101.341907	519.507057	384.0	8225.0
I3 node 1  262654	2184.182562	1635.298227	395.0	51371.0
I3 node 2  262654	1917.366632	352.753222	374.0	10662.0
I3 node 3  262654	8.013014	3.496563	0.0	138.0

S2 node 0  262654	2511.385432	390.443548	1441.0	21644.0
S2 node 1  262654	12.868873	25.189814	0.0	1164.0
S2 node 2  262654	2954.326850	608.540332	2029.0	27574.0
S2 node 3  262654	2900.683802	461.709348	1776.0	51700.0

S3 node 0  262654	4477.908866	2028.254479	1963.0	25198.0
S3 node 1  262654	5672.097973	2203.945133	0.0	28199.0
S3 node 2  262654	4446.239752	1204.800209	1845.0	24657.0
S3 node 3  262654	3425.703416	640.615802	2108.0	24335.0
)
|
)
|
)
|
)
|
| Aug 2017 | May 2017 | Feb 2017 | Nov 2016 |
|---|
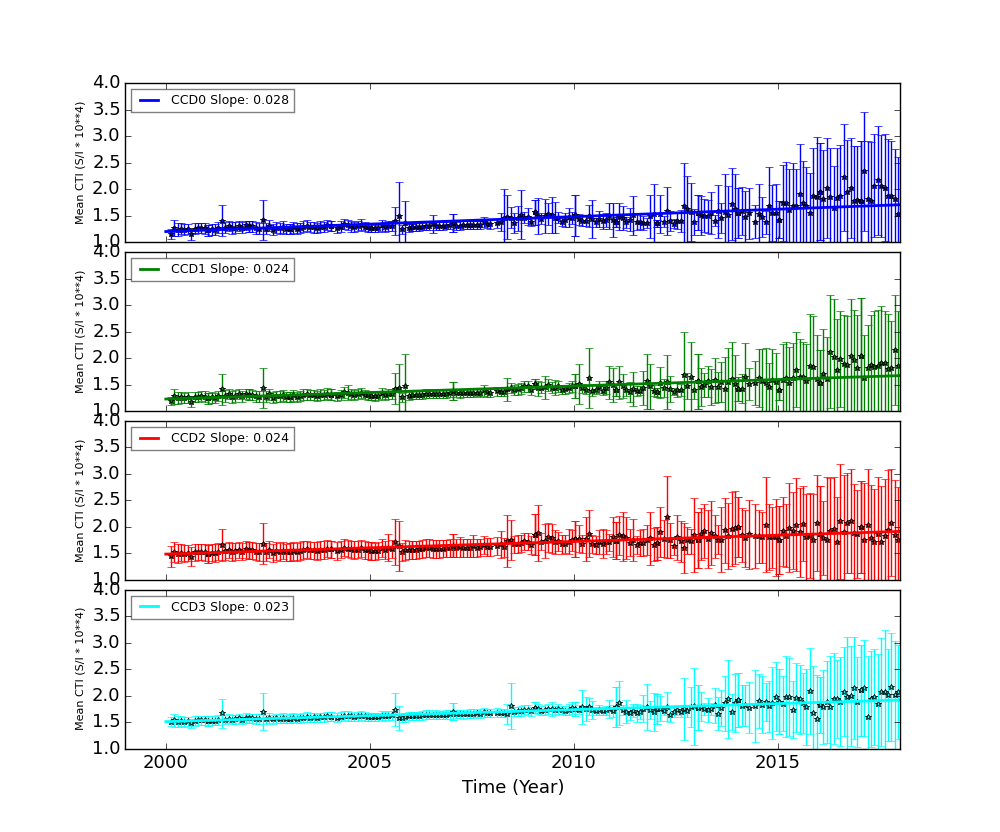
The Mean Detrended CTI
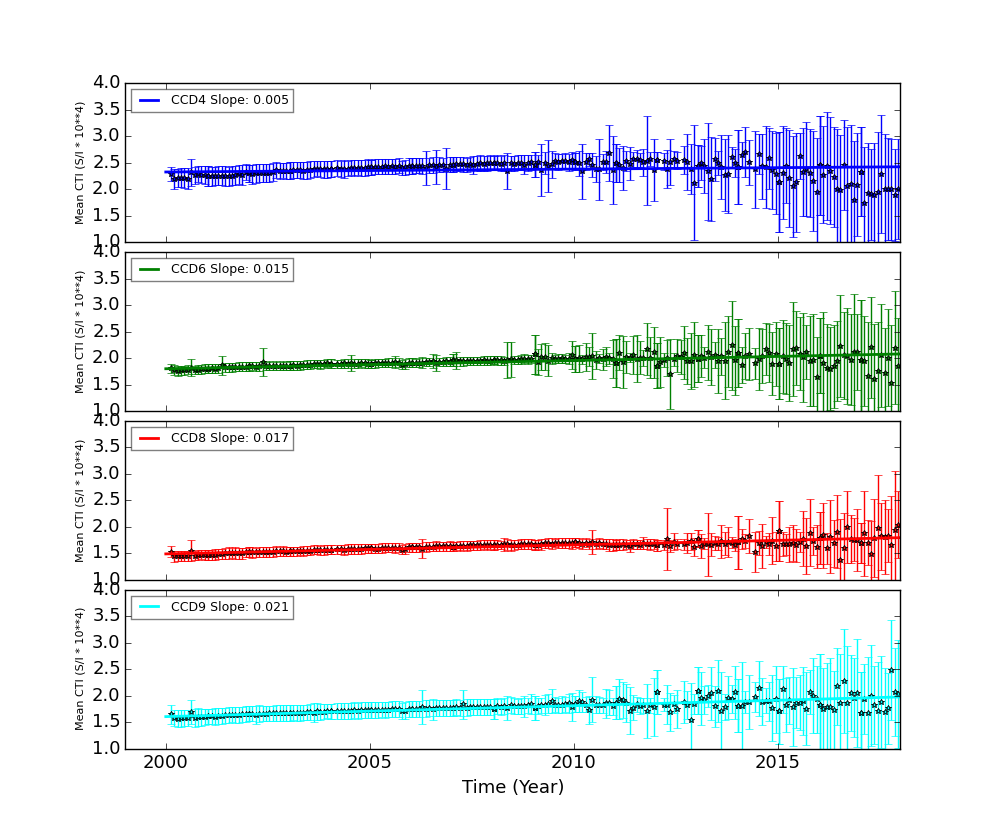
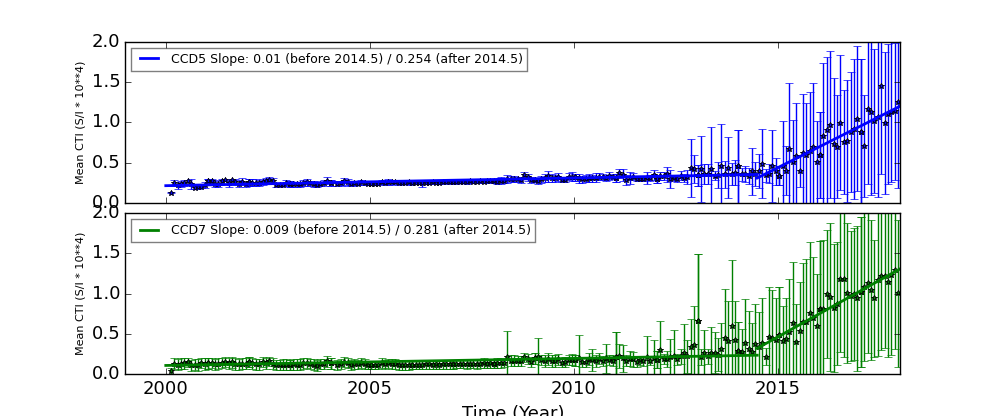
We report CTIs with a refined data definition. CTIs were computed for the temperature dependency corrected data. Please see CTI page for detailed explanation. CTI's are computed for Mn K alpha, and defined as slope/intercept x10^4 of row # vs ADU. Data file: here
Imaging CCDs
Spectral CCDs
Backside CCDs
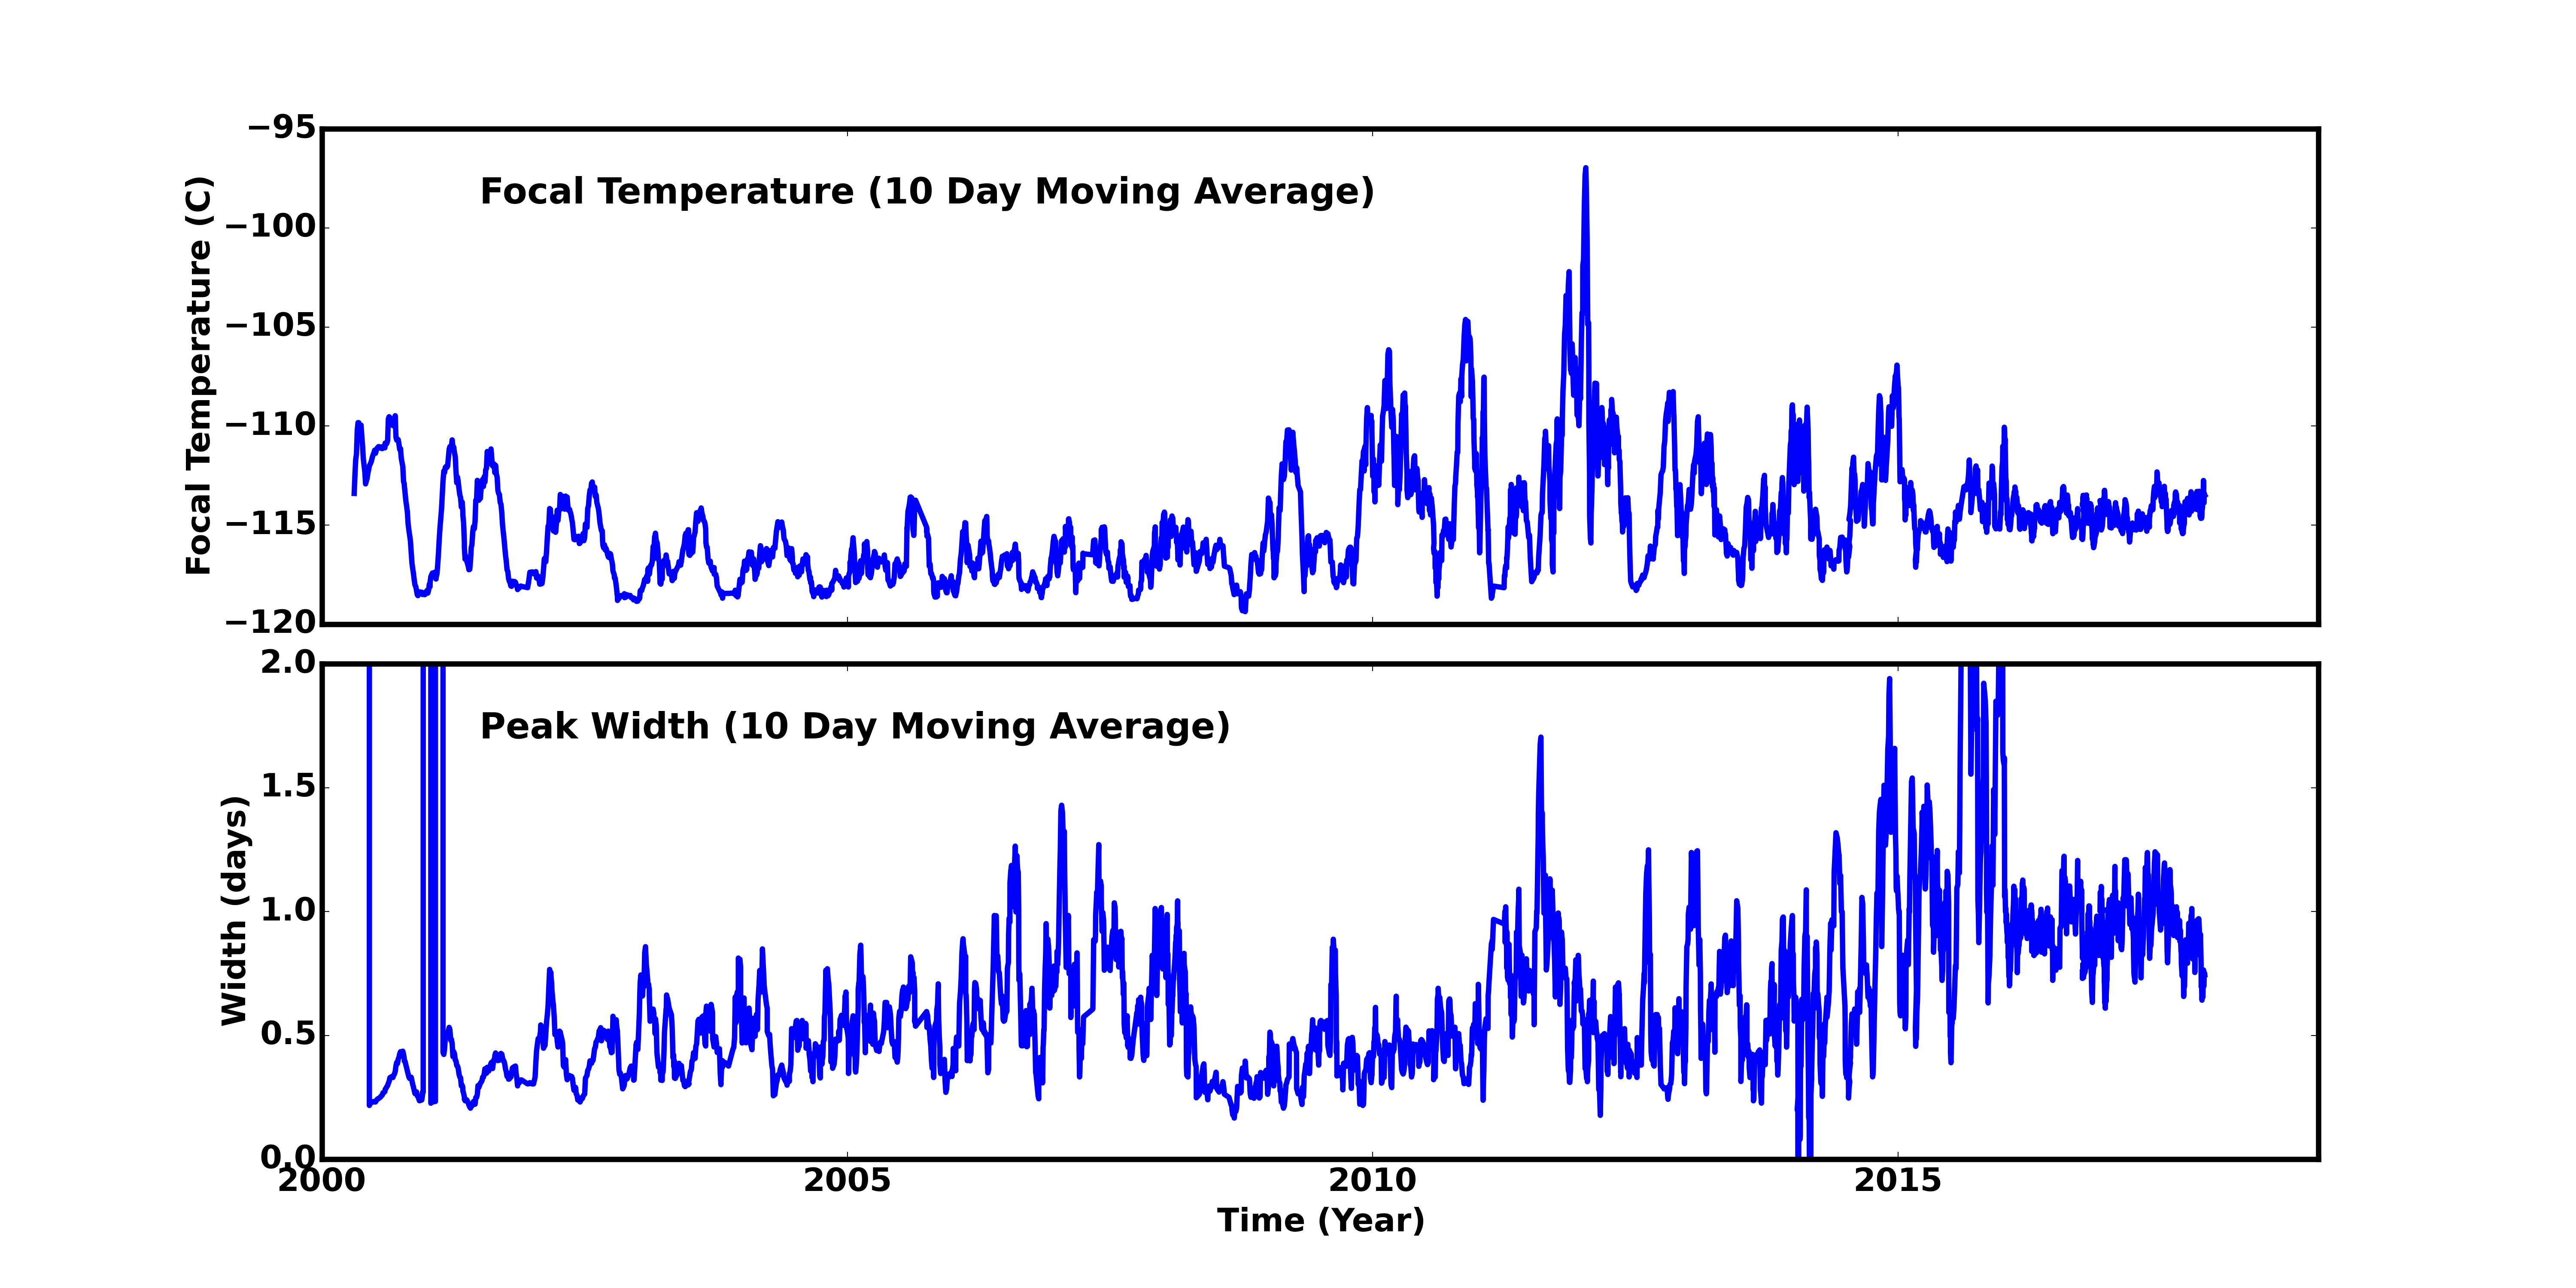
Focal Plane Temperature
Nov 2017 Focal Temperature
| The Mean (max) FPT: | |
|---|---|
| -113.85 | +/- 2.69 C |
| Mean Width: | |
| 0.79 | +/- 0.28 days |
Averaged Focal Plane Temperature
We are using 10 period moving averages to show trends of peak temperatures and peak widths. Note, the gaps in the width plot are due to missing/corrupted data.
Focal Plane Temperature, Sun Angle and Altitude
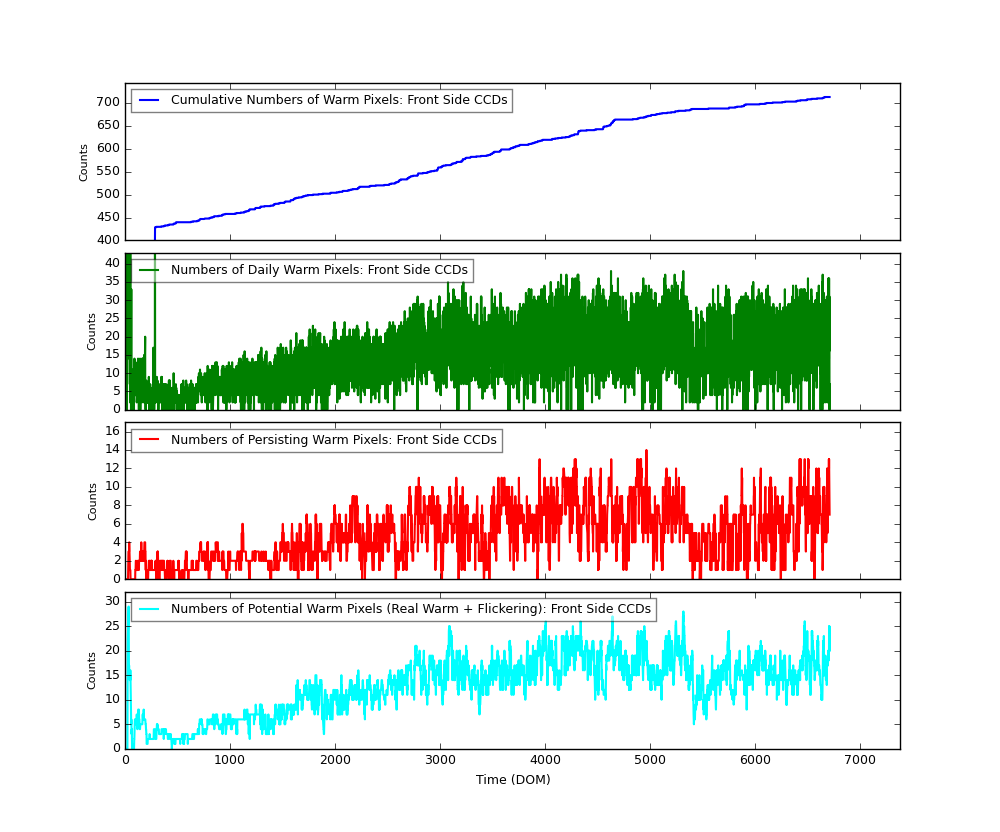
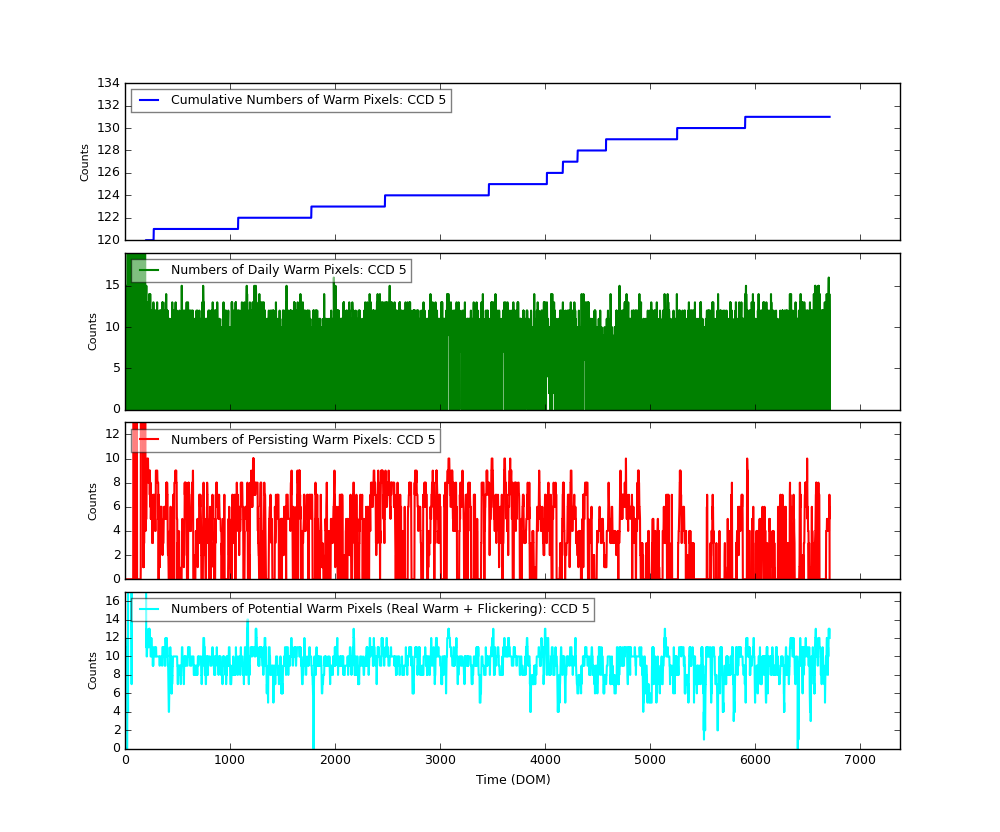
Bad Pixels
The plots below were generated with a new warm pixel finding script. Please see Acis Bad Pixel Page for details.
Front Side CCDs
Back Side CCD (CCD5)
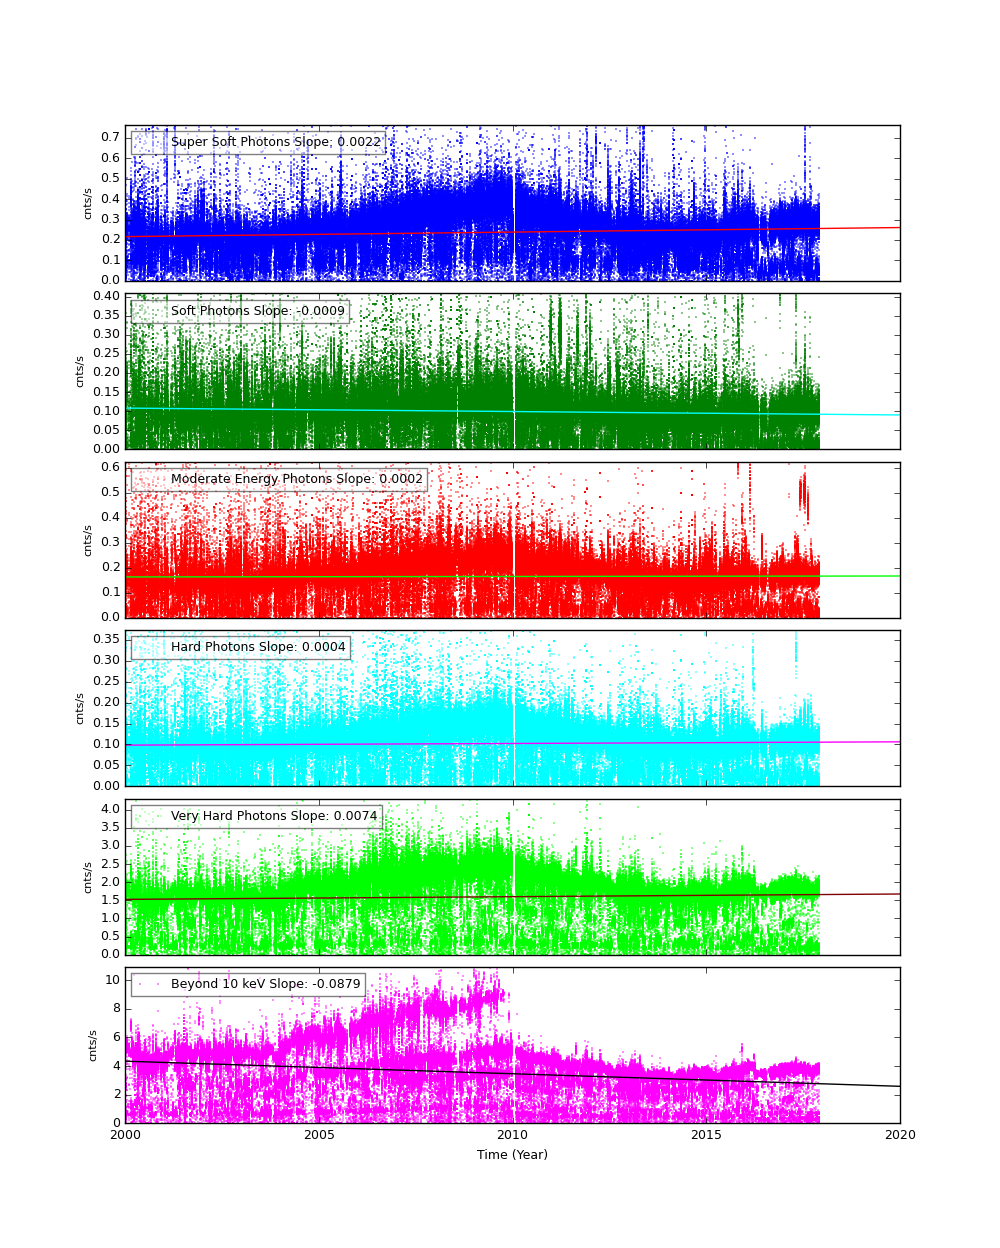
Science Instrument Background Rates
| Name | Low (keV) | High(KeV) | Description |
|---|---|---|---|
| SSoft | 0.00 | 0.50 | Super soft photons |
| Soft | 0.50 | 1.00 | Soft photons |
| Med | 1.00 | 3.00 | Moderate energy photons |
| Hard | 3.00 | 5.00 | Hard Photons |
| Harder | 5.00 | 10.00 | Very Hard photons |
| Hardest | 10.00 | Beyond 10 keV |
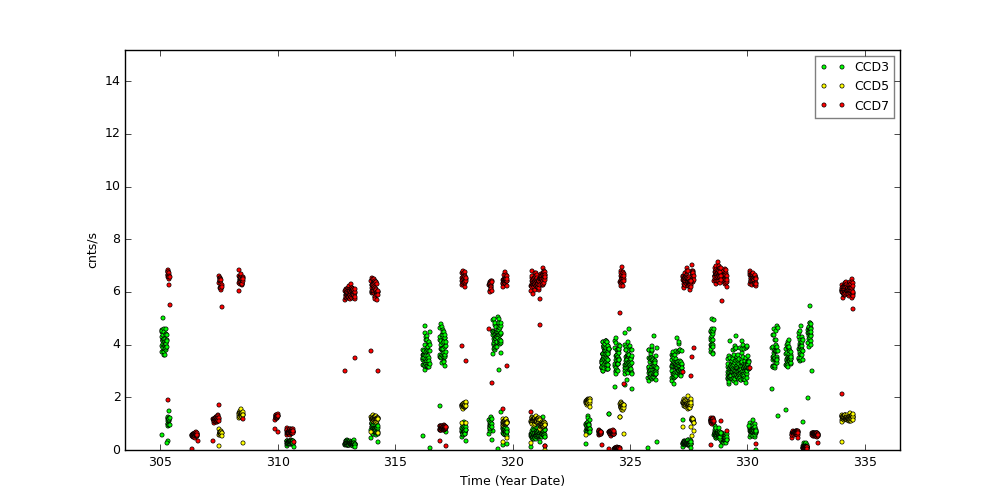
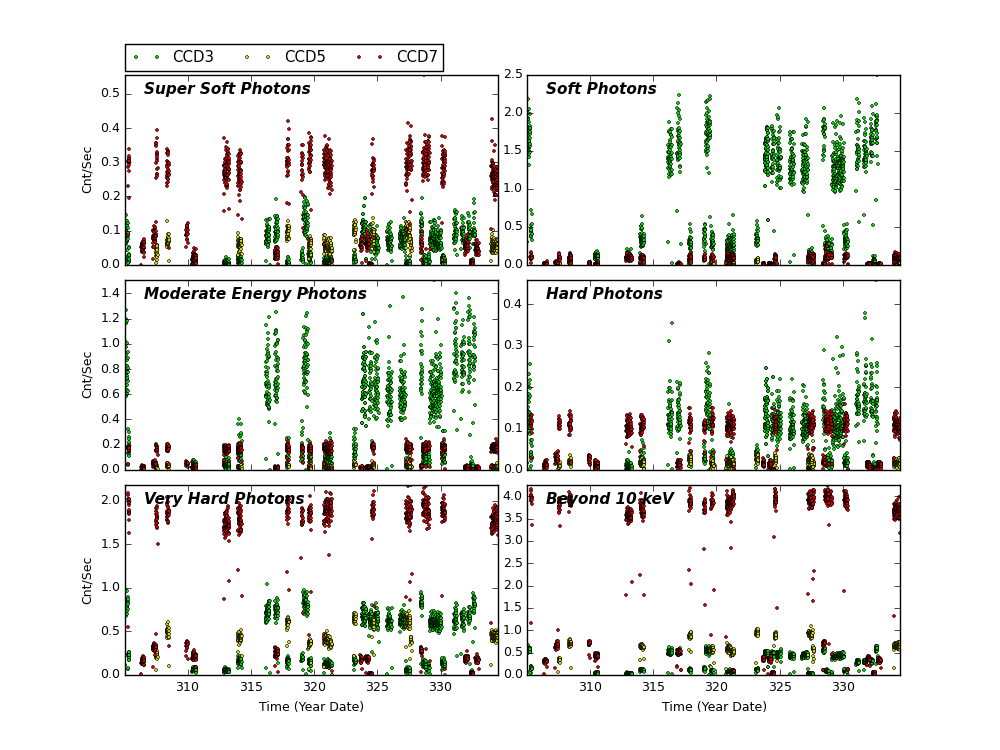
The following three plots show trends of SIB from year 2000. CCDs shown here are CCD3, CCD5, and CCD7. Fitted lines are linear fit after eliminating extreme outliers. For >10 keV plots, 2 lines are fit. One is with a 13 keV filter, and another without.
CCD 3
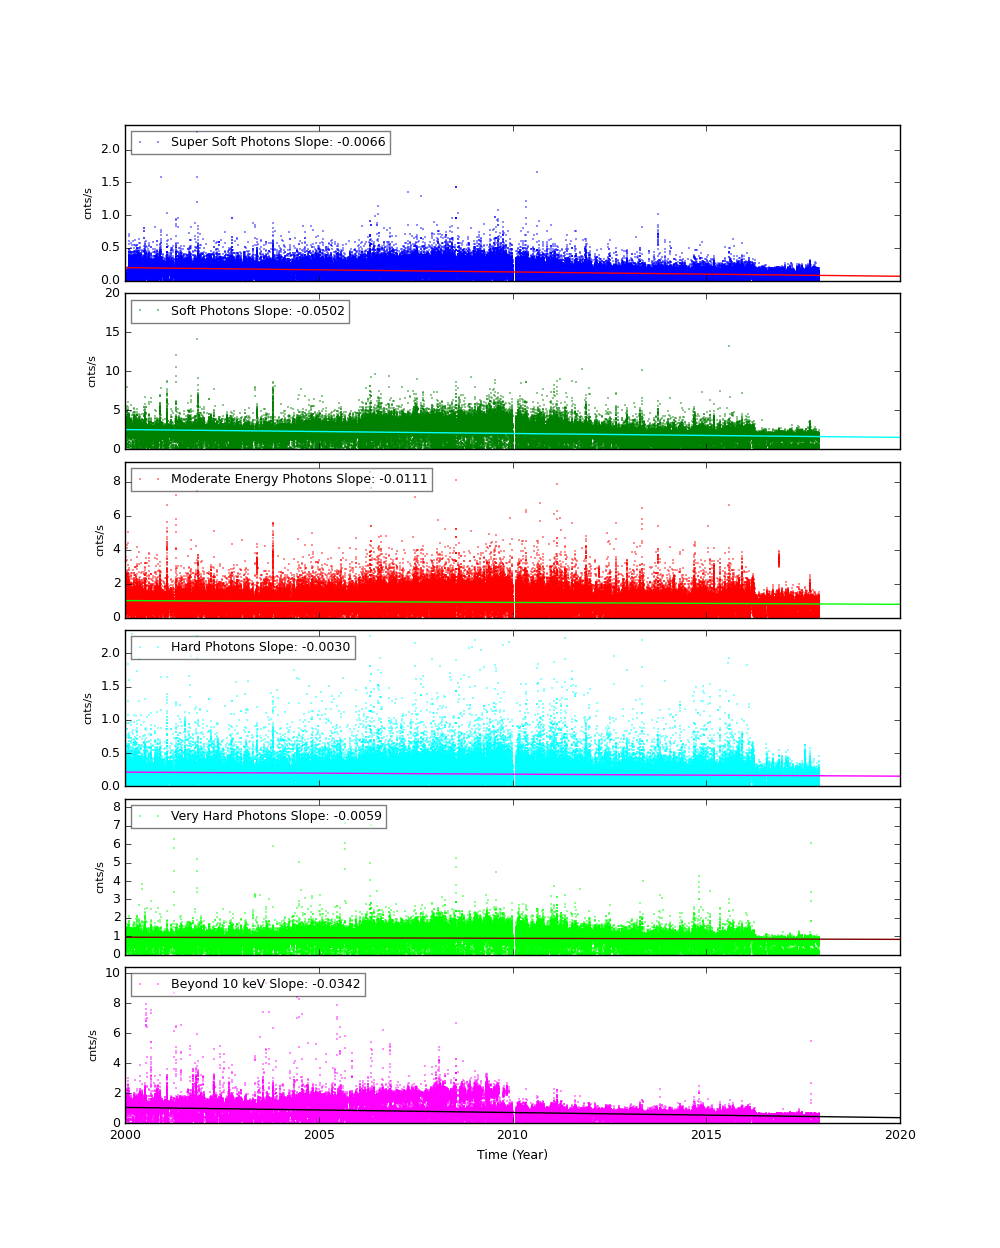
CCD 5
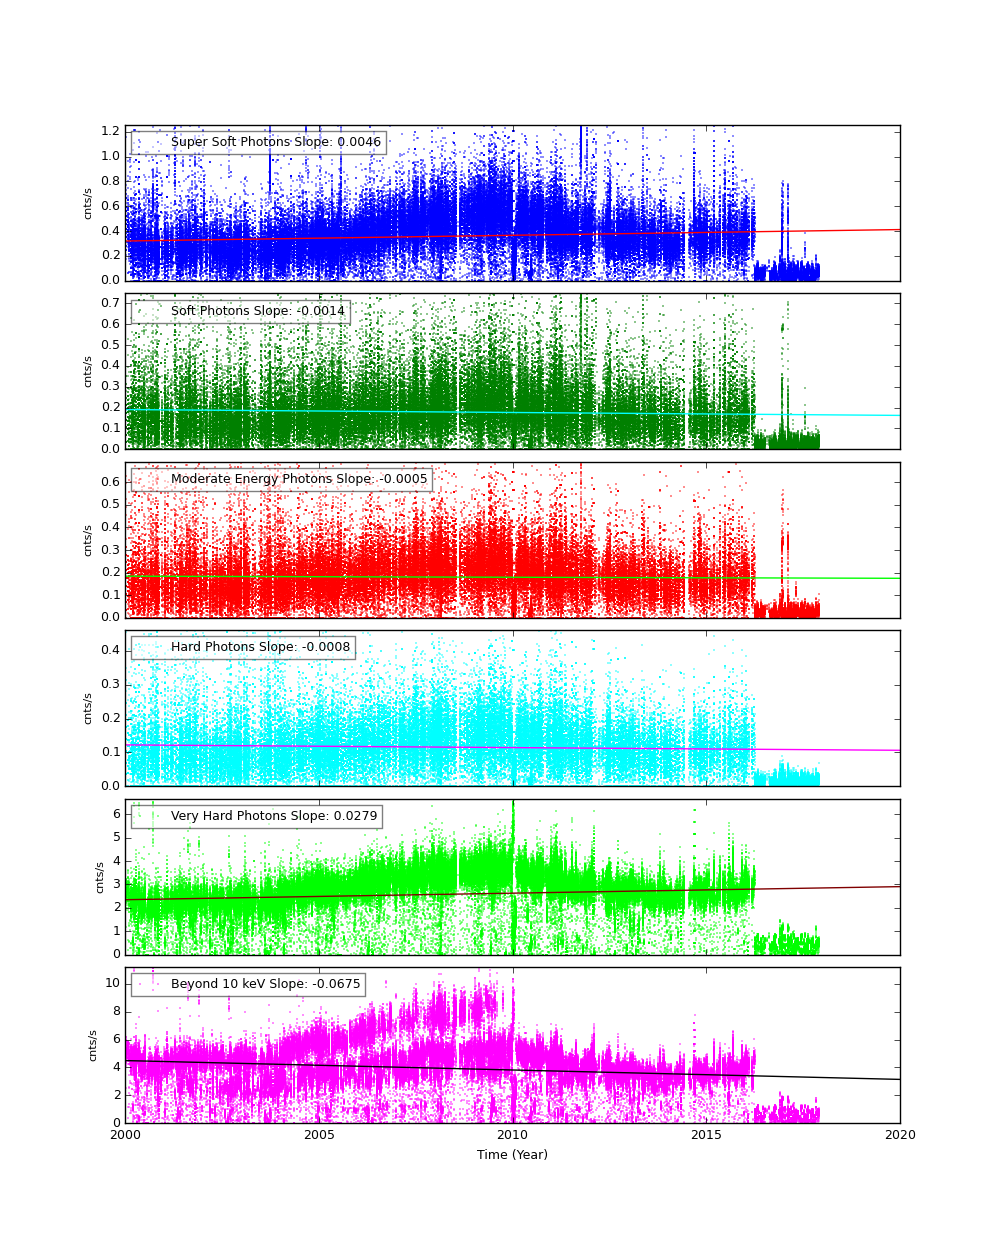
CCD 7
ACIS Histogram Mode Trends
We collected data from acis histogram mode data, and created trend plots of peak portions and peak widths against time (DOM). The peaks were estimated by fitting a simple Gaussian on three peaks (Al, Ti, and Mn), and the widths were estimated by a width at the half max from the peak.
All histogram data are taken under TIMED and GRADED_HIST mode, SIM position is at an external calibration source position, the focal temperature is around -119.7 C, and parameter settings in aciselec, acistemp are set to about same for all.
CCD 3, Peak Position
CCD 3, Peak Widths
CCD 3, Count Rates
HRC
DOSE of Central 4K Pore-Pairs
Please refer to Maximum Dose Trends for more details.
)
|
|---|
IMAGE                NPIX      MEAN    STDDEV      MIN       MAX
HRCI_11_2017.fits  16777216	0.036 	0.192 	0.000 	8.000
)
IMAGE                       NPIX      MEAN    STDDEV      MIN       MAX
HRCI_08_1999_11_2017.fits  16777216	5.083 	5.280 	0.000 	293.000
)
|
|---|
IMAGE                NPIX      MEAN    STDDEV      MIN       MAX
HRCS_11_2017.fits  16777216	0.019 	0.203 	0.000 	25.000
)
IMAGE                       NPIX      MEAN    STDDEV      MIN       MAX
HRCS_08_1999_11_2017.fits  16777216	16.679 	29.853 	0.000 	1715.000
|
|
Max dose trend plots corrected for events that "pile-up"
in the center of the taps due to bad position information.
|
)
|
)
|
)
|
)
|
| Aug 2017 | May 2017 | Feb 2017 | Nov 2016 |
|---|
)
|
)
|
)
|
)
|
| Aug 2017 | May 2017 | Feb 2017 | Nov 2016 |
|---|
Gratings
Focus
We plot the width of the zero order streak of ACIS/HETG observations and the width of the zero order image for HRC/LETG observations of point sources. No significant defocusing trend is seen at this time. See Gratings Focus pages.
PCAD
ACA Trending
Gyro Bias Drift
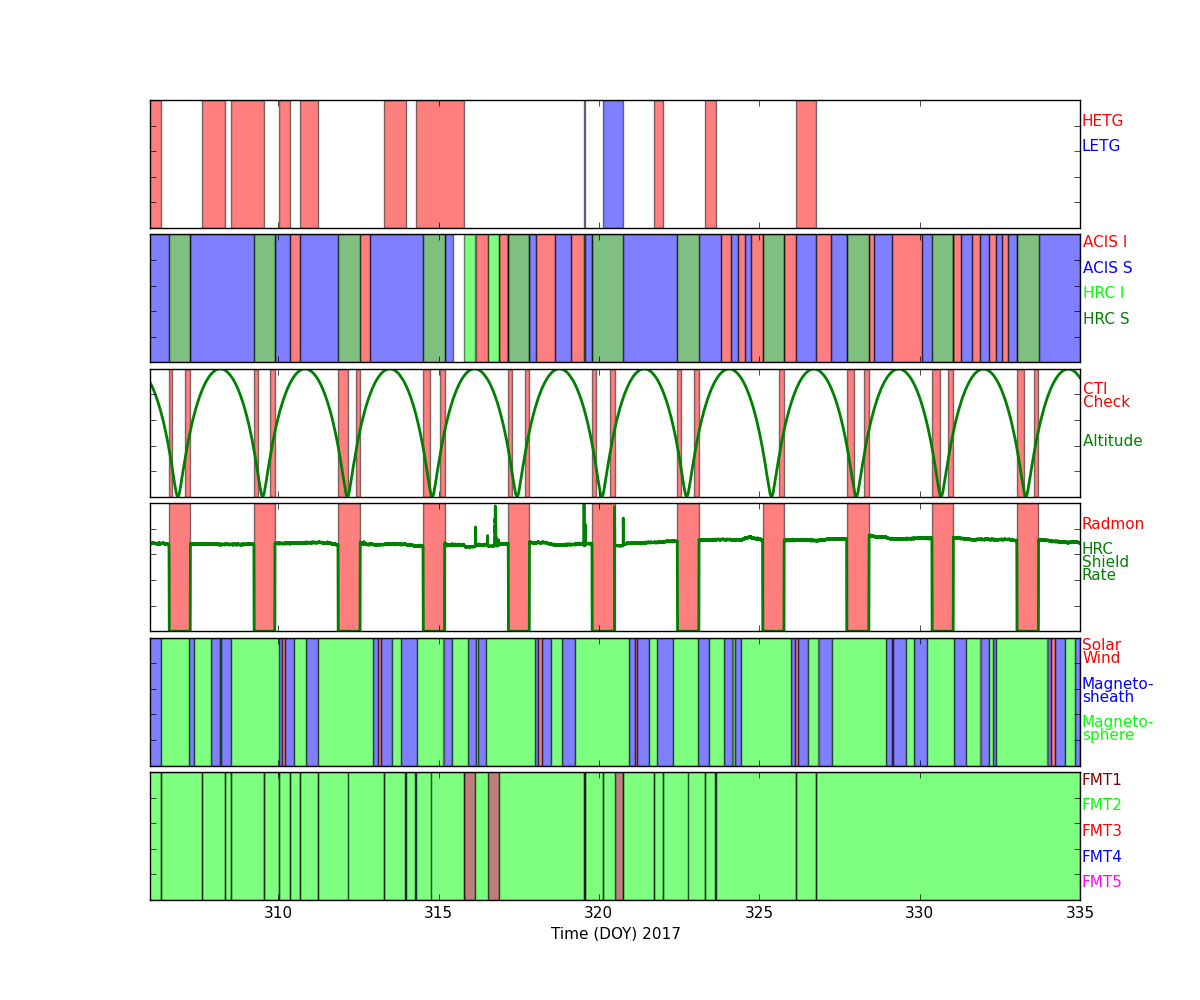
Radiation History
Radiation Zone Timing
Plotted below are radiation zone timing plots based on the following definitions of radiation zone:
- RADZONE - Ephin levels (in any of the E1300,P4GM,P41GM channels) are more than 1/3 of RADMON safing thresholds.
- RADMON - Radmon is disabled for radiation zone (as commanded based on OFLS model, for comparison with actual radiation levels).
- PERIGEE - Time of closest earth approach (for comparison)
Radiation Count Rates of Nov 2017
Sun Spot History
Trending
Quarterly Trends
- HRMA Heater
| Previous Quarter | ||||||
| MSID | MEAN | RMS | DELTA/YR | DELTA/YR/YR | UNITS | DESCRIPTION |
| OHRTHR03 | 295.24 | 1.102e-03 | 3.355e-03 | 3.940e-02 | K | RT 5: HRMA FORWARD APERTURE PLATE |
| OHRTHR09 | 294.72 | 0.10 | 4.532e-01 | 2.484e+00 | K | RT 105: HRMA CAP |
| OHRTHR17 | 294.59 | 0.11 | 4.758e-01 | 2.453e+00 | K | RT 125: HSA OUTER CYNLINDER |
| OHRTHR24 | 294.90 | 0.19 | 6.087e-01 | 2.654e-02 | K | RT 12: HRMA AFT HEATER PLATE |
| OHRTHR38 | 296.29 | 0.97 | 2.110e+00 | 6.203e+00 | K | RT 120: HRMA AFT COLLIMATOR OUTER CYLINDER |
| OHRTHR52 | 294.58 | 0.11 | 4.756e-01 | 2.688e+00 | K | RT 100: HRMA CAP |
)
)
)
)
)
)
- HRMA Thermal
| Previous Quarter | ||||||
| MSID | MEAN | RMS | DELTA/YR | DELTA/YR/YR | UNITS | DESCRIPTION |
| 4RT568T | 295.29 | 1.16 | 8.337e+00 | -2.964e+01 | K | RT 568 - HRMA TEMP |
| 4RT569T | 294.87 | 0.24 | 1.950e+00 | 1.445e+01 | K | RT 569 - HRMA TEMP |
| 4RT570T | 294.70 | 0.14 | 1.099e+00 | 3.044e+00 | K | RT 570 - HRMA TEMP |
| 4RT575T | 299.18 | 1.62 | 1.107e+01 | -7.105e+01 | K | RT 575 - OB CONE TEMP |
| 4RT576T | 291.28 | 1.21 | 8.541e+00 | -6.291e+01 | K | RT 576 - OB CONE TEMP |
| 4RT578T | 297.71 | 2.20 | 1.096e+01 | -5.077e+01 | K | RT 578 - OB CONE TEMP |
)
)
)
)
)
)
- MUPS
| Previous Quarter | ||||||
| MSID | MEAN | RMS | DELTA/YR | DELTA/YR/YR | UNITS | DESCRIPTION |
| PM1THV1T | 331.85 | 8.13 | 7.987e+00 | -7.932e+02 | K | MUPS 1 THRUSTER VALVE 01 TEMP |
| PLINE02T | 320.68 | 9.61 | -1.517e+00 | 5.416e+02 | K | PROP LINE TEMP 02 |
| PLINE03T | 318.18 | 11.95 | 4.329e-01 | 6.675e+02 | K | PROP LINE TEMP 03 |
| PLINE04T | 304.38 | 11.62 | 8.152e+00 | 6.499e+02 | K | PROP LINE TEMP 04 |
)
)
)
)
Envelope Trending
Spacecraft Motions
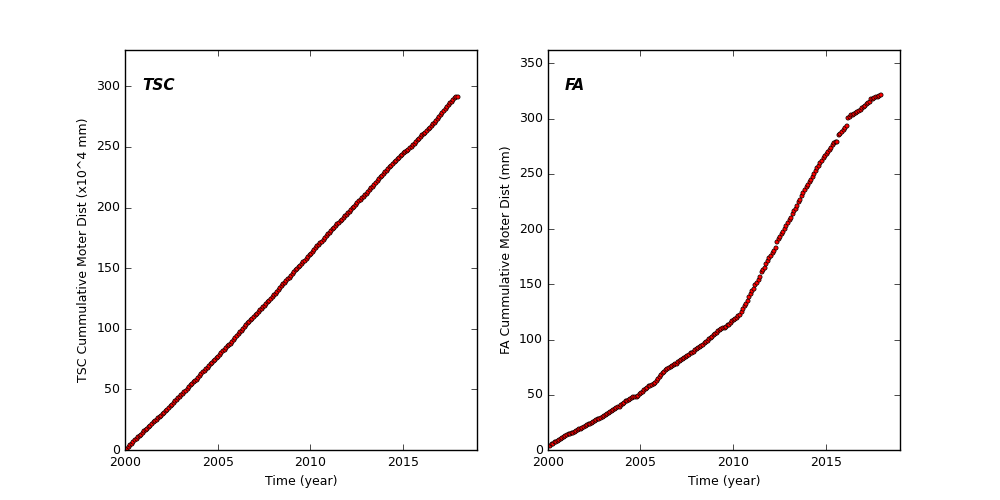
TSC and FA Cummulative Moter Distance
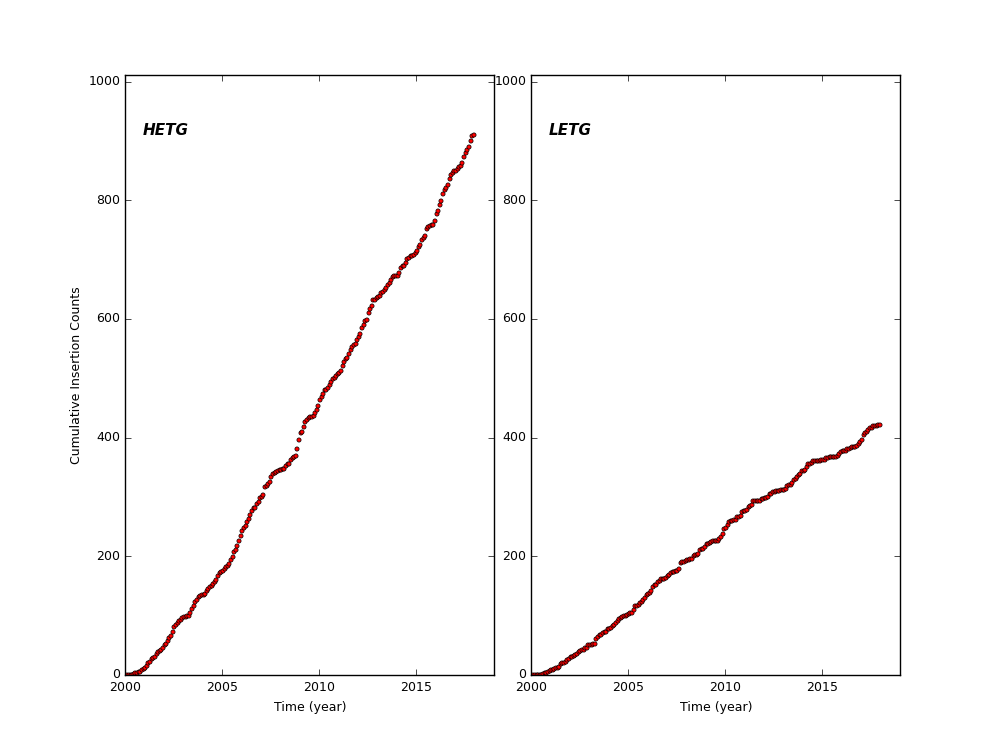
HETG and LETG Cummulative Insertion Counts
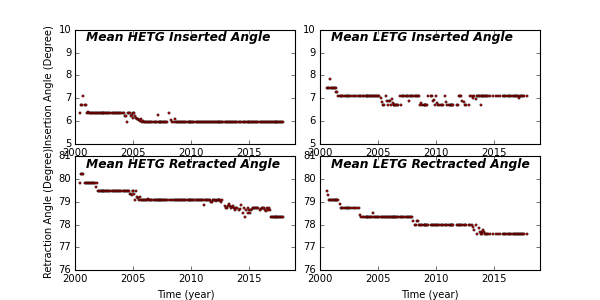
HETG/LETG Insertion/Retraction Angle
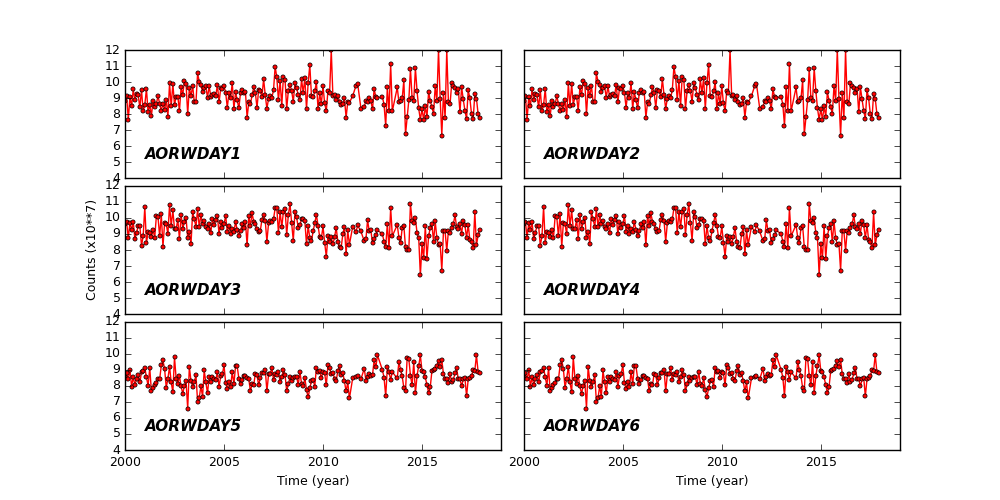
Reaction Wheel Rotations
Links to Past Monthly Reports
| Year | Month | |||||||||||
|---|---|---|---|---|---|---|---|---|---|---|---|---|
| 2017 | Jan | Feb | Mar | Apr | May | Jun | Jul | Aug | Sep | Oct | ||
| 2016 | Jan | Feb | Mar | Apr | May | Jun | Jul | Aug | Sep | Oct | Nov | Dec |
| 2015 | Jan | Feb | Mar | Apr | May | Jun | Jul | Aug | Sep | Oct | Nov | Dec |
| 2014 | Jan | Feb | Mar | Apr | May | Jun | Jul | Aug | Sep | Oct | Nov | Dec |
| 2013 | Jan | Feb | Mar | Apr | May | Jun | Jul | Aug | Sep | Oct | Nov | Dec |
| 2012 | Jan | Feb | Mar | Apr | May | Jun | Jul | Aug | Sep | Oct | Nov | Dec |
| 2011 | Jan | Feb | Mar | Apr | May | Jun | Jul | Aug | Sep | Oct | Nov | Dec |
| 2010 | Jan | Feb | Mar | Apr | May | Jun | Jul | Aug | Sep | Oct | Nov | Dec |
| 2009 | Jan | Feb | Mar | Apr | May | Jun | Jul | Aug | Sep | Oct | Nov | Dec |
| 2008 | Jan | Feb | Mar | Apr | May | Jun | Jul | Aug | Sep | Oct | Nov | Dec |
| 2007 | Jan | Feb | Mar | Apr | May | Jun | Jul | Aug | Sep | Oct | Nov | Dec |
| 2006 | Jan | Feb | Mar | Apr | May | Jun | Jul | Aug | Sep | Oct | Nov | Dec |
| 2005 | Jan | Feb | Mar | Apr | May | Jun | Jul | Aug | Sep | Oct | Nov | Dec |
| 2004 | Jan | Feb | Mar | Apr | May | Jun | Jul | Aug | Sep | Oct | Nov | Dec |
| 2003 | Jan | Feb | Mar | Apr | May | Jun | Jul | Aug | Sep | Oct | Nov | Dec |
| 2002 | Jan | Feb | Mar | Apr | May | Jun | Jul | Aug | Sep | Oct | Nov | Dec |
| 2001 | Jan | Feb | Mar | Apr | May | Jun | Jul | Aug | Sep | Oct | Nov | Dec |
| 2000 | Jan | Feb | Mar | Apr | May | Jun | Jul | Aug | Sep | Oct | Nov | Dec |
| 1999 | Jul | Aug | Sep | Oct | Nov | Dec | ||||||