ACIS
ACIS DOSE Registered-Photon-Map
The steps we took to compute the dose map are;
- Level 1 Event files for a specified month are obtained from archive.
- Image data including I2, I3, S2, S3 CCDs are extracted from all event files.
- All the extracted image data were merged to create a month long exposure map for the month.
- The exposure map is opened with ds9, and check a distribution of count rates against energy. From this, estimate the upper threshold value. Any events beyond this upper threshold are assumed erroneous events such as bad pixels.
- Using this upper threshold, the data is filtered, and create a cleaned exposure map for the month.
- The exposure map from each month from the Sep 1999 is added up to create a cumulative exposure map for each month.
- Using fimgstatistic, we compute count rate statistics for each CCDs.
- For observations with high data drop rates (e.g., Crab nebula, Cas A), we corrected the observations by adding events.
Please check more detail plots at Telemetered Photon Dose Trend page.
)
)
)
Statistics:
# IMAGE     NPIX     MEAN        RMS        MIN     MAX
ACIS_dec17 6004901       7.151         11.952           0.0     8948


I2 node 0  262654	6.659514	3.152264	0.0	 49.0
I2 node 1  262654	6.861950	7.665906	0.0	2512.0
I2 node 2  262654	6.759353	3.105670	0.0	 68.0
I2 node 3  262654	6.798799	10.583625	0.0	3151.0

I3 node 0  262654	7.297588	3.691198	0.0	767.0
I3 node 1  262654	7.012651	6.501936	0.0	2509.0
I3 node 2  262654	6.751980	3.062460	0.0	 71.0
I3 node 3  262654	6.828794	16.993340	0.0	6294.0

S2 node 0  262654	9.190265	17.884260	0.0	8526.0
S2 node 1  262654	9.585777	4.221449	0.0	 64.0
S2 node 2  262654	9.911550	8.984244	0.0	2786.0
S2 node 3  262654	9.849730	5.174752	0.0	1585.0

S3 node 0  262654	13.590920	11.919432	0.0	372.0
S3 node 1  262654	14.522852	5.428440	0.0	129.0
S3 node 2  262654	13.623231	4.409634	0.0	 84.0
S3 node 3  262654	12.521631	4.211653	0.0	 46.0
)
)
)
Statistics:
 IMAGE     NPIX      MEAN        RMS           MIN      MAX
ACIS_total   6004901       2165.732         2810.672           0.0   122164


I2 node 0  262654	1858.915144	364.593787	386.0	10391.0
I2 node 1  262654	1956.808079	506.626982	407.0	70953.0
I2 node 2  262654	6.759353	3.105670	0.0	 68.0
I2 node 3  262654	1994.048248	514.004458	391.0	28432.0

I3 node 0  262654	2108.639495	521.152322	385.0	8252.0
I3 node 1  262654	2191.195213	1637.208593	400.0	51391.0
I3 node 2  262654	1924.118613	354.006669	377.0	10700.0
I3 node 3  262654	6.828794	16.993340	0.0	6294.0

S2 node 0  262654	2520.575697	392.376026	1445.0	21660.0
S2 node 1  262654	9.585777	4.221449	0.0	 64.0
S2 node 2  262654	2964.238400	609.792223	2034.0	27583.0
S2 node 3  262654	2910.533533	462.233340	1782.0	52005.0

S3 node 0  262654	4491.499786	2032.367122	1971.0	25320.0
S3 node 1  262654	5686.620826	2205.313995	0.0	28252.0
S3 node 2  262654	4459.862982	1205.456997	1852.0	24678.0
S3 node 3  262654	3438.225047	640.758630	2114.0	24343.0
)
|
)
|
)
|
)
|
| Sep 2017 | Jun 2017 | Mar 2017 | Dec 2016 |
|---|
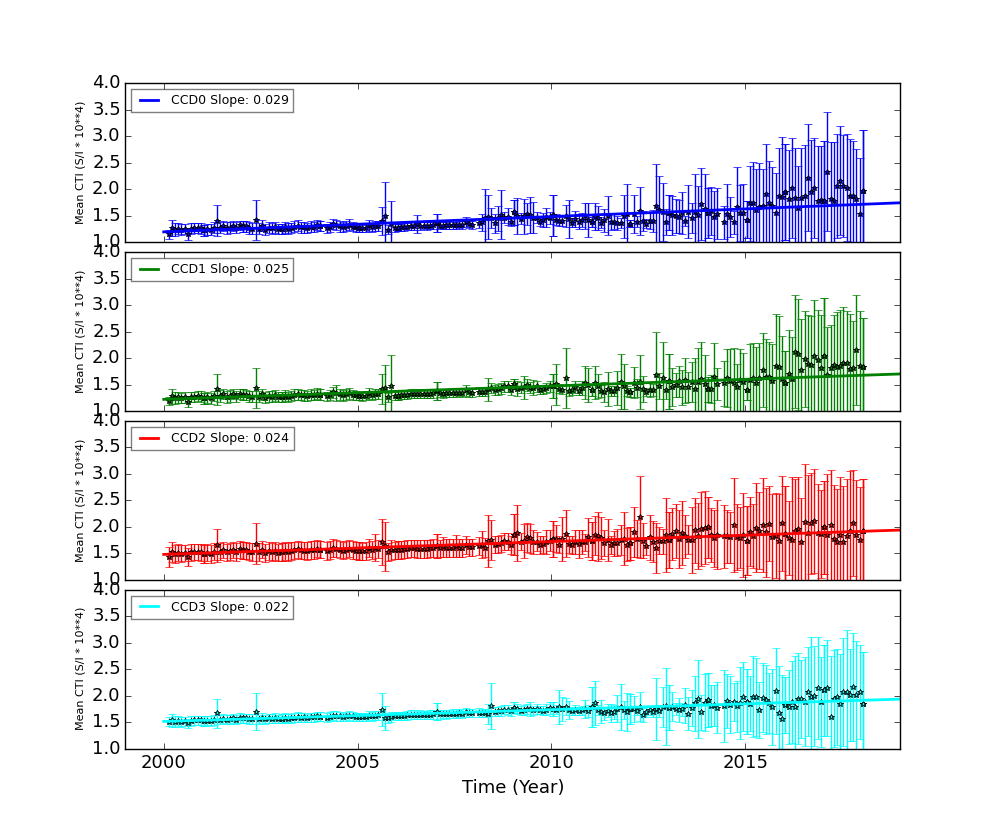
The Mean Detrended CTI
We report CTIs with a refined data definition. CTIs were computed for the temperature dependency corrected data. Please see CTI page for detailed explanation. CTI's are computed for Mn K alpha, and defined as slope/intercept x10^4 of row # vs ADU. Data file: here
Imaging CCDs
Spectral CCDs
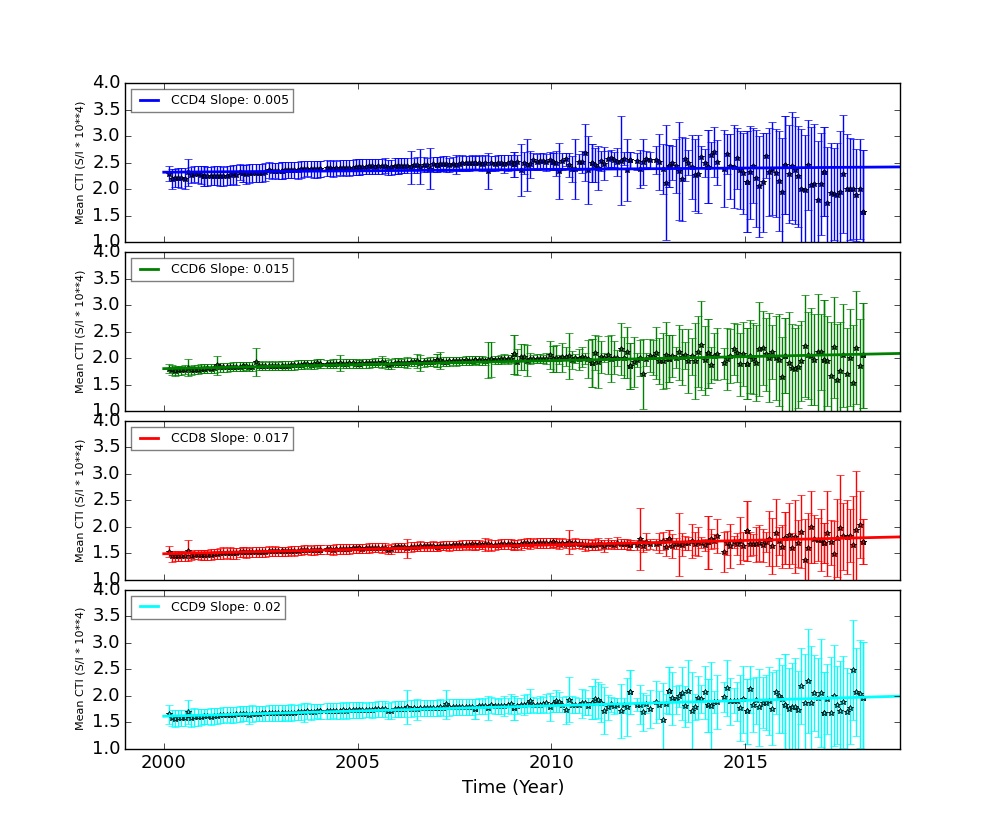
Backside CCDs

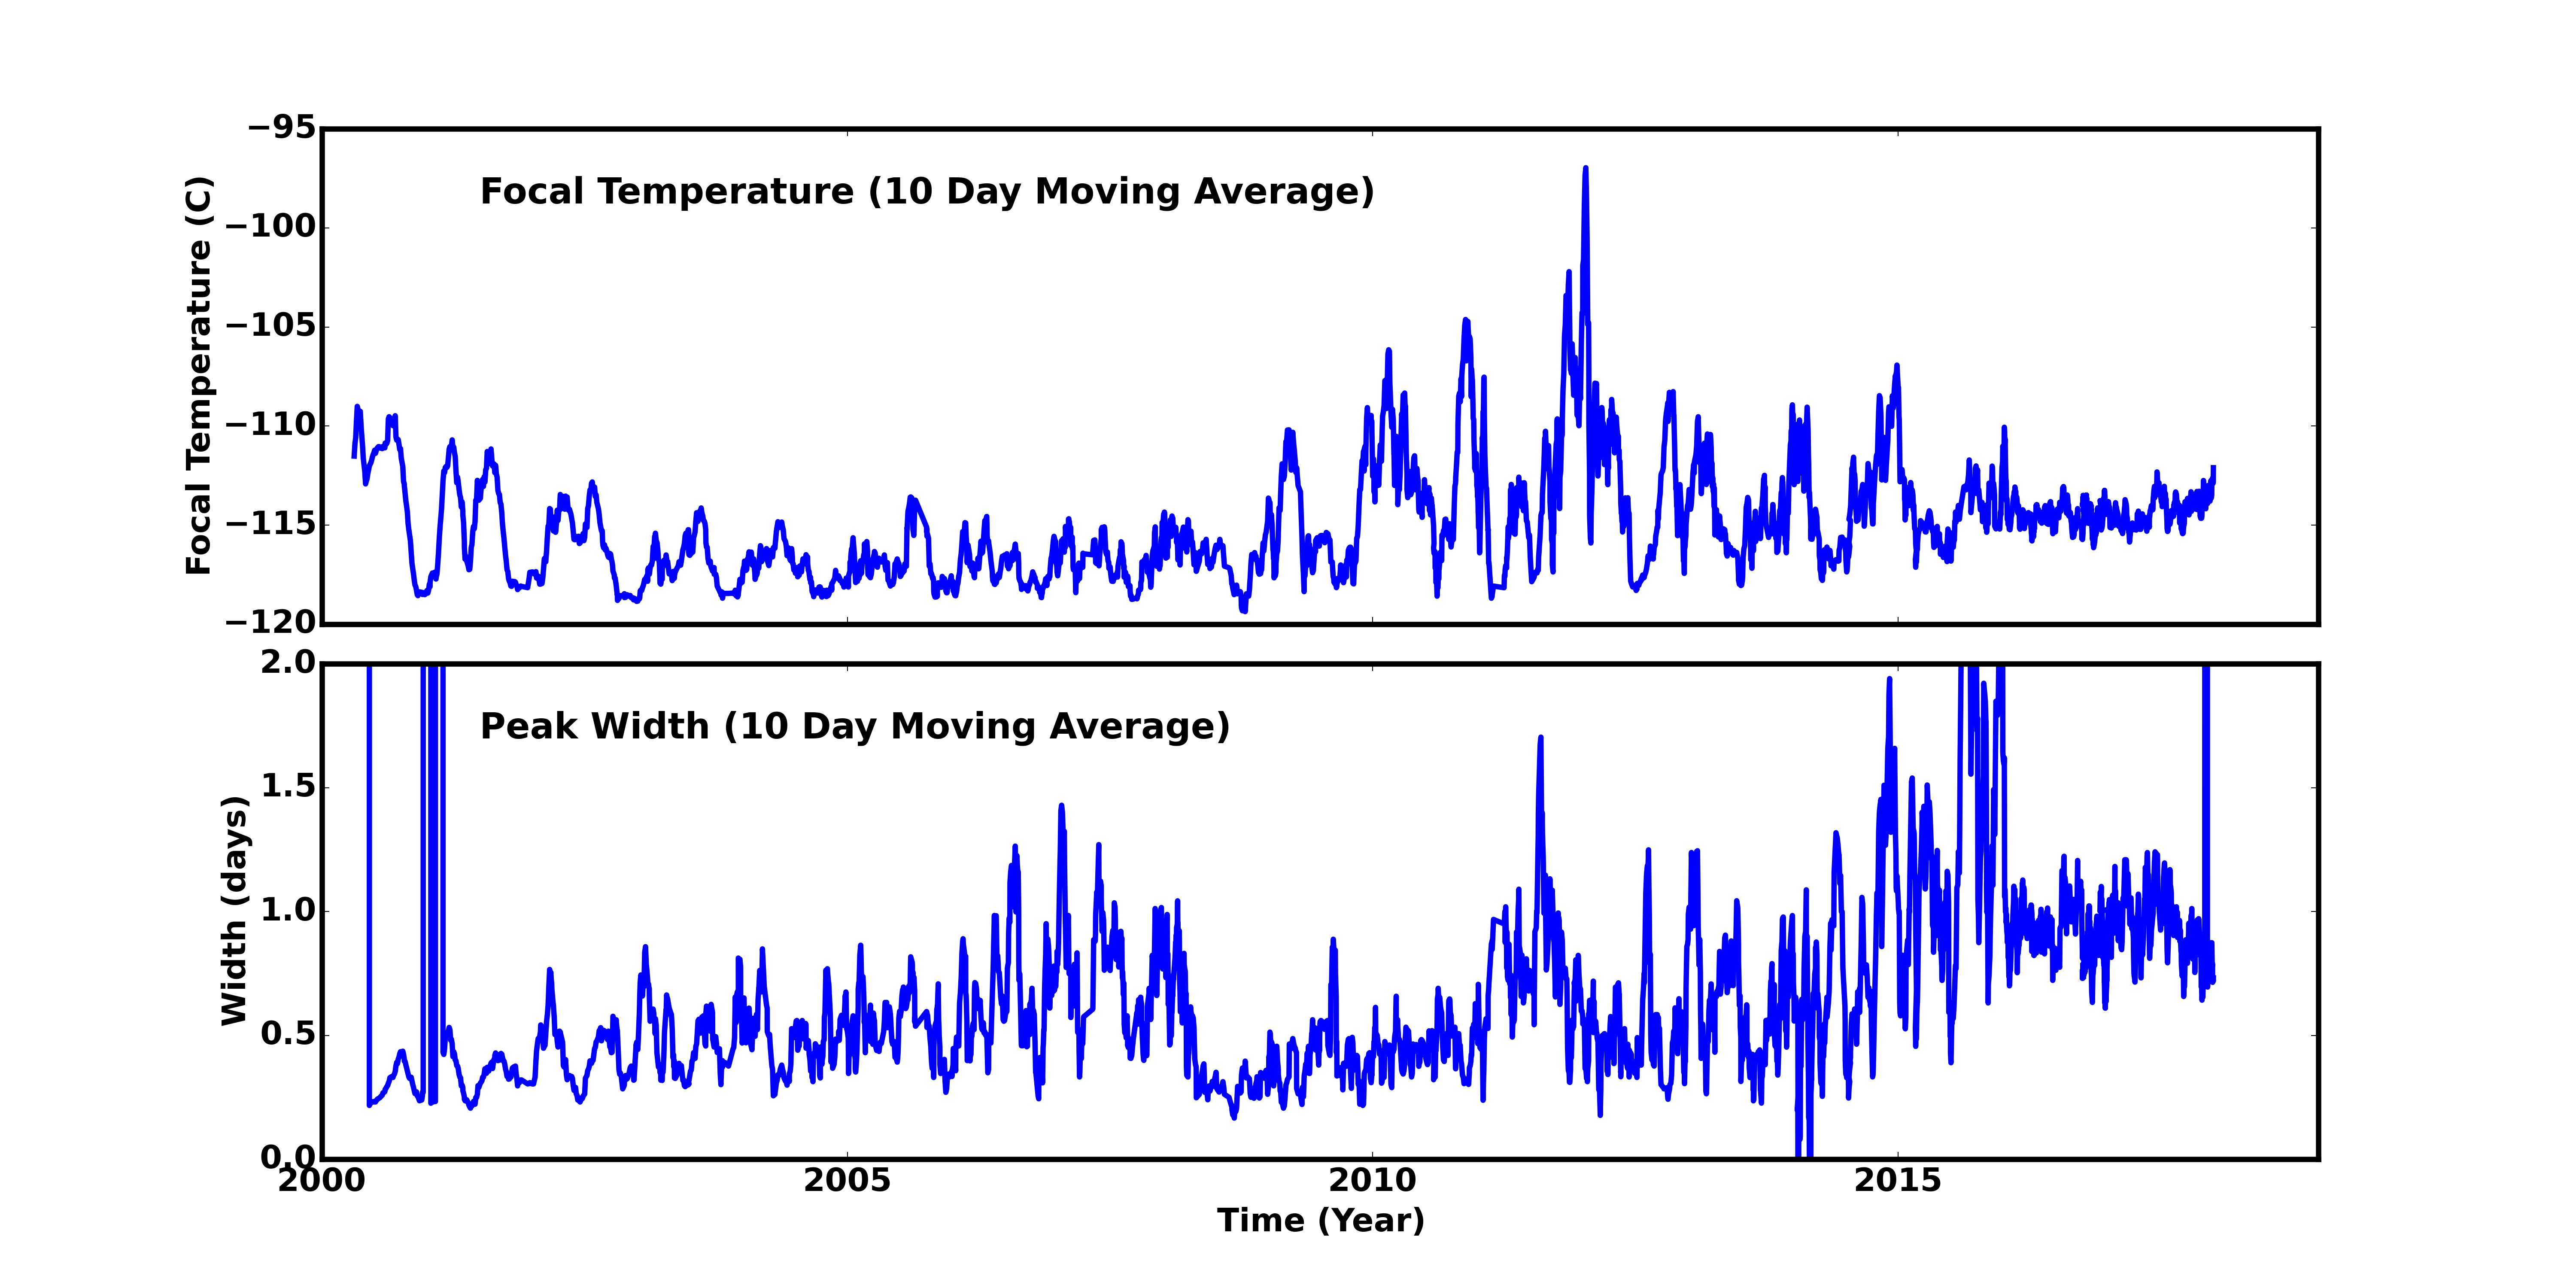
Focal Plane Temperature
Dec 2017 Focal Temperature
| The Mean (max) FPT: | |
|---|---|
| -112.97 | +/- 2.45 C |
| Mean Width: | |
| 10.6 | +/- 56.54 days |
Averaged Focal Plane Temperature
We are using 10 period moving averages to show trends of peak temperatures and peak widths. Note, the gaps in the width plot are due to missing/corrupted data.
Focal Plane Temperature, Sun Angle and Altitude
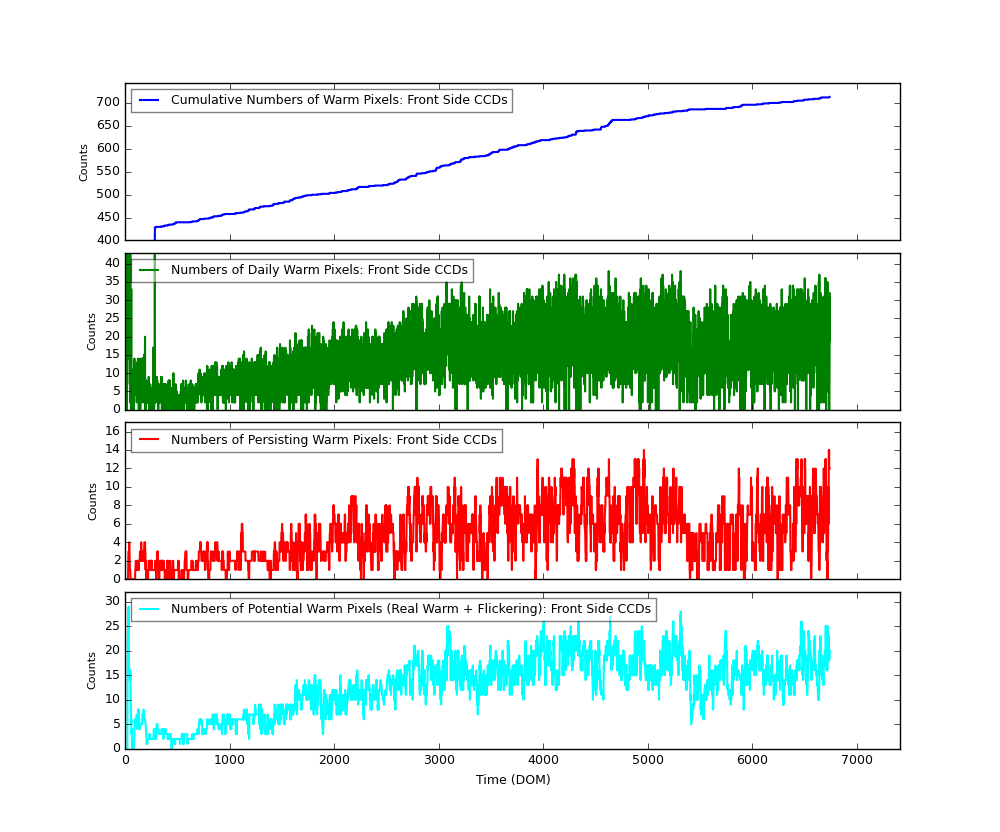
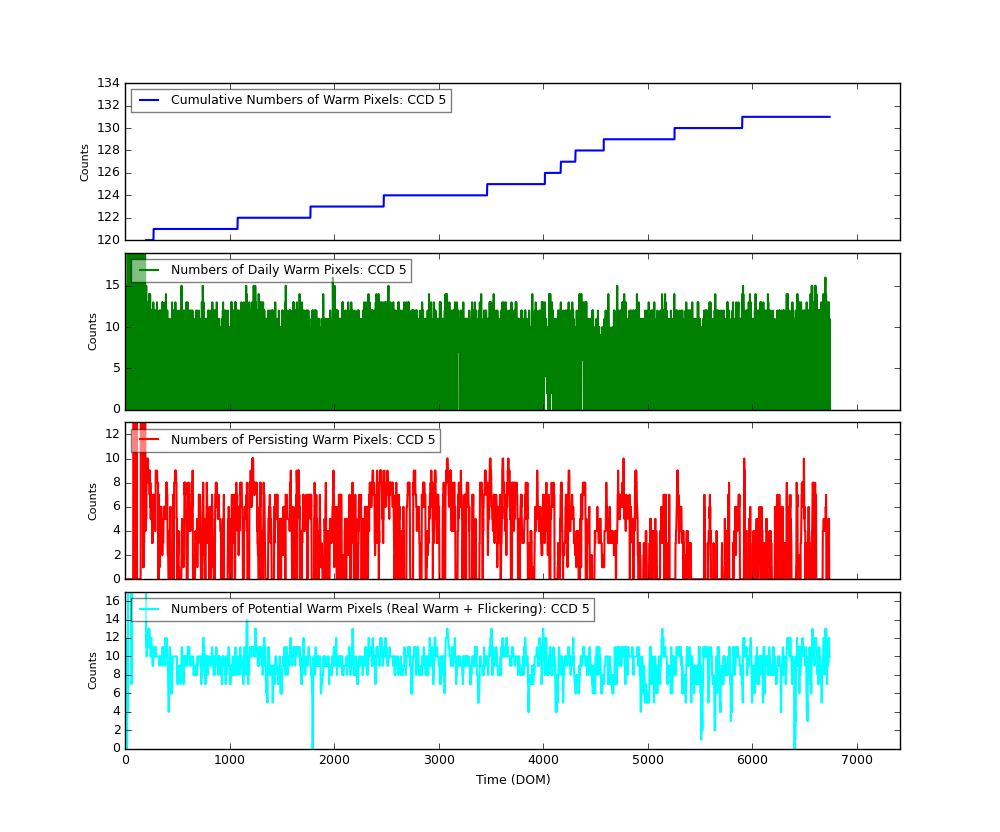
Bad Pixels
The plots below were generated with a new warm pixel finding script. Please see Acis Bad Pixel Page for details.
Front Side CCDs
Back Side CCD (CCD5)
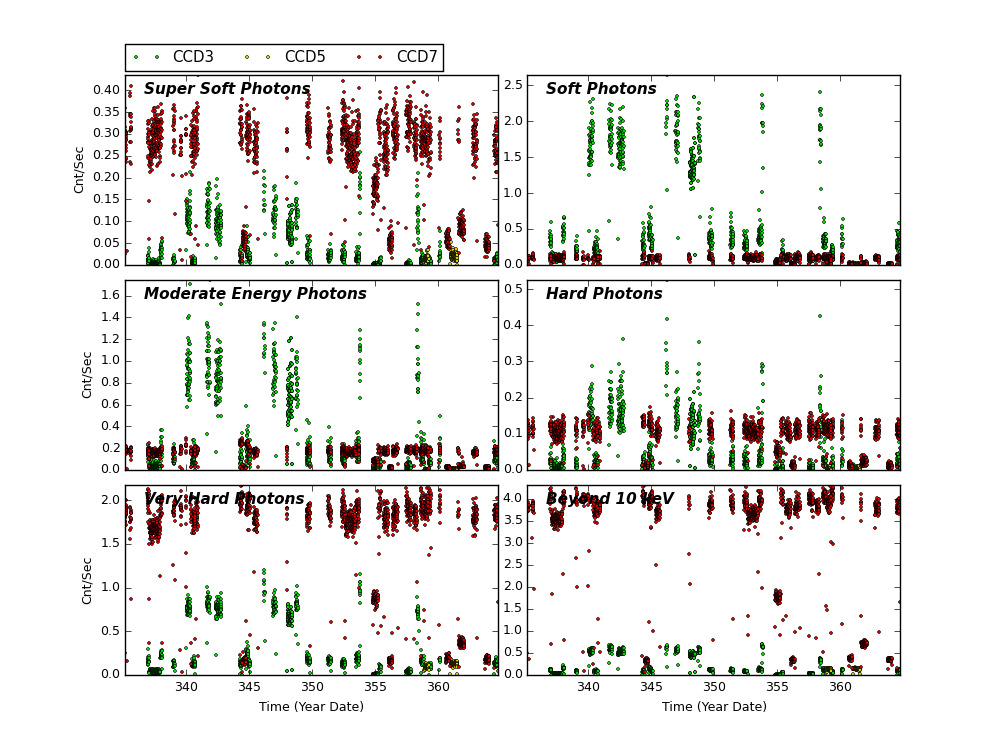
Science Instrument Background Rates
| Name | Low (keV) | High(KeV) | Description |
|---|---|---|---|
| SSoft | 0.00 | 0.50 | Super soft photons |
| Soft | 0.50 | 1.00 | Soft photons |
| Med | 1.00 | 3.00 | Moderate energy photons |
| Hard | 3.00 | 5.00 | Hard Photons |
| Harder | 5.00 | 10.00 | Very Hard photons |
| Hardest | 10.00 | Beyond 10 keV |

HRC
DOSE of Central 4K Pore-Pairs
Please refer to Maximum Dose Trends for more details.
No Data
)
IMAGE                       NPIX      MEAN    STDDEV      MIN       MAX
HRCI_08_1999_12_2017.fits  16777216	5.083 	5.280 	0.000 	293.000
)
|
|---|
IMAGE                NPIX      MEAN    STDDEV      MIN       MAX
HRCS_12_2017.fits  16777216	0.158 	0.459 	0.000 	8.000
)
IMAGE                       NPIX      MEAN    STDDEV      MIN       MAX
HRCS_08_1999_12_2017.fits  16777216	16.837 	30.003 	0.000 	1715.000

|
|
Max dose trend plots corrected for events that "pile-up"
in the center of the taps due to bad position information.
|
)
|
)
|
)
|
)
|
| Sep 2017 | Jun 2017 | Mar 2017 | Dec 2016 |
|---|
)
|
)
|
)
|
)
|
| Sep 2017 | Jun 2017 | Mar 2017 | Dec 2016 |
|---|
Gratings
Focus
We plot the width of the zero order streak of ACIS/HETG observations and the width of the zero order image for HRC/LETG observations of point sources. No significant defocusing trend is seen at this time. See Gratings Focus pages.
PCAD
ACA Trending
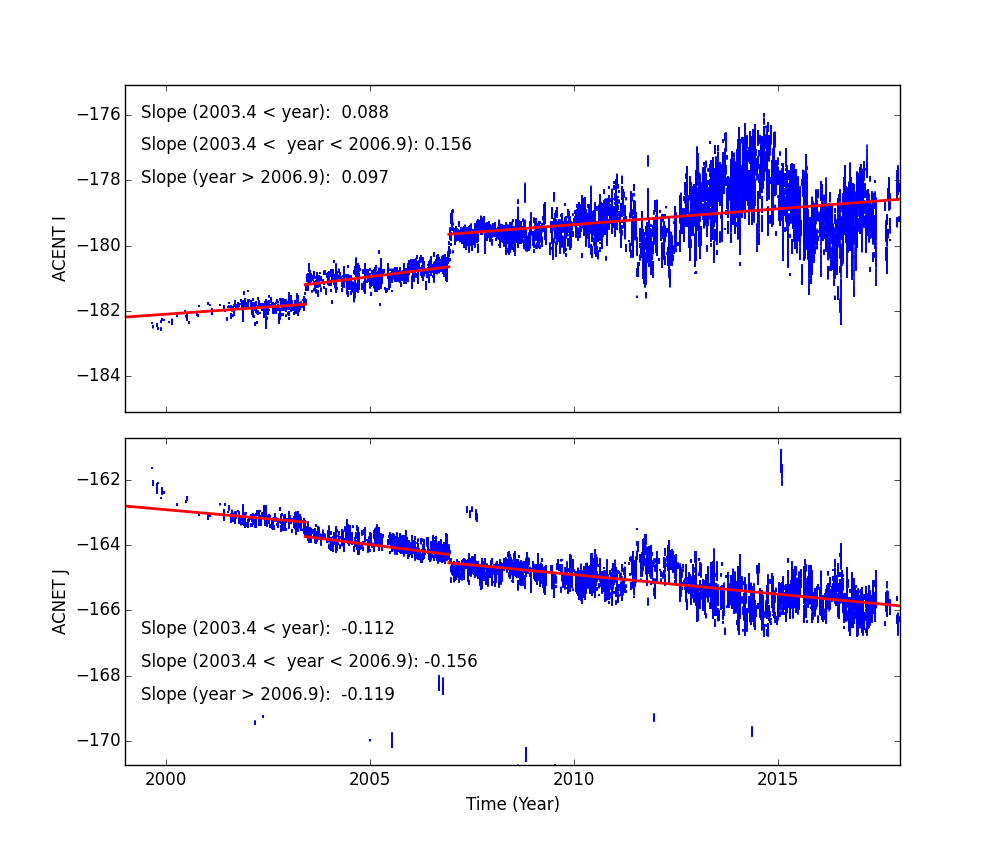
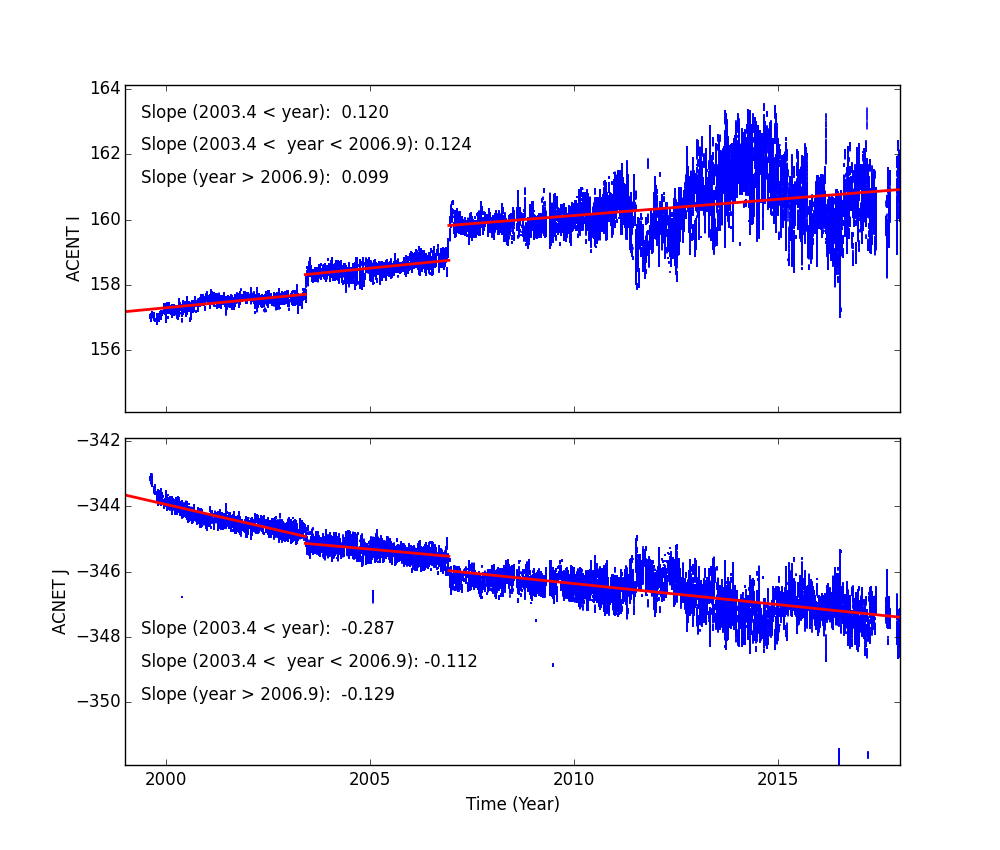
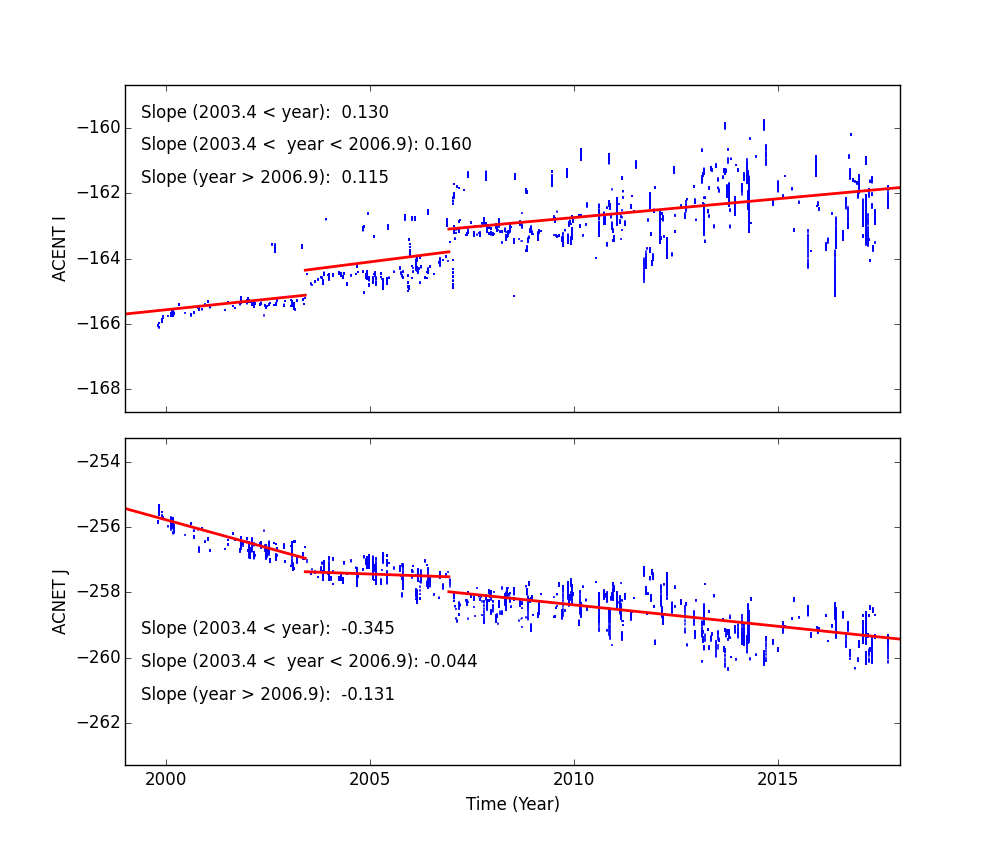
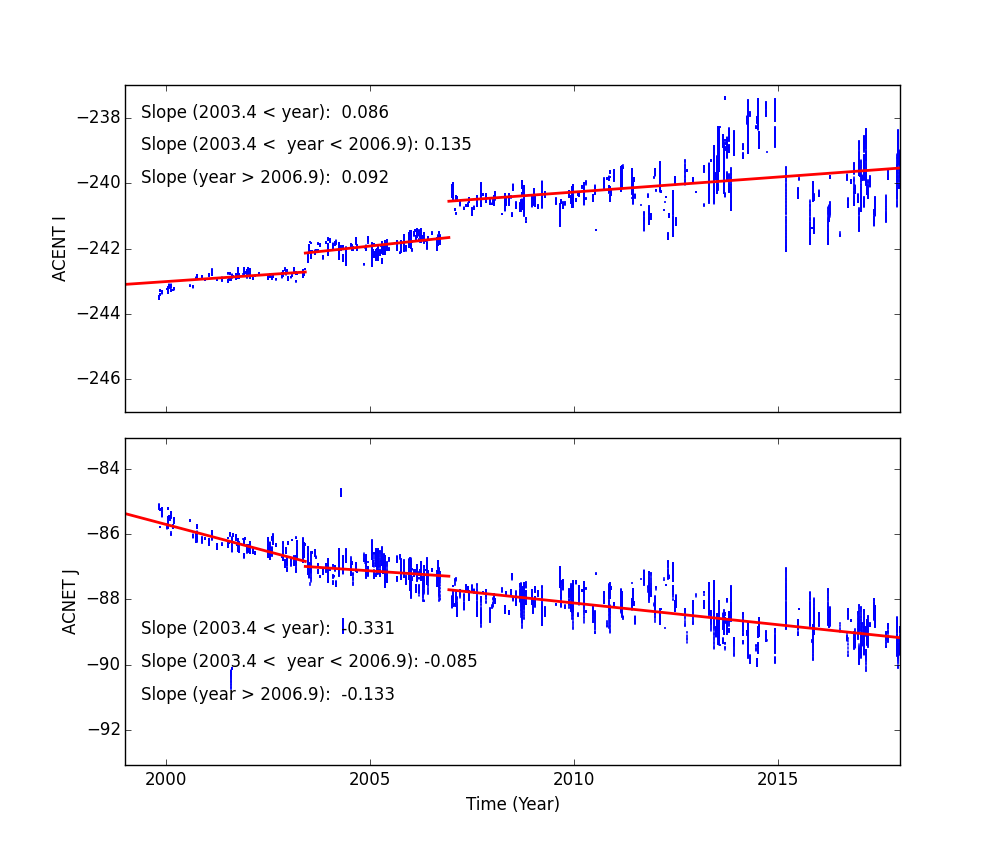
Fid Light Drift
Fid light positions on ACA drift with time. The drift trends of Fid light 2 with ACIS-I and ACIS-S configurations are shown below.
The top panel shows Fid light 2 drift in ACENT I (app. along with -Y axis), and the
bottom panel shows that in ACENT J (app. along with Z axis). The unit is a pixel, and
one pixel is approximately 0.5 arcsec. The slope listed at the top right corner is
the change in a position per year (arcsec/yr). The vertical line on DOM = 1411 (Jun 1, 2003)
indicates a transition date of use of IRU-1 to IRU-2.
See also Tom Aldcroft's updated page:
https://cxc.cfa.harvard.edu/mta/ASPECT/fid_drift
Fid 2 (ACIS-I)
Fid 2 (ACIS-S)
Fid 8 (HRC-I)
Fid 12 (HRC-S)
Gyro Bias Drift
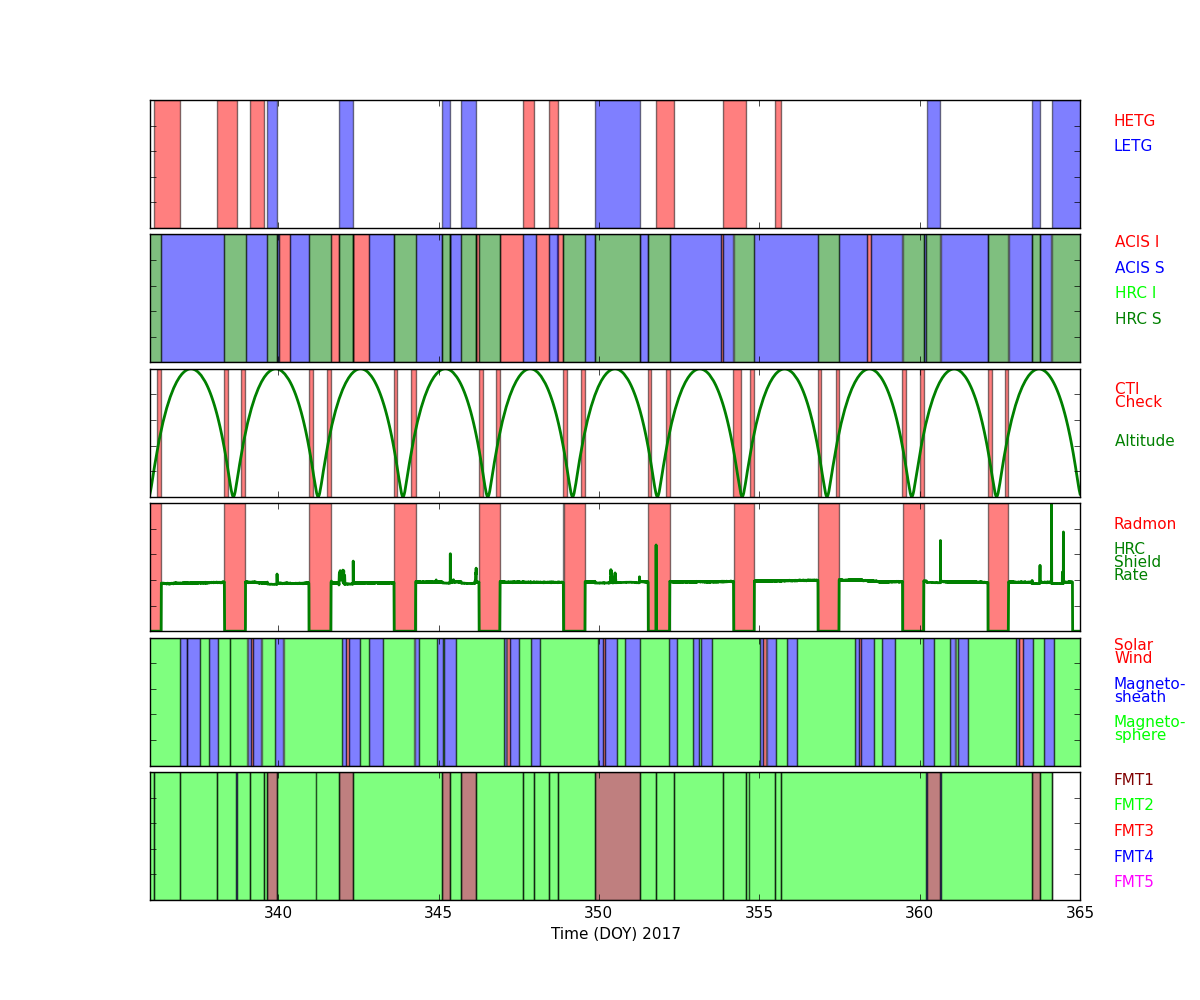
Radiation History
Radiation Zone Timing
Plotted below are radiation zone timing plots based on the following definitions of radiation zone:
- RADZONE - Ephin levels (in any of the E1300,P4GM,P41GM channels) are more than 1/3 of RADMON safing thresholds.
- RADMON - Radmon is disabled for radiation zone (as commanded based on OFLS model, for comparison with actual radiation levels).
- PERIGEE - Time of closest earth approach (for comparison)

Radiation Count Rates of Dec 2017
Sun Spot History
Trending
Critical Trends
| ACIS Temperatures - Daily Maximums | ||||||
|---|---|---|---|---|---|---|
| MSID | MEAN | RMS | DELTA/YR | DELTA/YR/YR | UNITS | DESCRIPTION |
| 1PDEAAT | 305.68 | 7.77 | 2.014e+00 | -1.684e+01 | K | PSMC DEA PS A TEMP |
| 1PIN1AT | 323.56 | 19.37 | 1.754e+01 | -7.892e+01 | K | PSMC TEMP 1A |
)
)
| HRMA Computed Averages - Daily Maximums | ||||||
|---|---|---|---|---|---|---|
| MSID | MEAN | RMS | DELTA/YR | DELTA/YR/YR | UNITS | DESCRIPTION |
| OBAAVG | 289.65 | 5.31 | 1.038e+00 | 1.264e-01 | TEMP | OBA/TFTE |
)
| EPHIN Temperatures - Daily Maximums | ||||||
|---|---|---|---|---|---|---|
| MSID | MEAN | RMS | DELTA/YR | DELTA/YR/YR | UNITS | DESCRIPTION |
| TEIO | 336.06 | 19.00 | 2.643e-01 | -3.445e+01 | K | EPHIN ELECTRONICS HOUSING TEMP |
| TEPHIN | 337.51 | 6.37 | 1.428e+00 | 1.064e+01 | K | EPHIN SENSOR HOUSING TEMP |
)
)
| S/C Main Temperatures - Daily Maximums | ||||||
|---|---|---|---|---|---|---|
| MSID | MEAN | RMS | DELTA/YR | DELTA/YR/YR | UNITS | DESCRIPTION |
| TCYLFMZM | 311.68 | 21.12 | 5.257e+00 | 2.907e+01 | K | CNT CYL TEMP:-Z SIDE UNDER LAE-1 |
| TCYLFMZP | 312.95 | 19.61 | 4.796e+00 | 2.535e+01 | K | CNT CYL TEMP:-Z SIDE UNDER LAE-2 |
)
)
| S/C Ancillary Temperatures - Daily Maximums | ||||||
|---|---|---|---|---|---|---|
| MSID | MEAN | RMS | DELTA/YR | DELTA/YR/YR | UNITS | DESCRIPTION |
| TFSSBKT1 | 345.48 | 20.26 | 2.877e-01 | 3.306e+01 | K | FSS BRACKET-1 TEMP (+Y) |
| TFSSBKT2 | 341.25 | 26.96 | -3.564e-01 | 4.607e+01 | K | FSS BRACKET-2 TEMP (+Y) |
| TSCTSF1 | 309.26 | 4.52 | 4.653e+00 | 3.426e+00 | K | SC-TS FITTING -1 TEMP |
| TSCTSF6 | 310.72 | 4.60 | 3.715e+00 | 6.634e+00 | K | SC-TS FITTING -6 TEMP |
)
)
)
)
| MUPS - Daily Maximums | ||||||
|---|---|---|---|---|---|---|
| MSID | MEAN | RMS | DELTA/YR | DELTA/YR/YR | UNITS | DESCRIPTION |
| PM1THV1T | 333.47 | 8.23 | -2.762e-01 | -1.892e+02 | K | MUPS 1 THRUSTER VALVE 01 TEMP |
| PLINE02T | 317.64 | 11.13 | 3.347e+00 | 5.826e+00 | K | PROP LINE TEMP 02 |
| PLINE03T | 316.64 | 13.64 | 3.278e+00 | 7.846e+00 | K | PROP LINE TEMP 03 |
| PLINE04T | 302.24 | 12.73 | 3.233e+00 | 7.055e+00 | K | PROP LINE TEMP 04 |
)
)
)
)
Quarterly Trends
- HRMA Struts
| Previous Quarter | ||||||
| MSID | MEAN | RMS | DELTA/YR | DELTA/YR/YR | UNITS | DESCRIPTION |
| 4RT584T | 297.91 | 0.80 | 3.972e+00 | -3.078e+01 | K | RT 584 - STRUT TEMP |
| 4RT585T | 298.12 | 0.79 | 4.574e+00 | -3.447e+01 | K | RT 585 - STRUT TEMP |
| 4RT586T | 294.70 | 0.64 | 4.013e+00 | -2.206e+01 | K | RT 586 - STRUT TEMP |
| 4RT587T | 289.54 | 0.44 | 2.598e+00 | -7.996e+00 | K | RT 587 - STRUT TEMP |
| 4RT597T | 303.25 | 1.99 | 7.207e+00 | -6.106e+01 | K | RT 597 - TFTE TEMP |
| 4RT598T | 302.43 | 1.91 | 7.466e+00 | -5.832e+01 | K | RT 598 - TFTE TEMP |
)
)
)
)
)
)
- OB Forward Bulkhead
| Previous Quarter | ||||||
| MSID | MEAN | RMS | DELTA/YR | DELTA/YR/YR | UNITS | DESCRIPTION |
| 4RT705T | 289.34 | 0.85 | 3.683e+00 | -2.448e+01 | K | RT 705 - OB BULKHEAD TEMP |
| 4RT706T | 287.88 | 0.87 | 3.899e+00 | -1.486e+01 | K | RT 706 - OB BULKHEAD TEMP |
| 4RT707T | 290.50 | 0.88 | 4.288e+00 | -1.554e+01 | K | RT 707 - OB BULKHEAD TEMP |
| 4RT708T | 295.15 | 1.00 | 4.974e+00 | -2.252e+01 | K | RT 708 - OB BULKHEAD TEMP |
| 4RT709T | 296.38 | 1.08 | 5.244e+00 | -2.702e+01 | K | RT 709 - OB BULKHEAD TEMP |
| 4RT710T | 297.78 | 1.17 | 5.513e+00 | -2.995e+01 | K | RT 710 - OB BULKHEAD TEMP |
)
)
)
)
)
)
- HRMA Thermal
| Previous Quarter | ||||||
| MSID | MEAN | RMS | DELTA/YR | DELTA/YR/YR | UNITS | DESCRIPTION |
| 4RT568T | 295.77 | 0.96 | 4.388e+00 | -1.708e+00 | K | RT 568 - HRMA TEMP |
| 4RT569T | 295.00 | 0.26 | 1.780e+00 | -6.615e+00 | K | RT 569 - HRMA TEMP |
| 4RT570T | 294.77 | 0.14 | 1.012e+00 | 1.258e+00 | K | RT 570 - HRMA TEMP |
| 4RT575T | 299.79 | 1.33 | 5.557e+00 | -3.275e+01 | K | RT 575 - OB CONE TEMP |
| 4RT576T | 291.75 | 0.94 | 3.908e+00 | -3.215e+01 | K | RT 576 - OB CONE TEMP |
| 4RT578T | 298.35 | 1.93 | 5.119e+00 | -8.891e+00 | K | RT 578 - OB CONE TEMP |
)
)
)
)
)
)
Envelope Trending
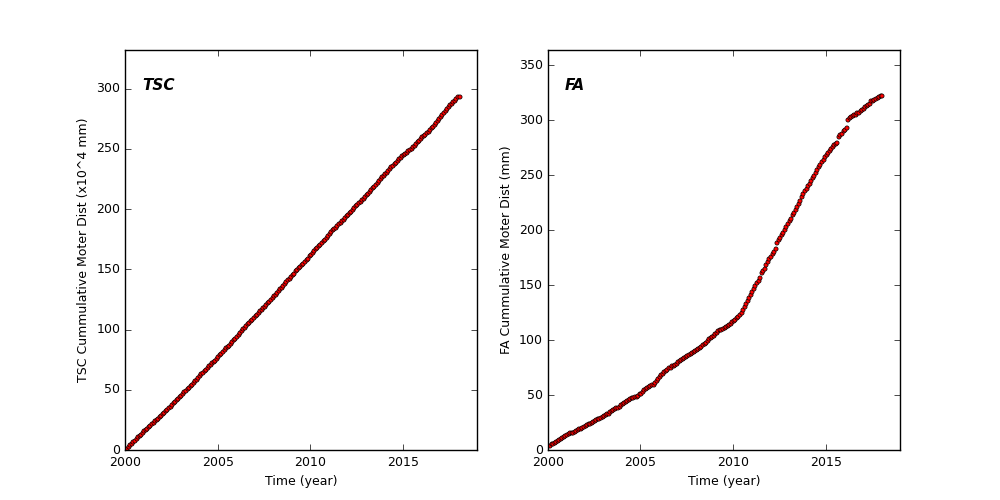
Spacecraft Motions
TSC and FA Cummulative Moter Distance
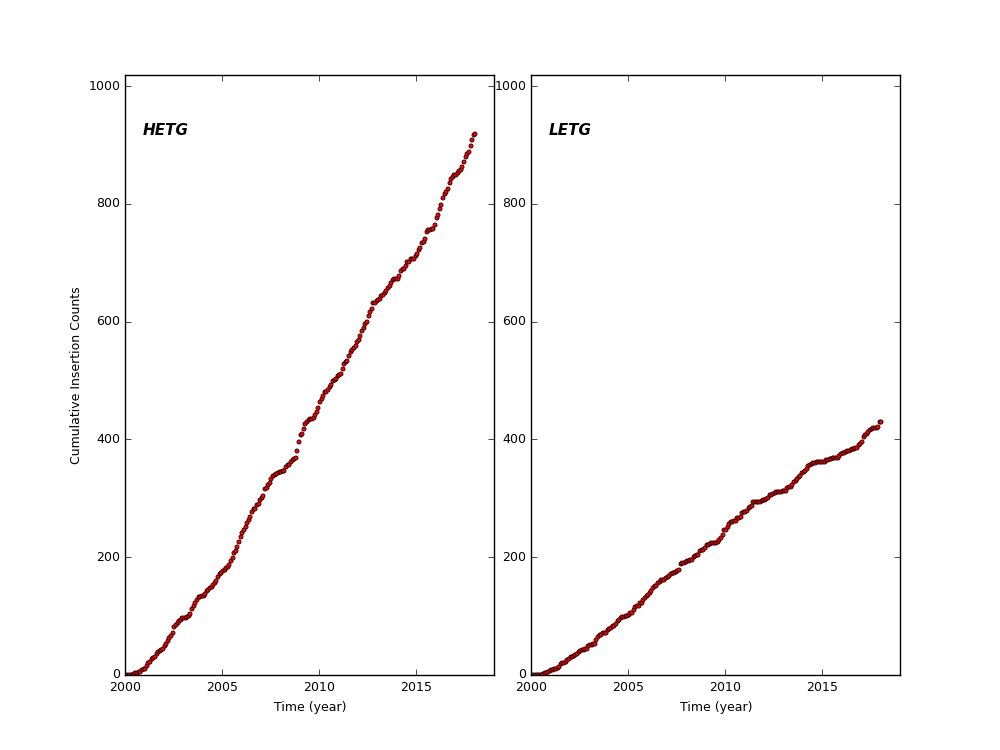
HETG and LETG Cummulative Insertion Counts
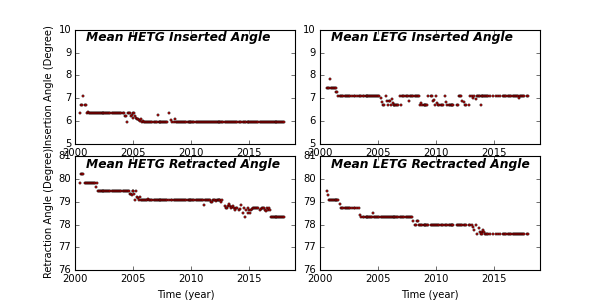
HETG/LETG Insertion/Retraction Angle
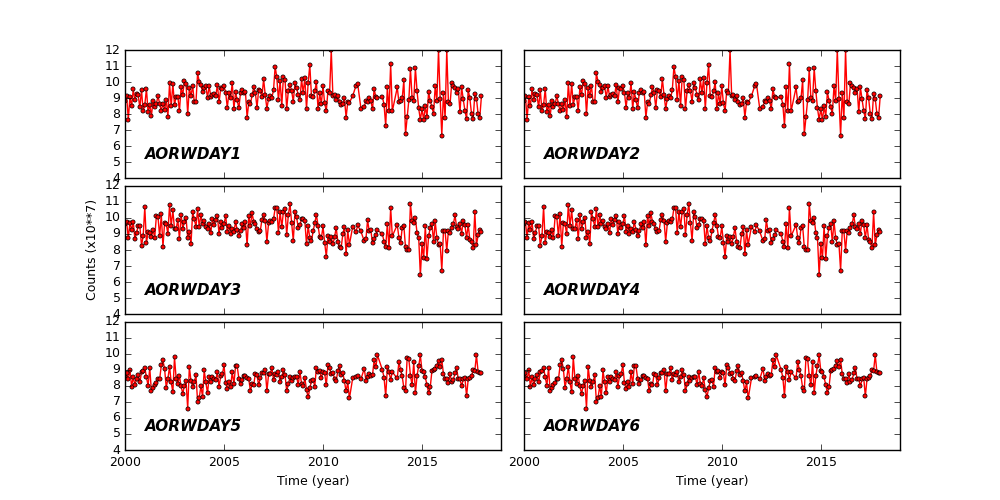
Reaction Wheel Rotations
Links to Past Monthly Reports
| Year | Month | |||||||||||
|---|---|---|---|---|---|---|---|---|---|---|---|---|
| 2017 | Jan | Feb | Mar | Apr | May | Jun | Jul | Aug | Sep | Oct | Nov | |
| 2016 | Jan | Feb | Mar | Apr | May | Jun | Jul | Aug | Sep | Oct | Nov | Dec |
| 2015 | Jan | Feb | Mar | Apr | May | Jun | Jul | Aug | Sep | Oct | Nov | Dec |
| 2014 | Jan | Feb | Mar | Apr | May | Jun | Jul | Aug | Sep | Oct | Nov | Dec |
| 2013 | Jan | Feb | Mar | Apr | May | Jun | Jul | Aug | Sep | Oct | Nov | Dec |
| 2012 | Jan | Feb | Mar | Apr | May | Jun | Jul | Aug | Sep | Oct | Nov | Dec |
| 2011 | Jan | Feb | Mar | Apr | May | Jun | Jul | Aug | Sep | Oct | Nov | Dec |
| 2010 | Jan | Feb | Mar | Apr | May | Jun | Jul | Aug | Sep | Oct | Nov | Dec |
| 2009 | Jan | Feb | Mar | Apr | May | Jun | Jul | Aug | Sep | Oct | Nov | Dec |
| 2008 | Jan | Feb | Mar | Apr | May | Jun | Jul | Aug | Sep | Oct | Nov | Dec |
| 2007 | Jan | Feb | Mar | Apr | May | Jun | Jul | Aug | Sep | Oct | Nov | Dec |
| 2006 | Jan | Feb | Mar | Apr | May | Jun | Jul | Aug | Sep | Oct | Nov | Dec |
| 2005 | Jan | Feb | Mar | Apr | May | Jun | Jul | Aug | Sep | Oct | Nov | Dec |
| 2004 | Jan | Feb | Mar | Apr | May | Jun | Jul | Aug | Sep | Oct | Nov | Dec |
| 2003 | Jan | Feb | Mar | Apr | May | Jun | Jul | Aug | Sep | Oct | Nov | Dec |
| 2002 | Jan | Feb | Mar | Apr | May | Jun | Jul | Aug | Sep | Oct | Nov | Dec |
| 2001 | Jan | Feb | Mar | Apr | May | Jun | Jul | Aug | Sep | Oct | Nov | Dec |
| 2000 | Jan | Feb | Mar | Apr | May | Jun | Jul | Aug | Sep | Oct | Nov | Dec |
| 1999 | Jul | Aug | Sep | Oct | Nov | Dec | ||||||